interim report for q3 2014/15
TRANSCRIPT

Ambu
Company announcement no. 14 2014/15 19 August 2015 Page 1
Interim report for Q3 2014/15 Ambu maintains its momentum, posting revenue of DKK 482m and
organic growth of 9% in local currencies, and 21% in Danish kroner.
The outlook for the year is adjusted.
"Ambu has recorded growth in local currencies of 9% in each of the first three quarters of the year. Growth is driven, in
particular, by our Anaesthesia business, which grew by 16% in Q3, significantly exceeding market growth. Ambu keeps
strengthening its position in the hospital segment with one of the most complete product portfolios in the market for single-
use products. In Q3, sales of aScope passed an important milestone, with accumulated sales in the current financial year
in excess of DKK 100m. In the PMD segment, we realised 5% growth in Q3, which is also somewhat higher than market
growth. We are positive about the future and believe that we can further strengthen Ambu’s global position as a strong,
innovative and competitive supplier of single-use products for hospitals. It is therefore a natural step that we make an
upward adjustment of our growth outlook for the second time this year," says President and CEO Lars Marcher.
• Revenue of DKK 482m was posted in Q3, representing growth of 9% in local currencies, and 21% in Danish kroner.
• Growth in Q3 was driven, in particular, by the Anaesthesia segment, which recorded 16%, and by the PMD (Patient
Monitoring & Diagnostics) business, which realised 5% growth. The development in Emergency Care was as ex-
pected, with negative growth of 8% being reported in Q3. All growth is reported in local currencies.
• Gross profit for the quarter was DKK 232m (DKK 205m), and the gross margin came to 48.1% (51.6%). Year to date,
the gross margin is 47.7% (50.3%). The gross margin is negatively impacted by the effect of the strengthened USD
exchange rate.
• Capacity costs totalled DKK 176m (DKK 150m) and were significantly affected by the stronger USD exchange rate as
well as higher selling costs. The rate of cost for the quarter was 37% (38%), and 39% (40%) for the year to date.
• EBIT for the quarter was DKK 56m (DKK 55m), and an EBIT margin of 11.6% (13.9%) was posted. Year to date, EBIT
totals DKK 119m (DKK 118m), with an EBIT margin of 8.8% (10.3%).
• Free cash flows before company acquisitions totalled DKK 34m (DKK 28m) for the quarter, and were negative at DKK
12m (DKK 57m) for the year to date. Cash flows are materially affected by increased investments, including the new
factory in Malaysia, as well as by funds tied up in working capital.
• Sales of aScope are continuing to develop extremely positively, with revenue for the first three quarters exceeding
DKK 100m. In terms of volume, sales of aScope in Q3 as well as year to date more than doubled compared with the
same period last year.

Ambu
Company announcement no. 14 2014/15 19 August 2015 Page 2
• Ambu collaborates with a global medtech company on the development of a new product based on Ambu’s aScope
technology. The product is in the final stages of development, and is expected to be launched before the end of the
calendar year 2015.
• In North America, growth of 5% was posted for the quarter when reported in local currencies, and of 27% in Danish
kroner. The Anaesthesia business, including aScope, had a good quarter in the USA, and PMD also developed posi-
tively. Emergency Care posted lower revenue than expected and contributed to reducing the overall growth in North
America.
• In Europe, growth for the quarter was 10% in local currencies and 14% in Danish kroner, positively affected by con-
sistently strong growth in sales of aScope as well as other Anaesthesia product areas. The PMD segment – both
neurophysiology and cardiology – also realised healthy growth rates once again.
• Growth for the rest of the world segment stood at 21% in local currencies, and 27% in Danish kroner, driven by a
continued, very solid development in the Asian markets, which saw 27% growth. The markets in Latin America con-
tributed double-digit growth rates in Q3.
• The outlook for FY 2014/15 is adjusted compared to the outlook announced in the interim report for Q2 2014/15. Now,
growth in local currencies of approx. 9% is expected as opposed to 8-8.5%. The outlook for the EBIT margin is un-
changed at approx. 12%, resulting in an upward adjustment of EBIT in Danish kroner. Free cash flows before earn-
out payment of approx. DKK 100m are now expected as opposed to approx. DKK 110-120m. A gearing of approx. 2.2
is still expected.
A conference call is being held today, 19 August 2015, at 11.00 am (CET). To participate, please call the following number
five minutes before the start of the conference: +45 3544 5579. The conference can be followed via
www.ambu.com/webcastQ32015 and is held in English. The presentation can be downloaded when the conference begins.
Contact
Lars Marcher, President & CEO, tel. +45 5136 2490, email: [email protected]
Ambu A/S
Baltorpbakken 13
DK-2750 Ballerup
Tel. +45 7225 2000
CVR no.: 63 64 49 19
www.ambu.com
About Ambu
Since 1937, breakthrough ideas have driven our work to bring efficient healthcare solutions to life within our fields of excellence: Anaesthesia, Patient Moni-
toring & Diagnostics and Emergency Care. Millions of patients and healthcare professionals worldwide depend and rely on the functionality and perfor-
mance of our products. We are dedicated to improving patient safety and determined to advance single-use devices. The manifestations of our efforts
range from early inventions like the Ambu bag and the legendary Blue Sensor® electrodes to our latest landmark solutions such as the aScope™ – the
world’s first single-use videoscope. Our commitment to bringing new ideas and superior service to our customers has made Ambu one of the most recog-
nised medico-technical companies in the world. Our head office is situated in Ballerup near Copenhagen. Ambu has more than 2,350 employees in Europe,
North America, Asia and the Pacific region. You can find more information about Ambu on our website: www.ambu.com.
Ambu
Company announcement no. 14 2014/15 19 August 2015 Page 3
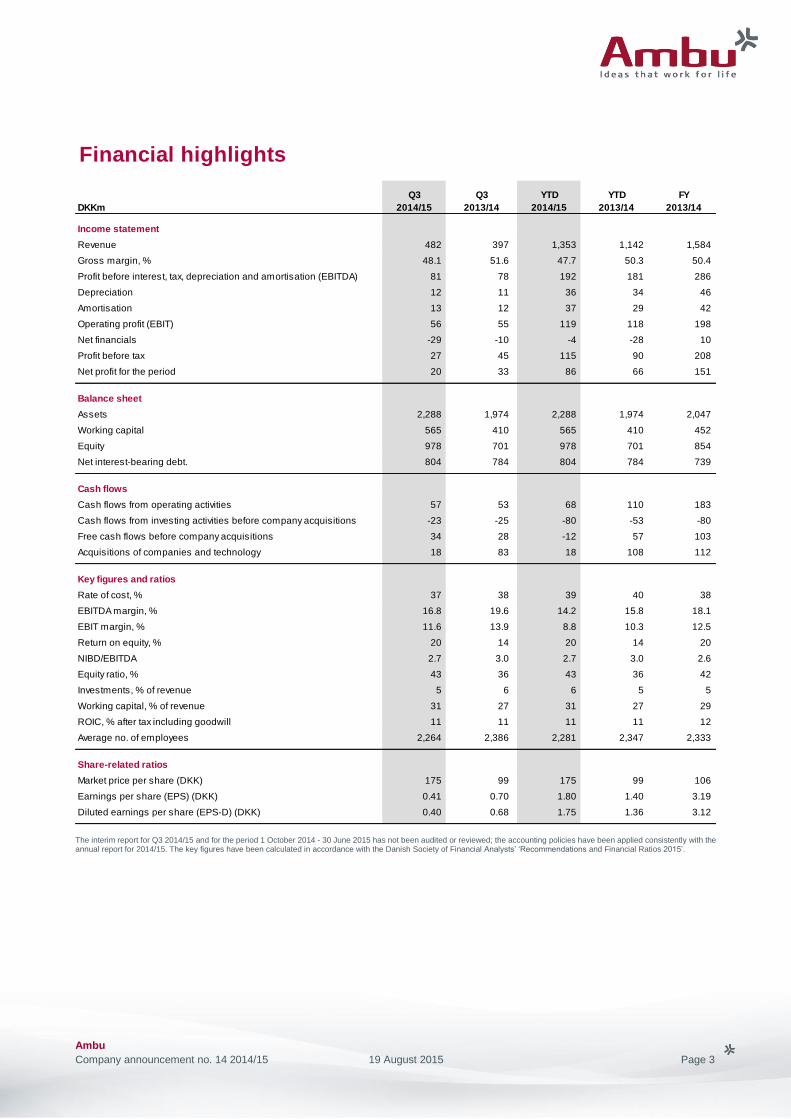
The interim report for Q3 2014/15 and for the period 1 October 2014 - 30 June 2015 has not been audited or reviewed; the accounting policies have been applied consistently with the annual report for 2014/15. The key figures have been calculated in accordance with the Danish Society of Financial Analysts’ ‘Recommendations and Financial Ratios 2015’.
Financial highlights
DKKm
Q3
2014/15
Q3
2013/14
YTD
2014/15
YTD
2013/14
FY
2013/14
Income statement
Revenue 482 397 1,353 1,142 1,584
Gross margin, % 48.1 51.6 47.7 50.3 50.4
Profit before interest, tax, depreciation and amortisation (EBITDA) 81 78 192 181 286
Depreciation 12 11 36 34 46
Amortisation 13 12 37 29 42
Operating profit (EBIT) 56 55 119 118 198
Net financials -29 -10 -4 -28 10
Profit before tax 27 45 115 90 208
Net profit for the period 20 33 86 66 151
Balance sheet
Assets 2,288 1,974 2,288 1,974 2,047
Working capital 565 410 565 410 452
Equity 978 701 978 701 854
Net interest-bearing debt. 804 784 804 784 739
Cash flows
Cash flows from operating activities 57 53 68 110 183
Cash flows from investing activities before company acquisitions -23 -25 -80 -53 -80
Free cash flows before company acquisitions 34 28 -12 57 103
Acquisitions of companies and technology 18 83 18 108 112
Key figures and ratios
Rate of cost, % 37 38 39 40 38
EBITDA margin, % 16.8 19.6 14.2 15.8 18.1
EBIT margin, % 11.6 13.9 8.8 10.3 12.5
Return on equity, % 20 14 20 14 20
NIBD/EBITDA 2.7 3.0 2.7 3.0 2.6
Equity ratio, % 43 36 43 36 42
Investments, % of revenue 5 6 6 5 5
Working capital, % of revenue 31 27 31 27 29
ROIC, % after tax including goodwill 11 11 11 11 12
Average no. of employees 2,264 2,386 2,281 2,347 2,333
Share-related ratios
Market price per share (DKK) 175 99 175 99 106
Earnings per share (EPS) (DKK) 0.41 0.70 1.80 1.40 3.19
Diluted earnings per share (EPS-D) (DKK) 0.40 0.68 1.75 1.36 3.12

Ambu
Company announcement no. 14 2014/15 19 August 2015 Page 4
Management’s review for Q3 2014/15
PRODUCT AREAS Anaesthesia Sales in the Anaesthesia segment increased by 16% in
Q3 in local currencies, and by 31% in Danish kroner.
The double-digit growth rates are driven, in particular, by
sales of aScope 3, but the ‘Masks’ product area – includ-
ing Ambu’s third-generation laryngeal mask ‘AuraGain’ –
and circuits also contribute positively to the growth. With
the sales of aScope achieved in Q3, accumulated sales
in the current financial year passed the DKK 100m mark,
and the number of units sold has more than doubled
compared with last year.
Anaesthesia accounted for 57% of revenue in Q3 against
53% in the prior-year period.
Patient Monitoring & Diagnostics (PMD) Within PMD, sales increased by 5% in Q3 in local cur-
rencies, and 12% in Danish kroner.
In Q2, the growth in PMD was affected by timing differ-
ences in respect of contracts in a number of sales terri-
tories, but with 5% growth being posted in Q3, driven by
neurophysiology and to some extent cardiology, growth
is now back at the expected level for the PMD area as a
whole.
PMD accounted for 36% of revenue in Q3 against 39%
in the prior-year period.
Emergency Care
Within Emergency Care, sales declined by 8% in Q3 in
local currencies, but calculated in Danish kroner, reve-
nue was unchanged relative to last year. The area is gen-
erally under pressure and is also affected by project
sales, resulting in fluctuations in revenue.
Emergency Care accounted for 7% of revenue in Q3
against 8% in the prior-year period.
Breakdown of revenue on product areas
57%36%
7%Anaesthesia
Patient Monitoring &Diagnostics
Emergency Care
Q3 Composition of growth YTD Composition of growth
2014/15 2013/14 Organic* Currency Reported 2014/15 2013/14 Organic* Currency Reported
Anaesthesia 276 210 16% 15% 31% 784 604 17% 13% 30%
PMD 174 155 5% 7% 12% 476 443 3% 4% 7%
Emergency Care 32 32 -8% 8% 0% 93 95 -8% 6% -2%
Revenue 482 397 9% 12% 21% 1,353 1,142 9% 9% 18%
*Local currencies

Ambu
Company announcement no. 14 2014/15 19 August 2015 Page 5
FINANCIAL RESULTS (Comparative figures are stated in brackets)
Revenue Revenue of DKK 482m was posted in Q3, representing
growth of 9% in local currencies, and 21% in Danish kro-
ner. Growth was reported by all regions, with continued
strong growth in the North American market. The growth
in revenue is all organic.
Revenue – quarters (DKKm)
Revenue of DKK 1,353m was posted for the year to date,
representing growth of 9% in local currencies, and 18%
in Danish kroner.
Growth of 5% was posted for North America when re-
ported in local currencies, and of 27% in Danish kroner.
Ambu is seeing extremely positive growth in the US mar-
ket, and in spite of the fact that aScope 3 was launched
in the USA 12 months later than in the European mar-
kets, sales in North America now make up close to 30%
of total aScope sales.
In Europe, growth of 10% was posted for the quarter
when reported in local currencies, and of 14% in Danish
kroner. There is a good momentum in the important Eu-
ropean markets, driven by the recently introduced prod-
ucts as well as the traditional Ambu products, including
PMD.
The rest of the world segment consists of three markets:
Asia and Australia, Latin America, and the Middle East.
As a whole, this segment accounted for 12% of Ambu’s
revenue in Q3, posting growth in local currencies of 21%,
and 27% in Danish kroner. The markets in Asia are still
experiencing high growth rates, with growth in Q3 reach-
ing 27%. After problems with regulatory approvals, the
Latin American markets have now stabilised, contrib-
uting double-digit growth rates in Q3. Sales in the Middle
East are characterised by project sales and are un-
changed compared with the same period last year.
Geographical breakdown of revenue
The high growth in the rest of the world segment com-
bined with the stronger USD exchange rate means that
Ambu’s relative business volume in Europe is reduced in
favour of especially North America. While Europe’s rela-
tive share thus declined from 43% in Q3 last year to 41%
in the current quarter, North America’s share increased
correspondingly from 46% to 47%, while the rest of the
world segment increased from 11% to 12%.
The development in sales in North America spells good
opportunities for Ambu going forward, given the strong
product portfolio, the sales organisation and the relations
with GPOs (group purchasing organisations) and other
partners that have been forged in the North American
market.
Currency exposure
Ambu’s revenue was significantly impacted by develop-
ments in USD/DKK, as almost 50% of the company’s
revenue is invoiced in USD. Moreover, EBIT is influ-
enced by developments in the exchange rates for
CNY/DKK and MYR/DKK, as a significant share of
Ambu’s production in the Far East is settled in CNY and
MYR.
In Q3, the USD/DKK exchange rate increased by 24%
relative to Q3 last year, while increases of 25% and 10%
were seen for CNY/DKK and MYR/DKK, respectively.
0
100
200
300
400
500
600
Q1 Q2 Q3 Q4
2013/14
2014/15
41%
47%
12%Europe
North America
Rest of the world
Q3 Composition of growth YTD Composition of growth
2014/15 2013/14 Organic* Currency Reported 2014/15 2013/14 Organic* Currency Reported
Europe 199 174 10% 4% 14% 578 521 9% 2% 11%
North America 226 178 5% 22% 27% 629 501 7% 19% 26%
Rest of the world 57 45 21% 6% 27% 146 120 19% 3% 22%
Revenue 482 397 9% 12% 21% 1,353 1,142 9% 9% 18%
*Local currencies
Ambu
Company announcement no. 14 2014/15 19 August 2015 Page 6
Year to date, the increases in the three above-mentioned
currencies correspond to an increase in revenue of ap-
prox. DKK 100m and a similar increase in production and
capacity costs, the exchange rate effect being almost
neutral on EBIT when calculated in Danish kroner for the
year to date as well as for the quarter. The resulting scal-
ing effect thus dilutes both the gross margin and the EBIT
margin despite the fact that Ambu is increasing nominal
EBIT earnings calculated in Danish kroner.
Gross profit
Gross profit was DKK 232m (DKK 205m), with a gross
margin of 48.1% (51.6%). The gross profit is positively
affected by the scaling effects of the strengthened USD
whereas the gross margin is negatively affected.
Costs
Capacity costs for the quarter totalled DKK 176m (DKK
150m). Any comparisons with the previous quarter
should take account of the effect of the strengthened
USD, MYR and CNY exchange rates relative to DKK, the
effect for the quarter being approx. DKK 15m, resulting
in an increase in the underlying cost base in the order of
6-7%.
The rate of cost for the quarter was 37% (38%), and 39%
(40%) for the first nine months of the year.
Selling costs of DKK 99m (DKK 90m) were posted for
Q3. Compared to the previous quarter, sales costs are
reduced by DKK 5m due to lower stock handling and
freight costs in North America.
Development costs of DKK 14m (DKK 11m) were rec-
orded for Q3, and DKK 41m (DKK 32m) for the first nine
months of the year. The increase is primarily attributable
to increased amortisation in respect of development pro-
jects and rights. The correlation between capitalisation of
costs and the recognition of amortisation in the income
statement is shown in the table below. Year to date,
amortisation of DKK 33m has been expensed, and in-
vestments of DKK 29m have been made, with the actual
activities in the first nine months of the year thus impact-
ing cash flows by DKK 37m.
DKKm YTD
2014/15 2013/14
Development costs 41 32
÷ Amortisation -33 -22
+ Investments 29 18
= Cash flows 37 28
Management and administration costs for the quarter to-
talled DKK 57m (DKK 48m). The cost was reduced by
DKK 6m relative to Q2, among other things as a result of
the restructurings implemented in this area.
Other operating expenses of DKK 6m (DKK 1m) were
reported for Q3. Normally, other operating expenses
come to approx. DKK 1m, and the increase is the result
of impairment of production facilities in the UK, following
the outsourcing of production to a long-standing Indian
partner in Q3.
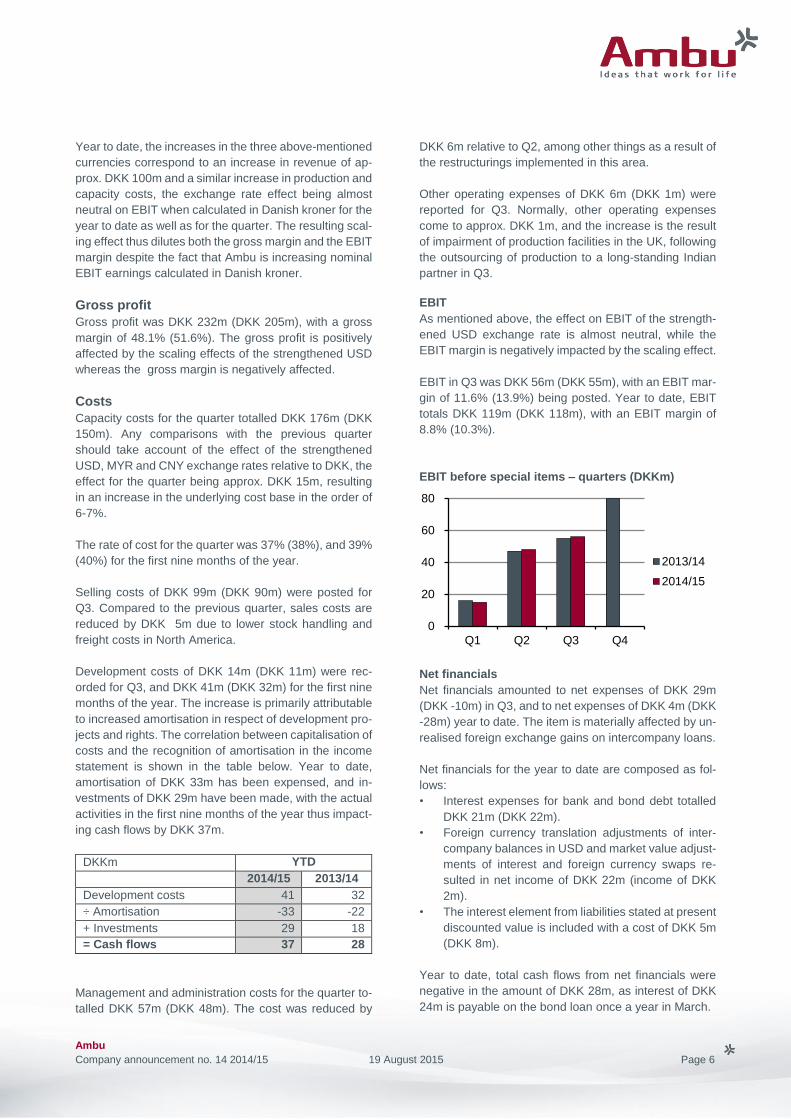
EBIT
As mentioned above, the effect on EBIT of the strength-
ened USD exchange rate is almost neutral, while the
EBIT margin is negatively impacted by the scaling effect.
EBIT in Q3 was DKK 56m (DKK 55m), with an EBIT mar-
gin of 11.6% (13.9%) being posted. Year to date, EBIT
totals DKK 119m (DKK 118m), with an EBIT margin of
8.8% (10.3%).
EBIT before special items – quarters (DKKm)
Net financials
Net financials amounted to net expenses of DKK 29m
(DKK -10m) in Q3, and to net expenses of DKK 4m (DKK
-28m) year to date. The item is materially affected by un-
realised foreign exchange gains on intercompany loans.
Net financials for the year to date are composed as fol-
lows:
• Interest expenses for bank and bond debt totalled
DKK 21m (DKK 22m).
• Foreign currency translation adjustments of inter-
company balances in USD and market value adjust-
ments of interest and foreign currency swaps re-
sulted in net income of DKK 22m (income of DKK
2m).
• The interest element from liabilities stated at present
discounted value is included with a cost of DKK 5m
(DKK 8m).
Year to date, total cash flows from net financials were
negative in the amount of DKK 28m, as interest of DKK
24m is payable on the bond loan once a year in March.
0
20
40
60
80
Q1 Q2 Q3 Q4
2013/14
2014/15
Ambu
Company announcement no. 14 2014/15 19 August 2015 Page 7
Tax
A provision has been made for tax of 25% on the profit
before tax adjusted for non-deductible items.
Net profit
A net profit of DKK 20m (DKK 33m) was posted for Q3,
and DKK 86m (DKK 66m) for the year to date.
BALANCE SHEET At the end of the quarter, the value of the total assets
was DKK 2,288m (DKK 1,974m). Total assets are mate-
rially impacted by increasing exchange rates relative to
the Danish krone, and the statement of comprehensive
income includes net income of DKK 63m (DKK -8m) from
the translation of balance sheet items in foreign curren-
cies.
Working capital amounted to DKK 565m (DKK 410m),
corresponding to 31% (27%) of revenue on a 12-month
basis. Of the 4 percentage point increase, just over 2 per-
centage points can be ascribed to exchange rate effects,
while the rest of the increase is attributable to increased
investments in inventories due to new products and in-
creasing trade receivables.
Trade receivables totalled DKK 439m at the end of the
quarter against DKK 328m for the same quarter last year.
Receivables are also materially affected by exchange
rates, but also by slightly slower payment patterns in cer-
tain regions. The credit risk attaching to outstanding
debtors is deemed to be unchanged, and the quarter was
not affected by bad debts to any significant extent.
At the end of the quarter, cash totalled DKK 80m (DKK
105m), in addition to which Ambu had unutilised credit
facilities of DKK 91m.
Total financial net debt at the end of the quarter was DKK
804m (DKK 784m), of which DKK 700.5m is financed via
corporate bonds. Net interest-bearing debt totalled 2.7
(3.0) x rolling 12-month EBITDA.
CASH FLOWS Year to date, cash flows from operating activities total
DKK 68m (DKK 110m).
Investments in non-current assets came to DKK 80m
(DKK 53m) for the year to date, consisting of ordinary
development projects, production equipment as well as
the last instalment in respect of the new factory in Malay-
sia.
Year to date, free cash flows before company acquisi-
tions then totalled DKK -12m (DKK 57m).
Ambu
Company announcement no. 14 2014/15 19 August 2015 Page 8
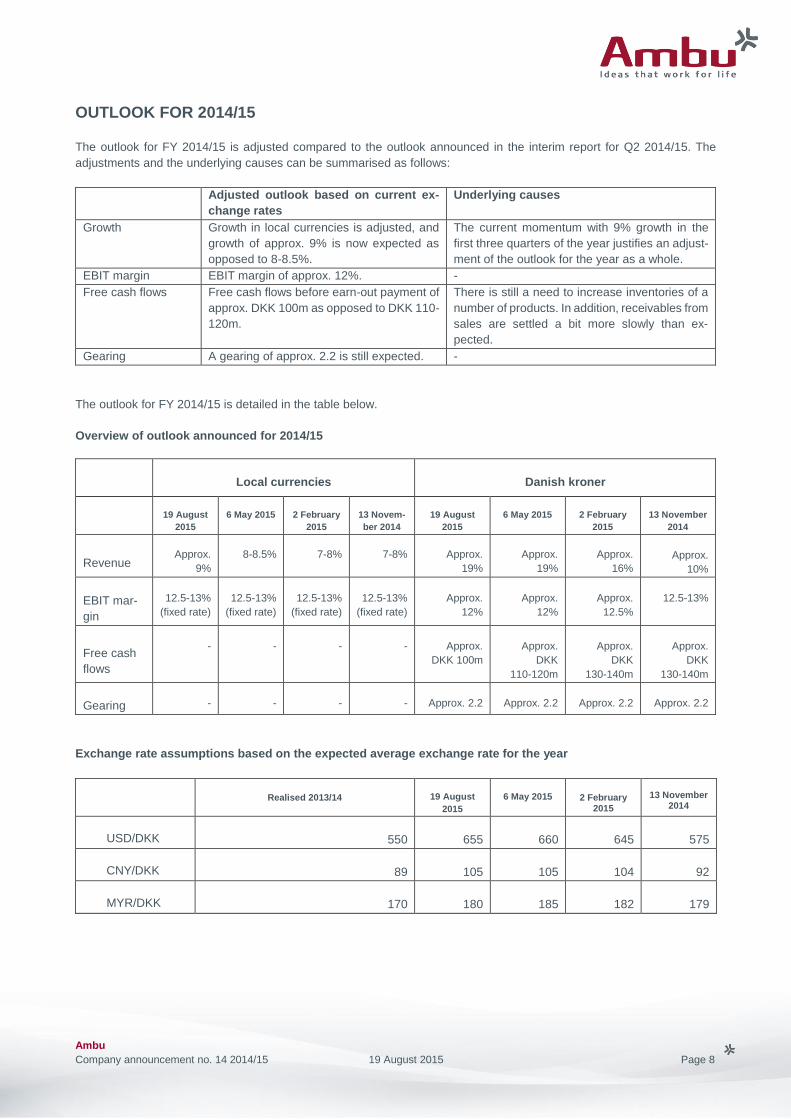
OUTLOOK FOR 2014/15
The outlook for FY 2014/15 is adjusted compared to the outlook announced in the interim report for Q2 2014/15. The
adjustments and the underlying causes can be summarised as follows:
Adjusted outlook based on current ex-
change rates
Underlying causes
Growth Growth in local currencies is adjusted, and
growth of approx. 9% is now expected as
opposed to 8-8.5%.
The current momentum with 9% growth in the
first three quarters of the year justifies an adjust-
ment of the outlook for the year as a whole.
EBIT margin EBIT margin of approx. 12%. -
Free cash flows Free cash flows before earn-out payment of
approx. DKK 100m as opposed to DKK 110-
120m.
There is still a need to increase inventories of a
number of products. In addition, receivables from
sales are settled a bit more slowly than ex-
pected.
Gearing A gearing of approx. 2.2 is still expected. -
The outlook for FY 2014/15 is detailed in the table below.
Overview of outlook announced for 2014/15
Exchange rate assumptions based on the expected average exchange rate for the year
Realised 2013/14
19 August
2015
6 May 2015 2 February 2015
13 November
2014
USD/DKK
550
655
660
645
575
CNY/DKK
89
105
105
104
92
MYR/DKK
170
180
185
182
179
Local currencies
Danish kroner
19 August
2015
6 May 2015
2 February
2015
13 Novem-
ber 2014
19 August
2015
6 May 2015
2 February
2015
13 November
2014
Revenue Approx.
9%
8-8.5% 7-8% 7-8% Approx.
19%
Approx.
19%
Approx.
16%
Approx.
10%
EBIT mar-
gin
12.5-13%
(fixed rate)
12.5-13%
(fixed rate)
12.5-13%
(fixed rate)
12.5-13%
(fixed rate)
Approx.
12%
Approx.
12%
Approx.
12.5%
12.5-13%
Free cash
flows
-
-
-
-
Approx.
DKK 100m
Approx.
DKK
110-120m
Approx.
DKK
130-140m
Approx.
DKK
130-140m
Gearing
-
-
-
-
Approx. 2.2
Approx. 2.2
Approx. 2.2
Approx. 2.2
Ambu
Company announcement no. 14 2014/15 19 August 2015 Page 9
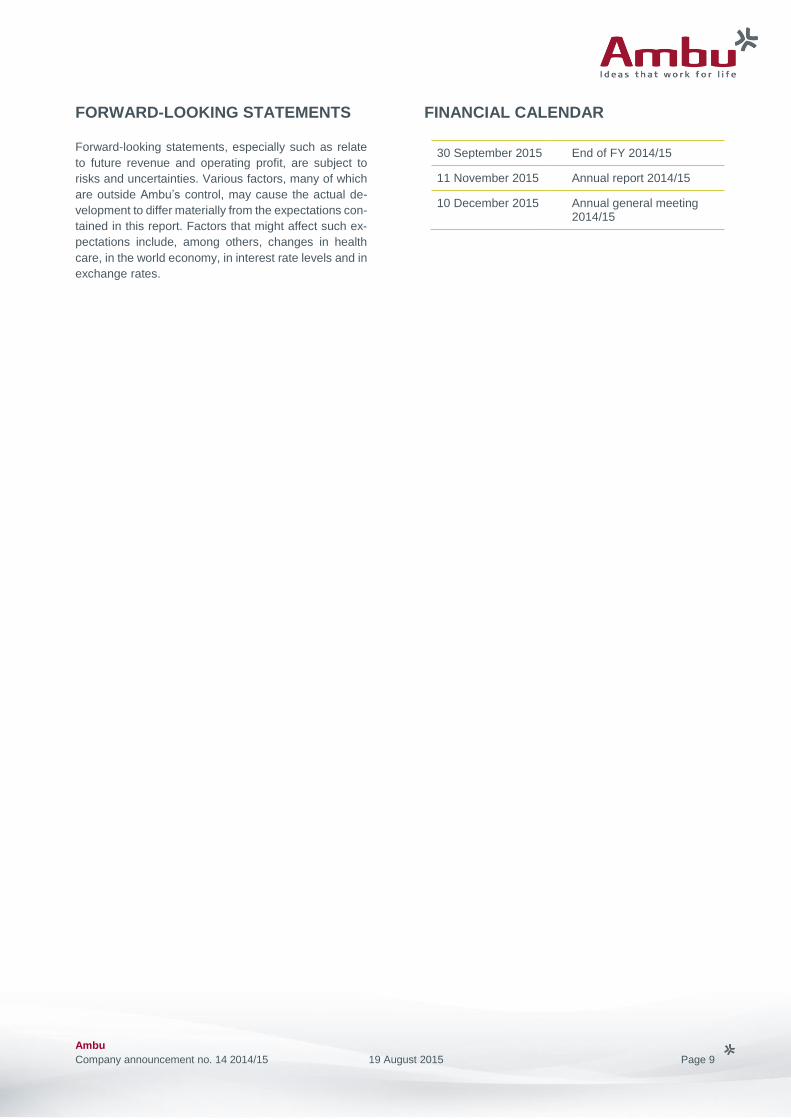
FORWARD-LOOKING STATEMENTS
Forward-looking statements, especially such as relate
to future revenue and operating profit, are subject to
risks and uncertainties. Various factors, many of which
are outside Ambu’s control, may cause the actual de-
velopment to differ materially from the expectations con-
tained in this report. Factors that might affect such ex-
pectations include, among others, changes in health
care, in the world economy, in interest rate levels and in
exchange rates.
FINANCIAL CALENDAR
30 September 2015 End of FY 2014/15
11 November 2015 Annual report 2014/15
10 December 2015 Annual general meeting 2014/15
Ambu
Company announcement no. 14 2014/15 19 August 2015 Page 10
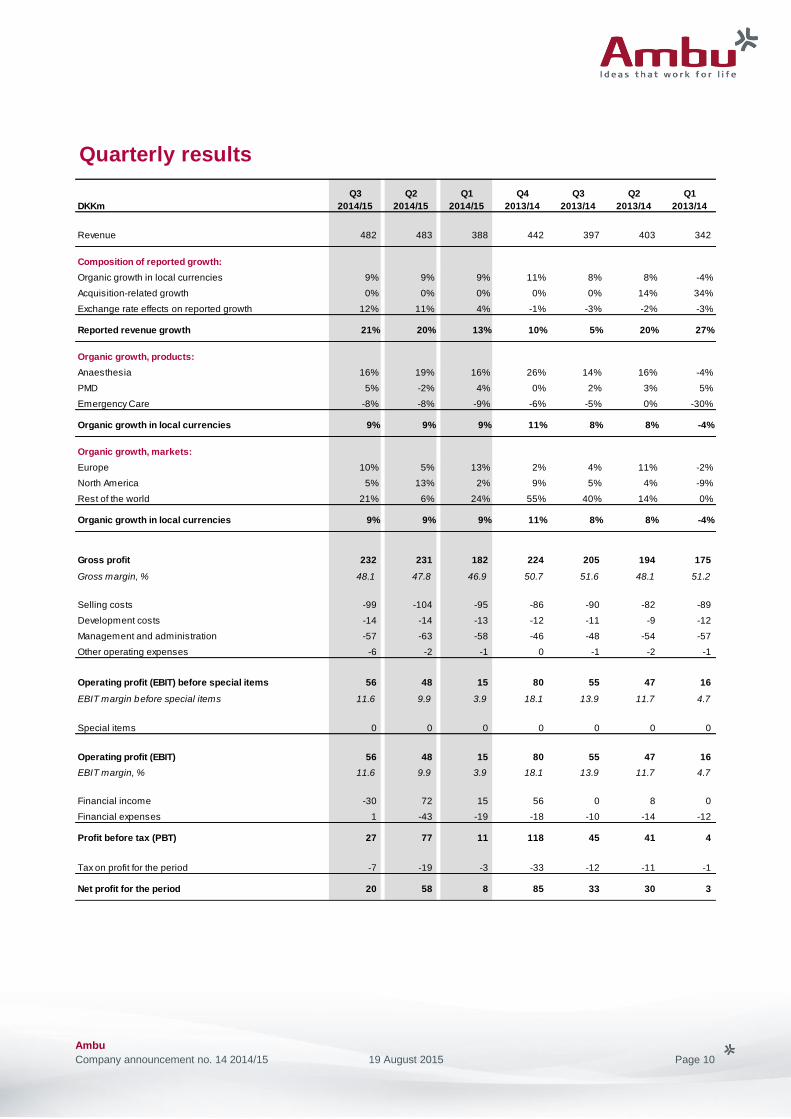
Quarterly results
DKKm
Q3
2014/15
Q2
2014/15
Q1
2014/15
Q4
2013/14
Q3
2013/14
Q2
2013/14
Q1
2013/14
Revenue 482 483 388 442 397 403 342
Composition of reported growth:
Organic growth in local currencies 9% 9% 9% 11% 8% 8% -4%
Acquisition-related growth 0% 0% 0% 0% 0% 14% 34%
Exchange rate effects on reported growth 12% 11% 4% -1% -3% -2% -3%
Reported revenue growth 21% 20% 13% 10% 5% 20% 27%
Organic growth, products:
Anaesthesia 16% 19% 16% 26% 14% 16% -4%
PMD 5% -2% 4% 0% 2% 3% 5%
Emergency Care -8% -8% -9% -6% -5% 0% -30%
Organic growth in local currencies 9% 9% 9% 11% 8% 8% -4%
Organic growth, markets:
Europe 10% 5% 13% 2% 4% 11% -2%
North America 5% 13% 2% 9% 5% 4% -9%
Rest of the world 21% 6% 24% 55% 40% 14% 0%
Organic growth in local currencies 9% 9% 9% 11% 8% 8% -4%
Gross profit 232 231 182 224 205 194 175
Gross margin, % 48.1 47.8 46.9 50.7 51.6 48.1 51.2
Selling costs -99 -104 -95 -86 -90 -82 -89
Development costs -14 -14 -13 -12 -11 -9 -12
Management and administration -57 -63 -58 -46 -48 -54 -57
Other operating expenses -6 -2 -1 0 -1 -2 -1
Operating profit (EBIT) before special items 56 48 15 80 55 47 16
EBIT margin before special items 11.6 9.9 3.9 18.1 13.9 11.7 4.7
Special items 0 0 0 0 0 0 0
Operating profit (EBIT) 56 48 15 80 55 47 16
EBIT margin, % 11.6 9.9 3.9 18.1 13.9 11.7 4.7
Financial income -30 72 15 56 0 8 0
Financial expenses 1 -43 -19 -18 -10 -14 -12
Profit before tax (PBT) 27 77 11 118 45 41 4
Tax on profit for the period -7 -19 -3 -33 -12 -11 -1
Net profit for the period 20 58 8 85 33 30 3
Ambu
Company announcement no. 14 2014/15 19 August 2015 Page 11
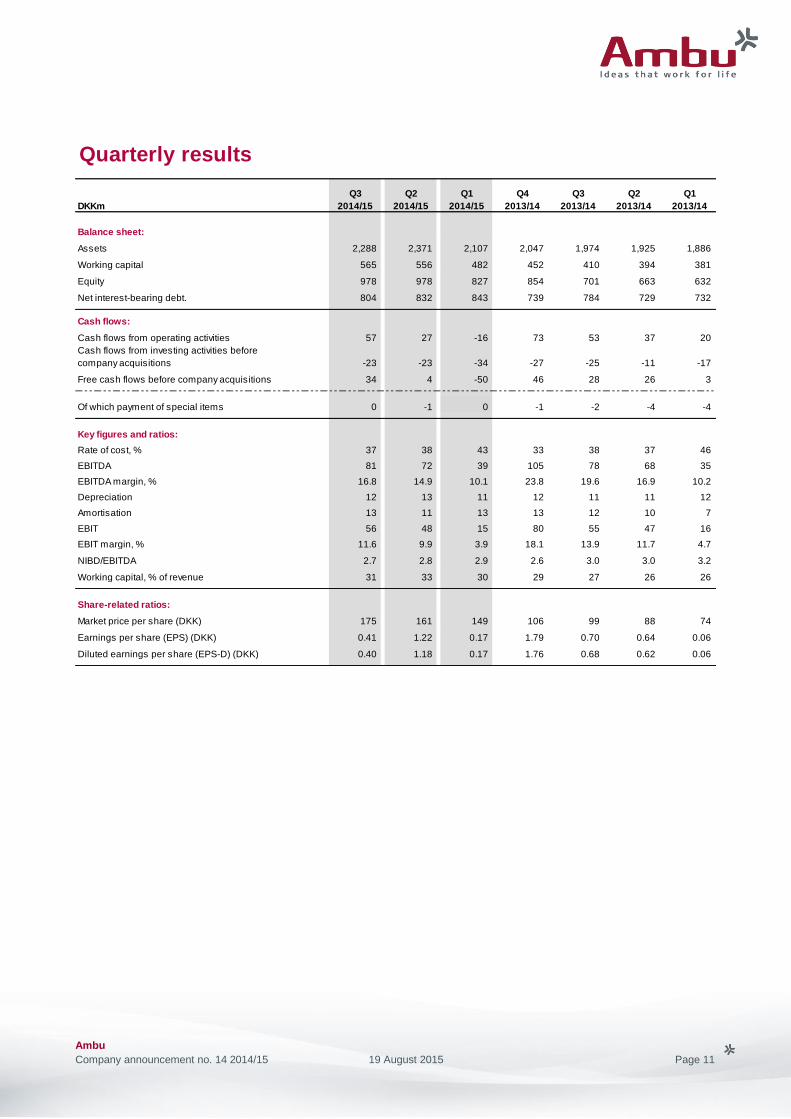
Quarterly results
DKKm
Q3
2014/15
Q2
2014/15
Q1
2014/15
Q4
2013/14
Q3
2013/14
Q2
2013/14
Q1
2013/14
Balance sheet:
Assets 2,288 2,371 2,107 2,047 1,974 1,925 1,886
Working capital 565 556 482 452 410 394 381
Equity 978 978 827 854 701 663 632
Net interest-bearing debt. 804 832 843 739 784 729 732
Cash flows:
Cash flows from operating activities 57 27 -16 73 53 37 20
Cash flows from investing activities before
company acquisitions -23 -23 -34 -27 -25 -11 -17
Free cash flows before company acquisitions 34 4 -50 46 28 26 3
Of which payment of special items 0 -1 0 -1 -2 -4 -4
Key figures and ratios:
Rate of cost, % 37 38 43 33 38 37 46
EBITDA 81 72 39 105 78 68 35
EBITDA margin, % 16.8 14.9 10.1 23.8 19.6 16.9 10.2
Depreciation 12 13 11 12 11 11 12
Amortisation 13 11 13 13 12 10 7
EBIT 56 48 15 80 55 47 16
EBIT margin, % 11.6 9.9 3.9 18.1 13.9 11.7 4.7
NIBD/EBITDA 2.7 2.8 2.9 2.6 3.0 3.0 3.2
Working capital, % of revenue 31 33 30 29 27 26 26
Share-related ratios:
Market price per share (DKK) 175 161 149 106 99 88 74
Earnings per share (EPS) (DKK) 0.41 1.22 0.17 1.79 0.70 0.64 0.06
Diluted earnings per share (EPS-D) (DKK) 0.40 1.18 0.17 1.76 0.68 0.62 0.06
Ambu
Company announcement no. 14 2014/15 19 August 2015 Page 12
Management’s statement
On this day, the Board of Directors and the Executive Board have considered and approved the interim report of Ambu
A/S for the period 1 October 2014 to 30 June 2015.
The interim report is presented in accordance with IAS 34 – Interim Financial Reporting as adopted by the EU and
additional Danish disclosure requirements for the interim reporting of listed companies.
We consider the accounting policies applied to be appropriate, and in our opinion, the interim report provides a true and
fair view of the group’s assets, liabilities and financial standing as at 30 June 2015 as well as of the results of the group’s
activities and cash flows in the period 1 October 2014 - 30 June 2015.
We further consider that the management’s review gives a true and fair view of the development in the group’s activities
and financial affairs, the profit for the period and the group’s financial position as a whole as well as a description of the
most significant risks and uncertainties to which the group is subject.
Ballerup, 19 August 2015
Executive Board
Lars Marcher Michael Højgaard
CEO CFO
Board of Directors
Jens Bager
Chairman Mikael Worning
Vice-Chairman Jesper Funding Andersen
Pernille Bartholdy Jakob Bønnelykke Kristensen
Allan Søgaard Larsen
Anita Krarup Rasmussen
Christian Sagild
John Stær

Ambu
Company announcement no. 14 2014/15 19 August 2015 Page 13
Income statement
DKKm Note
Q3
2014/15
Q3
2013/14
YTD
2014/15
YTD
2013/14
FY
2013/14
Revenue 482 397 1,353 1,142 1,584
Production costs -250 -192 -708 -568 -786
Gross profit 232 205 645 574 798
Selling costs -99 -90 -298 -261 -347
Development costs -14 -11 -41 -32 -44
Management and administration -57 -48 -178 -159 -205
Other operating expenses -6 -1 -9 -4 -4
Operating profit (EBIT) 56 55 119 118 198
Financial income 2 -30 0 57 8 64
Financial expenses 2 1 -10 -61 -36 -54
Profit before tax (PBT) 27 45 115 90 208
Tax on profit for the period -7 -12 -29 -24 -57
Net profit for the period 20 33 86 66 151
Earnings per share in DKK
Earnings per share (EPS) 0.41 0.70 1.80 1.40 3.19
Diluted earnings per share (EPS-D) 0.40 0.68 1.75 1.36 3.12
Statement of comprehensive income
DKKm
Q3
2014/15
Q3
2013/14
YTD
2014/15
YTD
2013/14
FY
2013/14
Net profit for the period 20 33 86 66 151
Translation adjustment in foreign subsidiaries -39 4 74 -9 53
Tax on translation adjustments in foreign subsidiaries 3 -1 -11 1 -6
Adjustment to fair value for the period:
-Disposals included in net financials 0 0 0 0 1
-Additions concerning hedging instruments 0 2 2 2 0
Tax on hedging transactions 0 -1 -1 -1 0
Comprehensive income for the period -16 37 150 59 199
Items which are moved to the income statement under
certain conditions:

Ambu
Company announcement no. 14 2014/15 19 August 2015 Page 14
Balance sheet
DKKm 30.06.15 30.06.14 30.09.14
Acquired technologies, trademarks and customer relations 107 103 107
Completed development projects 59 56 69
Rights 55 54 53
Goodwill 808 724 748
Development projects in progress 48 30 24
Intangible assets 1,077 967 1,001
Land and buildings 138 110 121
Plant and machinery 94 103 110
Other plant, fixtures and fittings, tools and equipment 35 21 22
Prepayments and plant under construction 33 17 18
Property, plant and equipment 300 251 271
Deferred tax asset 32 32 21
Other receivables 6 0 0
Other non-current assets 38 32 21
Total non-current assets 1,415 1,250 1,293
Inventories 300 240 253
Trade receivables 439 328 380
Other receivables 16 10 11
Income tax receivable 2 6 6
Prepayments 36 17 18
Derivative financial instruments 0 18 0
Cash 80 105 86
Total current assets 873 724 754
Total assets 2,288 1,974 2,047

Ambu
Company announcement no. 14 2014/15 19 August 2015 Page 15
Balance sheet
DKKm 30.06.15 30.06.14 30.09.14
Share capital 121 119 119
Other reserves 857 582 735
Equity 978 701 854
Credit institutions 2 5 4
Provision for deferred tax 44 35 33
Corporate bonds 698 697 698
Other provisions 52 69 55
Non-current liabilities 796 806 790
Current portion of non-current liabilities 2 4 4
Other provisions 28 60 18
Bank debt 182 183 119
Trade payables 97 73 88
Income tax 32 28 45
Other payables 135 112 122
Derivative financial instruments 38 7 7
Current liabilities 514 467 403
Total liabilities 1,310 1,273 1,193
Total equity and liabilities 2,288 1,974 2,047
Statement of changes in equity
DKKm Note 30.06.15 30.06.14 30.09.14
Equity, beginning of period 854 651 651
Capital increase 4 19 4 6
Comprehensive income for the period 150 59 199
Exercise of options 11 15 17
Share-based payment 4 2 4
Tax deduction related to share-based payment 13 0 7
Purchase of treasury shares -28 -15 -15
Distributed dividend -45 -15 -15
Equity, end of period 978 701 854
Ambu
Company announcement no. 14 2014/15 19 August 2015 Page 16
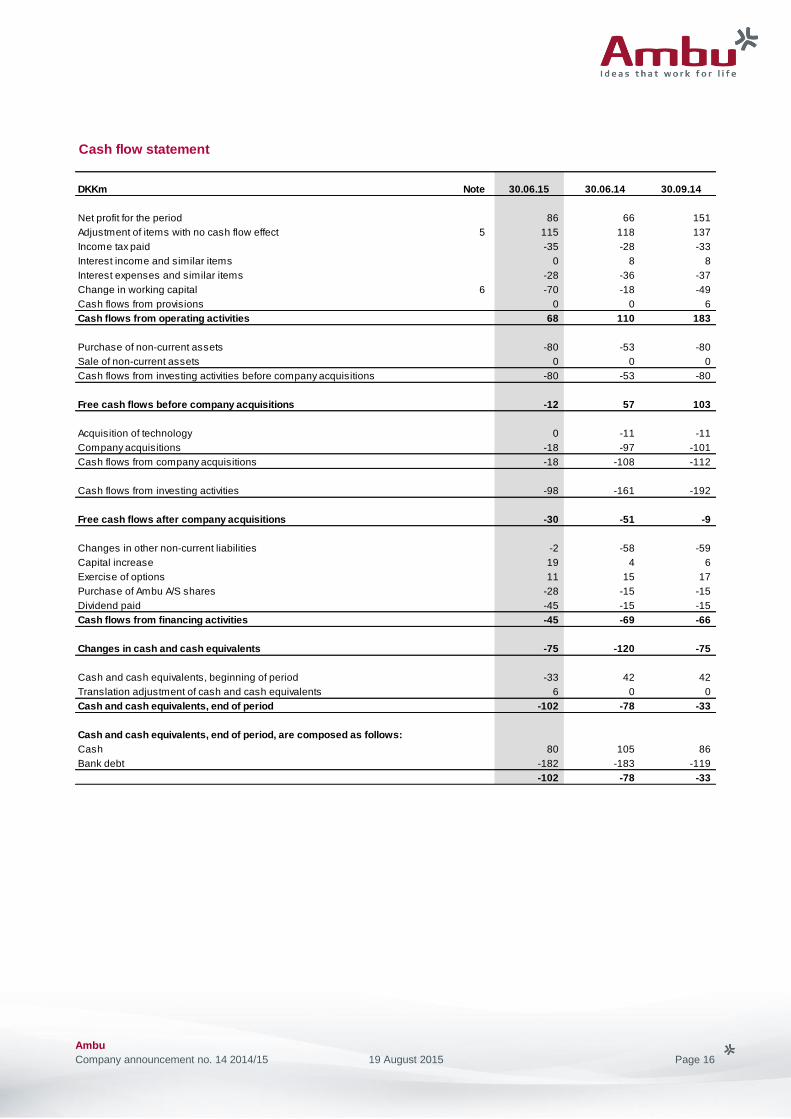
Cash flow statement
DKKm Note 30.06.15 30.06.14 30.09.14
Net profit for the period 86 66 151
Adjustment of items with no cash flow effect 5 115 118 137
Income tax paid -35 -28 -33
Interest income and similar items 0 8 8
Interest expenses and similar items -28 -36 -37
Change in working capital 6 -70 -18 -49
Cash flows from provisions 0 0 6
Cash flows from operating activities 68 110 183
Purchase of non-current assets -80 -53 -80
Sale of non-current assets 0 0 0
Cash flows from investing activities before company acquisitions -80 -53 -80
Free cash flows before company acquisitions -12 57 103
Acquisition of technology 0 -11 -11
Company acquisitions -18 -97 -101
Cash flows from company acquisitions -18 -108 -112
Cash flows from investing activities -98 -161 -192
Free cash flows after company acquisitions -30 -51 -9
Changes in other non-current liabilities -2 -58 -59
Capital increase 19 4 6
Exercise of options 11 15 17
Purchase of Ambu A/S shares -28 -15 -15
Dividend paid -45 -15 -15
Cash flows from financing activities -45 -69 -66
Changes in cash and cash equivalents -75 -120 -75
Cash and cash equivalents, beginning of period -33 42 42
Translation adjustment of cash and cash equivalents 6 0 0
Cash and cash equivalents, end of period -102 -78 -33
Cash and cash equivalents, end of period, are composed as follows:
Cash 80 105 86
Bank debt -182 -183 -119
-102 -78 -33

Ambu
Company announcement no. 14 2014/15 19 August 2015 Page 17
Note 1 – Segment information
Note 2 – Net financials
DKKm
Q3
2014/15
Q3
2013/14 YTD 2014/15 YTD 2013/14
FY
2013/14
Other financial income:
Interest income, swap 0 0 0 8 8
Other financial income:
Foreign exchange gains, net -30 0 57 0 25
Fair value adjustment, earn-out 0 0 0 0 31
Financial income -30 0 57 8 64
Q3
2014/15
Q3
2013/14 YTD 2014/15 YTD 2013/14
FY
2013/14
Interest expenses:
Interest expenses, banks 1 0 3 4 5
Interest expenses, swap 0 0 0 9 9
Interest expenses, bonds 6 6 18 18 24
Other financial expenses:
Effect of shorter discounting period, earn-out 1 2 2 7 5
Effect of shorter discounting period, acquisition
of technology 1 1 3 1 2
Fair value adjustment, swap -10 0 35 -7 9
Foreign exchange losses, net 0 1 0 4 0
Financial expenses -1 10 61 36 54
Note 3 – Development in balance sheet since 30 September 2014
Ambu has thus only identified one operating segment and has therefore only shown the activities’ geographical distribution.
Ambu is a supplier of medico-technical products for the global market. Except for the sales of the different products, no structural or
organisational aspects allow for a division of earnings from individual products, as sales channels, customer types and sales organisations
are identical for all important markets. Furthermore, production processes and internal controls and reporting are identical, which means that
with the exception of revenue, everything else is unsegmented.
Since the beginning of the financial year, non-current assets have increased by a net amount of DKK 122m to DKK 1,415m. The increase was
driven by investments of DKK 89m, depreciation and amortisation of DKK 73m and translation adjustments of DKK 108m.
Other provisions under current and non-current liabilities totalled DKK 80m at the end of Q3 and have been increased by a net amount of DKK
7m since the beginning of the financial year. The increase is primarily attributable to the stronger USD/DKK exchange rate and the financed
acquisition of patents. Conversely, the second earn-out payment of DKK 17m for the acquisition of King Systems reduced the provision.
From the beginning of the financial year until the end of Q3, other payables increased by DKK 13m to DKK 135m. Underlying this
development, the payment of due bond interest of DKK 24m in March 2015 reduced the payables, whereas translation adjustments and other
payables led to an increase.
Ambu
Company announcement no. 14 2014/15 19 August 2015 Page 18
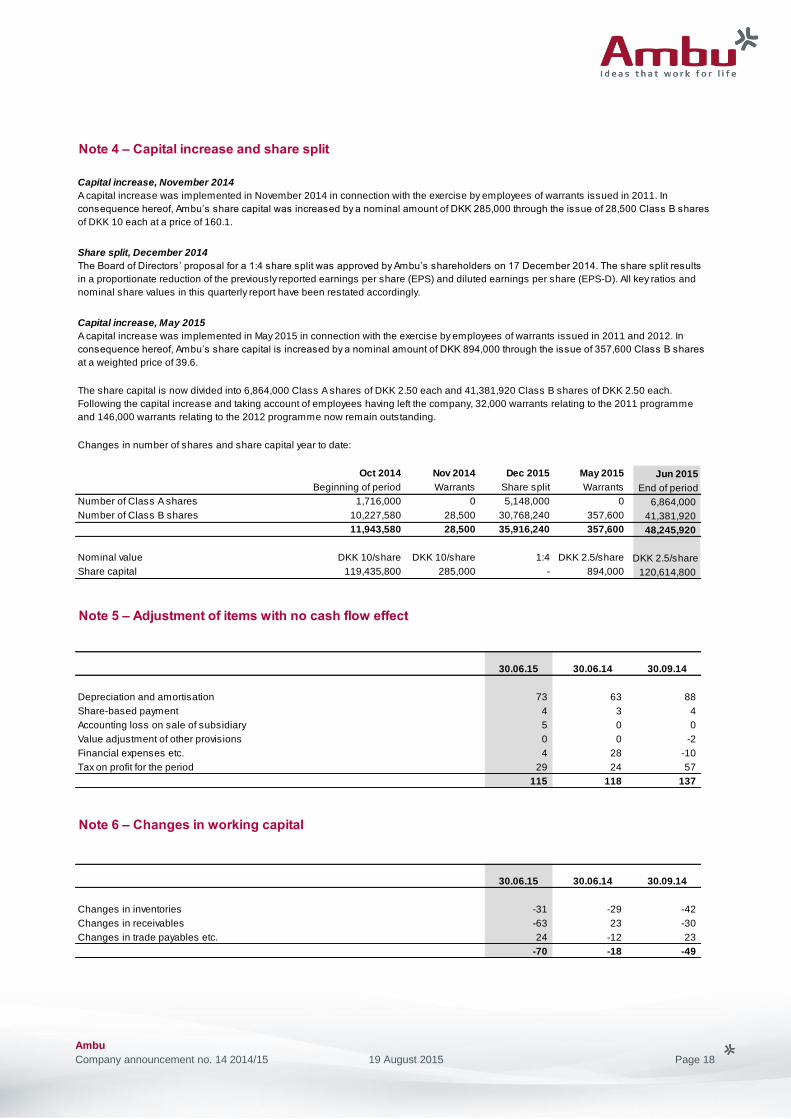
Note 4 – Capital increase and share split
Capital increase, November 2014
Share split, December 2014
Capital increase, May 2015
Changes in number of shares and share capital year to date:
Oct 2014 Nov 2014 Dec 2015 May 2015 Jun 2015
Beginning of period Warrants Share split Warrants End of period
Number of Class A shares 1,716,000 0 5,148,000 0 6,864,000
Number of Class B shares 10,227,580 28,500 30,768,240 357,600 41,381,920
11,943,580 28,500 35,916,240 357,600 48,245,920
Nominal value DKK 10/share DKK 10/share 1:4 DKK 2.5/share DKK 2.5/share
Share capital 119,435,800 285,000 - 894,000 120,614,800
Note 5 – Adjustment of items with no cash flow effect
30.06.15 30.06.14 30.09.14
Depreciation and amortisation 73 63 88
Share-based payment 4 3 4
Accounting loss on sale of subsidiary 5 0 0
Value adjustment of other provisions 0 0 -2
Financial expenses etc. 4 28 -10
Tax on profit for the period 29 24 57
115 118 137
Note 6 – Changes in working capital
30.06.15 30.06.14 30.09.14
Changes in inventories -31 -29 -42
Changes in receivables -63 23 -30
Changes in trade payables etc. 24 -12 23
-70 -18 -49
A capital increase was implemented in November 2014 in connection with the exercise by employees of warrants issued in 2011. In
consequence hereof, Ambu’s share capital was increased by a nominal amount of DKK 285,000 through the issue of 28,500 Class B shares
of DKK 10 each at a price of 160.1.
The Board of Directors’ proposal for a 1:4 share split was approved by Ambu’s shareholders on 17 December 2014. The share split results
in a proportionate reduction of the previously reported earnings per share (EPS) and diluted earnings per share (EPS-D). All key ratios and
nominal share values in this quarterly report have been restated accordingly.
A capital increase was implemented in May 2015 in connection with the exercise by employees of warrants issued in 2011 and 2012. In
consequence hereof, Ambu’s share capital is increased by a nominal amount of DKK 894,000 through the issue of 357,600 Class B shares
at a weighted price of 39.6.
The share capital is now divided into 6,864,000 Class A shares of DKK 2.50 each and 41,381,920 Class B shares of DKK 2.50 each.
Following the capital increase and taking account of employees having left the company, 32,000 warrants relating to the 2011 programme
and 146,000 warrants relating to the 2012 programme now remain outstanding.
Ambu
Company announcement no. 14 2014/15 19 August 2015 Page 19
Note 7 – Contingent liabilities
Ambu’s regular operations and the use of Ambu’s products at hospitals and clinics etc. entail a risk that claims for damages may be made against Ambu.
The risk is deemed to be customary.
Note 8 – Risks
For a description of Ambu’s risks, see the ‘Risk management’ section in the annual report for 2013/14 on pages 15-16.
Based on the information available at the present time, Ambu is unable to reliably predict the duration of this process or the final outcome of this claim, and
it is therefore not possible for Ambu to estimate its financial effect.
In October 2014, Ambu was contacted by the owner of rights to certain patents which Ambu has been utilising for a number of years upon agreement with
the owner. Based on a royalty audit conducted, the owner has presented a claim for additional payments alleging underpayment of royalties for the period
since 2008. Ambu is engaged in a dialogue with the other party.
However, on the basis of the knowledge currently available, Ambu is convinced that the claim will not materially affect the group’s financial position.