interim report design, construction, and early performance ... word... · interim report design,...
TRANSCRIPT

INTERIM REPORT
DESIGN, CONSTRUCTION, AND EARLY PERFORMANCE OF HOT-MIX ASPHALT STABILIZER AND MODIFIER TEST SECTIONS
Brian D. Prowell, P.E. Senior Research Scientist
(The opinions, findings, and conclusions expressed in this report are those of the author and not necessarily those of
the sponsoring agencies.)
Virginia Transportation Research Council (A Cooperative Organization Sponsored Jointly by the Virginia Department of Transportation
and the University of Virginia)
In Cooperation with the U.S. Department of Transportation Federal Highway Administration
Charlottesville, Virginia
April 2000
VTRC 00-IR2

ii
Copyright 2000 by the Virginia Department of Transportation.

iii
ABSTRACT
This study evaluated three modifiers and two types of fibers (stabilizers) commonly available in Virginia for hot-mix asphalt (HMA). Ten test sections were built in 1995 on I-66 west of Manassas, Virginia. The modified asphalts complied with the specifications for performance grade (PG) 76-22. They were placed in both dense-graded Marshall and coarse-graded Superpave mixtures. The fibers were placed only in the dense-graded Marshall mixtures. During the design process, the dense-graded Marshall mixture complied with all of the Superpave requirements with the exception of the gradation, which passed through the restricted zone. Samples from the sections were tested for asphalt content, gradation, and Superpave and Marshall volumetrics and then rut tested using the Georgia loaded-wheel tester and the asphalt pavement analyzer. Field samples generally passed Marshall volumetric requirements and generally failed Superpave volumetric requirements. Neither laboratory compaction method correlated with the ultimate field density. All of the sections are rut resistant and have performed well after 45 months of service in the field.

INTERIM REPORT
DESIGN, CONSTRUCTION, AND EARLY PERFORMANCE OF HOT-MIX ASPHALT STABILIZER AND MODIFIER TEST SECTIONS
Brian D. Prowell, P.E.
Senior Research Scientist
INTRODUCTION
Background on Hot-Mix Asphalt Mixture Design
Hot-mix asphalt (HMA) requires a balance between rut resistance and durability to resist cracking and moisture damage (stripping). Several factors that influence rut resistance and durability are considered during the design process: binder selection, asphalt content (AC), and moisture susceptibility.
Prior to the development of Superpave, binder grade was primarily selected based on local experience. The Virginia Department of Transportation (VDOT) used the viscosity grading system to specify binders. This system defines a binder using three parameters: (1) viscosity (resistance to flow, a form of stiffness) at 135 °C to ensure that the material can be pumped into the asphalt plant, (2) viscosity at 60 °C, considered to be the in-service high-pavement temperature that will help prevent rutting and penetration, and (3) an empirical measure of stiffness at 25 °C. Penetration measurements were supposed to be indicative of the fatigue and low-temperature performance of the binder. However, these distresses primarily occur at temperatures lower than the 25 °C test temperature.
In the Superpave mixture design system, binder grade is selected based on climatic data, traffic loading, and traffic speed. The designer should select a binder that is soft enough at low temperatures to resist thermal cracking and stiff enough at high temperatures to resist rutting. The high and low test temperatures are based on the expected service temperatures of the pavement. Asphalt is a viscoelastic material. At low temperatures, it behaves like an elastic solid. At high temperatures, it behaves like a viscous liquid. In both cases, but particularly at high temperatures, asphalt is sensitive to time of loading. This sensitivity is the reason permanent deformation or rutting tends to occur more often at intersections (where traffic is moving slowly or stopped) than in the mainline of the pavement where speeds are higher. To account for this effect, Superpave uses time-temperature superposition. Basically, to simulate slower traffic, Superpave recommends testing at a higher temperature. Superpave performance-graded (PG) binders are tested over the entire range of expected construction and service temperatures. Aging of the material and the effect of traffic speed are also evaluated.

2
Since the viscosity grading system did not fully evaluate the fatigue or low-temperature properties of the binder, conventional wisdom suggested that durability would be compromised if stiff binders were used in regions subject to cycles of freezing and thawing. It should be stressed that the use of a good binder does not ensure good performance of the pavement. Although the resistance to low-temperature or thermal cracking is largely a function of the binder, rutting and fatigue performance are affected by the aggregate properties, aggregate gradation, and AC.
Once the binder grade is determined, a mixture design is performed. The mixture design
process includes selecting aggregates, determining the combination of aggregates to produce an acceptable aggregate skeleton (represented by the design gradation or combination of aggregate particles sizes), determining the design AC, and checking for moisture sensitivity. A strength test for the asphalt mixture is also desirable as part of the design.
Historically, VDOT has used the Marshall mixture design system but is transitioning to the
Superpave mixture design system. VDOT will fully implement the Superpave mixture design system this year. Both systems have minimum aggregate quality requirements. VDOT’s Marshall mixture design specifications included narrow aggregate gradation bands, close to the maximum density line. The maximum density line represents an estimate of the gradation that will produce the least void space (maximum density) between the aggregate particles. Superpave’s gradation specifications include only a few widely spaced control points and a restricted zone along the maximum density line in the fine aggregate sieve sizes. The restricted zone was included to prevent mixture tenderness during construction resulting from excessive natural sand. Superpave’s gradation specifications give the designer more freedom in selecting an aggregate structure.
Once a design gradation is selected, the design asphalt (binder) content needs to be
determined. Aggregates are blended, mixed with varying percentages of asphalt, and compacted in the laboratory. Laboratory compaction is supposed to simulate the compaction that occurs by the rollers during construction, as well as densification that occurs from traffic during the first few years of the life of the pavement. Samples are compacted with a Marshall hammer in the Marshall design system. The Marshall hammer consists of a 100-mm diameter flat tamping face with a 4.5-kg weight constructed to provide impact from a 460-mm fall. Typically, either 50 or 75 blows are applied to each face of the sample. The Superpave mixture design system uses the Superpave gyratory compactor (SGC) to compact the specimens. In the SGC, a ram applies a vertical pressure of 600 kPa, a frame keeps the sample mold tilted at an angle of 1.25°, and the frame revolves around the sample mold providing a kneading action. The 600-kPa vertical pressure is close to the tire pressure of a truck. The more revolutions or gyrations that are applied, the higher the compactive effort. The original Superpave specification included seven gyration levels corresponding to seven traffic levels over the design life of the asphalt layer. The kneading action of the SGC is supposed to be closer to the type of compaction applied by a roller and traffic.
Once the compacted specimens are cooled, the specific gravity and density of the samples
are determined by water displacement. The sample density is compared to the theoretical voidless density of the sample determined from the “rice,” or maximum specific gravity, test. The difference between the voidless density and the sample density, expressed as a percentage of the voidless density, is the air void content of the sample. An air-void level of 4% air voids or 96% of

3
maximum density is typically targeted during design. The AC that provides 4% air voids is chosen as the optimum or design AC in both the Marshall and Superpave design systems (VDOT’s specification actually targeted 4.5% air voids at design). An air void level of 2% or 98% of maximum density is desired at the end of the service life of a pavement. Air voids are required in the pavement to provide space for the binder (liquid asphalt) to expand into during the hot summer months. If insufficient air voids are present in the placement, the asphalt will “bleed” onto the surface of the pavement. Low air void levels in the pavement often lead to rutting with conventional aggregate skeletons. However, if air void levels are too high, the aging of the binder will be accelerated and more water will be able to penetrate the pavement, reducing durability. Thus, it is important for laboratory compaction to match the compaction provided during field compaction and densification under traffic.
The last steps in the design process are to evaluate the moisture sensitivity and strength of
the mix. Both the Marshall and Superpave design systems specify AASHTO T 283 to evaluate the moisture sensitivity of the mixture (VDOT specifies a modified version of AASHTO T 283 for their Marshall design procedure). AASHTO T 283 compares the retained tensile strengths of samples conditioned by saturation, freezing, and soaking in 60 °C water to unconditioned control samples. The Marshall mixture design system specifies the stability and flow test outlined in ASTM D 1559 as its strength test. Research indicates that this test does not correlate with field performance. Mixture analysis tests were developed as part of Superpave, but these tests are not ready for routine use. VDOT began evaluating the Georgia loaded-wheel tester (GLWT), now known as the asphalt pavement analyzer (APA), as an interim strength test device for Superpave. Virginia’s work with the GLWT and APA were reported previously (Prowell, 1999b).
Historic Background In 1990, VDOT modified its specifications for HMA to include 75-blow Marshall mixtures.
This was in response to instances of rutting and flushing on Virginia roadways shortly after construction. Conventional wisdom suggests that higher laboratory compaction efforts (more blows) will produce rut-resistant mixtures for higher traffic levels. For the same aggregate structure, higher laboratory compaction reduces the optimum AC of the mix. Shortly thereafter, a committee composed of members of Virginia’s Asphalt Co-operative Committee was formed to examine rutting at intersections. They developed forensic analysis plans and mixture designs that they believed would be both durable and rut resistant. They were concerned that the 75-blow mixtures with a lower AC would not be durable. The committee prepared a special provision for Section 211 of VDOT’s Road and Bridge Specifications for modified and stabilized mixtures. These mixtures would use the 50-blow Marshall compactive effort combined with either a modified asphalt or a stabilizing agent to provide rut resistance.
Asphalt binders that are the direct result of refining crude oil are typically referred to as
“straight run” asphalts. Asphalt binders that have been treated to improve their properties are typically referred to as modified asphalts. Initially, modified asphalt was the generic name for binders to which polymer had been added. Other types of chemical treatment processes (gelling) and oxidation processes (air blowing) are also used to modify asphalt. Stabilizing agents are

4
products added to stiffen the asphalt mixture (as opposed to the asphalt binder). Fibers and asphaltenes are examples of stabilizers. A list of approved stabilizers was prepared from several small test sections placed throughout the state. Little documentation exists on the performance or comparative performance of these test sections. No corresponding specification for modified asphalts was proposed, though two alternatives exist: Task Force 31’s (1992) Proposed Guide Specifications for Polymer Modified Asphalt and the Strategic Highway Research Program’s (SHRP) Performance Graded (PG) Binder Specification. One disadvantage of the former specification is that it is modifier (i.e., polymer type) specific whereas the PG specification is supposedly blind to modifier type. Unfortunately, the SHRP specification was validated using unmodified asphalts. Therefore, there is concern that different methods of modification in compliance with a given PG grade may not perform equally well in the field. In 1994, Superior Performing Asphalt Pavements (Superpave): The Product of the SHRP Asphalt Research Program was published. VDOT planned a phased implementation of Superpave, with total implementation scheduled for this year. In the meantime, VDOT would continue to use the Marshall mixture design system.
PURPOSE AND SCOPE
The purpose of this study was to perform a field evaluation VDOT’s special provision for stabilized and modified mixtures. Comparably modified Superpave mixture designs were evaluated. The PG specification was evaluated as a method for specifying modified binders. The performance of the modified mixtures was compared to that of VDOT’s conventional SM-2C mixture, a 75-blow Marshall design with an AC-30 binder. The GLWT was used to evaluate the mixtures and predict expected performance. These results were compared with the field performance of the mixtures.
EXPERIMENTAL APPROACH
Test Section
The test sections were constructed in the eastbound travel lane of I-66 just west of
Manassas. The sections were placed end to end such that they would receive almost identical traffic loading, subbase support, and climatic conditions. Approximately 25 mm of pavement was milled over the entire project and replaced with 38 mm of SM-2A (M) mixture, SM-2A (S) mixture, Superpave 12.5-mm nominal maximum size (NMS) surface mixture, or SM-2C control mixture. The remaining pavement structure consisted of 38 mm of 9.5 mm NMS mix, 200 mm of 37.5-mm mix, 150 mm of aggregate base, and 1,500 mm of select material. The minimum test section was based on supplying one 18,000-kg tanker of binder for each section. This produced
5
approximately 340,000 kg of mix, which paved a lane 3.7 m wide, 38 mm thick, and approximately 760 m long. The sections were constructed during a 2-week period in October 1995.
Test Procedures PG Binder Specification
PG binder testing was conducted in accordance with AASHTO MP-1. AASHTO MP-1 includes tests performed on the unaged or original, short-term aged, and long-term aged asphalt binder. Short-term aging includes the loss of volatiles and oxidation that occurs during construction. Short-term aging is simulated with the rolling thin film oven test (AASHTO T240). Long-term aging includes the oxidation that occurs in the pavement after 5 to 10 years of service life. Long-term aging is simulated with the pressure aging vessel residue test (AASHTO PP1). Characterization of the original binder includes flash point temperature, rotational viscosity, and dynamic shear tests. Flash point temperature (AASHTO T48) is included for safety during mixing. Rotational viscosity (ASTM D 4402) is included to ensure that the binder can be pumped at the asphalt plant. It is also used to determine the mixture compaction temperature. A dynamic shear rheometer (AASHTO TP-4) is used to characterize the high-temperature properties of the binder. These properties include the complex shear modulus (G*) and the phase angle (δ). G* is an indicator of the stiffness or resistance of the asphalt binder to deformation under load. G*/sin δ defines the resistance to shear deformation of the asphalt binder in the linear-viscoelastic region. A minimum stiffness (G*/sin δ = 1.0 kPa) is specified for the original binder to guard against mixture tenderness. Characterization of the rolling thin film oven residue includes analysis of mass loss on heating and dynamic shear tests. Mass loss on heating (AASHTO T-240) is used to control the amount of volatiles or pollution released during heating. A minimum stiffness (G*/sin δ = 2.2 kPa) is specified on the residue to ensure adequate resistance to permanent deformation. Characterization of the pressure aging vessel residue includes dynamic shear tests and bending beam rheometer tests. A maximum stiffness (G*sinδ = 5000 kPa) is specified on the residue to help prevent fatigue cracking. The bending beam rheometer (AASHTO TP1) is used to measure the low-temperature cracking properties of the binder. A creep load applied to the sample beam simulates thermal stresses that gradually build up in the pavement when the temperature drops. A maximum creep stiffness (S) of 300 MPa and a minimum creep rate of 0.300 at the design low temperature +10 °C is specified to prevent low-temperature cracking. The creep rate is generally referred to as the m value. Mixture Testing Samples for mixture analysis were taken from the back of the truck before it left the HMA plant. Two samples were taken from each section except the SM-2C control mixture and the

6
SM-12.5 mixture with the AC-20 binder where only single samples were taken. The sections with the SM-2C control mixture and Superpave SM-12.5 mixture with the AC-20 binder were shorter than the other sections. Tickets were sent with the truck drivers so that field personnel could mark where the sample was placed on the roadway. Subsequent rut depth and density measurements were taken at these locations. Personnel from the Virginia Transportation Research Council (VTRC) assisted the contractor’s personnel in testing at the asphalt plant. Testing was duplicated at VTRC’s laboratory on reheated material. The percentage of asphalt (AC%) was determined in accordance with Virginia Test Method 102, Determination of Asphalt Content from Asphalt Paving Mixtures by the Ignition Method. Washed gradation analysis was performed in accordance with AASHTO T11 and AASHTO T27. Theoretical maximum specific gravity was determined in accordance with AASHTO T 209. SGC samples were split out and heated to compaction temperature in covered 5-L metal painter’s pails. The samples were compacted in accordance with AASHTO TP4. Samples were compacted at the contractor’s laboratory using a Troxler Model 4140 compactor. Samples were compacted at VTRC’s laboratory using a Pine model AFGC125X compactor. Marshall samples (100 mm) were compacted using a flat foot mechanical hammer in accordance with AASHTO T245. The Marshall compaction effort was 50 blows for each face. GLWT/APA Mixture Tests
In the fall of 1995, VTRC purchased a model LW-II GLWT manufactured by Pavtec Engineering and Technology. Initial testing was conducted using Georgia Test Method GTD-115. Beam specimens, 75 mm x 125 mm x 300 mm, were compacted with a kneading action in a rolling-wheel compaction machine using a polycarbonate compaction pad. The target air voids were 7%. The beams were tested at 38 °C. A 445-N vertical load was applied with a moving wheel for 8,000 cycles (16,000 passes). A rubber hose inflated to 689 kPa transfers the wheel load to the specimen. Rut depth is measured by comparing pre-test and post-test profiles. Readings are taken with a digimatic caliper to the nearest 0.01 mm at three locations along the beam’s longitudinal axis. The locations are at the center of the beam and ±63.5 mm from the centerline. Early work indicated that this procedure did not seem to differentiate the performance of Virginia’s mixtures.
Lai recommended a proposed Georgia DOT test method for mixtures containing polymer-modified asphalt. In the proposed procedure, the test temperature was increased to 49 °C, the vertical load was increased to 533 N, and the hose inflation pressure was increased to 830 kPa.
The 49 °C test temperature correlates well with the predicted pavement temperature for the
project site. The average (50% reliability) 7-day high pavement temperature at a depth of 20 mm is 51.9 °C (Federal Highway Administration, 1998). Unfortunately, the model LWT-II compactor could maintain a temperature of only 49 °C. Therefore, the test temperature was increased from 38 °C to 49 °C. Trials with the increased temperature, vertical load, and hose pressure indicated that the GLWT could distinguish between binder grade and AC (Prowell, 1999b). Unfortunately, the

7
GLWT, Model LW-II, had difficulty maintaining the 49 °C temperature. The reciprocating carriage also developed significant wear.
In the spring of 1997, VDOT purchased a pair of APAs and vibratory compactors. One set
of units was stationed at VTRC. The APA is an improved version of the GLWT. VTRC used the same configuration (49 °C, 533 N, and 830 kPa) as used with the GLWT.
The sample mass for both devices was determined as follows to produce 7% target air voids:
5.281293.0 ××= mmGmassSample
where Gmm is the theoretical maximum specific gravity and 2812.5 is the sample volume in cubic centimeters. Field-produced samples were heated in an oven to a compaction temperature appropriate for the binder grade in covered buckets. Samples for the APA were compacted using a vibratory compactor designed to compact to a specified height.
Materials Mixtures
Three mixture designs were used in the test section: two VDOT dense-graded mixtures, SM-2A and SM-2C, and a Superpave 12.5-mm NMS mixture. The SM-2 gradation specifications allow the mixture to be designed as either a 9.5- or 12.5-mm NMS mixture. The A designation denotes a 50-blow Marshall design with a viscosity-graded AC-20 binder (current specifications call for a PG 64-22 binder), and the C designation denotes a 75-blow Marshall design with an AC-30 binder (current specifications require a PG 70-22 binder). The design AC for both mixtures was chosen at 4.5% air voids. These mixtures typically are slightly below the maximum density line (coarse side) and pass through the restricted zone. The (M) suffix is added to SM-2A mixtures containing a modified asphalt. The (S) designation is added to SM-2A mixtures containing a stabilizer (fiber). The contractor, Branscome Paving Company, completed the designs for the SM-2 mixtures.
The Superpave 12.5-mm NMS mixture (SM-12.5) was designed for 10 million equivalent single-axle loads over a 12-year design life. Specimens were aged for 4 hours in accordance with AASHTO PP-2. The specimens were compacted to Nmax = 152 gyrations in the SGC. Volumetric properties were back calculated at Ndesign = 96 gyrations. VTRC completed the Superpave mixture designs.
The mixture proportions for the three mixtures are shown in Table 1. Both SM-2 mixtures
contained 25% recycled asphalt pavement, and the Superpave SM-12.5 mixture was a virgin mixture. The target gradations are reported in Table 2 and Figure 1. All three mixtures complied with the gradation requirements for a 12.5-mm NMS Superpave mixture, with the exception that both SM-2 mixtures passed through the restricted zone. The mixture volumetric properties are

8
Table 1. Mixture Aggregate Proportions (%)
Aggregate SM-12.5 SM-2A SM-2C No. 78, Diabase 60 38 39 Manufactured Sand, Diabase 25 25 25 No. 10 Screening, Diabase 15 Natural Sand 12 11 Recycled Asphalt Pavement 25 25
Table 2. Design Gradations
Sieve Size (mm) SM-12.5 SM-2A SM-2C 12.5 95 98 98 9.5 76 85 85 4.75 45 57 57 2.36 29 39 39 1.18 22 NA NA 0.60 14 19 19 0.30 10 11 11 0.15 7 7 7 0.075 4.7 4.9 4.9
Figure 1. Design Gradations shown in Table 3. VTRC tested both of the contractor’s mixture designs in the SGC using the gyration levels specified for the expected traffic and ran 50-blow Marshall compactive efforts on the Superpave design. The results, shown in Table 3, indicate that both of the contractor’s SM-2 mixtures complied with all of the requirements of a Superpave mixture with the exception that they passed through the restricted zone. Current VDOT specifications allow Superpave mixtures to pass

9
Table 3. Design Volumetric Properties
Property
SM-12.5 (PG 76-22)
SM-2A (AC-20)
SM-2C (AC-30) Control
Compaction Level Design = 96 gyrations Marshall, 50 blows Marshall, 75 blows VTM (%) 4.4 (5.0)1 4.5 (4.5)2 4.5 (4.6)3 VMA (%) 16.9 (17.4) 15.7 (16.4) 15.4 (16.1) VFA (%) 74.1 (71.3) 71.3 (72.5) 71.9 (71.3) Design AC % 5.3 5.3 4.9 Fines to Effect AC% 0.9 1.1 1.2
VTM = voids in total mix; VMA = voids in mineral aggregate; VFA = voids filled with asphalt. 1Values in parenthesis are for the 50-blow Marshall design. 2,3Values in parenthesis are for samples compacted to Nmax = 152 gyrations, volumetrics back calculated at Ndesign = 96 gyrations. through the restricted zone. The Superpave verification indicated a 0.2% increase in AC for both SM-2 mixtures. Modifiers and Stabilizers
It was hoped that all of the modifiers and stabilizers commercially available in Virginia could be included in the trial. Because of difficulties arranging for particular materials to be introduced into the asphalt plant, only three modifiers and two stabilizers were included. The modifiers used to produce a PG 76-22 binder were styrene-butadiene-styrene (SBS), air blowing (AB), and a chemical gelling agent supplemented with a small dosage of styrene-butadiene rubber. Two stabilizers were included: polypropylene fibers and polyester fibers. Both were added at 0.3% by weight of total mixture as per the manufacturers’ recommendations. All three modifiers were included in the SM-2A and the SM-12.5 mixtures. The two stabilizing agents were included only in the SM-2A mixture. The 10 combinations of modifier, stabilizer, and mixture design are shown in Table 4.
Table 4. Test Section Layout
Section Mixture Modifier or Stabilizer Binder 1 SM-2A (M) SBS PG 76-22 2 SM-12.5 SBS PG 76-22 3 SM-2A (S) Polyester Fiber AC-20 4 SM-2A (M) AB PG 76-22 5 SM-12.5 AB PG 76-22 6 SM-2A (S) Polypropylene Fiber AC-20 7 SM-2C Control AC-30 8 SM-2A (M) Gelled PG 76-22 9 SM-12.5 Gelled PG 76-22 10 SM-12.5 None AC-20

10
For informational purposes, VTRC conducted one-point checks on the SM-2 mixtures with the different modifiers and stabilizers using the SGC. All of the samples were mixed with 5.3% AC with the exception of the SM-2C samples, which were mixed with 4.9% AC-30 binder. The modified asphalts were compacted at the manufacturers’ recommended temperature, 154 °C. The other mixtures were compacted at 143 °C. It is important to note that polypropylene fibers cannot be heated at a temperature higher than 146 °C because they will soften and melt, rendering them ineffective.
The compaction curves for the six mixtures tested are shown in Figure 2. The SHRP researchers felt that the slope of the compaction curve (density versus the log of gyrations) was indicative of the mixture performance (Cominsky et al., 1994). It was believed that steeper compaction slopes had better aggregate skeletons. Table 5 shows the SGC compaction slope and estimated design AC for each of the SM-2 one-point checks. The data indicated that the fiber stabilizers reduced the gyratory slope and increased the asphalt demand. The estimated design ACs were lower for the modified asphalts (compacted at a higher temperature) than for the AC-20 or AC-30 binder controls. The data indicated that a measure of mixture workability better than the rotational viscometer was needed to determine compaction temperatures. Even though each modifier or stabilizer appeared to require a unique AC, it was decided not to vary the AC% in the field so that the number of variables could be reduced. Therefore, all of the sections, except for the SM-2C section, targeted a 5.3% AC in production. The target was set at 4.9% AC for the SM-2C section.
Figure 2. Comparison of Compaction Curves for Dense-Graded SM-2 Mixtures

11
Table 5. SGC Compaction Slopes and Estimated Asphalt Contents for the Modifiers and Stabilizers in the SM-2 Mixture Design
Modifier or Stabilizer
Compaction Slope Estimated Design %AC
@ 4% Voids AC-20 (section not placed) 8.48 5.38 SM-2C with AC-30 @ 4.9% AC 8.17 5.38 SBS 8.61 5.02 Gelled 8.45 4.66 AB 8.54 4.60 Polyester Fiber 7.89 5.90 Polypropylene Fiber 7.97 5.90
To avoid contamination, a heated valve was installed at the asphalt plant to facilitate
pumping the modified asphalt directly off the heated tankers. This process worked well when the tankers arrived at the appropriate mixing temperatures. The AC-20 and AC-30 binders were pumped directly out of the contractor’s tanks. Samples were taken out of each tanker and the contractor’s tanks for PG grading. The samples were tested by the Federal Highway Administration (FHWA), since VTRC’s PG binder testing laboratory was not yet operational. The results for the modified asphalts are shown in Table 6. A liquid antistripping agent, Kling Beta 2700, was blended in line with all of the binders at an addition rate of 0.5% by weight of binder.
Table 6. Performance Grading of Modified Asphalts
Test SBS AB Gelled Original Binder Viscosity, Pa-s, ASTM D 4402, Brookfield @ 135 °C 2.04 1.18 2.24 Dynamic Shear, G*/sin δ, AASHTO TP5 @ 76 °C 1.68 1.55 1.79 Rolling Thin Film Oven Residue (AASHTO T 240) Mass Loss (%) 0.10 0.12 0.19 Dynamic Shear, G*/sin δ, AASHTO TP5 @ 76.0 °C 3.47 5.90 3.57 Pressure Aging Vessel Residue (AASHTO PP1) Dynamic Shear, G*sin δ, AASHTO TP5 @ 31 °C 12841 2128 1440 Creep Stiffness, MPa, AASHTO TP1 @ -12 °C 2122 136 147 m value, AASHTO TP1 @ -12 °C 0.3362 .302 .358 PG Grade 76-28 76-22 76-22
1Sample tested at 28 °C. 2Sample tested at –18 °C. Construction Details
The mixtures were produced through a plant using a drum manufactured by Standard Havens Inc. Initially, the contractor was concerned that the use of modified binders would damage the plant. He was particularly concerned about the asphalt metering system, a form of a Brody mass flow meter. The in-line trash screen was removed prior to production to prevent clogging by the modifiers. The modified binders were pumped off the tankers at a temperature range from 165 to 192 °C. No unusual variation between the asphalt meter set point and the output was observed.

12
The SM-2A (M) mixture with the SBS PG 76-22 binder did cause the production rate to be decreased from 300 to 245 tons per hour. Production was decreased to protect the drag chain motor. The drag chain transports the mixture from the outlet of the mixing drum to the top of the storage silo. At 245 tons per hour, the drag chain pulled 80 amps. When running conventional mixtures, the contractor stated that the drag chain typically pulled 51 to 52 amps. The red line for the drag chain motor was 90 amps. The SM-12.5 mixture with the SBS PG 76-22 binder also caused an increase in the drag chain motor (69 amps at 250 tons per hour) but not to the same extent as the SM-2A (M) mixture with the SBS PG 76-22 binder. Production was targeted at 300 tons per hour for the other sections. The truck drivers reported problems with the SM-12.5 mixture with the SBS PG 76-22 binder sticking in the truck beds. The plant’s drum was fitted with a special pipe to introduce the fibers in the mixing chamber just prior to the introduction of the AC. Both fibers were metered by weight into the plant. Each fiber manufacturer provided a fiber feeder. Because of the limited tonnage, neither feeder was tied into the plant’s automatic controls. The fiber feeder used for the polyester fibers provided computer software that monitored the feed rate and total pounds of fiber used versus the number of tons produced. The fibers were not sucked into the baghouse and did not clog it. However, the drum lost air availability because of the veil of fibers and had to draft more air. This resulted in blue smoke. The control unit used for the polypropylene fibers was not as sophisticated. Though the feeder introduced the fibers by weight, it did not track the total weight of the fibers introduced. Total fiber weight was determined by counting the number of boxes used. Control was established by having the operator enter the number of pounds per minute. Since the fiber manufacturer’s operator miscalculated this number, only 0.2% instead of the desired 0.3% of the fibers by weight of total mixture was introduced. The same problems occurred with the smoke. Since polypropylene melts at 160 °C, care was taken to keep the mixture between 143 °C and 149 °C. The researcher knows of no method by which an agency can easily measure the fiber content of the finished mixture. Therefore, careful monitoring of the amount of fiber used versus the amount of HMA produced is essential.
RESULTS AND DISCUSSION
AC and Gradation
The AC and gradations for the samples from each test section are shown in Table 7. The samples were arranged so comparisons can be made by mixture type. The mixture variability is generally very good, especially since the contractor was continually switching back and forth between the SM-2 and SM-12.5 gradations. All of the samples are within VDOT’s tolerance for a single test.
13
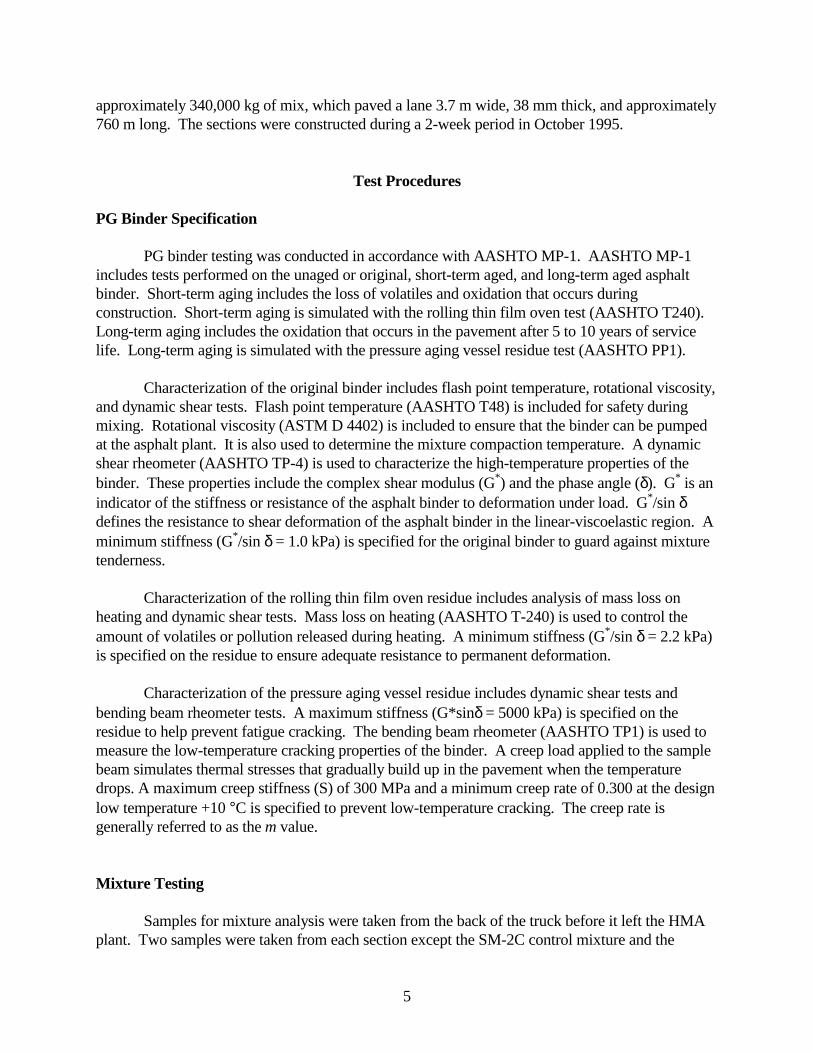
Table 7. Asphalt Contents and Gradations by Mixture Type
Sieve Size (mm) Sample
AC% 12.5 9.5 4.75 2.36 1.18 0.075
SM-2 Design SM-2A (M) SBS -1
5.301 5.17
98 93
85 79
57 52
39 37
NA 27
5.3 4.6
SM-2A (M) SBS -2 5.33 96 83 52 38 28 4.7 SM-2A (S) Polyester Fiber -1 5.47 94 80 54 38 28 4.8 SM-2A (S) Polyester Fiber-2 5.29 95 80 56 40 29 4.9 SM-2A (M) AB-1 5.59 98 85 58 42 30 5.0 SM-2A (M) AB-2 5.23 96 82 55 39 28 4.8 SM-2A (S) Polypropylene -1 5.44 98 88 61 42 31 5.2 SM-2A (S) Polypropylene -2 5.35 97 86 58 41 29 4.7 SM-2C AC-30 4.94 97 84 55 39 29 5.0 SM-2A (M) Gelled -1 5.22 98 83 56 39 29 4.8 SM-2A (M) Gelled -2 5.08 96 83 56 39 28 4.5 SM-12.5 Design 5.30 95 76 45 29 22 4.7 SM-12.5 SBS -1 5.51 96 74 47 32 23 5.8 SM-12.5 SBS -2 5.32 91 66 41 29 21 4.9 SM-12.5 AB-1 5.32 94 75 46 30 22 4.7 SM-12.5 AB-2 5.59 95 80 49 34 24 6.0 SM-12.5 Gelled-1 5.33 95 70 41 28 20 4.3 SM-12.5 Gelled-2 5.26 95 78 48 33 23 5.7 SM-12.5 AC-20 -1 5.32 94 70 42 28 20 4.7
1Design asphalt content for the SM-2C mixture with AC-30 was 4.9%.
Mixture Volumetrics and Field Densities SGC Volumetrics
The mixture volumetrics for the samples from each test section are shown in Table 8. The contractor’s and VTRC’s Gmm values compared very well. The production Gmm values for the SM-2 mixture samples are higher in all cases than the design values. During the design process, VTRC erroneously did not age the rice samples as required by the Superpave mixture design procedure (this was VTRC’s first Superpave mixture design). Aging increases absorption and, therefore, the rice value. All of the samples had low production air-void contents. All of the SM-2 gradation samples failed the Superpave minimum criteria for voids in total mix (VTM) of 14.0% for 12.5-mm NMS mixtures except for the samples from the two fiber sections. Both of the fiber sections indicated increased asphalt demand (and, therefore, higher voids in mineral aggregate [VMA]) during design. Two of seven SM-12.5 sections compacted in VTRC’s laboratory on the Pine SGC also failed the minimum VMA requirement. VTRC’s experience suggests that coarse Superpave mixtures are particularly sensitive to the percentage passing the 2.36- and 0.075-mm sieves. During production, the percentages passing the 2.36-mm sieve were very close to design for both mixtures. The percentages passing the 0.075-mm sieve were lower than the design percentage for the SM-2 samples and slightly higher for the SM-12.5 samples. The voids filled with asphalt (VFA) results for all of the samples exceeded Superpave’s criteria of less than 75% for less than 10 million design equivalent single-axle loads.

14
Table 8. SGC Mixture Volumetrics
Gmm Air Voids (%) VMA (%) VFA (%) Sample Plant VTRC Plant1 VTRC2 Plant VTRC Plant VTRC
SM-2A (M) SBS-1 2.645 2.663 1.9 1.3 13.3 12.6 85.7 89.7 SM-2A (M) SBS-2 2.656 2.650 1.2 1.1 13.3 13 91.0 91.5 SM-2A (S) Polyester Fiber-1 2.646 2.647 3.1 2.4 15.2 16.4 79.6 85.4 SM-2A (S) Polyester Fiber-2 2.663 2.651 3.7 2.8 15.6 16.6 76.3 83.1 SM-2A (M) AB-1 2.636 2.646 1.2 1.1 13.5 13.4 91.1 91.8 SM-2A (M) AB-2 2.656 2.661 1.8 1.4 13.3 12.3 86.5 88.6 SM-2A (S) Polypropylene-1 2.630 2.639 2.4 1.8 14.9 16.2 83.9 88.9 SM-2A (S) Polypropylene-2 2.651 2.645 2.9 2.4 15 16.4 80.7 85.4 SM-2C AC-30 2.674 2.673 NA 2.2 NA 12.8 NA 82.8 SM-2A (M) Gelled-1 2.657 2.653 2.0 1.9 13.9 13.7 85.6 86.1 SM-2A (M) Gelled-2 2.663 2.654 3.6 1.9 15.2 13.7 76.3 86.1 SM-2 Average 2.652 2.653 2.4 1.8 14.3 14.3 83.7 87.2 SM-12.5 SBS-1 2.686 2.695 3.8 0.8 16.2 13.6 76.5 94.1 SM-12.5 SBS-2 2.694 2.700 1.5 0.8 14.1 13.5 89.4 94.1 SM-12.5 AB-1 2.692 2.693 2.0 1.6 14.5 14.1 86.2 88.7 SM-12.5 AB-2 2.658 2.683 2.0 1.1 15 14.3 86.7 92.3 SM-12.5 Gelled-1 2.688 2.682 1.8 1.1 14.6 14 87.7 92.1 SM-12.5 Gelled-2 2.700 2.697 2.0 1.6 14.5 14.1 86.2 88.7 SM-12.5 AC-20-1 2.710 2.691 NA 1.9 NA 14.3 NA 86.7 SM-12.5 Average 2.690 2.692 2.2 1.3 14.8 14.0 85.4 91.0 VMA = voids in mineral aggregate; VFA = voids filled with asphalt. 1Samples were compacted on the Troxler model 4140 gyratory compactor. 2Samples were compacted on the Pine Model AFGC125X gyratory compactor.
The researcher does not believe that differences between design and production gradation
accounted for the decrease in VMA. Instead, the researcher believes that differences may be attributable to the difference between design and production aging. During design, the mixture was aged for 4 hours at 135 °C. During production, the aging period was much shorter, averaging approximately 1 hour. Little material could be stored in the silos due to the changing sections. The haul distance ranged from approximately 7 to 17 km. Additional aging would increase the asphalt absorption (a small effect with this aggregate) and the stiffness of the asphalt binder. The Marshall volumetrics provides further indication that the mixture had not changed from design. In 1996, VDOT changed their Superpave specifications to require a 2-hour aging period at 135 °C. In 1999, AASHTO PP-2 was changed to require a 2-hour aging period at the compaction temperature. These changes have reduced differences between design and production volumetrics. Based on the data in Table 8, the Pine SGC provided more compaction than the Troxler SGC. The Pine SGC averaged 0.6% lower air voids for the SM-2 mixtures and 0.9% lower air voids for the SM-12.5 mixtures. In 1996, the manufacturers made modifications to both units in order to reduce differences in compaction between the units. Subsequent research indicated that these two units provided similar results on laboratory-mixed samples (Maupin, 1998).

15
Marshall Volumetrics
The Marshall volumetric data are shown in Table 9. Only two samples, SM-12.5 SBS-1 and SM-12.5 AB-2, failed VDOT’s air void requirements (3.0% to 6.0%). None of the Marshall samples failed VDOT’s minimum requirements for voids in mineral aggregate (VMA) (15%). Four of 11 SM-2 samples and 4 of 7 SM-12.5 samples failed VDOT’s Marshall flow criteria (2 to 4 mm). Obviously, the SGC provided more laboratory compactive effort than the Marshall hammer at the given compaction levels. It is interesting to note that the Marshall values for the SM-2 mixtures are relatively close to the design parameters whereas the SGC values are significantly lower. Since the ACs and gradations were also close to targets, this further suggests the differences in volumetrics resulted from differences in aging between design and field production.
Table 9. 50-Blow Marshall Volumetric Properties
Sample
Air Voids (%)
VMA (%)
VFA (%)
Stability (N)
Flow (mm)
SM-2A (M) SBS –1 4.0 15.3 74 16622 4.2 SM-2A (M) SBS –2 4.9 16.6 70 16115 4.3 SM-2A (S) Polyester Fiber -1 4.8 16.6 71 14042 4.3 SM-2A (S) Polyester Fiber-2 5.7 16.8 66 14856 4.8 SM-2A (M) AB-1 3.7 15.9 77 15359 3.8 SM-2A (M) AB-2 6.0 16.9 64 17481 3.7 SM-2A (S) Polypropylene -1 4.0 15.5 74 14265 3.9 SM-2A (S) Polypropylene -2 5.1 16.6 69 13375 3.7 SM-2C AC-301 4.0 15.3 74 16088 3.1 SM-2A (M) Gelled –1 6.4 17.0 62 15479 3.4 SM-2A (M) Gelled –2 5.8 16.4 65 15657 4.0 SM-2 Average 4.9 16.3 70 15395 3.9 SM-12.5 SBS –1 2.7 16.5 84 15746 4.8 SM-12.5 SBS –2 3.3 17.1 81 16026 5.0 SM-12.5 AB-1 3.4 16.9 80 15492 3.7 SM-12.5 AB-2 2.7 16.7 84 16836 4.2 SM-12.5 Gelled-1 3.7 17.1 78 14234 4.2 SM-12.5 Gelled-2 3.6 16.4 78 12930 3.5 SM-12.5 AC-20 –1 3.9 17.4 78 11285 3.1 SM-12.5 Average 3.3 16.9 80 14650 4.1
VMA = voids in mineral aggregate; VFA = voids filled with asphalt. 1SM-2C was compacted using 75 blows. Field Densities
The test sections were constructed under a work order with the contractor. Since VDOT had little experience with the modifiers, stabilizers, and Superpave mixtures used on the project, penalties for density requirements were waived. The contractor monitored field densities with 100-mm cores and nuclear density measurements during construction. Cores were not taken from the SM-2C and SM-12.5 AC-20 sections at the time of construction. In July 1999, 150-mm cores were taken from each sample location on the roadway. The pavement had been under traffic for 3 years
16
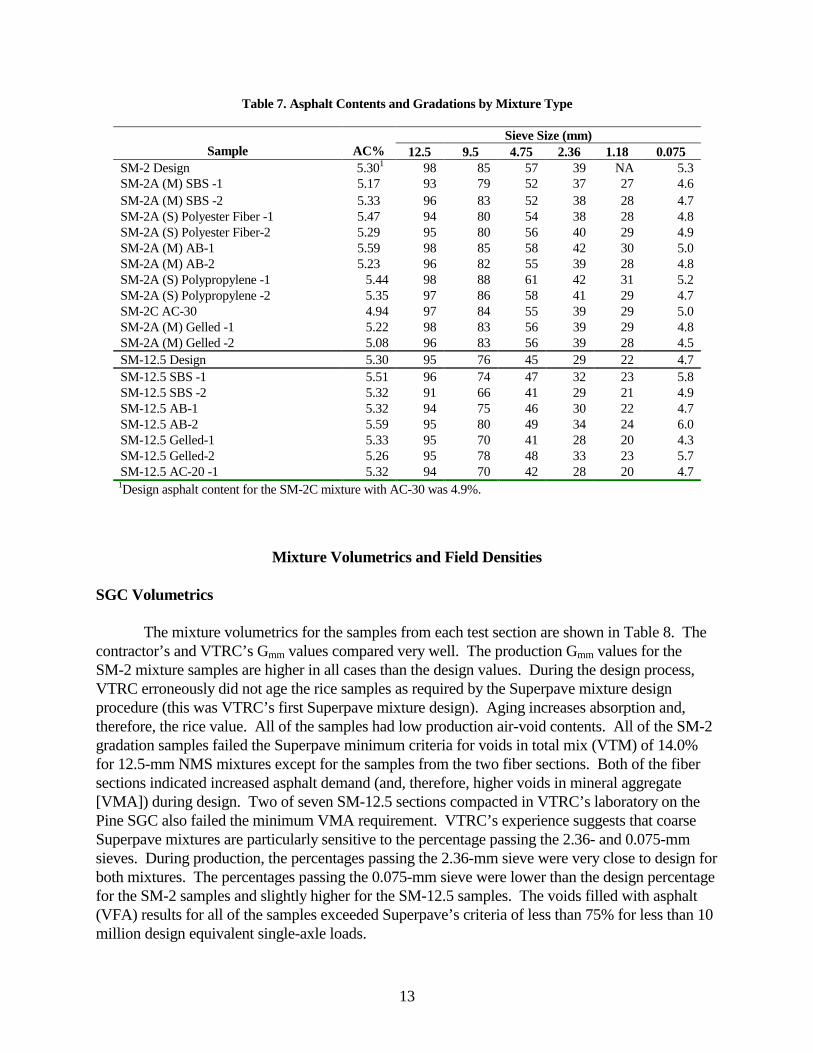
and 9 months at this time. Research indicated that the pavements should reach their ultimate density after the third summer (Cominsky et al., 1994). The construction core densities, 1999 densities, and differences are shown in Table 10. Three of the sections, the SM-2A (S) sections with the polyester and polypropylene fibers and the SM-12.5 gelled section, did not comply with VDOT’s minimum density requirements. If the target AC of the fiber mixtures had been increased to meet the asphalt demand indicated in the design, compaction may have been achieved. Laboratory compaction is supposed to predict the air voids in the pavement after it reaches its terminal density, typically after the third summer (Cominsky et al., 1994). Figure 3 compares the
Table 10. Field Densities (%) at Construction and After 45 Months
Section
Avg. 1995 Construction Core VTM
Avg. 1999 Core VTM
Delta VTM ‘95-‘99
SM-2A (M) SBS 7.03 5.95 1.07 SM-12.5 SBS 7.85 5.75 2.10 SM-2A (S) Polyester Fiber 9.04 7.83 1.21 SM-2A (M) AB 8.07 6.60 1.47 SM-12.5 AB 7.81 5.95 1.86 SM-2A (S) Polypropylene Fiber 9.36 5.27 4.09 SM-2C AC-30 NA 6.64 NA SM-2A (M) Gelled 7.93 5.67 2.26 SM-12.5 Gelled 9.50 6.52 2.98 SM-12.5 AC-20 NA 3.35 NA
VTM = voids in total mix.
Figure 3. Comparison of Laboratory and Field Air Voids

17
laboratory voids at the time of construction as measured by the Pine SGC, Troxler SGC, and 50-blow Marshall design and field voids after almost 4 years of traffic. As may be seen, none of the compaction methods closely approximated field densities. All of the laboratory compaction methods appeared to track one another reasonably well. Regression analysis indicated no correlation between any of the laboratory compaction methods and field densities after traffic. Further, all of the compaction devices underestimated the field air voids.
For a given mixture, laboratory air voids are affected by compaction temperature (higher temperature produces lower air voids) and compaction effort (blows or gyrations). Field air voids are affected by volume of traffic, pavement temperatures, and initial compaction level. Previous work by Maupin (1997) indicated that Virginia’s asphalt pavements did not densify to their design air void levels. This indicates that the laboratory compaction levels may be too high or that the laboratory compaction temperatures were too high for the materials used. In this case, the researcher believes that the laboratory compaction effort was too high for the traffic volume on the test sections to date. This does not mean that the design procedures were flawed, only that the criteria may need to be adjusted. Asphalt mixtures designed with both systems have provided good rut resistance. However, it is possible that the current criteria are too conservative (toward rut resistance) and that lower laboratory compaction efforts might improve durability.
Rut Depth Testing
Field rut depth measurements were taken with a Face Dipstick 2000 in July 1999 after 3 years and 9 months of traffic. The dipstick measures total rut depth based on the assumption that measurements are made with a 2-m straightedge. Field measurement locations corresponded to the locations where mixture samples were taken. The field rut data are shown in Table 11. Based on the yearly average annual daily traffic levels, approximately 2,570,000 equivalent single-axle loads were applied to the sections in the 45 months they have been in service. This value is close to the predictions made during the design. An analysis of variance indicated no difference between the mean rut depths of the sections. All of the sections have been rut resistant in the field, with only the SM-2A (S) polypropylene fiber-2 sample having a rut depth more than 1 mm greater than that of the SM-2C control sample. The SM-12.5 AC-20 section showed some indication of flushing.
The rut resistance of all of the sections was contrary to what would have been expected based solely on the Superpave mixture volumetric properties. Previous work indicated that increasing the high temperature PG grade of a binder, say, increasing a PG 64-22 binder to a PG 76-22 binder, could provide rut resistance at a lower (50-blow Marshall) compaction level (Prowell, 1999b. For these mixtures, it also appears to be true for mixtures containing PG 76-22 binder produced at very low SGC air voids. From the data, it appears that stabilizing agents such as fibers can also provide rut resistance at lower compaction levels. Lower compaction levels allow more asphalt for durability (5.3% AC for the SM-2A and SM-12.5 mixtures versus 4.9% AC for the SM-2C control mixture), and the use of modified PG 76-22 binders or stabilizers provides rut resistance.

18
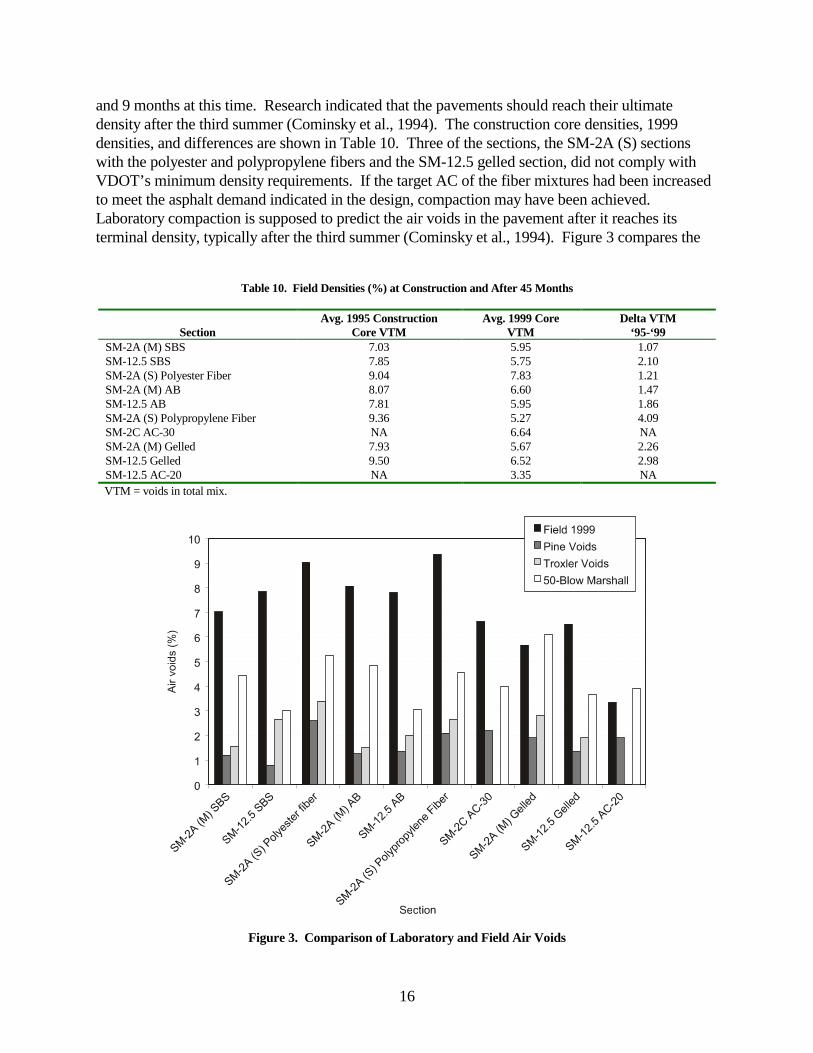
VDOT has been examining the use of loaded-wheel testers for supplementary mixture design analysis (in addition to volumetrics) and quality assurance testing (Prowell, 1999). Laboratory rut depth testing was first performed on the I-66 test section samples with the GLWT using the Georgia Department of Transportation’s criteria. Testing on the I-66 mixtures and other mixtures from around Virginia seemed to indicate that the use of Georgia’s criteria (38 °C test temperature, 445 N vertical load, and 689 kPa hose inflation pressure) did not differentiate between the performance of VDOT’s mixtures. In 1996, material from the I-66 sections was re-tested in the GLWT using Georgia’s proposed criteria (49 °C test temperature, 533 N vertical load, and 830 kPa hose pressure) for polymer-modified mixtures. The GLWT had difficulty maintaining the 49 °C test temperature. Finally, in 1999, retained samples were tested in the APA using what is now VDOT’s standard criteria (49 °C test temperature, 533 N vertical load, and 830 kPa hose pressure) (Prowell, 1999b). Not enough mixture was available to re-test all of the sections. Between 1995 and 1999, the loose mixture was stored in covered cloth bags at VTRC’s research facility. To date, binder testing has not been performed to assess the effects of storage on the mixtures’ rut resistance. Laboratory rut depth measurements and corresponding field total (peak to valley) rut depth measurements are shown in Table 11. The GLWT data using both test criteria and the APA data indicated that the mixtures should be rut resistant. This corresponds to the field performance to date. Figure 4 shows the relationship between laboratory and field rut depths. Regression analysis was performed using the loaded-wheel tester rut depths as predictors (independent variable) for the field rut depths. The R2 value for the GLWT data collected at 38 °C was 22.9%. The R2 value for the GLWT data collected at 49 °C was 1.4%. The R2 for the APA data collected at 49 °C was 17.5%. Previous research on samples taken from WesTrack indicated an R2 of 80.8% for downward rut depth and an R2 of 82.3% for total rut depth (FHWA, 1999; Prowell, 1998; Williams & Prowell, 1999).
Table 11. Average Field and Laboratory Rut Depths (mm) from the GLWT and APA
Sample Field GLWT @ 38 °°°°C GLWT @ 49 °°°°C APA @ 49 °°°°C SM-2A (M) SBS-1 1.09 0.47 1.40 0.59 SM-2A (M) SBS-2 2.11 1.12 1.68 NA SM-12.5 SBS-1 3.02 0.68 1.39 0.96 SM-12.5 SBS-2 2.80 0.75 1.46 0.96 SM-2A (S) Polyester Fiber-1 2.23 0.94 NA 1.39 SM-2A (S) Polyester Fiber-2 0.88 1.03 2.03 0.96 SM-2A (M) AB-1 2.70 0.48 0.70 NA SM-2A (M) AB-2 2.02 0.78 0.85 0.97 SM-12.5 AB-1 1.29 0.78 1.37 0.87 SM-12.5 AB-2 2.37 0.76 2.59 NA SM-2A (S) Polypropylene-1 1.68 1.82 4.65 1.67 SM-2A (S) Polypropylene-2 4.40 2.16 2.30 1.41 SM-2C AC-30 2.60 1.13 2.52 NA SM-2A (M) Gelled-1 2.05 0.79 1.47 NA SM-2A (M) Gelled-2 2.27 0.63 1.82 0.99 SM-12.5 Gelled 1 3.04 1.19 1.00 1.28 SM-12.5 Gelled 2 2.90 0.73 1.30 0.78 SM-12.5 AC-20 –1 3.45 2.56 1.55 1.56
19
Figure 4. Comparison of Laboratory and Field Rut Depths A number of factors may contribute to the poor correlations between the rut testers and field
performance for the I-66 sections. The main reason is probably that there was very little differentiation between the performance of the I-66 sections. All of the sections were rut resistant. The field rut depths ranged from 6.2 to 34.6 mm at WesTrack after 582,000 equivalent single-axle loads, whereas the field rut depths on I-66 ranged from only 0.88 to 4.40 mm after 2,570,000 equivalent single-axle loads. The samples from WesTrack were cut out of the pavement, whereas the GLWT and APA samples were compacted with a rolling-wheel compactor and vibratory compactor, respectively. Compaction method was shown to influence rut depth in an APA ruggedness study. Finally, it is difficult to assess the effect of aging on the loose mixture stored for 45 months prior to APA testing. The increased scatter of the GLWT data at 49 °C is probably related to the inability of the unit to hold a constant test temperature.
Field Performance
The field performance of the sections is being monitored by two methods: automated evaluations derived from videotapes of distress or by laser sensors and visual evaluations by the researcher. VDOT developed four indices for its automated pavement management ratings: the load-related distress index (LDR), non-load related distress index (NDR), pavement ride index (PRI), and combined condition index (CCI) (VDOT, 1998). LDR consists of alligator cracking, longitudinal cracking in wheel paths, potholes, delaminations, patching, and rutting. NDR consists of block cracking, patching, longitudinal cracking out of the wheel path, transverse cracking, and reflection cracking. PRI is equivalent to the international roughness index. CCI is the lowest of LDI, NDI, and PRI. All three indices are based on a scale of 1 to 100. An LDR or NDR of 100 indicates a pavement with no discernable load-related or non-load-related distresses, respectively. A PRI of 100 indicates a pavement with approximately the minimum achievable roughness. During the 1998 evaluation, all of the sections had an LDR of 99, an NDR of 99, and a PRI of 97.
20
These values indicate that the pavement is in excellent shape. In fact, the contractor won the district’s maintenance paving award for the project for the 1995 construction season. Visual observations by the researcher noted additional defects. Raveling, in the form of loss of fines, was consistently observed in the SM-2A (M) SBS and SM-12.5 SBS sections. Less frequent observations of raveling and instances of moisture-related flushing were observed in the SM-12.5 gelled section. Raveling in the form of loss of fines was also observed in the SM-2C control sections and the adjoining SM-2C lane. When cores were taken, the cores from both fiber sections had the best bond with the substrate. Moisture damage was indicated in the substrate of the other sections. The original surface of the pavement was an open-graded friction course. This course was milled off prior to overlay. The pavement was open to traffic prior to the overlay being placed, which should have helped to remove any stripped scabs of the original surface layer. VDOT has had problems with moisture damage in other pavements previously surfaced with open-graded friction courses. Flushing was also observed in the wheel paths of the SM-12.5 AC-20 section.
SUMMARY
Design work with the SGC on the SM-2 mixtures indicated different ACs for the different modifiers and stabilizers even though the recommended compaction temperatures were used. This suggests that a better measure of workability is needed for HMA to determine the optimum compaction temperature.
No consistent differences were observed between the rutting performance of the sections using the SM-2 gradation, which passes through the restricted zone, and the sections with the SM-12.5 gradation, which goes well below (coarse side) the restricted zone. Current VDOT Superpave specifications allow one of three trial gradations to pass through the restricted zone. These gradations may be rut tested with the APA during the design verification or trial section process.
All of the sections are rut resistant to date. The SM-12.5 AC-20 section shows signs of
flushing in the wheel paths. This may be expected since the mixture was produced at very low air voids without a modifier or stabilizer. No differences have been observed between the fatigue or non-load-related distress performance of the sections at this time. The fiber sections appear to have a lower susceptibility to moisture damage than the modified sections. The AB sections are performing better than the other modified sections in terms of apparent moisture damage. The sections will continue to be monitored over their life spans.
The fiber (stabilizer) sections have performed as well as the modified sections to date. The
slightly deeper rut depths in the polypropylene fiber sections may be attributable to the lower-than-expected fiber dosage (0.2% instead of 0.3%). The use of fibers may be advantageous in particular instances where limited quantities of highly rut-resistant HMA are needed, say, for an intersection, particularly if the mixture is produced through a batch plant. The researcher is still concerned about

21
the inability of the agency to monitor a consistent fiber dosage in the finished HMA. This may be possible through computerized monitoring of the amount of fiber used versus the amount of HMA produced.
The three modifiers used in the I-66 test section, SBS, AB, and gelled, complied with
specifications for a PG 76-22 binder. In this application, the modifiers are performing equally well. Under these traffic conditions, the PG 76-22 binder produced using AB or chemical gelling as the modifier appears to provide rut resistance equal to that of the more expensive PG 76-22 binder produced with SBS polymer. The PG specification is appropriate for specifying modified asphalts for rut resistance. Additional monitoring will be required to assess whether the modifiers provide the same resistance to cracking. Additional sections should be constructed to evaluate the ability of each modifier to resist fatigue cracking and possibly rut resistance under slow-moving traffic conditions.
None of the laboratory compaction methods predicted ultimate field density. The 50-blow
Marshall samples were generally within VDOT’s production tolerances when 4.5% air voids were targeted in the design. The SGC samples generally failed air void requirements on the low side. The SM-2 gradation SGC samples also generally failed the minimum VMA requirements. Even so, the sections were rut resistant in the field. Interestingly, the SM-12.5 AC-20 section, which showed indications of flushing in the wheel path, did not have the lowest SGC or Marshall air voids. Current research is looking at lowering the SGC compaction levels. Lowering compaction levels would provide slightly more AC in the mixture and make the minimum VMA requirements more reasonable. VDOT’s 2000 Superpave specifications reflect some of these changes. Overall, the researcher feels that the SGC is the far superior compaction method, once the proper compaction levels have been established. The SGC seems to be more sensitive to changes in aggregate gradation and shape.
The concept of using lower laboratory compaction (50 blows instead of 75 blows) to
promote durability in conjunction with increasing the high-temperature binder stiffness (a PG 76-22 binder instead of a PG 64-22 binder) to provide for rut resistance was validated. The researcher does not necessarily condone producing VDOT’s SM-12.5 D mixtures, which share the same SGC compaction level (Nmax = 152) as the I-66 test sections, at the same low laboratory air void levels seen in the test sections, since SM-12.5D specifies only a PG 70-22 binder.
Both the GLWT and the APA indicated that the mixtures would be rut resistant. However,
neither device accurately predicted field rut depths. The poor correlations probably resulted from the narrow range of the data. The rutting in both the field and the laboratory test specimens may be so small as to be overshadowed by the variability of the test procedures.
CONCLUSIONS • A better method of determining compaction temperatures for modified binders is required.
22
• The compaction level of the SGC provides more laboratory compaction than a 50- or 75-blow Marshall design.
• Mixtures passing through the restricted zone performed as well as mixtures passing below the
restricted zone. • A PG 76-22 binder can be used to produce rut-resistant mixtures at low SGC air voids using the
original (1994) Superpave compaction levels. Conceptually, this means one should be able to reduce the laboratory compaction effort to enhance durability while maintaining rut resistance with binder stiffness. (This is the concept outlined for Marshall mixtures in VDOT’s special provision for modified and stabilized mixtures.)
• The three methods of modification tested, i.e., SBS, AB, and gelled, provided equal rut
resistance in the field. The current binder tests adequately identify rut resistance for fast-moving traffic.
• The GLWT and APA can both be used to indicate the rut resistance of a mixture.
RECOMMENDATIONS • Attempt to incorporate fibers into the Superpave design system.
• Allow mixtures to pass through the restricted zone. These mixtures should be evaluated using the APA. (VDOT has already implemented this recommendation.)
• Conduct additional research to evaluate the concept of lowering decreasing gyrations to
enhance durability while maintaining rut resistance with binder stiffness. (VDOT has already implemented this recommendation.)
ACKNOWLEDGMENTS
The author thanks Charlie Robson, the former District Materials Engineer for Northern
Virginia District, for agreeing to use his pavement as a test section and allocating funding and Robert Wilson from VDOT for helping to collect data about the pavement. The author greatly appreciates the hard work and hospitality of Branscome Paving Company, especially that of Mike Arceneaux, Kim Wilson, and David Branscome. The author thanks Richard Schreck of the Virginia Asphalt Association and Bob Horan, formerly of VDOT (currently of the Asphalt Institute), for their assistance in arranging for the test sections. The author appreciates the cooperation of Chuck Paugh of the Federal Highway Administration for arranging for binder testing. Finally, the author greatly appreciates Donnie Dodds and Mike Dudley of VTRC for their many long hours of testing.
23
REFERENCES American Society of Testing and Materials. (1998). Annual Book of Standards. (Volume 04.03).
Philadelphia: Author. American Association of State Highway and Transportation Officials. (1997). Standard
Specifications for Transportation Materials and Methods of Sampling and Testing, ed. 18. Washington, DC: Author.
American Association of State Highway and Transportation Officials. (1998). AASHTO Provisional Standards. Washington, DC: Author. Cominsky, R., Leahy, R. B., & Harrigan, E. T. (1994). Level One Mixture Design: Materials Selection, Compaction and Conditioning. (SHRP-A-408). Washington, DC: Strategic Highway Research Program, National Research Council. Federal Highway Administration. (1998). LTPPBIND, Version 2.0. Washington, DC: Author. Federal Highway Administration. (1999). Performance of Coarse-Graded Mixes at Westrack-
Premature Rutting. Washington, DC: Author. Georgia Department of Transportation. (1997). Method of Test for Determining Rutting Susceptibility Using the Asphalt Pavement Analyzer, GDT-115. Forest Park: Author. Kennedy, T. W., Huber, G. A., Harrigan, E. T., Cominksy, R. J., Hughes, C. S., VonQuintus, H., &
Moulthrop, J. S. (1994). Superior Performing Asphalt Pavements (Superpave): The Product of the SHRP Asphalt Research Program. (SHRP-A-410). Washington, DC: Strategic Highway Research Program, National Research Council.
Maupin, G. W., Jr. (1997). Follow-up Field Investigation of the Effectiveness of Antistripping
Additives in Virginia. (VTRC Report No. 97-TAR6). Charlottesville: Virginia Transportation Research Council.
Maupin, G. W., Jr. (1998). Comparison of Several Asphalt Design Methods. (VTRC Report No.
98-R15). Charlottesville: Virginia Transportation Research Council. Prowell, B. D. (1998). Evaluation of WesTrack Field Samples With the Asphalt Pavement Analyzer. The Tracker, Vol. 1, No. 1. Prowell, B. D. (1999a). Development of Rutting Criteria for the Asphalt Pavement
Analyzer. (CD-ROM). Proceedings of the 1999 International Conference on Accelerated Pavement Testing, University of Nevada, Reno.

24
Prowell, B. D. (1999b). Selection and Evaluation of Performance-Graded Asphalt Binders for Virginia. (VTRC Report No. 99-R21). Charlottesville: Virginia Transportation Research Council.
Task Force 31, AASHTO-AGC-ARTBA Joint Committee, Subcommittee on New Highway
Materials. (1992). Guide Specifications for Polymer Modified Asphalt. Virginia Department of Transportation. (1998). A Guide to Evaluating Pavement Distress Through the Use of Video Images. Richmond: Author. White, T. D., Huang, H., & Montgomery, J. (1999). Effect of Fibers on HMA Performance. (Preprint). 1999 Annual Meeting of the Transportation Research Board, Washington, DC. Williams, R. C., & Prowell, B. D. (1999). Comparison of Laboratory Wheel Tracking Results to WesTrack Performance. Transportation Research Record 1681. Transportation
Research Board, Washington, DC.