interim report (d3) smart 2010/0042 - rand corporation
TRANSCRIPT
SMART TRASH: Study on RFID tags and the recycling industry Interim Report (D3) SMART 2010/0042
RAND Europe, Institut für Aufbereitung und Recycling RWTH Aachen University (I.A.R.), P3 INGENIEURGESELLSCHAFT (P3)
WR-922
February 2012
Prepared for the European Commission DG Information Society and Media to inform policymaking on RFID and the Internet of Things (Unit D4)
WORK ING P A P E R
This product is part of the RAND Europe working paper series. RAND working papers are intended to share researchers’ latest findings and to solicit informal peer review. They have been approved for circulation by RAND Europe but have not been formally edited or peer reviewed. Unless otherwise indicated, working papers can be quoted and cited without permission of the author, provided the source is clearly referred to as a working paper. RAND’s publications do not necessarily reflect the opinions of its research clients and sponsors.
is a registered trademark.
This study has been carried out for the Directorate-General Home Affairs in the European Commission as result of the procurement procedure SMART N°2010 /0042 - 2010/S 75-111252 for an amount of 574,445€. The report expresses the opinion of RAND Europe, P3 Ingenieurgesellschaft and I.A.R. Aachen University who performed the study. These views have not been adopted or in any way approved by the European Commission and should not be relied upon as a statement of the European Commission's or the DG INFSO’s views. The European Commission does not guarantee the accuracy of the information given in the study, nor does it accept responsibility for any use made thereof. Copyright in this study is held by the European Communities. Persons wishing to use the contents of this study (in whole or in part) for purposes other than their personal use are invited to submit a written request to the following address:
European Commission DG Information Society and Media INFSO-D4 (BU-25 – 3/106) 1-3 Avenue du Bourget B -1140 Brussels
RAND Europe, I.A.R. and P3 Contract reference 30-CE-0395435/00-31
iii
Preface
This document is the interim report for a study entitled RFID tags and the Recycling Industry undertaken jointly by RAND Europe, the Department of Processing and Recycling (I.A.R.)1 at RWTH Aachen University and P3 Ingenieurgesellschaft (P3).
Specific aim of the study The study, funded by the EC, aims to obtain expert input necessary for (1) assessing the environmental impact of RFID tags and (2) assessing the environmental advantages that RFID can provide for product lifecycle management. An integral part of the study is to identify the associated obstacles and needs for policy action and/or research activity.
To accomplish these objectives, the study applies a number of different quantitative and qualitative methodologies, including a systematic literature review, key informant interviews, case studies, stakeholder analysis, use cases and case study analysis, as well as survey and scenario building.
Scope of this interim report The Interim Report (D3) presents the preliminary findings of the research, building on the systematic literature review, key informant interviews (expert consultations), use cases and case study analyses conducted in the initial phase of the study (February–December 2011).
The document has been peer-reviewed in accordance with RAND’s quality assurance standards by Prof. Jan Gronow, and has received constructive feedback and comments from Mr. Gérald Santucci (Head of Networked Enterprise and Radio Frequency Identification (RFID) Unit at the EC DG Information Society and Media) and his colleague Mr. Florent Frederix (Head of RFID Sector).
In February 2012, upon approval, the interim report will be made available on the EC website and the project website at http://rfid-waste.ning.com. It will provide the basis for discussion in the upcoming phase of the project, the public consultation.
The public consultation will take place between February and July 2012. It is meant to facilitate interaction with and among experts and relevant stakeholders. It is supported by an online forum/wiki, a survey, a scenario gaming workshop (28 February 2012) and a final workshop/conference (with a tentative date of 11 July 2012).2 The survey will be
1 Institut für Aufbereitung und Recycling, which translates as “Department of Processing and Recycling”
2 The post-workshop reports (D4) are to be finalised within one month – by 28 March 2012 and 11 August 2012
SMART TRASH: Study on RFID tags and the recycling industry RAND Europe, I.A.R. and P3
Contract reference 30-CE-0395435/00-31
iv
launched after the workshop and will include questions to the community arising from the interim report and the workshop. The survey will be open for eight weeks (29 February 2012 – 30 April 2012) and aims to seek out additional opinions as a follow-up to the workshop.
The Public Consultation Report (D4) will incorporate results from the online discussion and present responses to the survey, including an overview of the level of response and composition of response across stakeholder groups.
Findings will be incorporated and presented in the Final Report (D5) due on 1 July 2012.
For more information RAND Europe is an independent not-for-profit policy research organisation that aims to improve policy- and decision-making in the public interest, through research and analysis. RAND Europe’s clients include European governments, institutions, NGOs and firms with a need for rigorous, independent, multidisciplinary analysis.
The research staff for this project are uniquely qualified, thanks to their track record in RFID technology and recycling and their in-depth understanding of the EU policy environment. Their independence gives them the objectivity required to conduct this work free from commercial interests in the development of RFID technology and specific applications in the recycling sector.
For more information about the study and this document, please contact Helen Rebecca Schindler at:
RAND Europe Westbrook Centre Milton Road Cambridge CB4 1YG United Kingdom Tel. +44 (1223) 353 329 [email protected]
RAND Europe, I.A.R. and P3 Contract reference 30-CE-0395435/00-31
v
Contents
Preface ........................................................................................................................ iiiTable of Figures ........................................................................................................... ixTable of Tables ..........................................................................................................xiiiAbbreviations .............................................................................................................. xvAcknowledgements .................................................................................................... xix
CHAPTER 1 Introduction ......................................................................................... 21Policy Problem ................................................................................................ 22
SMART TRASH: Part A ............................................................................................ 27
CHAPTER 2 A technical primer on RFID: tags, compositions, recyclability and forecasts ................................................................................................ 29
2.1 Definition of RFID tags .................................................................................. 292.2 Types of RFID tags ......................................................................................... 312.3 Passive and active RFID tags ........................................................................... 322.4 Research aspects .............................................................................................. 352.5 The composition of RFID tags ........................................................................ 36
2.5.1 Setting the scope ................................................................................ 362.5.2 RFID production and material composition ...................................... 382.5.3 Structural design of passive RFID labels (HF/UHF) .......................... 392.5.4 Market estimates for RFID tags in the EU 27 .................................... 41
2.6 The recyclability of RFID tags ......................................................................... 44
CHAPTER 3 The background context for assessing the impacts of RFID technology ............................................................................................ 55
3.1 EU waste management legislation and interactional aspects of the presence of RFID tags ..................................................................................... 563.1.1 Strategic approach: The 6th Environmental Action Programme ......... 573.1.2 Directives and other legislative approaches ......................................... 58Main regulatory frameworks ............................................................................ 58Legislation relevant to waste treatment operations ........................................... 59Regulations for specific waste streams .............................................................. 59
3.2 RFID tags in context with the legislation ......................................................... 613.3 Waste treatment technologies .......................................................................... 64
SMART TRASH: Study on RFID tags and the recycling industry RAND Europe, I.A.R. and P3
Contract reference 30-CE-0395435/00-31
vi
3.4 A clustering system of Member States .............................................................. 66
CHAPTER 4 RFID tags in the waste processing industry .......................................... 694.1 Interaction between RFID tags and waste treatment processes ......................... 69
4.1.1 Waste sources and the impact of RFID tags ....................................... 704.1.2 Waste objects and RFID tags: single material objects and
complex objects .................................................................................. 744.2 The impact of RFID tags on waste collection processes .................................... 754.3 The impact of RFID tags on different waste processing systems ....................... 76
4.3.1 Mechanical-biological waste treatment (MBT) ................................... 774.3.2 Material recovery facilities (MRFs) ..................................................... 794.3.3 Thermal treatment ............................................................................. 82
4.4 Final disposal at landfills .................................................................................. 864.5 Recycling and the impact of RFID tags in different waste streams .................... 88
4.5.1 Metals ................................................................................................ 884.5.2 Glass .................................................................................................. 934.5.3 Plastics ............................................................................................... 954.5.4 Paper .................................................................................................. 994.5.5 Beverage cartons ............................................................................... 102
4.6 Subsidiary purification phase ......................................................................... 1044.6.1 Waste electric and electronic equipment (WEEE) ............................ 1044.6.2 End-of-life vehicles (ELVs) ............................................................... 106
CHAPTER 5 Conclusions on the impacts on waste treatment technologies and implications for national waste systems .............................................. 109
5.1 Results from modelling and forecasting ......................................................... 1105.1.1 Forecast ............................................................................................ 1105.1.2 Modelling ........................................................................................ 111
5.2 Environmental impacts .................................................................................. 1175.3 Technical impacts .......................................................................................... 1215.4 Economic impacts ......................................................................................... 1245.5 Regulatory and policy impacts at EU and national levels ................................ 1245.6 Implications for national waste systems and stakeholders ............................... 125
SMART TRASH: Part B ......................................................................................... 127
CHAPTER 6 Assessment of current and potential use of RFID as a green technology in recycling ....................................................................... 129
6.1 Understanding the present state of play ......................................................... 1296.1.1 RFID as a green technology ............................................................. 130
6.2 Potential areas of green RFID applications ..................................................... 1316.2.1 Overview of use cases and case studies .............................................. 132
6.3 Assessing the use of RFID .............................................................................. 1336.3.1 Use case assessments ......................................................................... 136
RAND Europe, I.A.R. and P3 Contents
Contract reference 30-CE-0395435/00-31
vii
6.3.2 Case study selection ......................................................................... 1386.3.3 Case study assessments ..................................................................... 138
CHAPTER 7 RFID as a green technology: use case analysis ..................................... 1417.1 Use case analyses and preliminary findings .................................................... 141
7.1.1 Pay-as-you-throw (PAYT) ................................................................ 1417.1.2 RFID-based filling level measurement .............................................. 1477.1.3 RFID-based waste sorting ................................................................ 1497.1.4 Consumer purchase decision support based on environmental
performance ..................................................................................... 1537.1.5 RFID-based disposal decision support (sell, donate, repair,
dispose) ............................................................................................ 1577.1.6 RFID-based WEEE end-of-life processes ......................................... 1607.1.7 RFID-based ELV end-of-life processes ............................................. 1647.1.8 RFID-based disposal management of healthcare waste ..................... 1687.1.9 RFID use cases privacy assessment ................................................... 171
7.2 Use case conclusions ...................................................................................... 1727.2.1 Emerging themes across the use cases ............................................... 172
CHAPTER 8 Case studies of RFID as a green technology ........................................ 1778.1 Case study 1: WEEE ..................................................................................... 1788.2 Case study 2: Consumer purchase decision support/carbon footprinting ....... 1918.3 Case study conclusions .................................................................................. 201
CHAPTER 9 Interim conclusions and next-phase issues .......................................... 2059.1 Challenges and opportunities arising from RFID tag use ............................... 2059.2 RFID tag functionality as green technology ................................................... 207
9.2.1 Improved consumer decision-making ............................................... 2079.2.2 Improved disposal behaviour ............................................................ 2089.2.3 Improved reuse, processing, recycling and disposal ........................... 2099.2.4 Environmental benefits beyond recycling ......................................... 2109.2.5 Better data = smarter policy and better decisions .............................. 210
9.3 RFID as part of smart systems ....................................................................... 2109.3.1 RFID in the broader economy ......................................................... 2109.3.2 Governance opportunities and challenges ......................................... 2129.3.3 The social environmental ecosystem ................................................. 2139.3.4 RFID tags as part of integrated smart product systems ..................... 214
9.4 Concluding remarks ...................................................................................... 214
REFERENCES ........................................................................................................ 215Reference list ........................................................................................................... 217
ANNEX ........................................................................................................... 229Annex: Estimations for the modelling of waste streams in EU Member States .......... 231

RAND Europe, I.A.R. and P3 Contract reference 30-CE-0395435/00-31
ix
Table of Figures
Figure 1. Outline Part A – Environmental impact of RFID as inert objects.................... 25 Figure 2. Outline Part B – Assessment of RFID as a green technology ........................... 26 Figure 3. Basic layout of an RFID data-carrying device, the transponder and other
main components of an RFID system ............................................................. 30 Figure 4. Overview of the most important auto-ID procedures ...................................... 30 Figure 5. The features of RFID systems ......................................................................... 31 Figure 6. Layers of common inlay and label types .......................................................... 39 Figure 7. Layers of a wet paper label from Tageos .......................................................... 41 Figure 8. Calculation steps for the derivation of the relevant RFID tag numbers for
Europe ............................................................................................................ 42 Figure 9. Relevant passive tag numbers per application area for Europe (including
consumer goods) ............................................................................................. 42 Figure 10. Relevant passive tag numbers per application area for Europe (excluding
consumer goods) ............................................................................................. 43 Figure 11. Relevant passive tag numbers for Europe/technological development
scenarios ......................................................................................................... 43 Figure 12. RFID tags with Al aerials and paper faces ....................................................... 47 Figure 13. RFID tags with Al aerials and PP faces ........................................................... 48 Figure 14. RFID tags with Cu aerials and paper faces ..................................................... 49 Figure 15. RFID tags with Cu aerials and PP faces .......................................................... 50 Figure 16. RFID tags with Ag aerials and paper faces ...................................................... 51 Figure 17. RFID tags with Ag aerials and PP faces .......................................................... 52 Figure 18. Structure of better regulation strategies and waste management
legislation in the EU ....................................................................................... 57 Figure 19. Waste hierarchy and priority order according to Directive 2008/98/EC ......... 58 Figure 20. RFID technology in context with waste management legislation .................... 64 Figure 21. Succession of operations in waste management .............................................. 64 Figure 22. Waste management system of the UK ............................................................ 67 Figure 23. Allocation of the waste treatment processes in EOL phases ............................. 73 Figure 24. Qualitative relation between the homogeneity, the required product
quality and the necessary treatment efforts ...................................................... 74 Figure 25. Waste management collection logistics ........................................................... 76 Figure 26. The use of MBT technology in Europe 2006 ................................................. 77 Figure 27. Basic scheme of an MBT plant ....................................................................... 78 Figure 28. Basic scheme of an MRF ................................................................................ 80

SMART TRASH: Study on RFID tags and the recycling industry RAND Europe, I.A.R. and P3
Contract reference 30-CE-0395435/00-31
x
Figure 29. Exemplified advanced scheme of a light packaging waste sorting plant ........... 81 Figure 30. Incinerated waste in the EU-27 by waste category in 2008 ............................. 83 Figure 31. Amount of generated and incinerated waste in the EU-27 (1999–2009) ........ 84 Figure 32. Residues of waste incineration processes ......................................................... 85 Figure 33. MSW disposal in landfills 1995–2009 ............................................................ 87 Figure 34. Treatment of ferrous metal waste ................................................................... 89 Figure 35. Separation of non-ferrous metals .................................................................... 90 Figure 36. Treatment of non-ferrous metals in the aluminium route ............................... 91 Figure 37. Flow sheet for the recovery of non-ferrous and precious metals in
primary and secondary copper mills ................................................................ 92 Figure 38. Treatment of waste glass with conventional and sensor-based treatment
steps ................................................................................................................ 94 Figure 39. Plastic demand in Europe 2010 by polymer ................................................... 95 Figure 40. Plastic demand in Europe according to segment ............................................. 96 Figure 41. Length of the chain according to the heterogeneity of the collected waste
streams ............................................................................................................ 97 Figure 42. Exemplified process chain for the separation and recycling of mixed
collected light packaging waste to plastic recyclate ........................................... 98 Figure 43. Scheme for the EOL phase of paper waste .................................................... 101 Figure 44. Treatment of beverage cartons ...................................................................... 103 Figure 45. Treatment of WEEE .................................................................................... 105 Figure 46. ELV processing chain ................................................................................... 107 Figure 47. Decision tree to derive recommendations ..................................................... 110 Figure 48. Development of passive tag application depending on technical
development ................................................................................................. 111 Figure 49. Forecast Germany (medium scenario) .......................................................... 112 Figure 50. Relative distribution of RFID tags between the different treatment paths
in Germany (medium scenario) ..................................................................... 113 Figure 51. Comparison of total RFID tag distribution into waste treatment paths
for one country per country cluster ............................................................... 114 Figure 52. Comparison of modelled relative RFID tag distribution into waste
treatment paths ............................................................................................. 114 Figure 53. Future projections of absolute RFID tag numbers in waste treatment
paths in the UK ............................................................................................ 115 Figure 54. Future projections of absolute RFID tag numbers in waste treatment
paths in Greece ............................................................................................. 116 Figure 55. Future projections of relative RFID tag numbers in waste treatment
paths in the UK ............................................................................................ 116 Figure 56. Future projections of relative RFID tag numbers in waste treatment
paths in Greece ............................................................................................. 117 Figure 57. Relation between cluster and direction of RFID tags into waste
treatment systems .......................................................................................... 117 Figure 58. CO2 inventory in the EU-27 in the medium scenario .................................. 118 Figure 59. CO2 inventory of metals contained in disposed RFID tags in Germany
(medium scenario, tag size 2219 mm²) .......................................................... 119
RAND Europe, I.A.R. and P3 Table of Figures
Contract reference 30-CE-0395435/00-31
xi
Figure 60. CO2 inventory of metals contained in disposed RFID tags in the UK (medium scenario, tag size 2219 mm²) ......................................................... 119
Figure 61. CO2 inventory of metals contained in disposed RFID tags in Greece (medium scenario, tag size 2219 mm²) ......................................................... 120
Figure 62. Interrelations between different stages of waste treatment ............................. 122 Figure 63. Challenges of resource recovery for “green” technology applications of
RFID ............................................................................................................ 131 Figure 64. Derivation of use cases for tagged products .................................................. 134 Figure 65. Derivation of use cases for RFID-tagged infrastructure................................. 135 Figure 66. Issue and stakeholder analysis in relation to lifecycle phase ........................... 136 Figure 67. Y-matrix structure of stakeholder and impact analysis results ........................ 137 Figure 68. Intersection C of impact matrix ................................................................... 137 Figure 69. Use case expert evaluation ............................................................................ 138 Figure 70. Principal PAYT implementation alternatives ................................................ 143 Figure 71. Tension field of use case expert evaluation ................................................... 178 Figure 72. Overview of the WEEE case study cause and effect net ................................ 179 Figure 73. WEEE cause and effect description merging into target of sustainable
development ................................................................................................. 183 Figure 74. WEEE cause and effect description setting reuse of EEE into focus .............. 184 Figure 75. WEEE cause and effect description setting manufacturer-specific
allocation of disposal cost into focus ............................................................. 184 Figure 76. WEEE cause and effect description resulting from (RFID-based)
recycling rate monitoring .............................................................................. 185 Figure 77. WEEE cause and effect description setting the recycling rate as key lever
into focus ...................................................................................................... 186 Figure 78. WEEE interaction loop balancing eco-design and recycling rate (follow
blue highlighted path) ................................................................................... 186 Figure 79. WEEE interaction loop reinforcing the use of RFID as a result of
resource scarcity and raw material prices (follow red highlighted path) .......... 188 Figure 80. Evaluation matrix of WEEE factors backing recycling rate and reuse of
WEEE as positive reinforced factors (short-term perspective) ........................ 189 Figure 81. Evaluation matrix of WEEE factors backing resource scarcity and raw
material prices as critical reinforced factors (mid-term perspective) ............... 190 Figure 82. Overview of CPDS case study cause and effect net ....................................... 194 Figure 83. CPDS cause and effect description aiming for the reduction of carbon
resulting both from use of RFID for consumer information access and as a means to optimise logistics ......................................................................... 195
Figure 84. CPDS cause and effect description setting eco-design into focus .................. 196 Figure 85. CPDS cause and effect description setting use of RFID at item level into
focus ............................................................................................................. 196 Figure 86. CPDS cause and effect description showing mobile and fixed
infrastructure as key enablers ......................................................................... 197 Figure 87. CPDS interaction loop showing the mutual reinforcing of RFID usage
and consumer requirement in the context of an eco-friendly product (follow red highlighted path) ........................................................................ 198
SMART TRASH: Study on RFID tags and the recycling industry RAND Europe, I.A.R. and P3
Contract reference 30-CE-0395435/00-31
xii
Figure 88. Complex CPDS interaction loop depicting the strong interaction and dependence of involved stakeholders (follow red highlighted path) ................ 199
Figure 89. Evaluation matrix of CPDS factors backing the consumer’s key relevance to the success of CPDS .................................................................................. 200
Figure 90. Evaluation matrix of CPDS factors depicting, for example, the leverage of global RFID application topics as key for CPDS........................................ 201
RAND Europe, I.A.R. and P3 Contract reference 30-CE-0395435/00-31
xiii
Table of Tables
Table 1. Comparison of some of the typical features of passive vs active RFID .............. 33 Table 2. Global market for active vs passive RFID tags by billions of Euros .................. 34 Table 3. Global market for active vs passive RFID tags by number (billions) ................ 34 Table 4. Global market for active vs passive RFID tags by average price in €cents ......... 34 Table 5. Shares of antenna materials in percent for HF and UHF labels combined ....... 39 Table 6. Material composition of RFID labels .............................................................. 40 Table 7. Relevant passive RFID tag numbers per application area for
Europe/medium scenario ................................................................................ 44 Table 8. Ecologic and economic value of RFID tag components ................................... 45 Table 9. Summary of main properties of RFID tags with paper faces ............................ 46 Table 10. Summary of main properties of RFID tags with PP faces ................................ 46 Table 11. Effects of certain components/materials from RFID tags in metallurgical
recycling processes .......................................................................................... 53 Table 12. Description of waste handling steps ................................................................. 65 Table 13. Clusters according to Bowyer et al. (2010) ...................................................... 66 Table 14. Description of waste streams from private households and commercial
areas ................................................................................................................ 70 Table 15. European waste chapters ................................................................................. 72 Table 16. Behaviour of RFID tags in mechanical waste treatment steps .......................... 79 Table 17. Behaviour of RFID tags in sensor-based sorting systems .................................. 82 Table 18. Landfill categories and their connected disposed waste .................................... 87 Table 19. Treatment requirements of the ELV Directive .............................................. 106 Table 20. Requirements, barriers and benefits for all use cases....................................... 175 Table 21. Overview of WEEE stakeholders and colour-coding within the cause and
effect net ....................................................................................................... 180 Table 22. WEEE case study interlinkage of stakeholders, factors, impacts and
lifecycle (following assessment storyline) ....................................................... 181 Table 23. Overview of CPDS stakeholders and colour-coding within the cause and
effect net ....................................................................................................... 191 Table 24. CPDS case study interlinkage of stakeholders, factors, impacts and
lifecycle (following assessment storyline) ....................................................... 192

RAND Europe, I.A.R. and P3 Contract reference 30-CE-0395435/00-31
xv
Abbreviations
ACP Anisotropic Conductive Paste
ATF Authorised Treatment Facilities
Auto-ID Automatic Identification
BOL Beginning of Life
BPMN Business Process Modelling Notation
CAD Computer Aided Design
CPDS Consumer Purchase Decision Support
CPG Consumer Packaged Goods
DEFRA Department for Environment, Food and Rural Affairs
DIP Data Information Provider
DoD Department of Defence
DSS Decision Support System
EAN Electronic Article Number
EAP Environmental Action Program
EC European Commission
EEC European Economic Community
EEE Electrical and Electronic Equipment
EFW Energy From Waste
ELV End-of-Life Vehicle
EOL End of Life
EPA Environmental Protection Agency
EPC Electronic Product Code
EPS Expanded Polystyrene
EWC European Waste Catalogue
GADSL Global Automotive Declarable Substance List
SMART TRASH: Study on RFID tags and the recycling industry RAND Europe, I.A.R. and P3
Contract reference 30-CE-0395435/00-31
xvi
GDP Gross Domestic Product
GHG Green House Gas
GPRS General Packet Radio Service
GPS Global Positioning System
GTIN Global Trade Item Number
HF High Frequency
HW Hardware
IC Integrated Circuit
ICT Information and Communication Technologies
IDIS International Dismantling Information System
IEC International Electrotechnical Commission
IED Industrial Emissions Directory
IEEP Institute for European Environmental Policy
IMDS International Material Data System
IPPC Integrated Pollution Prevention and Control
ISO International Standardisation Organisation
KM Knowledge Management
LCA Lifecycle Assessment
LF Low Frequency
LPW Light Packaging Waste
LSP Logistics Service Provider
MBT Mechanical-Biological Treatment
MOL Middle of Life
MRF Materials Recovery Facility
(M)MSW (Mixed) Municipal Solid Waste
NFC Near Field Communication
NGO Non-governmental Organisation
NPO Non-profit Organisation
OCR Optimal Character Recognition
OEM Original Equipment Manufacturer
PAYT Pay-As-You-Throw
PBB Polybrominated Biphenyls
RAND Europe, I.A.R. and P3 Abbreviations
Contract reference 30-CE-0395435/00-31
xvii
PDM Product Data Management
PE Polyethylene
PE-LD Low-Density Polyethylene
PE-LLD Linear Low-Density Polyethylene
PE-HD High-Density Polyethylene
PEID Product Embedded Information Device
PET Polyethylene Terephthalate
PIC Printed Integrated Circuits
PLM Product Lifecycle Management
POS Point of Sale
PP Polypropylene
PPDE Polybrominated Diphenyl Ethers
PS Polystyrene
PROMISE Product lifecycle Management and Information tracking using Smart Embedded systems
PUR Polyurethane
PVC Polyvinyl Chloride
RDF Refuse-Derived Fuel
RFID Radio Frequency Identification
RoHS Restriction of Hazardous Substances
RTI Returnable Transport Item
R&D Research and Development
SAL Smart Active Label
SRF Solid Recovered Fuel
SW Software
TOC Total Organic Carbon
UHF Ultra High Frequency
UNEP United Nations Environment Programme
UPC Universal Product Code
USIM Universal Subscriber Identity Module
WEEE Waste Electrical and Electronic Equipment
WID Waste Incineration Directive
WFD Waste Framework Directive

SMART TRASH: Study on RFID tags and the recycling industry RAND Europe, I.A.R. and P3
Contract reference 30-CE-0395435/00-31
xviii
RAND Europe, I.A.R. and P3 Contract reference 30-CE-0395435/00-31
xix
Acknowledgements
We thank the following people for sharing their insights as part of the interviews (expert consultations) conducted between July and November 2011: Mark Abendroth (ELANTAS Beck), Anders Axelsson (Botek Systems AB), Manuela Bauer (Universitätsklinikum Freiburg – Institut für Umweltmedizin und Krankenhaushygiene), Lion Benjamins (PROMISE Consortium), M. Czerwinski (COMEX), Henk Dannenberg (NXP Semiconductors), F. Eibensteiner (Prelonic Technologies GmbH), Jari Enontekiö (MetroSense), Jürgen Ficker (PolyIC GmbH & Co. KG), Paul Garner-Evans (METRO Group), Christian von Grone (Gerry Weber International AG), Marc Hoffmann (Universitätsklinikum Jena), Toni Istel (Universitätsklinikum des Saarlandes und Medizinische Fakultät der Universität des Saarlandes), Nicolas Jacquemin (Tageos), Dieter Kilian (Cavea Identification), Trevor Lambourne (University of Leeds – Digital Print CIC), Anu Launiainen (UPM RAFLATAC), Florian Michahelles (University of St. Gallen), Andrea Miskufova, Tanja Moehler (SMARTRAC Technology Group GmbH), J. Nadler (Stiftung Warentest), Mikos N. Pesmatzoglou (CAT Hellas), Richard Price (Nano ePrint), Joachim Quoden (PRO EUROPE), Felix von Reischach (University of St. Gallen), Dirk Ringena (Adam Opel AG), David Rüdiger (Fraunhofer Institutes IML), Jörn-Marc Schmidt (IAIK–TU Graz), Markus Sprafke (Volkswagen AG), Anja Talo (Enfucell Oy Ltd), Theodore Vasiliadis (Trinity Systems – ICT Solutions), Scott White (Nano ePrint), Roman Winter (GS1, Global Standards One).
Also, a special thank you goes to Prof. Jan Gronow, the assigned quality assurance reviewer of this project, Mr. Gérald Santucci (Head of Networked Enterprise & Radio Frequency Identification (RFID) Unit at the EC DG Information Society and Media) and his colleague Mr. Florent Frederix (Head of RFID Sector) for their constructive feedback and support.
Thank you!

RAND Europe, I.A.R. and P3 Contract reference 30-CE-0395435/00-31
21
CHAPTER 1 Introduction
Waste processing facilities are not designed to separate RFID chips (except possibly in dedicated streams, such as waste electrical and electronic equipment (WEEE)), and the design of recyclable items is not oriented to through-life optimisation, often paying little attention to the end-of-life (EOL) phase of a product. Product design is still driven by commercial considerations, including the imputed cost of compliance with environmental and other regulations. If design ignores EOL, it is because the designer does not bear those costs or cannot capture its benefits and/or the regulations already in existence are not effectively enforced.
RFID technology is linked to recycling in two complementary ways. As objects, tags contain a variety of materials whose recycling is desirable on environmental grounds. These materials vary with the type of tag and their significance will increase as tags become more pervasive. Also, tags can themselves contribute to the efficiency and effectiveness of recycling at various stages in the lifecycles of a wide range of products, ranging from simple items to complex objects containing a variety of materials.
The risks arising from the first element and the opportunities from the second have been discussed or studied in specific contexts, but have not yet found their general application. To provide an empirical evidence base for policy, this study aims to:
(1) Clarify the issues and evidence relating to the environmental impacts and recycling methods of RFID tags.
(2) Assess the environmental advantages of using RFID to improve recycling.
Each line of investigation has its own scope, time frame and policy context, but the overall analytic frame, the policy implications and the stakeholder engagement will draw out their complementarity.3
With regard to the time frame, we have taken account of the gradual development of impacts over time. Short-run developments affecting the recycling of RFID tags are likely to take the form of disseminating new ways to handle existing tags through detection, removal, sequestration and processing. Over the medium- to long-run, it can be expected that new forms of recyclable tag and methods of affixing them will be developed to permit
3 For example, initiatives aimed at introducing RFID tags to improve recycling will need to trade off the material challenges of recycling the tags against improvements in the effectiveness of recycling the materials to which they are attached
SMART TRASH: Study on RFID tags and the recycling industry RAND Europe, I.A.R. and P3
Contract reference 30-CE-0395435/00-31
22
all of them to be recycled, and also that the mix of identification technologies will shift to reflect whole-life (including disposal and environmental) costs as well as performance characteristics.
As regards the use of RFID to improve recycling, short-run developments are likely to involve extending and “joining-up” existing pilots with others in the field of waste handling, as well as the development of new methods for using existing tags, e.g., by the inclusion of new data useful in waste collection and disposal.
In the medium term, the deployment of RFID as part of a general trend to improve waste handling is likely to produce behavioural changes and the emergence of new business models and even changes in sectoral organisation (possibly through the development of new intermediary markets for aspects of smart waste handling or changes in patterns of vertical integration along the EOL product chain). In addition, policy would begin to adapt to new possibilities, especially as regards improved traceability and waste stream measurement.
Over the long term, the new possibilities may be realised through novel whole-systems approaches to waste handling and eventually to new forms of integrated lifecycle management.
Policy Problem The two-way links between RFID tags and recycling tie this issue into two broad areas of policy. RFID tags play a central role in many aspects of Information Society policy,4 especially the Internet of Things.5 Increasingly, these policies highlight the broader contributions of ICT development and deployment to environmental sustainability. Therefore, it is appropriate to provide evidence to support decisions about how best – at least – to minimise the environmental impacts of an increasingly ICT-intensive path of development, and even to ensure that this development optimises the contributions of ICTs to environmental improvements more generally. Much of the attention in this area has concentrated on energy use, e.g., via smart grids, smart meters, smart buildings and smart transport. However, attention is also paid to material use and reuse, and thus to the potential of RFID to improve the efficiency with which waste streams are handled.
On the other hand, a range of policy initiatives have been undertaken to address the challenge of sustainable development. These are intended to improve Europe’s performance but also to build on Europe’s leading position in global efforts to address environmental challenges. The general statement of political will finds concrete expression in several directives established by the European Council (e.g., 1999/31/EC on the landfill of waste or 2000/53/EC on end-of-life vehicles). These objectives can be advanced by taking due account of RFID. Perhaps more importantly (in terms of global challenges), the explicit adoption of technologies and standards relating to the recycling of tags and the
4 See Europe 2020, Digital Agenda for Europe and predecessor programmes, including the Lisbon Agenda, eEurope, and i2010
5 See European Commission (2009)
RAND Europe, I.A.R. and P3 Introduction
Contract reference 30-CE-0395435/00-31
23
ability to demonstrate the potential of tags in improving recycling efficiency and effectiveness can have global leverage as well.
RFID may also be seen as an enabling technology facilitating the monitoring and enforcement of waste law at Member State and European level. According to a recent study commissioned by the Environment Directorate-General of the EC, each year €72 billion is wasted as a result of improper implementation of EU waste legislation (Monier et al., 2011). RFID can be very useful for the production of statistics on waste management, including shipment of waste, and hence help to improve granularity of data and inform policy-making.
Finally, the issues surrounding RFID and recycling are not solely technical. Commercial and trade considerations influence decisions to adopt as well as to recycle RFID tags and thus affect the whole range of benefits arising from their use. In this context, the use of tags can improve the ability of producers, consumers and waste handlers to contribute to better recycling. This, in turn, should improve participation and compliance; obstacles to environmental progress tend to be at least as much behavioural as technical. It is for that reason that the study will complement technical and commercial analysis with active and nuanced stakeholder consultation.
Motivation for the study The study provides a comprehensive overview of the significance of RFID technology in the context of waste management. This significance arises at the intersection of two domains of policy and scientific knowledge. One is the ICT-related perspective that highlights the functions of RFID, their contributions to what has come to be called the Internet of Things, and the network of systemic innovations (e.g., smart transport, smart cities and smart factories) that depends on the identification of objects. The other reflects the physical properties of RFID tags and the environmental perspective from which product lifecycles and waste management are analysed and governed. This difference in perspective, together with weak integration along product and system lifecycles (e.g. diffuse or haphazard connections between design, marketing, use and disposal) creates a risk that neither markets nor “stove-piped” environmental and ICT-related policies will attain efficient outcomes, let alone economically and environmentally sustainable development. The ultimate objective of this study is, therefore, to support efforts to minimise this potential “market failure”, ensuring that environmental and ICT policies are suitably joined up and that barriers to market “solutions” to the environmental impacts of RFID tags in waste streams and the potential of identification technology for waste management are removed. Both the joined-up policy problem and the lifecycle inefficiency problem reflect externalities. In the policy case, ICT and environmental policy-makers often have to take each other’s actions for granted, lacking common understanding of areas (such as RFID in waste) where their powers and responsibilities overlap. In the lifecycle case, those involved in design often do not bear the costs or reap the benefits of the impacts of their decisions on the EOL phase, while the waste management industry often has little input into the design and use of products before disposal.
These challenges are amplified by structural features militating against an holistic approach. As a general-purpose technology with a wide range of applications these tend to be much more uniform across countries than waste management streams and the systems
SMART TRASH: Study on RFID tags and the recycling industry RAND Europe, I.A.R. and P3
Contract reference 30-CE-0395435/00-31
24
into which they ultimately flow, and even the legal and regulatory framework conditions. To take the entire lifecycle into account therefore requires that those who design and use RFID and those who make policy affecting their use and disposal take the characteristics of the disposal ecosystem into account. A similar challenge faces those designing or encouraging RFID uptake in waste treatment: both the tags used to label objects for disposal and the systems able to read and exploit this information must be designed for compatibility with each other and with a variety of waste management systems and scenarios. To provide a common perspective for coordination among such a diverse set of key stakeholders, this study develops a range of use cases giving specific requirements, benefits and barriers for different waste streams.
According to the Commission’s strategic approach to advance environmental legislation, “[...] we cannot tackle all wastes at once, and given that all wastes are not equally polluting, policies need to be developed that address the wastes that have the most environmental impact. This is not necessarily obvious for policy-makers.” (European Commission, 2010) This statement indicates that the highest priority should be attached to wastes whose environmental impacts are both significant and capable of substantial amelioration through available interventions. It thus motivates the attention paid in the study to the prevalence of RFID in waste streams, the potential to reduce their environmental impact through appropriate techniques and their potential contribution to reducing the environmental impacts of other wastes through enhanced disposal, recycling and even possibly reuse.
Technological, political, social, environmental and economic relevance of the topic The study illuminates the relation between a specific technology and the sector (waste management) that has to manage the tags after the objects to which they are attached reach the end of their useful life. The relationship is two-way, because object identification can contribute significantly to the efficiency and effectiveness with which a wide variety of wastes are managed (e.g., through automation of waste management processing of objects tagged with information relevant to their reuse, recycling, disposal, etc.). In this context, both the functionality of existing tags and the range of tagged objects can be usefully extended. The relevance of the topic is underpinned by the wide range and volume of RFID uses, the increasing integration of waste management regulation throughout the European Union and the importance of improved environmental performance, enhanced monitoring capability and reduced compliance cost.
Overview of the methodological approach and report outline The study is divided into two parts, reflecting the dual nature of the RFID–waste relationship. Part A, which considers RFID in waste streams, begins in Chapter 3 with a summary and analysis of the most relevant aspects of European waste management legislation and the waste management sector in the Member States. This is complemented by an analysis of those characteristics of RFID technology that determine its uptake, disposal and management as waste.
To faithfully reflect the technological realities of RFID as waste, it is necessary to account for the occurrence of RFID tags in a variety of waste streams, which are processed in different ways. We identify the streams with the highest expected prevalence of tags and map the journeys they take and the processes to which they are subjected. With the exception of landfilling, all waste streams are subject to some degree of separation and

RAND Europe, I.A.R. and P3 Introduction
Contract reference 30-CE-0395435/00-31
25
further processing; we identify and describe the state of the art and the resulting behaviour of the treated tags. The robustness of conclusions regarding the technical consequences of tags in waste streams has been assessed through lab-scale tests.
These results were used to construct realistic models that can be adjusted according to the reliability of background data and used to simulate the impact of a range of options. These models are intended for use throughout the period of the study and beyond. Both the development and the mandated impact assessment of regulation and other policy interventions require such models. The set of options is potentially broad, including technical restrictions or bans on RFID tags in certain uses or settings; differential pricing to internalise the environmental externalities produced by those who design and use tags; redrafting of “trigger conditions” applied to those who accept and handle waste streams. As implemented, the models can be used to explore the dependence of expected impacts on critical uncertainties, the potential need to adopt a flexible or adaptive approach, the potential for light-touch, information-based and/or co-regulatory (public-private partnership) governance or support for collaborative innovation or business model development involving the tag-producing, tag-using and waste management industries. This breadth is mirrored in Figure 1, which shows how the relevant domains of knowledge are linked.
Figure 1. Outline Part A – Environmental impact of RFID as inert objects
The methodology and research approach for Part B is designed to provide a common understanding of the potential contributions of RFID to environmentally efficient product lifecycle management, especially with regards to materials flow, waste prevention, handling and recycling in specific applications. These use cases are mapped to specific products and lifecycle phases.
The use cases are developed as follows: systematic literature review is used to create case-specific frameworks for analysing RFID applications in recycling disposal. These include models of material flows and relevant information flows along relevant phases of the product lifecycle.
SMART TRASH: Study on RFID tags and the recycling industry RAND Europe, I.A.R. and P3
Contract reference 30-CE-0395435/00-31
26
Using this framework, each RFID use case is shown in a specific logic model diagram taking into account diverse process-oriented, technical and stakeholder dimensions. This sensitivity analysis of each case according to a common overall approach captures important differences but also identifies coherent clusters and common aspects.
Case-specific structured questionnaires were developed to distinctively address key impact areas. The use case clusters were then evaluated by public and private sector experts using these questionnaires to provide a preliminary ranking of the importance of various aspects to the technical and commercial feasibility and environmental contributions of the various case-specific solutions. Afterwards, the cases were fine-tuned in light of the experts’ comments, especially as regards the relative importance of different dimensions and mutual impacts, as technical possibility and economic or environmental importance, feasibility and broader impacts have their own specifics.
On the basis of this initial rating, promising use cases have been subject to a scenario-based exploration of the critical uncertainties, success and risk factors and likely or possible impacts in order to provide a detailed cross-impacts and causality analysis.
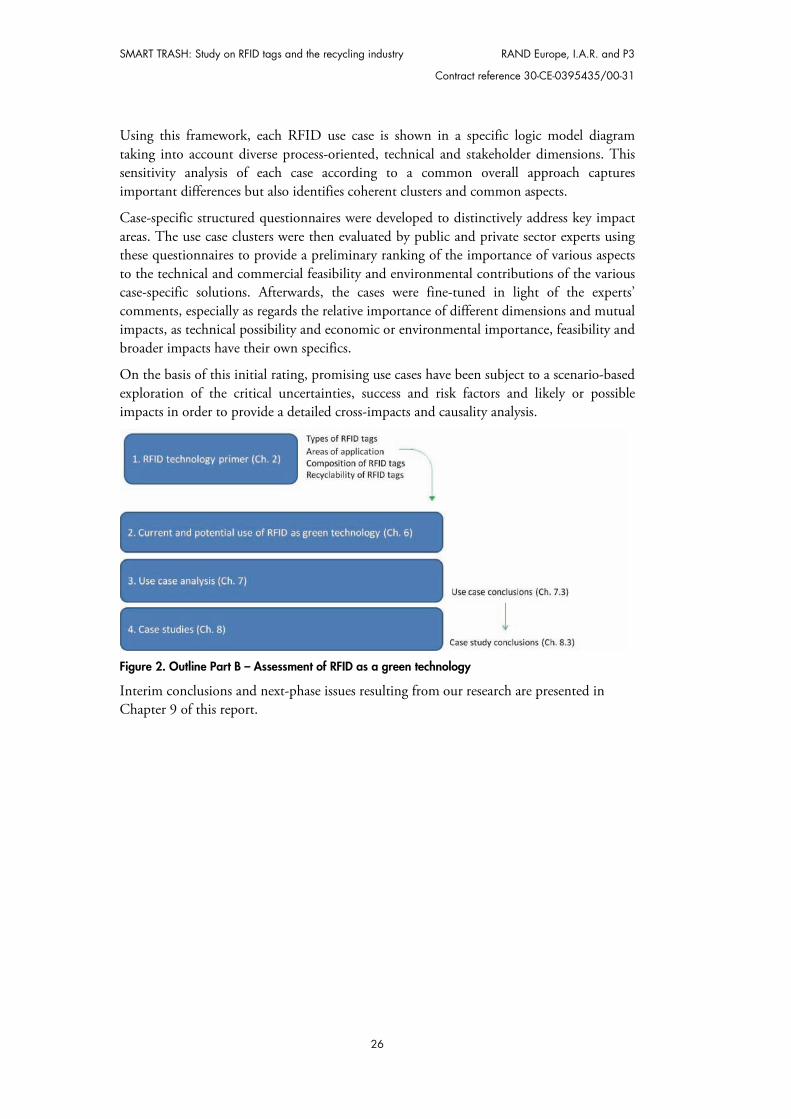
Figure 2. Outline Part B – Assessment of RFID as a green technology
Interim conclusions and next-phase issues resulting from our research are presented in Chapter 9 of this report.
RAND Europe, I.A.R. and P3 Contract reference 30-CE-0395435/00-31
27
SMART TRASH: PART A

RAND Europe, I.A.R. and P3 Contract reference 30-CE-0395435/00-31
29
CHAPTER 2 A technical primer on RFID: tags, compositions, recyclability and forecasts
RFID was first used during WWII to identify friendly aircraft. Yet, it was not until 1973 that the first patent for an RFID tag was issued. RFID started to reach the masses only from the 1990s, especially with the development and commercialisation of the automated toll payment systems, and later with other uses of RFID such as tracking livestock and vehicle and container tracking. At the turn of the 21st century, two professors at the Auto-ID Center at MIT carried out research that changed the market significantly by turning RFID into a networking technology by linking objects to the Internet (Roberti, 2010).
2.1 Definition of RFID tags
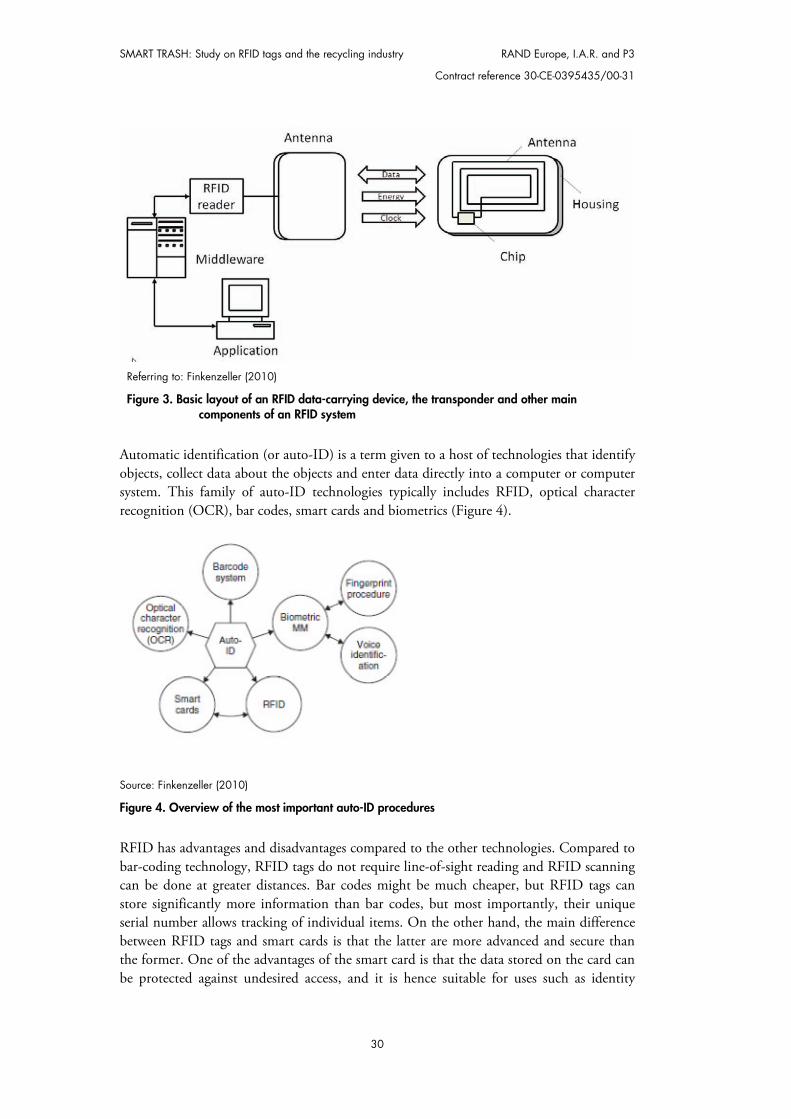
Radio Frequency Identification (RFID) is a wireless data collection technology to identify physical objects in a variety of fields. An RFID system typically consists of a tag (or transponder) generally physically attached to an object, containing a small computer chip (or memory) that uniquely identifies itself. Furthermore, an RFID system also consists of a reader (or transceiver) that sends radio signals into the air to activate a tag through an antenna, read the data transmitted by the tag and sometimes even write data on a tag. Figure 3 shows a basic layout of an RFID tag and system.
This chapter gives a brief introduction to RFID, giving an overview on common types of RFID tags.
Features of today’s RFID tags are highlighted and set in relation to their relevance to the waste processing industry.
Future developments like the uptake of printed electronics are discussed. To be able to assess the impact of RFID on waste management processes:
o the material composition of passive RFID tags and its estimated development over time is explained.
o the market estimates for the EU-27 are introduced. The economic and ecologic value of passive RFID tags are evaluated. The fundamentals for the recycling of RFID tags are explained.
SMART TRASH: Study on RFID tags and the recycling industry RAND Europe, I.A.R. and P3
Contract reference 30-CE-0395435/00-31
30
Referring to: Finkenzeller (2010)
Figure 3. Basic layout of an RFID data-carrying device, the transponder and other main components of an RFID system
Automatic identification (or auto-ID) is a term given to a host of technologies that identify objects, collect data about the objects and enter data directly into a computer or computer system. This family of auto-ID technologies typically includes RFID, optical character recognition (OCR), bar codes, smart cards and biometrics (Figure 4).
Source: Finkenzeller (2010)
Figure 4. Overview of the most important auto-ID procedures
RFID has advantages and disadvantages compared to the other technologies. Compared to bar-coding technology, RFID tags do not require line-of-sight reading and RFID scanning can be done at greater distances. Bar codes might be much cheaper, but RFID tags can store significantly more information than bar codes, but most importantly, their unique serial number allows tracking of individual items. On the other hand, the main difference between RFID tags and smart cards is that the latter are more advanced and secure than the former. One of the advantages of the smart card is that the data stored on the card can be protected against undesired access, and it is hence suitable for uses such as identity
RAND Europe, I.A.R. and P3 A technical primer on RFID: tags, compositions, recyclability and forecasts
Contract reference 30-CE-0395435/00-31
31
credentials and payment cards. On the negative side, smart cards are more expensive and more vulnerable to external factors and have a limited read range compared to RFID. Finally, the advantages of OCR technology is the high density of information and the ease of reading data, but it is more expensive than RFIDs and requires complicated readers (Finkenzeller, 2010).
2.2 Types of RFID tags
RFID tags come in many different shapes and sizes – e.g., in the form of coins, as glass-tube transponders, integrated into mechanical keys, as part of wristwatches, and as paper-thin transponders.
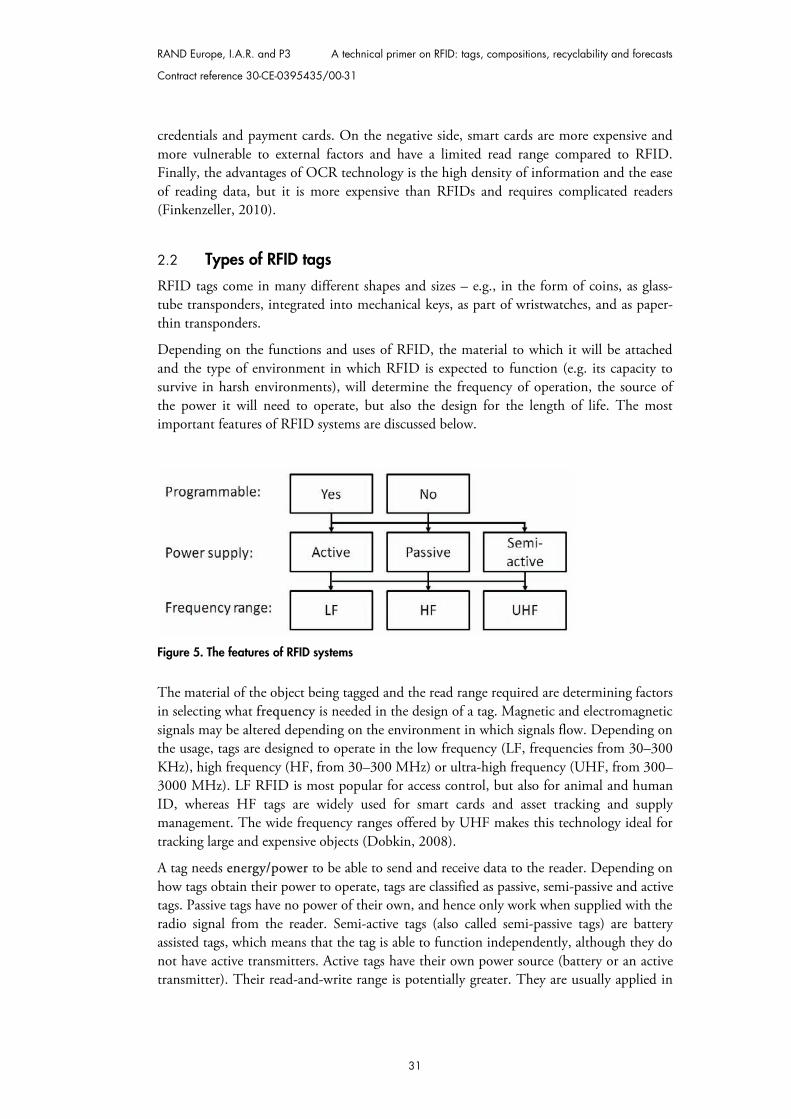
Depending on the functions and uses of RFID, the material to which it will be attached and the type of environment in which RFID is expected to function (e.g. its capacity to survive in harsh environments), will determine the frequency of operation, the source of the power it will need to operate, but also the design for the length of life. The most important features of RFID systems are discussed below.
Figure 5. The features of RFID systems
The material of the object being tagged and the read range required are determining factors in selecting what ffrequency is needed in the design of a tag. Magnetic and electromagnetic signals may be altered depending on the environment in which signals flow. Depending on the usage, tags are designed to operate in the low frequency (LF, frequencies from 30–300 KHz), high frequency (HF, from 30–300 MHz) or ultra-high frequency (UHF, from 300–3000 MHz). LF RFID is most popular for access control, but also for animal and human ID, whereas HF tags are widely used for smart cards and asset tracking and supply management. The wide frequency ranges offered by UHF makes this technology ideal for tracking large and expensive objects (Dobkin, 2008).
A tag needs eenergy/power to be able to send and receive data to the reader. Depending on how tags obtain their power to operate, tags are classified as passive, semi-passive and active tags. Passive tags have no power of their own, and hence only work when supplied with the radio signal from the reader. Semi-active tags (also called semi-passive tags) are battery assisted tags, which means that the tag is able to function independently, although they do not have active transmitters. Active tags have their own power source (battery or an active transmitter). Their read-and-write range is potentially greater. They are usually applied in
SMART TRASH: Study on RFID tags and the recycling industry RAND Europe, I.A.R. and P3
Contract reference 30-CE-0395435/00-31
32
special areas where the higher costs and higher detail level of information stored are justified.
Another interesting classification of RFID tags refers to rread-only and read-write tags. Read-only tags contain a non-changeable programmed identifier that remains during the chip’s life; in other words, the information on the tag cannot be changed. Read-only tags are generally inexpensive but cannot be reused and can only store a limited amount of data. Read-write tags are more sophisticated because of the possibility they offer to reprogram the tag with new information, which means that tags can be erased and reused, thereby significantly reducing costs while contributing to environmental sustainability. Furthermore, read-write tags can store and process information locally, which is particularly valuable when dealing with high-volume, complex supply-chain applications.
The RFID market has seen an important growth in the last few years of ccontactless smart cards. This type of technology is used to protect personal information and deliver secure transactions. Applications using contactless smart cards include government and corporate identification cards, documents and electronic passports and visas and contactless financial payments (Intermec).
2.3 Passive and active RFID tags
Features of passive vs active RFID tags Passive tags can only store a limited amount of information and have low read ranges. On the positive side, passive tags tend to be simple, small, inexpensive and lightweight, have a longer life and tend to be more resistant to harsh environments. Furthermore, passive tags tend to have a vast number of applications in a variety of industries and sectors. Active tags are the most sophisticated types of tags. The fact that they have their own power (battery or an active transmitter) means that they may contain more processing power to implement additional functionalities. Active tags are often used with sensors and by real-time location systems. On the negative side, active tags can only be used for a specific period of time, as the batteries contained within them have a limited life. Active tags are typically used for locating large assets, such as shipping containers.

RAND Europe, I.A.R. and P3 A technical primer on RFID: tags, compositions, recyclability and forecasts
Contract reference 30-CE-0395435/00-31
33
Table 1. Comparison of some of the typical features of passive vs active RFID
Feature Passive Active
Size and weight Small (or thin) Large
Cost 4 €cents to <1€ 3€ to a <100€
Life Virtually unlimited 3 to 7 years
Range Up to 30 metres Up to 30 metres
Reliability Excellent Good
Sensor input Little or none Any
Can emit continuous signal No Yes
Area monitoring/geofencing Rarely Yes
Multi-tag reading Fair or none Excellent (e.g., thousands)
Location using a beam Yes, but only short distance Yes, at long distance
High-speed reading Fair Excellent
Data retention Small to medium (e.g., 1 Kbit) Medium to high (e.g., 1 Mbit)
Very slow signal power No Yes – no need to get the signal and back because semi-active and fully active tags emit their own signal and the battery boosts it
Security features of signal and processing
Limited Excellent
Event signalling No Yes
Electronic manifest No Yes
Data logging No Yes Source: Das & Harrop (2010)
Market for passive vs active RFID tags RFID has a very large potential for growth. Different market research companies have carried out estimates, which all differ depending on the underlying assumptions, like those related to technological breakthroughs. Other differences concern the inclusion criteria for different products and services as part of the estimates (hardware or also software, maintenance and marketing services, as well). However, they all agree that the global market size is likely to increase significantly within the next decade. In fact, some market research companies like IDTechEx expect the global market to grow by almost four times in 10 years (Table 2).
SMART TRASH: Study on RFID tags and the recycling industry RAND Europe, I.A.R. and P3
Contract reference 30-CE-0395435/00-31
34
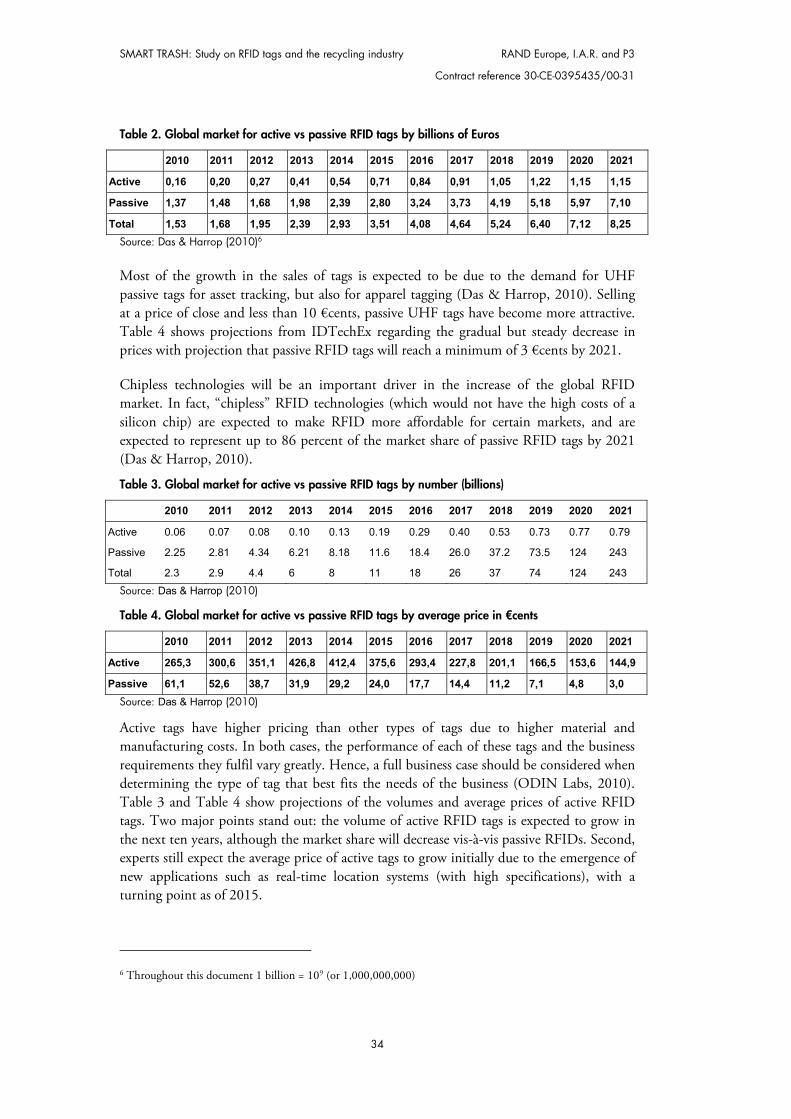
Table 2. Global market for active vs passive RFID tags by billions of Euros
2010 2011 2012 2013 2014 2015 2016 2017 2018 2019 2020 2021
Active 0,16 0,20 0,27 0,41 0,54 0,71 0,84 0,91 1,05 1,22 1,15 1,15
Passive 1,37 1,48 1,68 1,98 2,39 2,80 3,24 3,73 4,19 5,18 5,97 7,10
Total 1,53 1,68 1,95 2,39 2,93 3,51 4,08 4,64 5,24 6,40 7,12 8,25 Source: Das & Harrop (2010)6
Most of the growth in the sales of tags is expected to be due to the demand for UHF passive tags for asset tracking, but also for apparel tagging (Das & Harrop, 2010). Selling at a price of close and less than 10 €cents, passive UHF tags have become more attractive. Table 4 shows projections from IDTechEx regarding the gradual but steady decrease in prices with projection that passive RFID tags will reach a minimum of 3 €cents by 2021.
Chipless technologies will be an important driver in the increase of the global RFID market. In fact, “chipless” RFID technologies (which would not have the high costs of a silicon chip) are expected to make RFID more affordable for certain markets, and are expected to represent up to 86 percent of the market share of passive RFID tags by 2021 (Das & Harrop, 2010).
Table 3. Global market for active vs passive RFID tags by number (billions)
2010 2011 2012 2013 2014 2015 2016 2017 2018 2019 2020 2021
Active 0.06 0.07 0.08 0.10 0.13 0.19 0.29 0.40 0.53 0.73 0.77 0.79
Passive 2.25 2.81 4.34 6.21 8.18 11.6 18.4 26.0 37.2 73.5 124 243
Total 2.3 2.9 4.4 6 8 11 18 26 37 74 124 243
Source: Das & Harrop (2010)
Table 4. Global market for active vs passive RFID tags by average price in €cents
2010 2011 2012 2013 2014 2015 2016 2017 2018 2019 2020 2021
Active 265,3 300,6 351,1 426,8 412,4 375,6 293,4 227,8 201,1 166,5 153,6 144,9
Passive 61,1 52,6 38,7 31,9 29,2 24,0 17,7 14,4 11,2 7,1 4,8 3,0 Source: Das & Harrop (2010)
Active tags have higher pricing than other types of tags due to higher material and manufacturing costs. In both cases, the performance of each of these tags and the business requirements they fulfil vary greatly. Hence, a full business case should be considered when determining the type of tag that best fits the needs of the business (ODIN Labs, 2010). Table 3 and Table 4 show projections of the volumes and average prices of active RFID tags. Two major points stand out: the volume of active RFID tags is expected to grow in the next ten years, although the market share will decrease vis-à-vis passive RFIDs. Second, experts still expect the average price of active tags to grow initially due to the emergence of new applications such as real-time location systems (with high specifications), with a turning point as of 2015.
6 Throughout this document 1 billion = 109 (or 1,000,000,000)
RAND Europe, I.A.R. and P3 A technical primer on RFID: tags, compositions, recyclability and forecasts
Contract reference 30-CE-0395435/00-31
35
2.4 Research aspects
According to academic and market research literature, as well as to consulted experts, the next generation of RFID will be governed by developments occurring in the production of printed semiconductors (e.g., thin-film transistor circuits) and in the techniques by which RFID tags can be manufactured using these materials.
The major goal behind the integration of printed semiconductors in RFID tags is to overcome the challenges of traditional silicon integrated circuits, where integration is complex and costly due to the challenges from the antenna interconnection to the tag. As a result, a fully printed tag including both antenna and circuit at a cost of less than half the price of a silicon-based tag would enable the realisation of several uses that have not been realised yet because of the relatively high costs of silicon-based tags and their integration. Although printed semiconductors are expected to play a major role in the future RFID tag market, traditional silicon integrated circuits are not expected to be entirely substituted. This is because demanding applications, requiring long reading distances, high memory, data security and high-speed tag anti-collision arbitration are expected to remain the domain of traditional integrated circuit-based tags. Printed semiconductor-based tags are not expected to meet the standards of EPCglobal UHF and HF Gen 2 and its application area anytime soon.
For printed semiconductor-based tags the focus lies in the high volume market for consumer goods, including applications like consumer product brand protection and authentication, supply chain surveillance, ticketing and consumer retail product promotions, where tag cost is the major barrier of adoption.
Examples from Kovio and PolyIC (Gambon, 2008) have already shown that the realisation of such tags has been partly resolved. Both companies have presented first functional prototypes and samples of such tags. According to Cole et al. (2010), the described “technology has the capability for high volume production. But what is needed is the requisite capital investment in plant to upscale and roll out ‘distributed’ production facilities to match the upcoming demand….” Our expert consultation among stakeholders of the traditional, silicon-based circuits showed more pessimism regarding this development, especially regarding the envisaged time frame for mass adoption.
Major cost factors of printed semiconductors are: the chip, its attachment to the antenna, the antenna and the substrate to which the antenna is applied. Subsequently, to obtain a fully printable RFID label, the antenna should also be printed. In the past, additive antenna manufacturing processes used silver-based inks. However, since the increase in the price of silver, new materials (e.g., graphene and metal nano-particle inks) offering significant cost savings are starting to be used.
Another development that is likely to be concomitant with fully printable RFID tags is the low-cost integration of additional components in order to broaden the adaptability of tags. Components in focus are, e.g., printable batteries, sensors and displays, which in combination will again enable additional uses such as cold-chain monitoring for perishable goods. This development will result in a relatively new class of RFID tags, which would combine the form and the costs of a passive RFID label with some of the functionalities of an active RFID tag (a so-called smart active label or SALs).
SMART TRASH: Study on RFID tags and the recycling industry RAND Europe, I.A.R. and P3
Contract reference 30-CE-0395435/00-31
36
2.5 The composition of RFID tags
2.5.1 Setting the scope
In this study we mainly focus on RFID tags that are likely to end up in waste streams where those tags might relevantly influence processes or be exposed to the environment. This is mainly determined by the following factors:
The type of tag The number of tags The application type The product-related application area The waste stream the tag is likely to end up in.
The type of RFID Tag As detailed in Section 2.2, RFID tags are distinguished according to their energy supply into passive, active and semi-active tags. Passive tags occur mainly in two formats: label-form tags and encapsulated tags. Active and semi-active tags occur almost exclusively in encapsulated formats. Active RFID tags are used mainly to track containers, vehicles, assets and people.
SALs are usually very thin and flexible labels that contain an integrated circuit and a power source. Some SALs may contain additional components such as sensors and actuators. In regard to tag sales today, SALs play only a minor role, but this is expected to change when printed integrated circuits (PICs) play a major role in the RFID label market. SALs do and in the future are likely to enable enhanced functionality and superior performance over existing passive labels. The main application areas for SALs are supply-chain management (especially cold-chain management), access control, security, transportation and ticketing.
The number of tags According to IDTechEx, in 2010 the share of active tags worldwide was less than 3 percent with a total of approximately 60 million tags compared to 2.250 billion passive tags. The share of active tags is presumed to fall under 2 percent until 2016 and then fall under 1 percent until 2021 (which equates to 790 million tags compared to 242,700 billion passive tags forecast for 2021). Regarding SALs, it is too early to be sure of the market penetration potential of these tags. Market shares of tags by shape show that in 2010 more than 80 percent of the tags sold worldwide were passive smart cards and labels, the rest fobs, discs and keys. The market share of passive smart cards and labels is predicted to continuously grow in the future and to reach nearly 90 percent in 2016.
Application type: open-loop vs closed-loop applications Closed-loop applications are where the item to which the RFID tag is applied is continuously reused in a process, and the cost of the tag is amortised over many process cycles. Classic examples of closed-loop applications are asset management, production and material flow control, security applications, intralogistic applications (e.g. pallets, rollcages and freight containers), tagging of books in libraries and textiles. Tag types used in closed-loop applications are mostly passive encapsulated tags and active or semi-active tags.
RAND Europe, I.A.R. and P3 A technical primer on RFID: tags, compositions, recyclability and forecasts
Contract reference 30-CE-0395435/00-31
37
In open-loop applications, the tag is attached to the item at the beginning of the process and remains there. The tag and its information can be used outside the initial system in several systems. Typical examples are retail supply chains for apparel or consumer packaged goods (CPGs). Tag types used in open-loop applications are mostly passive label tags and to some extent passive smart cards (like credit cards), which are likely to be disposed of in household waste when expired. Next to the passive tags already used, SALs are expected to be predominantly used in open-loop applications like cold-chain surveillance for temperature-sensitive goods (e.g., the food and pharmaceutical industries) when they will reach an acceptable price.
The product-related application area To be able to determine whether an RFID tag will end up in waste it is important to know where the tag is usually attached. According to the expert consultation, most passive labels are attached to CPGs, made out of cardboard, paper and plastics. Today most passive labels are adhesive labels, but they are also used in the form of a dry inlay, which can be integrated into cardboard and other packaging. SALs are likely to be applied in a similar manner.
Passive encapsulated tags are mostly used in the form of keys, cards and fobs or when used in rough environments. They are also stuck on or screwed to containers, rollcages and other durable assets, as they are usually not replaced during the lifetime of the object.
Relevance for waste stream The most important criterion to evaluate the impact of tags on the waste management industry and its processes is the identification of the waste stream in which the tag is likely to end up.
As active tags are electronic devices with a power supply in the form of a battery, with regard to their disposal, “it is generally accepted that interrogators and active RFID tags fall into the category of ‘electronic devices’ and therefore fall under the scope of the WEEE Directive”. Hence, it can be assumed that these tags are disposed of in separately kept waste streams that follow adequate treatment routes and rarely end up in mixed waste streams, such as municipal solid wastes.
SALs are categorised as active tags according to the WEEE Directive. However, the WEEE Directive is likely not to be effectively followed in this case as SALs are likely to be attached to product packaging in applications (e.g., on packaged food to enable cold-chain surveillance) where they end up in household waste.
Passive tags are considered to be outside the scope of the WEEE Directive and are disposed of with the material/object they are applied to. Passive RFID labels when used on item level in retail or apparel supply chains will end up in packaging waste or mixed municipal solid waste (MMSW) in significant amounts. The same is assumed for cards (e.g., credit cards, ID cards, key fobs). If properly disposed of, passive encapsulated tags, which are usually attached to valuable or important assets for their whole lifespan, will end up in the waste stream designated for the asset (e.g., TVs are destined for WEEE collection).
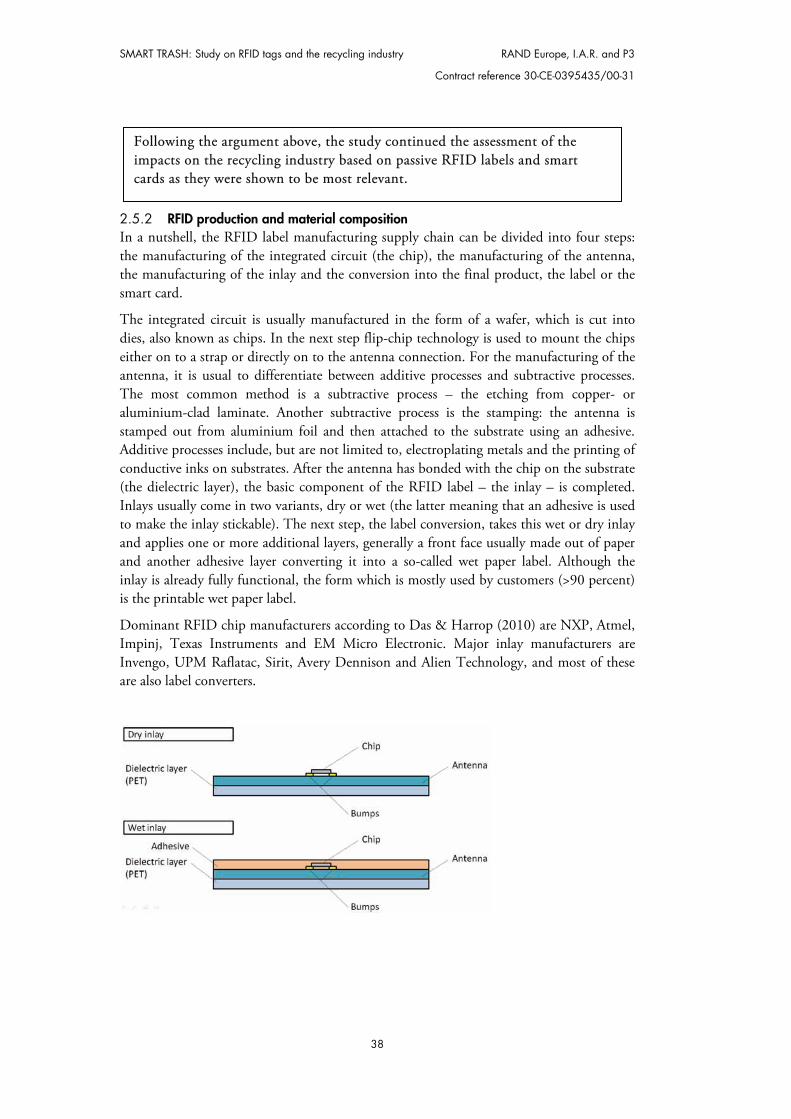
SMART TRASH: Study on RFID tags and the recycling industry RAND Europe, I.A.R. and P3
Contract reference 30-CE-0395435/00-31
38
2.5.2 RFID production and material composition In a nutshell, the RFID label manufacturing supply chain can be divided into four steps: the manufacturing of the integrated circuit (the chip), the manufacturing of the antenna, the manufacturing of the inlay and the conversion into the final product, the label or the smart card.
The integrated circuit is usually manufactured in the form of a wafer, which is cut into dies, also known as chips. In the next step flip-chip technology is used to mount the chips either on to a strap or directly on to the antenna connection. For the manufacturing of the antenna, it is usual to differentiate between additive processes and subtractive processes. The most common method is a subtractive process – the etching from copper- or aluminium-clad laminate. Another subtractive process is the stamping: the antenna is stamped out from aluminium foil and then attached to the substrate using an adhesive. Additive processes include, but are not limited to, electroplating metals and the printing of conductive inks on substrates. After the antenna has bonded with the chip on the substrate (the dielectric layer), the basic component of the RFID label – the inlay – is completed. Inlays usually come in two variants, dry or wet (the latter meaning that an adhesive is used to make the inlay stickable). The next step, the label conversion, takes this wet or dry inlay and applies one or more additional layers, generally a front face usually made out of paper and another adhesive layer converting it into a so-called wet paper label. Although the inlay is already fully functional, the form which is mostly used by customers (>90 percent) is the printable wet paper label.
Dominant RFID chip manufacturers according to Das & Harrop (2010) are NXP, Atmel, Impinj, Texas Instruments and EM Micro Electronic. Major inlay manufacturers are Invengo, UPM Raflatac, Sirit, Avery Dennison and Alien Technology, and most of these are also label converters.
Following the argument above, the study continued the assessment of the impacts on the recycling industry based on passive RFID labels and smart cards as they were shown to be most relevant.
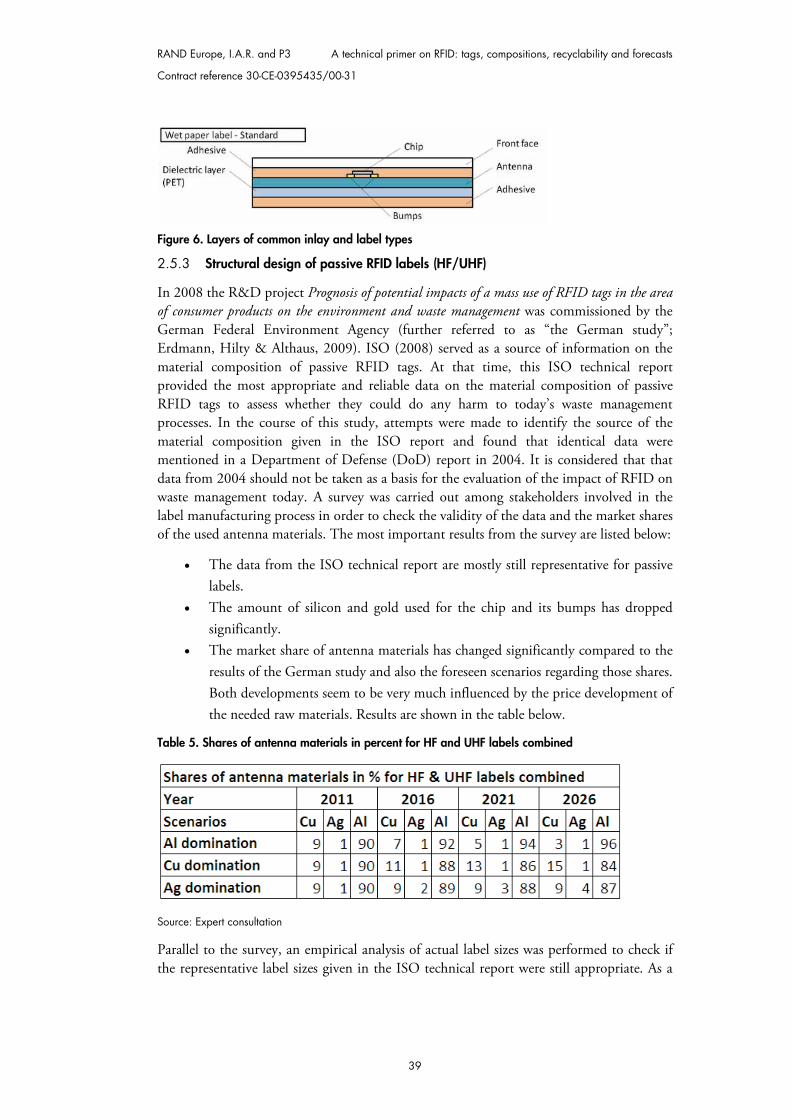
RAND Europe, I.A.R. and P3 A technical primer on RFID: tags, compositions, recyclability and forecasts
Contract reference 30-CE-0395435/00-31
39
Figure 6. Layers of common inlay and label types
2.5.3 Structural design of passive RFID labels (HF/UHF)
In 2008 the R&D project Prognosis of potential impacts of a mass use of RFID tags in the area of consumer products on the environment and waste management was commissioned by the German Federal Environment Agency (further referred to as “the German study”; Erdmann, Hilty & Althaus, 2009). ISO (2008) served as a source of information on the material composition of passive RFID tags. At that time, this ISO technical report provided the most appropriate and reliable data on the material composition of passive RFID tags to assess whether they could do any harm to today’s waste management processes. In the course of this study, attempts were made to identify the source of the material composition given in the ISO report and found that identical data were mentioned in a Department of Defense (DoD) report in 2004. It is considered that that data from 2004 should not be taken as a basis for the evaluation of the impact of RFID on waste management today. A survey was carried out among stakeholders involved in the label manufacturing process in order to check the validity of the data and the market shares of the used antenna materials. The most important results from the survey are listed below:
The data from the ISO technical report are mostly still representative for passive labels.
The amount of silicon and gold used for the chip and its bumps has dropped significantly.
The market share of antenna materials has changed significantly compared to the results of the German study and also the foreseen scenarios regarding those shares. Both developments seem to be very much influenced by the price development of the needed raw materials. Results are shown in the table below.
Table 5. Shares of antenna materials in percent for HF and UHF labels combined
Source: Expert consultation
Parallel to the survey, an empirical analysis of actual label sizes was performed to check if the representative label sizes given in the ISO technical report were still appropriate. As a
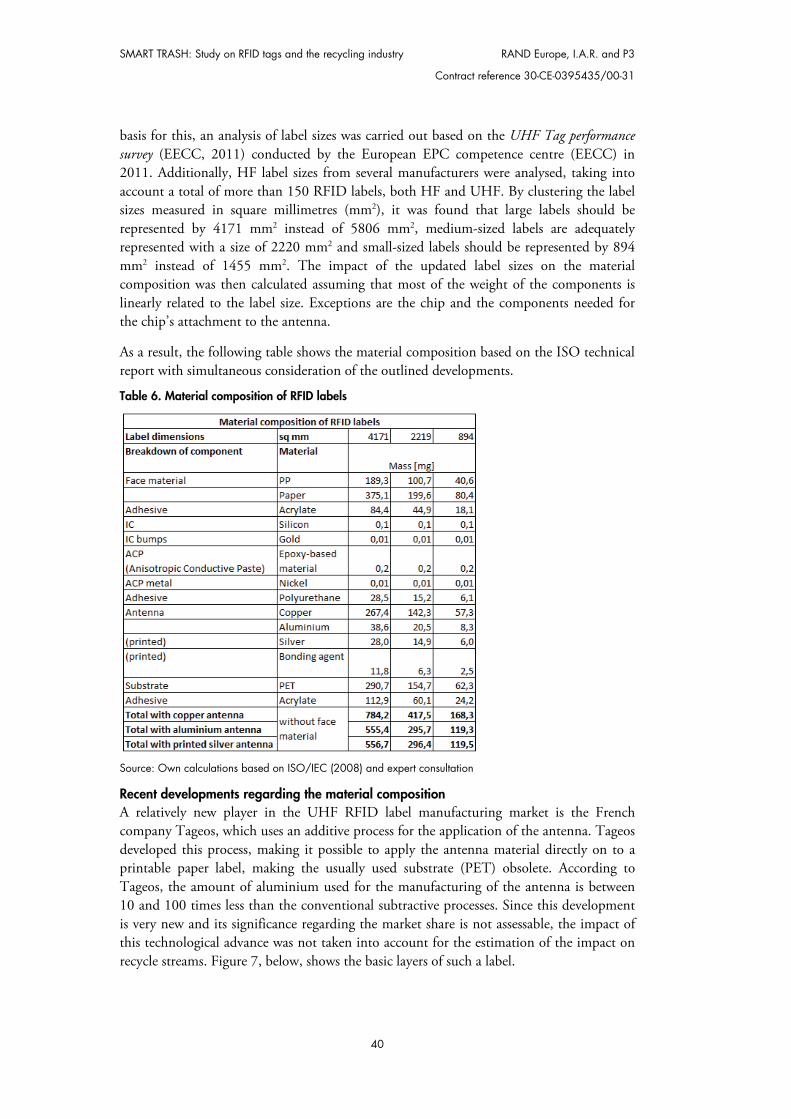
SMART TRASH: Study on RFID tags and the recycling industry RAND Europe, I.A.R. and P3
Contract reference 30-CE-0395435/00-31
40
basis for this, an analysis of label sizes was carried out based on the UHF Tag performance survey (EECC, 2011) conducted by the European EPC competence centre (EECC) in 2011. Additionally, HF label sizes from several manufacturers were analysed, taking into account a total of more than 150 RFID labels, both HF and UHF. By clustering the label sizes measured in square millimetres (mm2), it was found that large labels should be represented by 4171 mm2 instead of 5806 mm2, medium-sized labels are adequately represented with a size of 2220 mm2 and small-sized labels should be represented by 894 mm2 instead of 1455 mm2. The impact of the updated label sizes on the material composition was then calculated assuming that most of the weight of the components is linearly related to the label size. Exceptions are the chip and the components needed for the chip’s attachment to the antenna.
As a result, the following table shows the material composition based on the ISO technical report with simultaneous consideration of the outlined developments.
Table 6. Material composition of RFID labels
Source: Own calculations based on ISO/IEC (2008) and expert consultation
Recent developments regarding the material composition A relatively new player in the UHF RFID label manufacturing market is the French company Tageos, which uses an additive process for the application of the antenna. Tageos developed this process, making it possible to apply the antenna material directly on to a printable paper label, making the usually used substrate (PET) obsolete. According to Tageos, the amount of aluminium used for the manufacturing of the antenna is between 10 and 100 times less than the conventional subtractive processes. Since this development is very new and its significance regarding the market share is not assessable, the impact of this technological advance was not taken into account for the estimation of the impact on recycle streams. Figure 7, below, shows the basic layers of such a label.
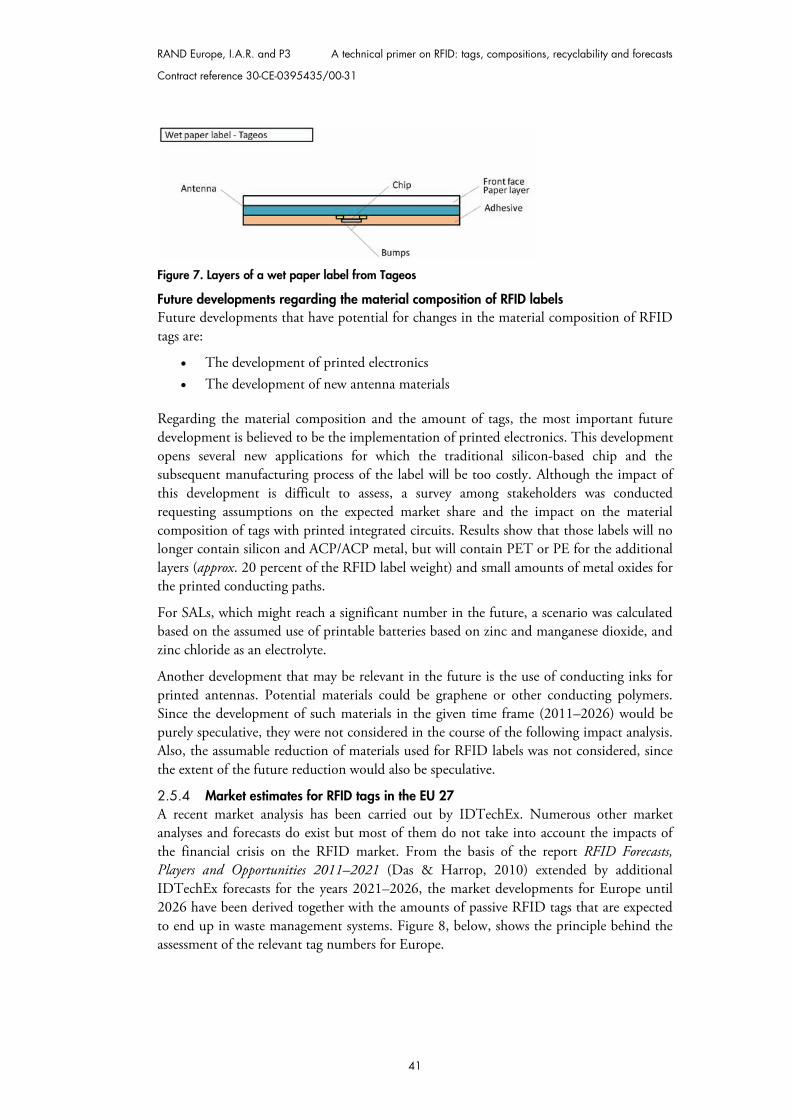
RAND Europe, I.A.R. and P3 A technical primer on RFID: tags, compositions, recyclability and forecasts
Contract reference 30-CE-0395435/00-31
41
Figure 7. Layers of a wet paper label from Tageos
Future developments regarding the material composition of RFID labels Future developments that have potential for changes in the material composition of RFID tags are:
The development of printed electronics The development of new antenna materials
Regarding the material composition and the amount of tags, the most important future development is believed to be the implementation of printed electronics. This development opens several new applications for which the traditional silicon-based chip and the subsequent manufacturing process of the label will be too costly. Although the impact of this development is difficult to assess, a survey among stakeholders was conducted requesting assumptions on the expected market share and the impact on the material composition of tags with printed integrated circuits. Results show that those labels will no longer contain silicon and ACP/ACP metal, but will contain PET or PE for the additional layers (approx. 20 percent of the RFID label weight) and small amounts of metal oxides for the printed conducting paths.
For SALs, which might reach a significant number in the future, a scenario was calculated based on the assumed use of printable batteries based on zinc and manganese dioxide, and zinc chloride as an electrolyte.
Another development that may be relevant in the future is the use of conducting inks for printed antennas. Potential materials could be graphene or other conducting polymers. Since the development of such materials in the given time frame (2011–2026) would be purely speculative, they were not considered in the course of the following impact analysis. Also, the assumable reduction of materials used for RFID labels was not considered, since the extent of the future reduction would also be speculative.
2.5.4 Market estimates for RFID tags in the EU 27 A recent market analysis has been carried out by IDTechEx. Numerous other market analyses and forecasts do exist but most of them do not take into account the impacts of the financial crisis on the RFID market. From the basis of the report RFID Forecasts, Players and Opportunities 2011–2021 (Das & Harrop, 2010) extended by additional IDTechEx forecasts for the years 2021–2026, the market developments for Europe until 2026 have been derived together with the amounts of passive RFID tags that are expected to end up in waste management systems. Figure 8, below, shows the principle behind the assessment of the relevant tag numbers for Europe.
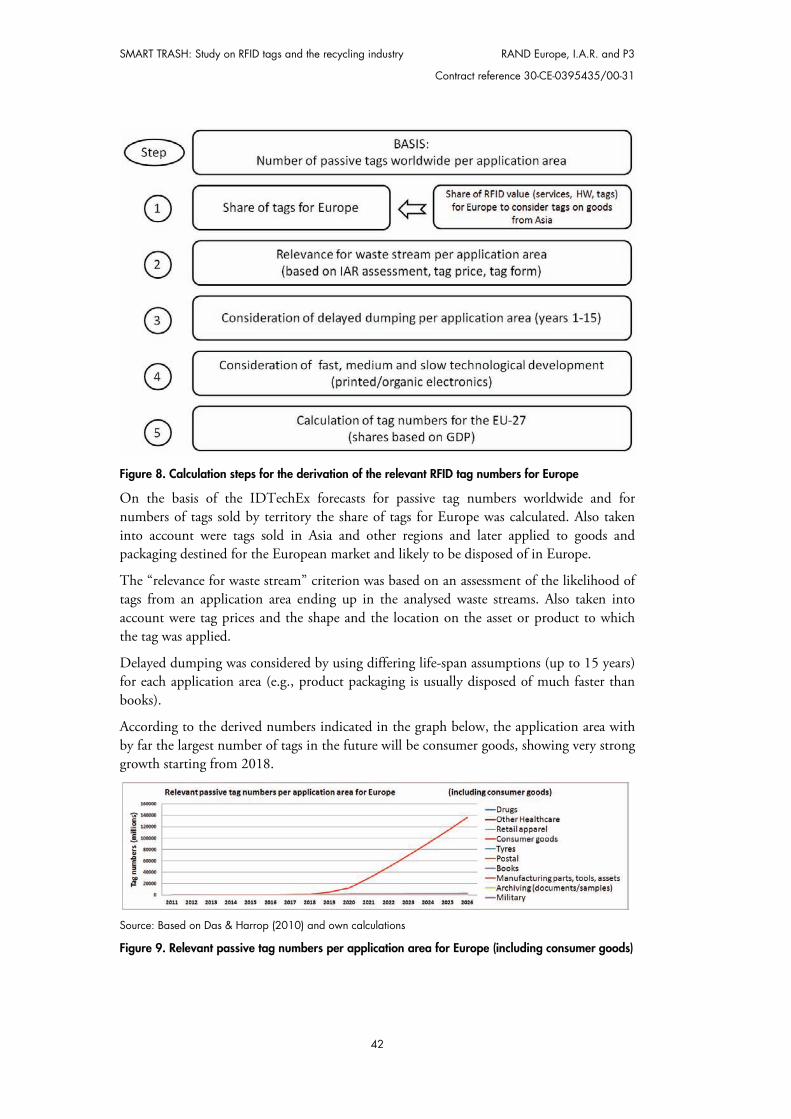
SMART TRASH: Study on RFID tags and the recycling industry RAND Europe, I.A.R. and P3
Contract reference 30-CE-0395435/00-31
42
Figure 8. Calculation steps for the derivation of the relevant RFID tag numbers for Europe
On the basis of the IDTechEx forecasts for passive tag numbers worldwide and for numbers of tags sold by territory the share of tags for Europe was calculated. Also taken into account were tags sold in Asia and other regions and later applied to goods and packaging destined for the European market and likely to be disposed of in Europe.
The “relevance for waste stream” criterion was based on an assessment of the likelihood of tags from an application area ending up in the analysed waste streams. Also taken into account were tag prices and the shape and the location on the asset or product to which the tag was applied.
Delayed dumping was considered by using differing life-span assumptions (up to 15 years) for each application area (e.g., product packaging is usually disposed of much faster than books).
According to the derived numbers indicated in the graph below, the application area with by far the largest number of tags in the future will be consumer goods, showing very strong growth starting from 2018.
Source: Based on Das & Harrop (2010) and own calculations
Figure 9. Relevant passive tag numbers per application area for Europe (including consumer goods)
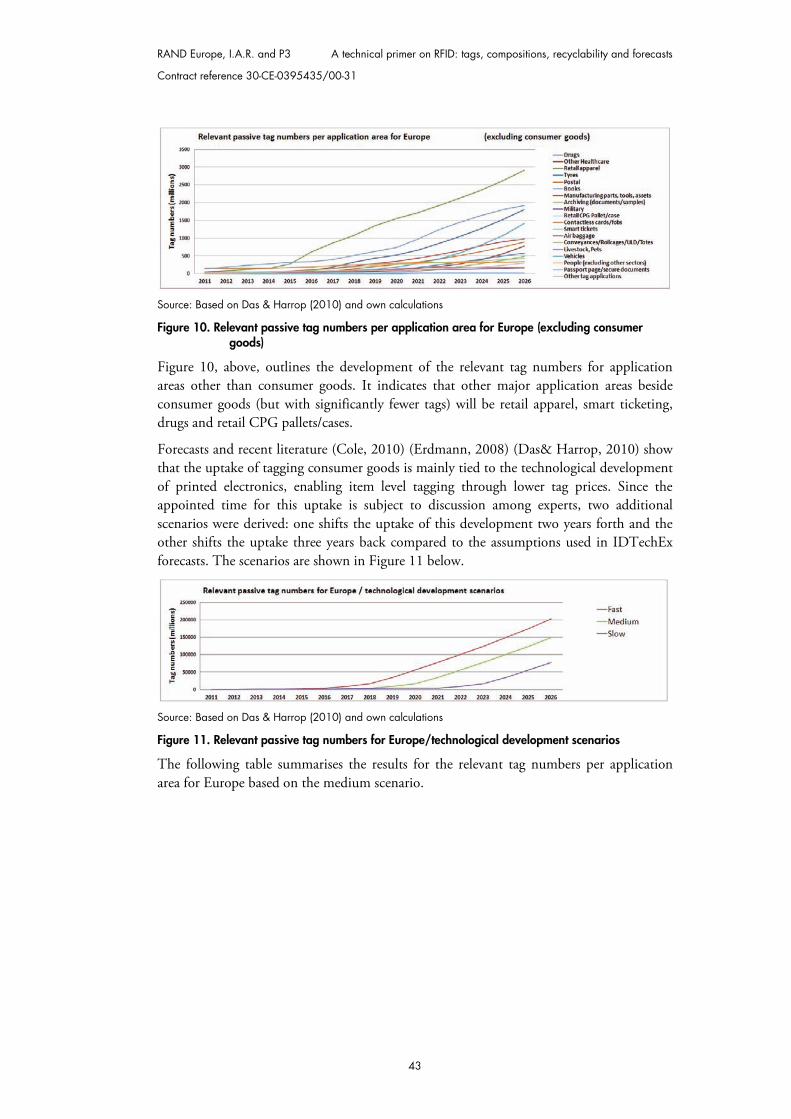
RAND Europe, I.A.R. and P3 A technical primer on RFID: tags, compositions, recyclability and forecasts
Contract reference 30-CE-0395435/00-31
43
Source: Based on Das & Harrop (2010) and own calculations
Figure 10. Relevant passive tag numbers per application area for Europe (excluding consumer goods)
Figure 10, above, outlines the development of the relevant tag numbers for application areas other than consumer goods. It indicates that other major application areas beside consumer goods (but with significantly fewer tags) will be retail apparel, smart ticketing, drugs and retail CPG pallets/cases.
Forecasts and recent literature (Cole, 2010) (Erdmann, 2008) (Das& Harrop, 2010) show that the uptake of tagging consumer goods is mainly tied to the technological development of printed electronics, enabling item level tagging through lower tag prices. Since the appointed time for this uptake is subject to discussion among experts, two additional scenarios were derived: one shifts the uptake of this development two years forth and the other shifts the uptake three years back compared to the assumptions used in IDTechEx forecasts. The scenarios are shown in Figure 11 below.
Source: Based on Das & Harrop (2010) and own calculations
Figure 11. Relevant passive tag numbers for Europe/technological development scenarios
The following table summarises the results for the relevant tag numbers per application area for Europe based on the medium scenario.
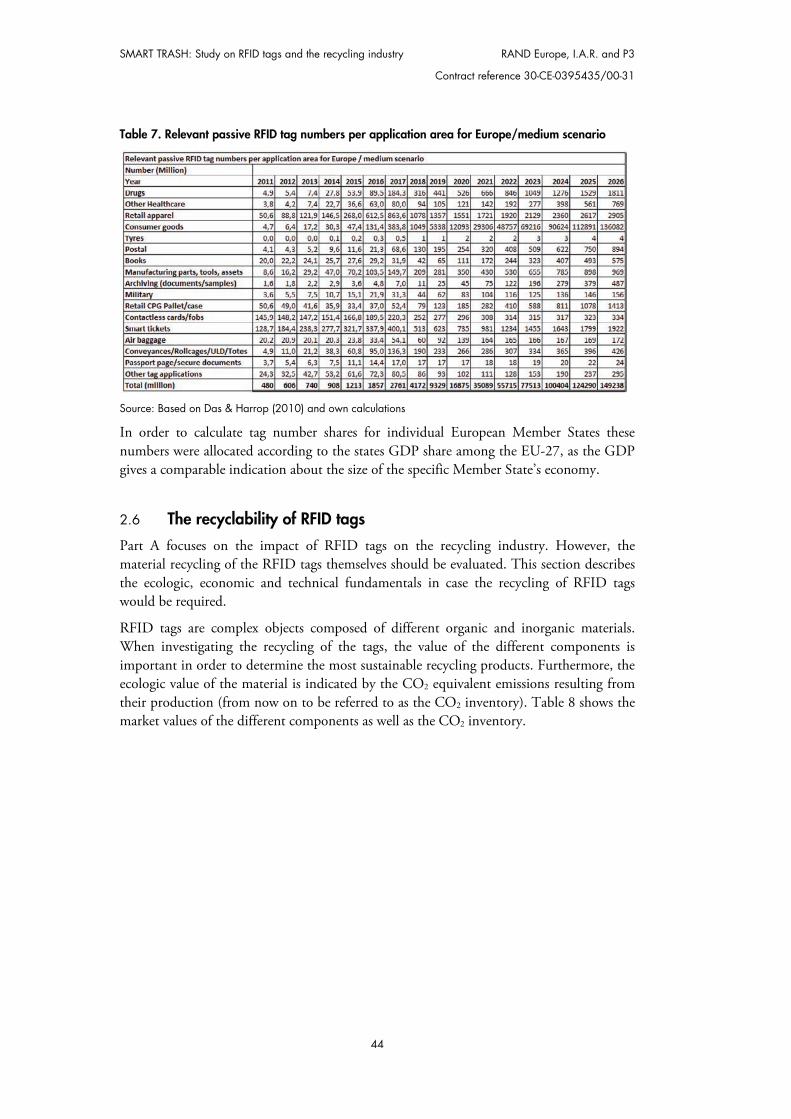
SMART TRASH: Study on RFID tags and the recycling industry RAND Europe, I.A.R. and P3
Contract reference 30-CE-0395435/00-31
44
Table 7. Relevant passive RFID tag numbers per application area for Europe/medium scenario
Source: Based on Das & Harrop (2010) and own calculations
In order to calculate tag number shares for individual European Member States these numbers were allocated according to the states GDP share among the EU-27, as the GDP gives a comparable indication about the size of the specific Member State’s economy.
2.6 The recyclability of RFID tags
Part A focuses on the impact of RFID tags on the recycling industry. However, the material recycling of the RFID tags themselves should be evaluated. This section describes the ecologic, economic and technical fundamentals in case the recycling of RFID tags would be required.
RFID tags are complex objects composed of different organic and inorganic materials. When investigating the recycling of the tags, the value of the different components is important in order to determine the most sustainable recycling products. Furthermore, the ecologic value of the material is indicated by the CO2 equivalent emissions resulting from their production (from now on to be referred to as the CO2 inventory). Table 8 shows the market values of the different components as well as the CO2 inventory.
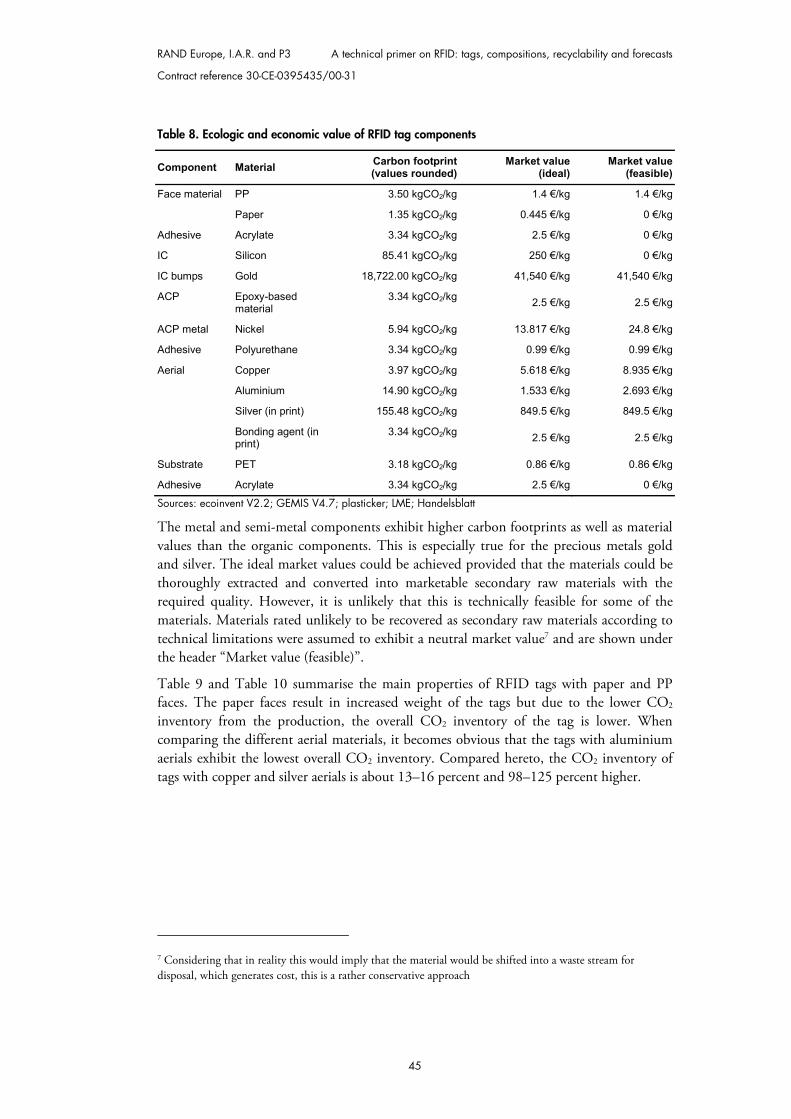
RAND Europe, I.A.R. and P3 A technical primer on RFID: tags, compositions, recyclability and forecasts
Contract reference 30-CE-0395435/00-31
45
Table 8. Ecologic and economic value of RFID tag components
Component Material Carbon footprint(values rounded)
Market value (ideal)
Market value(feasible)
Face material PP 3.50 kgCO2/kg 1.4 €/kg 1.4 €/kg
Paper 1.35 kgCO2/kg 0.445 €/kg 0 €/kg
Adhesive Acrylate 3.34 kgCO2/kg 2.5 €/kg 0 €/kg
IC Silicon 85.41 kgCO2/kg 250 €/kg 0 €/kg
IC bumps Gold 18,722.00 kgCO2/kg 41,540 €/kg 41,540 €/kg
ACP Epoxy-based material
3.34 kgCO2/kg 2.5 €/kg 2.5 €/kg
ACP metal Nickel 5.94 kgCO2/kg 13.817 €/kg 24.8 €/kg
Adhesive Polyurethane 3.34 kgCO2/kg 0.99 €/kg 0.99 €/kg
Aerial Copper 3.97 kgCO2/kg 5.618 €/kg 8.935 €/kg
Aluminium 14.90 kgCO2/kg 1.533 €/kg 2.693 €/kg
Silver (in print) 155.48 kgCO2/kg 849.5 €/kg 849.5 €/kg
Bonding agent (in print)
3.34 kgCO2/kg 2.5 €/kg 2.5 €/kg
Substrate PET 3.18 kgCO2/kg 0.86 €/kg 0.86 €/kg
Adhesive Acrylate 3.34 kgCO2/kg 2.5 €/kg 0 €/kg
Sources: ecoinvent V2.2; GEMIS V4.7; plasticker; LME; Handelsblatt
The metal and semi-metal components exhibit higher carbon footprints as well as material values than the organic components. This is especially true for the precious metals gold and silver. The ideal market values could be achieved provided that the materials could be thoroughly extracted and converted into marketable secondary raw materials with the required quality. However, it is unlikely that this is technically feasible for some of the materials. Materials rated unlikely to be recovered as secondary raw materials according to technical limitations were assumed to exhibit a neutral market value7 and are shown under the header “Market value (feasible)”.
Table 9 and Table 10 summarise the main properties of RFID tags with paper and PP faces. The paper faces result in increased weight of the tags but due to the lower CO2 inventory from the production, the overall CO2 inventory of the tag is lower. When comparing the different aerial materials, it becomes obvious that the tags with aluminium aerials exhibit the lowest overall CO2 inventory. Compared hereto, the CO2 inventory of tags with copper and silver aerials is about 13–16 percent and 98–125 percent higher.
7 Considering that in reality this would imply that the material would be shifted into a waste stream for disposal, which generates cost, this is a rather conservative approach
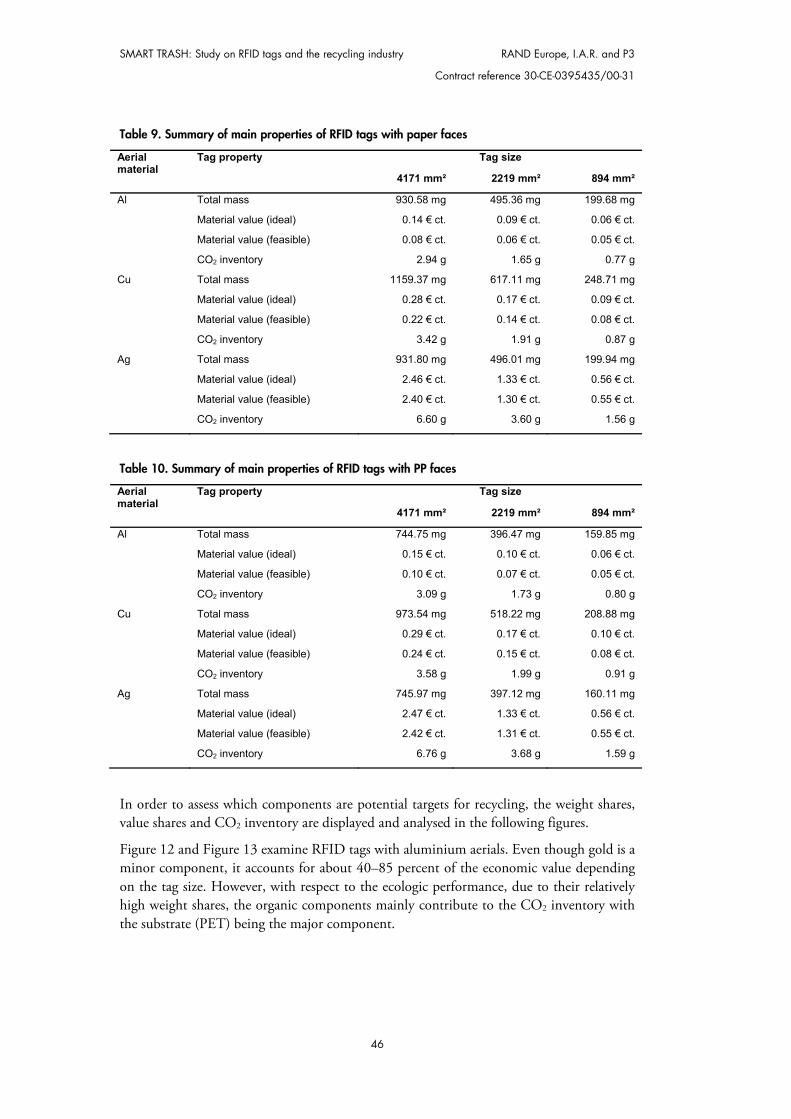
SMART TRASH: Study on RFID tags and the recycling industry RAND Europe, I.A.R. and P3
Contract reference 30-CE-0395435/00-31
46
Table 9. Summary of main properties of RFID tags with paper faces
Aerial material
Tag property Tag size
4171 mm² 2219 mm² 894 mm²
Al Total mass 930.58 mg 495.36 mg 199.68 mg
Material value (ideal) 0.14 € ct. 0.09 € ct. 0.06 € ct.
Material value (feasible) 0.08 € ct. 0.06 € ct. 0.05 € ct.
CO2 inventory 2.94 g 1.65 g 0.77 g
Cu Total mass 1159.37 mg 617.11 mg 248.71 mg
Material value (ideal) 0.28 € ct. 0.17 € ct. 0.09 € ct.
Material value (feasible) 0.22 € ct. 0.14 € ct. 0.08 € ct.
CO2 inventory 3.42 g 1.91 g 0.87 g
Ag Total mass 931.80 mg 496.01 mg 199.94 mg
Material value (ideal) 2.46 € ct. 1.33 € ct. 0.56 € ct.
Material value (feasible) 2.40 € ct. 1.30 € ct. 0.55 € ct.
CO2 inventory 6.60 g 3.60 g 1.56 g
Table 10. Summary of main properties of RFID tags with PP faces
Aerial material
Tag property Tag size
4171 mm² 2219 mm² 894 mm²
Al Total mass 744.75 mg 396.47 mg 159.85 mg
Material value (ideal) 0.15 € ct. 0.10 € ct. 0.06 € ct.
Material value (feasible) 0.10 € ct. 0.07 € ct. 0.05 € ct.
CO2 inventory 3.09 g 1.73 g 0.80 g
Cu Total mass 973.54 mg 518.22 mg 208.88 mg
Material value (ideal) 0.29 € ct. 0.17 € ct. 0.10 € ct.
Material value (feasible) 0.24 € ct. 0.15 € ct. 0.08 € ct.
CO2 inventory 3.58 g 1.99 g 0.91 g
Ag Total mass 745.97 mg 397.12 mg 160.11 mg
Material value (ideal) 2.47 € ct. 1.33 € ct. 0.56 € ct.
Material value (feasible) 2.42 € ct. 1.31 € ct. 0.55 € ct.
CO2 inventory 6.76 g 3.68 g 1.59 g
In order to assess which components are potential targets for recycling, the weight shares, value shares and CO2 inventory are displayed and analysed in the following figures.
Figure 12 and Figure 13 examine RFID tags with aluminium aerials. Even though gold is a minor component, it accounts for about 40–85 percent of the economic value depending on the tag size. However, with respect to the ecologic performance, due to their relatively high weight shares, the organic components mainly contribute to the CO2 inventory with the substrate (PET) being the major component.
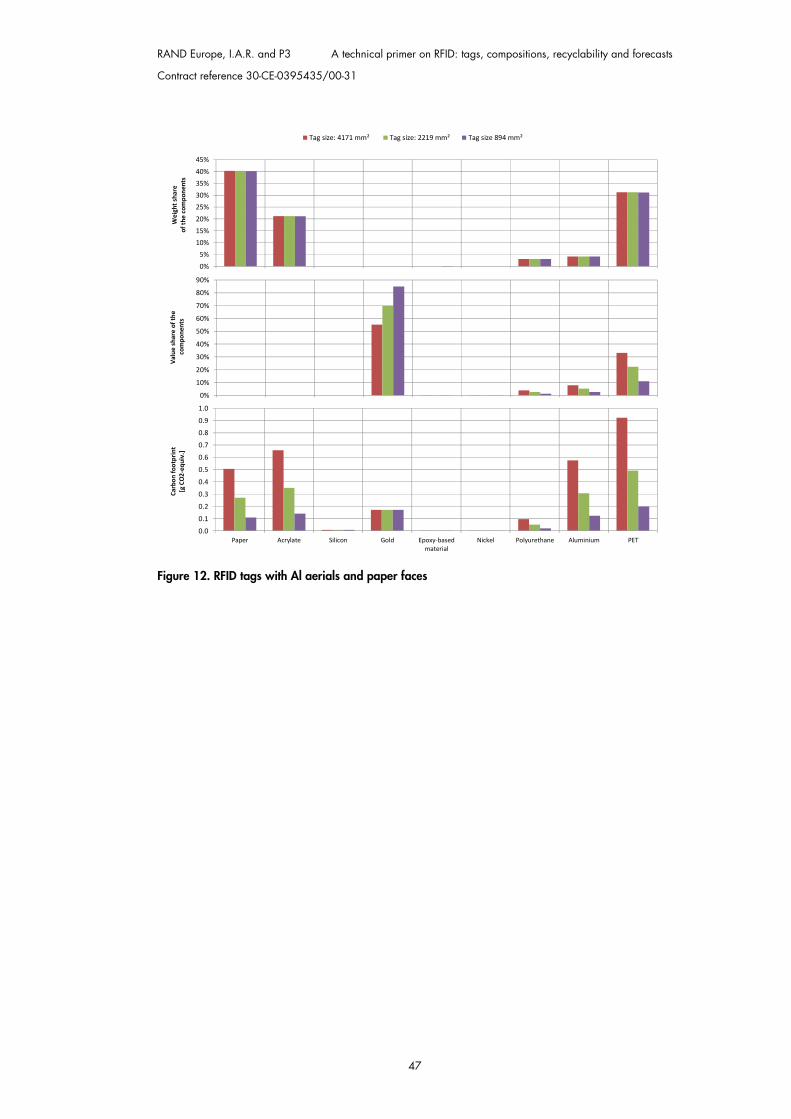
RAND Europe, I.A.R. and P3 A technical primer on RFID: tags, compositions, recyclability and forecasts
Contract reference 30-CE-0395435/00-31
47
Figure 12. RFID tags with Al aerials and paper faces
0%5%
10%15%20%25%30%35%40%45%
Paper Acrylate Silicon Gold Epoxy-basedmaterial
Nickel Polyurethane Aluminium PET
Wei
ght s
hare
of
the
com
pone
nts
Tag size: 4171 mm² Tag size: 2219 mm² Tag size 894 mm²
0%
10%
20%
30%
40%
50%
60%
70%
80%
90%
Paper Acrylate Silicon Gold Epoxy-basedmaterial
Nickel Polyurethane Aluminium PET
Valu
e sh
are
of th
eco
mpo
nent
s
0.0
0.1
0.2
0.3
0.4
0.5
0.6
0.7
0.80.9
1.0
Paper Acrylate Silicon Gold Epoxy-basedmaterial
Nickel Polyurethane Aluminium PET
Carb
on fo
otpr
int
[g C
O2-
equi
v.]
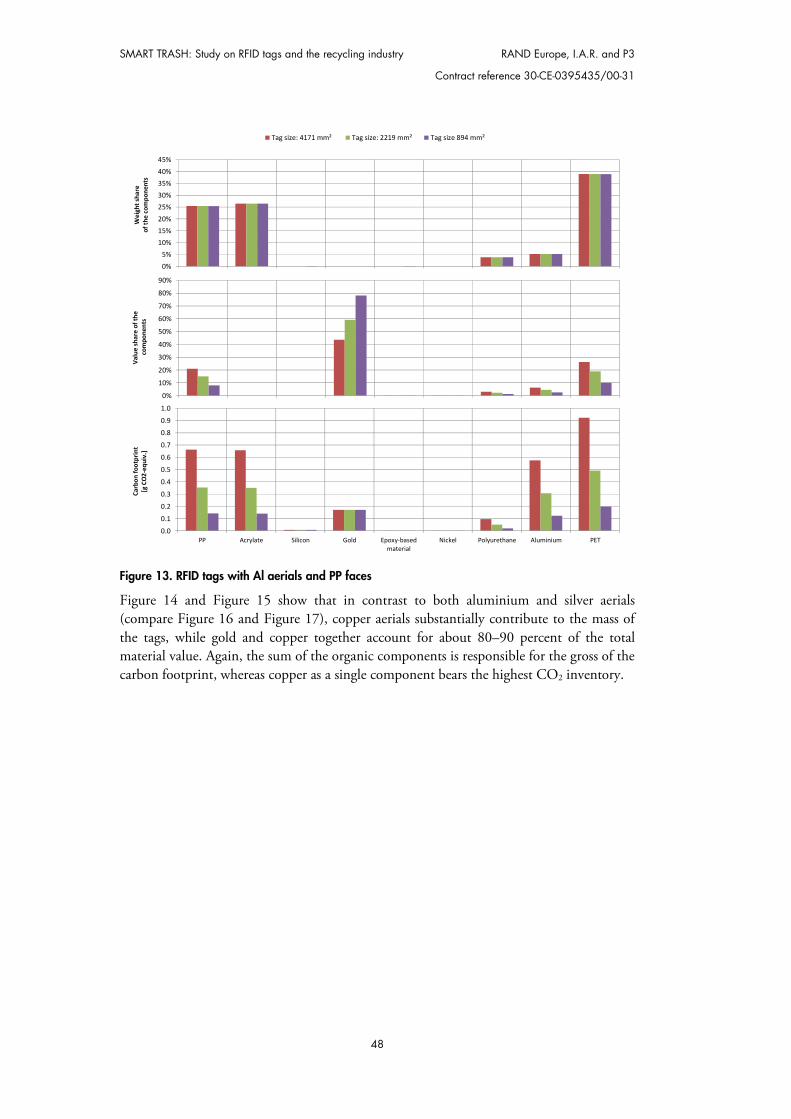
SMART TRASH: Study on RFID tags and the recycling industry RAND Europe, I.A.R. and P3
Contract reference 30-CE-0395435/00-31
48
Figure 13. RFID tags with Al aerials and PP faces
Figure 14 and Figure 15 show that in contrast to both aluminium and silver aerials (compare Figure 16 and Figure 17), copper aerials substantially contribute to the mass of the tags, while gold and copper together account for about 80–90 percent of the total material value. Again, the sum of the organic components is responsible for the gross of the carbon footprint, whereas copper as a single component bears the highest CO2 inventory.
0%5%
10%15%20%25%30%35%40%45%
PP Acrylate Silicon Gold Epoxy-basedmaterial
Nickel Polyurethane Aluminium PET
Wei
ght s
hare
of
the
com
pone
nts
Tag size: 4171 mm² Tag size: 2219 mm² Tag size 894 mm²
0%
10%
20%
30%
40%
50%
60%
70%
80%
90%
PP Acrylate Silicon Gold Epoxy-basedmaterial
Nickel Polyurethane Aluminium PET
Valu
e sh
are
of th
eco
mpo
nent
s
0.0
0.1
0.2
0.3
0.4
0.5
0.6
0.7
0.80.9
1.0
PP Acrylate Silicon Gold Epoxy-basedmaterial
Nickel Polyurethane Aluminium PET
Carb
on fo
otpr
int
[g C
O2-
equi
v.]
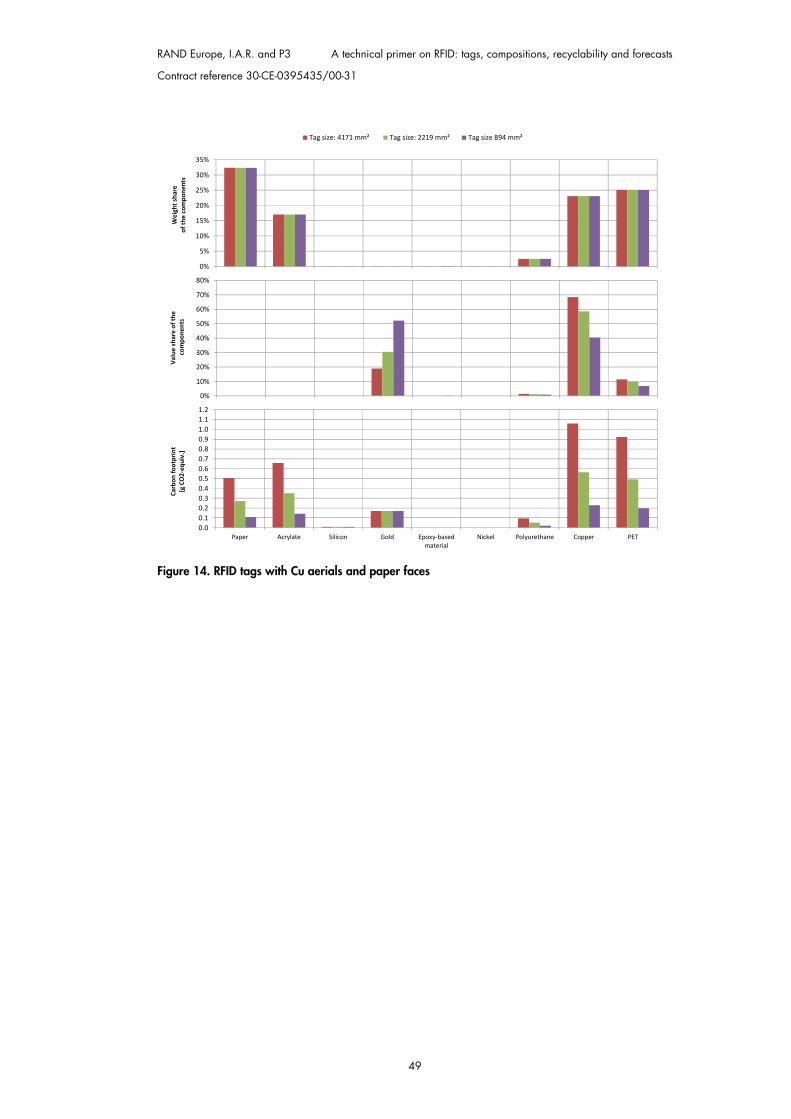
RAND Europe, I.A.R. and P3 A technical primer on RFID: tags, compositions, recyclability and forecasts
Contract reference 30-CE-0395435/00-31
49
Figure 14. RFID tags with Cu aerials and paper faces
0%
5%
10%
15%
20%
25%
30%
35%
Paper Acrylate Silicon Gold Epoxy-basedmaterial
Nickel Polyurethane Copper PET
Wei
ght s
hare
of
the
com
pone
nts
Tag size: 4171 mm² Tag size: 2219 mm² Tag size 894 mm²
0%
10%
20%
30%
40%
50%
60%
70%
80%
Paper Acrylate Silicon Gold Epoxy-basedmaterial
Nickel Polyurethane Copper PET
Valu
e sh
are
of th
eco
mpo
nent
s
0.00.10.20.30.40.50.60.70.80.91.01.11.2
Paper Acrylate Silicon Gold Epoxy-basedmaterial
Nickel Polyurethane Copper PET
Carb
on fo
otpr
int
[g C
O2-
equi
v.]
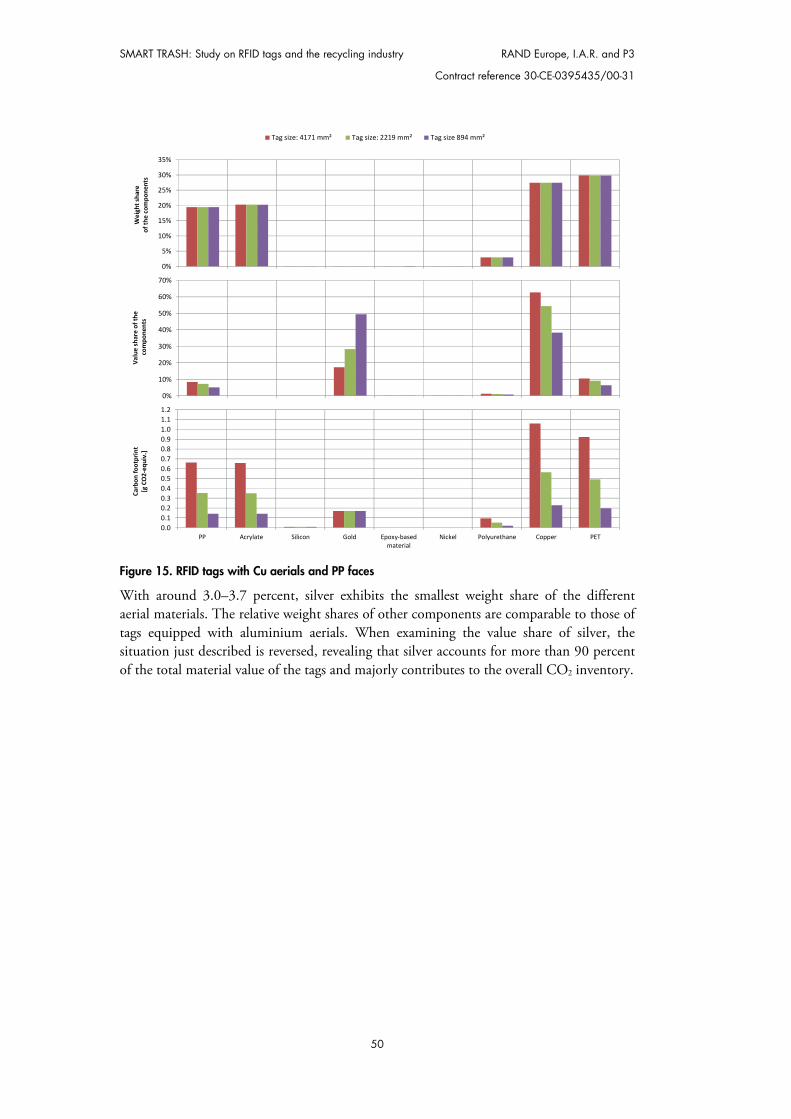
SMART TRASH: Study on RFID tags and the recycling industry RAND Europe, I.A.R. and P3
Contract reference 30-CE-0395435/00-31
50
Figure 15. RFID tags with Cu aerials and PP faces
With around 3.0–3.7 percent, silver exhibits the smallest weight share of the different aerial materials. The relative weight shares of other components are comparable to those of tags equipped with aluminium aerials. When examining the value share of silver, the situation just described is reversed, revealing that silver accounts for more than 90 percent of the total material value of the tags and majorly contributes to the overall CO2 inventory.
0%
5%
10%
15%
20%
25%
30%
35%
PP Acrylate Silicon Gold Epoxy-basedmaterial
Nickel Polyurethane Copper PET
Wei
ght s
hare
of
the
com
pone
nts
Tag size: 4171 mm² Tag size: 2219 mm² Tag size 894 mm²
0%
10%
20%
30%
40%
50%
60%
70%
PP Acrylate Silicon Gold Epoxy-basedmaterial
Nickel Polyurethane Copper PET
Valu
e sh
are
of th
eco
mpo
nent
s
0.00.10.20.30.40.50.60.70.80.91.01.11.2
PP Acrylate Silicon Gold Epoxy-basedmaterial
Nickel Polyurethane Copper PET
Carb
on fo
otpr
int
[g C
O2-
equi
v.]
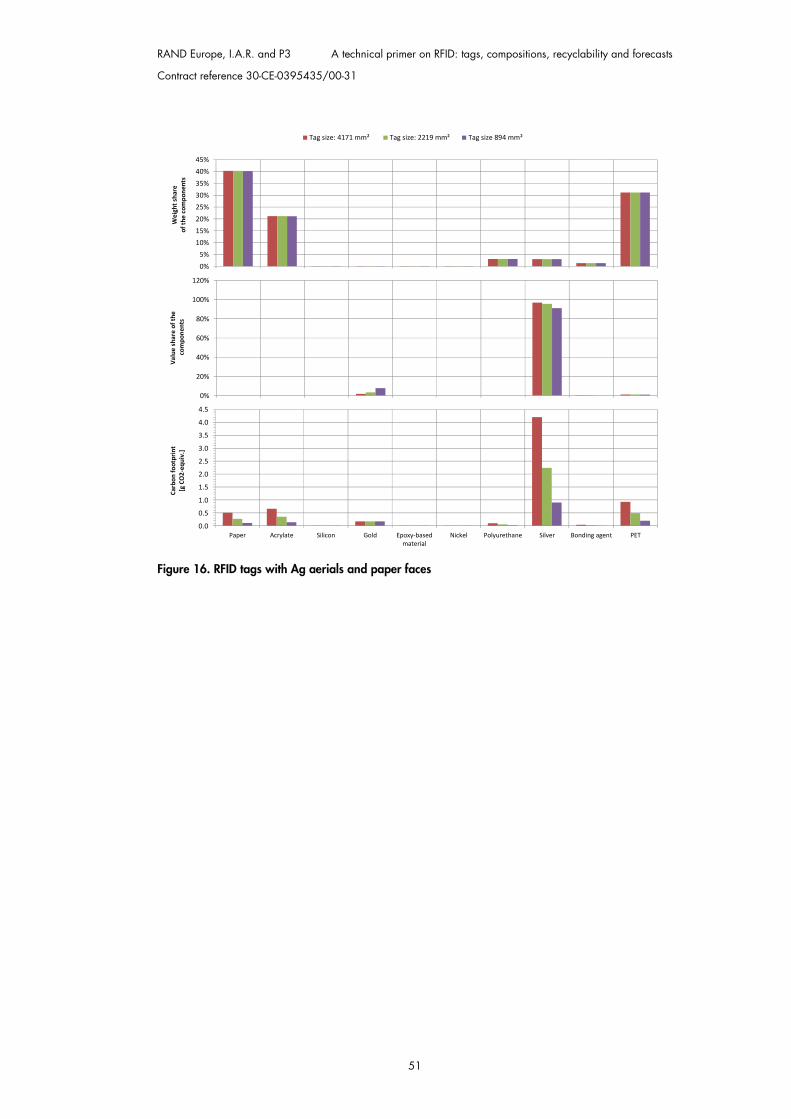
RAND Europe, I.A.R. and P3 A technical primer on RFID: tags, compositions, recyclability and forecasts
Contract reference 30-CE-0395435/00-31
51
Figure 16. RFID tags with Ag aerials and paper faces
0%5%
10%15%20%25%30%35%40%45%
Paper Acrylate Silicon Gold Epoxy-basedmaterial
Nickel Polyurethane Silver (in print) Bonding agent(in print)
PET
Wei
ght s
hare
of
the
com
pone
nts
Tag size: 4171 mm² Tag size: 2219 mm² Tag size 894 mm²
0%
20%
40%
60%
80%
100%
120%
Paper Acrylate Silicon Gold Epoxy-basedmaterial
Nickel Polyurethane Silver (in print) Bonding agent(in print)
PET
Valu
e sh
are
of th
eco
mpo
nent
s
0.0
0.5
1.0
1.5
2.0
2.5
3.0
3.5
4.0
4.5
Paper Acrylate Silicon Gold Epoxy-basedmaterial
Nickel Polyurethane Silver Bonding agent PET
Carb
on fo
otpr
int
[g C
O2-
equi
v.]
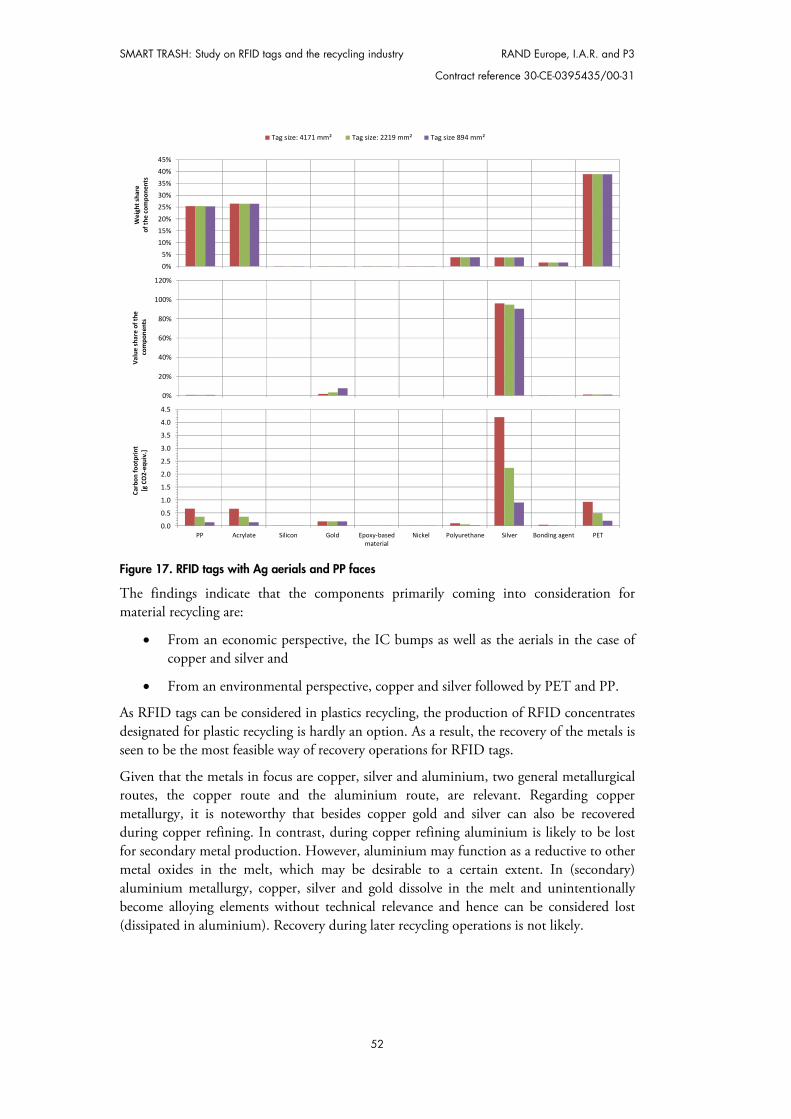
SMART TRASH: Study on RFID tags and the recycling industry RAND Europe, I.A.R. and P3
Contract reference 30-CE-0395435/00-31
52
Figure 17. RFID tags with Ag aerials and PP faces
The findings indicate that the components primarily coming into consideration for material recycling are:
From an economic perspective, the IC bumps as well as the aerials in the case of copper and silver and
From an environmental perspective, copper and silver followed by PET and PP.
As RFID tags can be considered in plastics recycling, the production of RFID concentrates designated for plastic recycling is hardly an option. As a result, the recovery of the metals is seen to be the most feasible way of recovery operations for RFID tags.
Given that the metals in focus are copper, silver and aluminium, two general metallurgical routes, the copper route and the aluminium route, are relevant. Regarding copper metallurgy, it is noteworthy that besides copper gold and silver can also be recovered during copper refining. In contrast, during copper refining aluminium is likely to be lost for secondary metal production. However, aluminium may function as a reductive to other metal oxides in the melt, which may be desirable to a certain extent. In (secondary) aluminium metallurgy, copper, silver and gold dissolve in the melt and unintentionally become alloying elements without technical relevance and hence can be considered lost (dissipated in aluminium). Recovery during later recycling operations is not likely.
0%5%
10%15%20%25%30%35%40%45%
PP Acrylate Silicon Gold Epoxy-basedmaterial
Nickel Polyurethane Silver (in print) Bonding agent(in print)
PET
Wei
ght s
hare
of
the
com
pone
nts
Tag size: 4171 mm² Tag size: 2219 mm² Tag size 894 mm²
0%
20%
40%
60%
80%
100%
120%
PP Acrylate Silicon Gold Epoxy-basedmaterial
Nickel Polyurethane Silver (in print) Bonding agent(in print)
PET
Valu
e sh
are
of th
eco
mpo
nent
s
0.0
0.5
1.0
1.5
2.0
2.5
3.0
3.5
4.0
4.5
PP Acrylate Silicon Gold Epoxy-basedmaterial
Nickel Polyurethane Silver Bonding agent PET
Carb
on fo
otpr
int
[g C
O2-
equi
v.]
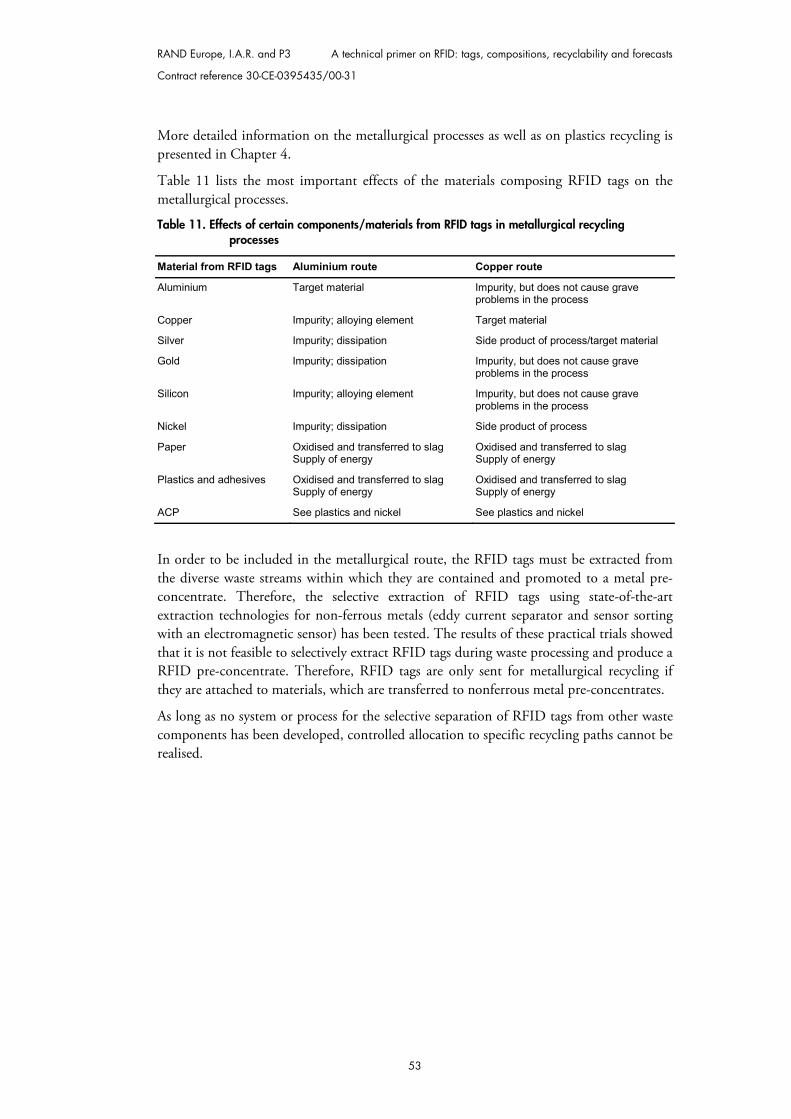
RAND Europe, I.A.R. and P3 A technical primer on RFID: tags, compositions, recyclability and forecasts
Contract reference 30-CE-0395435/00-31
53
More detailed information on the metallurgical processes as well as on plastics recycling is presented in Chapter 4.
Table 11 lists the most important effects of the materials composing RFID tags on the metallurgical processes.
Table 11. Effects of certain components/materials from RFID tags in metallurgical recycling processes
Material from RFID tags Aluminium route Copper route
Aluminium Target material Impurity, but does not cause grave problems in the process
Copper Impurity; alloying element Target material
Silver Impurity; dissipation Side product of process/target material
Gold Impurity; dissipation Impurity, but does not cause grave problems in the process
Silicon Impurity; alloying element Impurity, but does not cause grave problems in the process
Nickel Impurity; dissipation Side product of process
Paper Oxidised and transferred to slag Supply of energy
Oxidised and transferred to slag Supply of energy
Plastics and adhesives Oxidised and transferred to slag Supply of energy
Oxidised and transferred to slag Supply of energy
ACP See plastics and nickel See plastics and nickel
In order to be included in the metallurgical route, the RFID tags must be extracted from the diverse waste streams within which they are contained and promoted to a metal pre-concentrate. Therefore, the selective extraction of RFID tags using state-of-the-art extraction technologies for non-ferrous metals (eddy current separator and sensor sorting with an electromagnetic sensor) has been tested. The results of these practical trials showed that it is not feasible to selectively extract RFID tags during waste processing and produce a RFID pre-concentrate. Therefore, RFID tags are only sent for metallurgical recycling if they are attached to materials, which are transferred to nonferrous metal pre-concentrates.
As long as no system or process for the selective separation of RFID tags from other waste components has been developed, controlled allocation to specific recycling paths cannot be realised.

RAND Europe, I.A.R. and P3 Contract reference 30-CE-0395435/00-31
55
CHAPTER 3 The background context for assessing the impacts of RFID technology
This chapter establishes the background context necessary for assessing the impact of RFID on the waste management and recycling industry as inert objects. This background is important because if RFID tags are attached to objects, the tags will find their way into waste collection, treatment and disposal systems after these objects are discarded as waste. It is therefore imperative that we introduce the relevant EU legislative framework, both holistic EU waste framework legislation as well as legislation specific to certain wastes, and give an overview of waste management.
Considering that most aspects of waste management are regulated through a set of EU directives, the overall regulations apply for all Member States. However, to make the analysis presented in later chapters more manageable, EU Member States have been subdivided into clusters based upon similarities in their waste management systems, and these clusters are presented here.
In addition, the overview of waste management technical processes given here will feed into the analysis presented in Chapter 4. This analysis will be used in the development of recommendations for the utilisation of RFID technology. We will present
This chapter explains why RFID tags and waste management have to be seen in context with waste management legislation.
Framework legislation exists at the EU level, but national interpretations and implementations vary.
Collective waste denominations, such as municipal solid waste, are subdivided into different waste streams.
The waste streams are subjected to different pieces of legislation, collection and treatment.
RFID tags exhibit a wide field of application and as a result are introduced into various waste streams and treatment paths.
The EU framework legislation is analysed in this context and interpretations with regard to the position of RFID are outlined.
The member states are clustered, based on similarities in waste management.
SMART TRASH: Study on RFID tags and the recycling industry RAND Europe, I.A.R. and P3
Contract reference 30-CE-0395435/00-31
56
recommendations that will facilitate the utilisation and, at the same time, ensure that the advancement of recycling is not compromised by the presence of tags.
3.1 EU waste management legislation and interactional aspects of the presence of RFID tags
To present an overview of waste management legislation, two basic frameworks are considered in this report. These are:
The strategy on waste prevention and recycling that has been developed under the 6th Environmental Action Programme (EAP) to support the transfer of EU Directives into Member State legislation.
Directives and other legislation that define the legal requirements regarding waste management.
The links between these two legislative frameworks are depicted in Figure 18 and are further described in the text that follows. The strategies of the 6th EAP are shown in orange boxes, while directives and legislation are shown in green boxes.

RAND Europe, I.A.R. and P3 The background context for assessing the impacts of RFID technology
Contract reference 30-CE-0395435/00-31
57
Figure 18. Structure of better regulation strategies and waste management legislation in the EU
3.1.1 Strategic approach: The 6th Environmental Action Programme In 2002, the 6th EAP was adopted by the Commission and seven thematic strategies were defined to achieve the aims of the programme. Two of the seven strategies – waste prevention and recycling, and natural resources – set out the EC’s position on waste and resource management.
The strategy on waste prevention and recycling underlines the importance of reporting on the implementation of EU framework directives as required by the framework legislation itself. The EC has conducted reviews of that reporting and has concluded that the level of
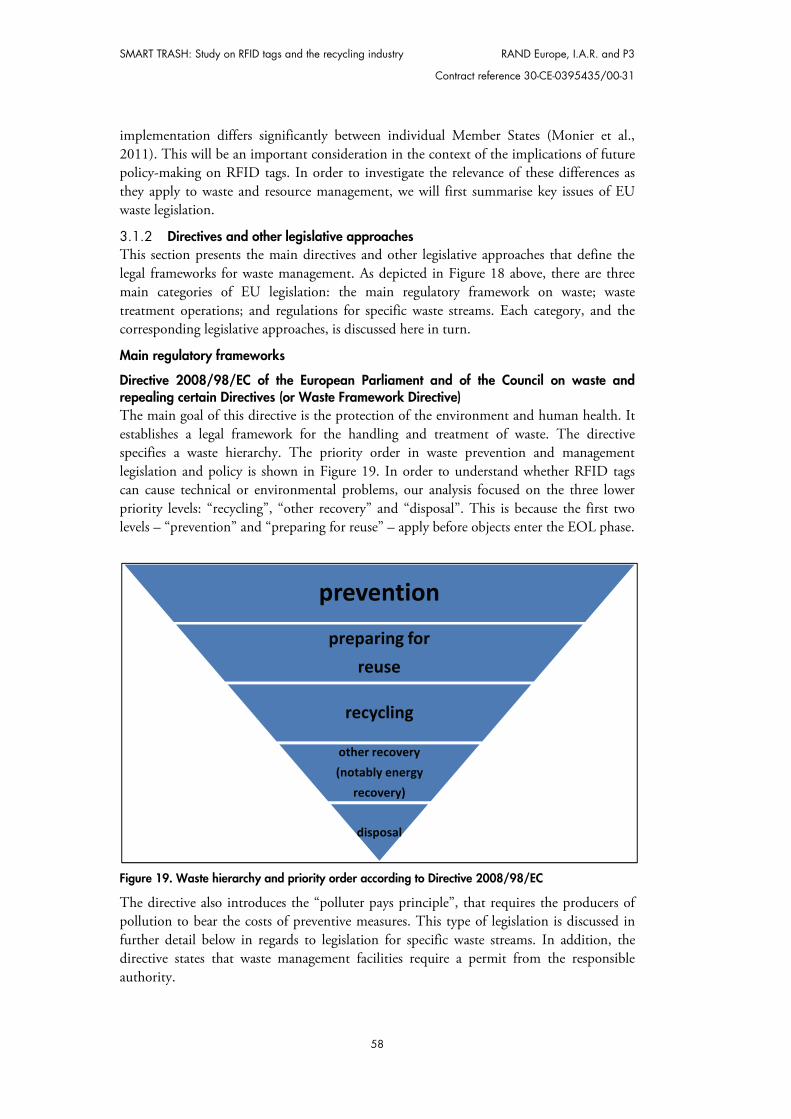
SMART TRASH: Study on RFID tags and the recycling industry RAND Europe, I.A.R. and P3
Contract reference 30-CE-0395435/00-31
58
implementation differs significantly between individual Member States (Monier et al., 2011). This will be an important consideration in the context of the implications of future policy-making on RFID tags. In order to investigate the relevance of these differences as they apply to waste and resource management, we will first summarise key issues of EU waste legislation.
3.1.2 Directives and other legislative approaches This section presents the main directives and other legislative approaches that define the legal frameworks for waste management. As depicted in Figure 18 above, there are three main categories of EU legislation: the main regulatory framework on waste; waste treatment operations; and regulations for specific waste streams. Each category, and the corresponding legislative approaches, is discussed here in turn.
Main regulatory frameworks
Directive 2008/98/EC of the European Parliament and of the Council on waste and repealing certain Directives (or Waste Framework Directive) The main goal of this directive is the protection of the environment and human health. It establishes a legal framework for the handling and treatment of waste. The directive specifies a waste hierarchy. The priority order in waste prevention and management legislation and policy is shown in Figure 19. In order to understand whether RFID tags can cause technical or environmental problems, our analysis focused on the three lower priority levels: “recycling”, “other recovery” and “disposal”. This is because the first two levels – “prevention” and “preparing for reuse” – apply before objects enter the EOL phase.
Figure 19. Waste hierarchy and priority order according to Directive 2008/98/EC
The directive also introduces the “polluter pays principle”, that requires the producers of pollution to bear the costs of preventive measures. This type of legislation is discussed in further detail below in regards to legislation for specific waste streams. In addition, the directive states that waste management facilities require a permit from the responsible authority.
prevention
preparing forreuse
recycling
other recovery(notably energy
recovery)
disposal
RAND Europe, I.A.R. and P3 The background context for assessing the impacts of RFID technology
Contract reference 30-CE-0395435/00-31
59
Directive 2008/1/EC of the European Parliament and of the Council concerning integrated pollution prevention and control (or IPPC Directive) The IPPC Directive demands that industrial and agricultural activities with a high pollution potential have an operating permit. The directive seeks to prevent, or at a minimum reduce (if prevention is not feasible), emissions to soil, water and air. To enforce this, the permit contains certain basic obligations and requires adherence to Best Available Techniques (BATs).
Regulation (EC) No 1013/2006 of the European Parliament and of the Council on shipments of waste, as amended (or Waste Shipment Regulation) The basic tenets of the waste shipment regulation are based on the conclusions of the 1989 Basel Convention regarding the control of transboundary movements of hazardous wastes and their disposal. Through the adoption of this regulation, rules to control such movement of hazardous wastes and to bring the Community system for the supervision and control of waste movements into line with the Basel Convention are implemented. These rules include:
The requirement to inform other parties if the right to prohibit the import of hazardous wastes or wastes for disposal is exercised.
A requirement to take appropriate measures to reduce the generation of hazardous and other wastes, ensure the availability of disposal facilities, ensure that the necessary measures to prevent pollution due to the handling of hazardous wastes and related wastes are taken and ensure that transboundary movements are reduced to a minimum (UNEP, 2011).
Legislation relevant to waste treatment operations The directives below are those that apply to waste treatment operations more broadly, including landfilling, incineration and recycling.
Council Directive 1999/31/EC of 26 April 1999 on the landfill of waste (or Landfill Directive) The objective of the directive is to prevent and reduce the environmental impacts from landfilling waste. It defines three classes of landfill (hazardous, non-hazardous and inert waste) with different standards set out regarding constructive and operational measures orientated at the hazardous potential of the waste that can be received.
Directive 2000/76/EC of the European Parliament and of the Council of 4 December 2000 on the incineration of waste (or Waste Incineration Directive) The main objective of this directive is to limit risks connected to the incineration of hazardous and non-hazardous waste by setting out technical and operational requirements and defining emission limit values (e.g., air emission limit values) for waste incineration.
Regulations for specific waste streams The remaining directive summaries are classed as producer-responsibility legislation that implements the “polluter pays” principle.
SMART TRASH: Study on RFID tags and the recycling industry RAND Europe, I.A.R. and P3
Contract reference 30-CE-0395435/00-31
60
Directive 2006/66/EC of the European Parliament and of the Council of 6 September 2006 on batteries and accumulators and waste batteries and accumulators and repealing Directive 91/157/EEC (or Battery Directive) The objective is to minimise the amount of hazardous substances – mercury, cadmium and lead – exposed to the environment. In addition to limit values for substances, a high recovery rate and the application of best available techniques for recycling activities are required. The cost of the collection, treatment and recycling of batteries and accumulators must be assumed by the producers.
Directive 2000/53/EC of the European Parliament and of the Council of 18 September 2000 on end-of-life vehicles (or ELV Directive)
The aim of this directive is to minimise the impact of end-of-life vehicles (ELVs) on the environment. The main points are the promotion of vehicle design optimised for recycling and reuse, as well as requirements for the collection and treatment of ELVs. Car manufacturers are responsible for minimum technical requirements for treatment facilities and processes (e.g., the requirement to strip valuable or hazardous material before further processing to ensure suitable materials for reuse and recycling) and recycling rates are defined.
Directive 2002/96/EC of the European Parliament and of the Council of 27 January 2003 on waste electrical and electronic equipment (or WEEE Directive) This directive promotes advances in the reuse, recycling and reduction of the amount of waste that arises from electrical and electronic equipment. The producers of electrical and electronic equipment must apply a system that allows the separate collection of different categories of WEEE. It also specifies that the best available techniques should be applied for the recovery of WEEE.
Directive 2002/95/EC of the European Parliament and of the Council on the restriction of the use of certain hazardous substances in electrical and electronic equipment (or RoHS Directive)
The scope of the RoHS Directive is comparable to that of the WEEE Directive. The directive requires that lead, mercury, cadmium, hexavalent chromium, polybrominated biphenyls (PBBs) and polybrominated diphenyl ethers (PBDEs) should not be used in electrical and electronic equipment and should be replaced by other substances. However, if the avoidance is not completely possible tolerance levels are defined.
European Parliament and Council Directive 94/62/EC of 20 December 1994 on packaging and packaging waste (or Packaging Directive) The main aim of this directive is to stimulate the development of packaging collection and/or treatment systems and the reduction of packaging waste of any origin. The Directive specifies that Member States should minimise the weight and volume of packaging, reduce the application of hazardous materials used in packaging and establish packaging-collection systems. It should be pointed out that these measures are required to achieve the demanded recycling targets.
RAND Europe, I.A.R. and P3 The background context for assessing the impacts of RFID technology
Contract reference 30-CE-0395435/00-31
61
3.2 RFID tags in context with the legislation
Having considered the relevant legislative frameworks, it is important to note if and how they are related to RFID technology. We will consider each category of waste legislation in turn.
Starting with the “main regulatory framework” (see Figure 18), the waste shipment regulation would only apply to RFID tags if the tags formed a separate waste stream. This is not anticipated due to the range of RFID tag applications. However, the waste shipment regulation does apply to existing waste streams in which RFID tags are expected to end up. Since the directive on waste defines waste as “any substance or object which the holder discards or intends or is required to discard” (European Commission, 2008), it could be considered that the waste hierarchy and its priority order applies to RFID tags as much as to any other item that is not specifically excluded from the directive. This logic applies to both hazardous and non-hazardous waste. Annex 3 of the Waste Framework Directive (WFD) defines the properties qualifying waste as hazardous waste. None of the mentioned properties apply to passive RFID tags assuming their composition is as described in Chapter 2. However, RFID tags applied to hazardous waste objects will be introduced into the designated treatment path for the hazardous material.
The fact that RFID tags enter various waste streams has been introduced before. However, considering this in the context of waste legislation, it becomes clear that we do need to consider the implications of the legislation for RFID. Thus, the different directives specifying the management of waste streams need to be analysed to understand whether, and how, a connection to the fate of RFID tags can be established.
We will start by looking at the lowest priority waste management operations, namely disposal operations, because these have to be applied if higher prioritised operations fail (e.g., due to systematic failures in waste separation at source). Disposal operations can roughly be divided into landfilling and incineration. Therefore, if RFID tags end up in these disposal operations the Landfill Directive and the Waste Incineration Directive are applicable. The directives would only be affected if tags in waste streams resulted in increasing emissions from the disposal operations. When the limit values for emissions to the environment are exceeded, the plant operators would be forced to upgrade the installed emission control systems to uphold the status quo regardless of changes in the composition of the input materials. The aspect of RFID tags entering landfills or waste incinerators and expected impacts on the technology or the emissions are further investigated in Chapter 4.
The aspect of rrecycling and other recovery in waste management operations is included in the form of “the strategy on prevention and recycling of waste” that focuses on incentives to promote recycling and resource recovery. This encompasses the producer responsibility directives described previously:
Packaging Directive Battery Directive EOL Directives WEEE Directive.
In order to estimate the implications RFID tags might have in relation to these directives we have to consider the distinction between energy recovery and material recycling. Energy
SMART TRASH: Study on RFID tags and the recycling industry RAND Europe, I.A.R. and P3
Contract reference 30-CE-0395435/00-31
62
recovery happens through thermal conversion processes. The main parameters are the energy content of the material that is combusted and the components that could increase emissions from the thermal conversion process. In the case of material recycling, the final purity of the recyclate needs to meet qualitative requirements, which usually results in extensive subsidiary purification steps in the recycling facilities. RFID tags could have implications for both of these processes, but the effects will depend on the particular waste streams.
Packaging is of special significance because predictions of RFID use indicate that packaging material is one of the main areas of application of RFID tags. Wastes that fall under the Packaging Directive are required to be recovered and recycled, and legally binding targets have been set. Recycling processes for packaging waste and the different packaging materials have been developed in the past. Depending on the way RFID tags are attached and depending on the behaviour of tags in waste separation processes (see Chapter 4), most tags are expected to be carried with the carrier objects into the actual recycling process. For some materials, this will mean material recycling is possible (e.g., glass and metals), while other materials, such as paper and plastic, can either be recycled or used for energy recovery. In the case of energy recovery, the main issue is whether RFID tags and their contained substances contribute significantly to the emissions from the thermal treatment plants. With regard to material recycling, the tags and contained materials might affect the recycling processes or the quality of the recyclates. These issues are investigated further in Chapter 4, but it is important to highlight them here in the context of the legislation that governs these processes.
The Battery Directive states that batteries should be recycled with the best available technologies, and that recycling should not include energy recovery. Furthermore, batteries and accumulators have to be readily and safely removed from items. These requirements are not affected by passive RFID tags, but there might be a problem regarding tags on embedded batteries or accumulators. RFID tags applied to batteries or accumulators will be disposed with them into the relevant collection and treatment systems.
The directive regarding vehicles (2000/53/EC) covers the treatment of ELVs and the design of vehicles in relation to their reuse and recovery. Neither have a direct contextual relationship to RFID tags. Directive 2005/64/EC (on the reuse, recycling and recovering of motor vehicles) presents a field in which the utilisation of RFID technology could possibly have a beneficial impact. This aspect is further investigated in Part B of this study.
The final waste stream directives that may impact on RFID tags are 2002/96/EC (on waste electrical and electronic equipment – WEEE) and 2002/95/EC (on the restriction of the use of certain hazardous substances in electrical and electronic equipment – RoHS). These directives are both directly and indirectly connected to RFID technology. This is because RFID tags can be contained in electrical or electronic devices, or the RFID tags themselves can be considered as EEE in some cases. Possible impacts on WEEE treatment are analysed in the technical section (4.6.1). However, if tags are considered to be WEEE, this may have an impact on the utilisation of RFID tags. This issue, though, is still an area of uncertainty and merits further discussion.
Article 3(a) of the WEEE Directive defines electrical and electronic equipment (EEE) as:
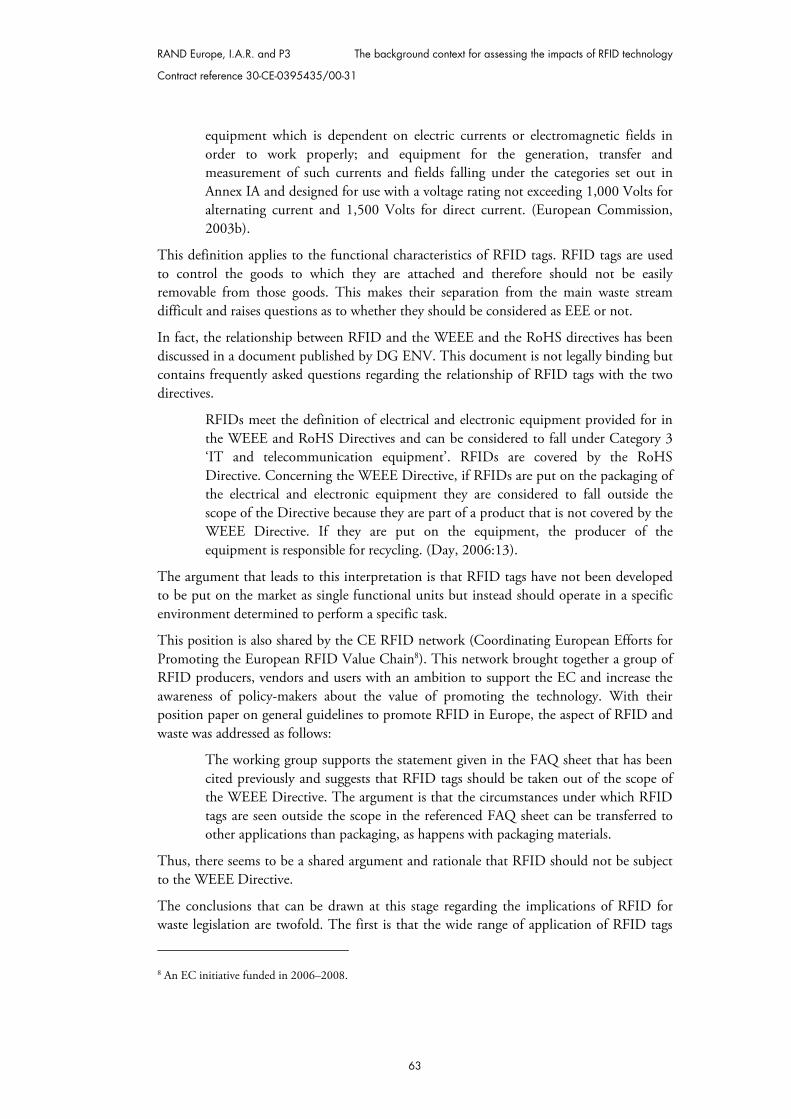
RAND Europe, I.A.R. and P3 The background context for assessing the impacts of RFID technology
Contract reference 30-CE-0395435/00-31
63
equipment which is dependent on electric currents or electromagnetic fields in order to work properly; and equipment for the generation, transfer and measurement of such currents and fields falling under the categories set out in Annex IA and designed for use with a voltage rating not exceeding 1,000 Volts for alternating current and 1,500 Volts for direct current. (European Commission, 2003b).
This definition applies to the functional characteristics of RFID tags. RFID tags are used to control the goods to which they are attached and therefore should not be easily removable from those goods. This makes their separation from the main waste stream difficult and raises questions as to whether they should be considered as EEE or not.
In fact, the relationship between RFID and the WEEE and the RoHS directives has been discussed in a document published by DG ENV. This document is not legally binding but contains frequently asked questions regarding the relationship of RFID tags with the two directives.
RFIDs meet the definition of electrical and electronic equipment provided for in the WEEE and RoHS Directives and can be considered to fall under Category 3 ‘IT and telecommunication equipment’. RFIDs are covered by the RoHS Directive. Concerning the WEEE Directive, if RFIDs are put on the packaging of the electrical and electronic equipment they are considered to fall outside the scope of the Directive because they are part of a product that is not covered by the WEEE Directive. If they are put on the equipment, the producer of the equipment is responsible for recycling. (Day, 2006:13).
The argument that leads to this interpretation is that RFID tags have not been developed to be put on the market as single functional units but instead should operate in a specific environment determined to perform a specific task.
This position is also shared by the CE RFID network (Coordinating European Efforts for Promoting the European RFID Value Chain8). This network brought together a group of RFID producers, vendors and users with an ambition to support the EC and increase the awareness of policy-makers about the value of promoting the technology. With their position paper on general guidelines to promote RFID in Europe, the aspect of RFID and waste was addressed as follows:
The working group supports the statement given in the FAQ sheet that has been cited previously and suggests that RFID tags should be taken out of the scope of the WEEE Directive. The argument is that the circumstances under which RFID tags are seen outside the scope in the referenced FAQ sheet can be transferred to other applications than packaging, as happens with packaging materials.
Thus, there seems to be a shared argument and rationale that RFID should not be subject to the WEEE Directive.
The conclusions that can be drawn at this stage regarding the implications of RFID for waste legislation are twofold. The first is that the wide range of application of RFID tags
8 An EC initiative funded in 2006–2008.
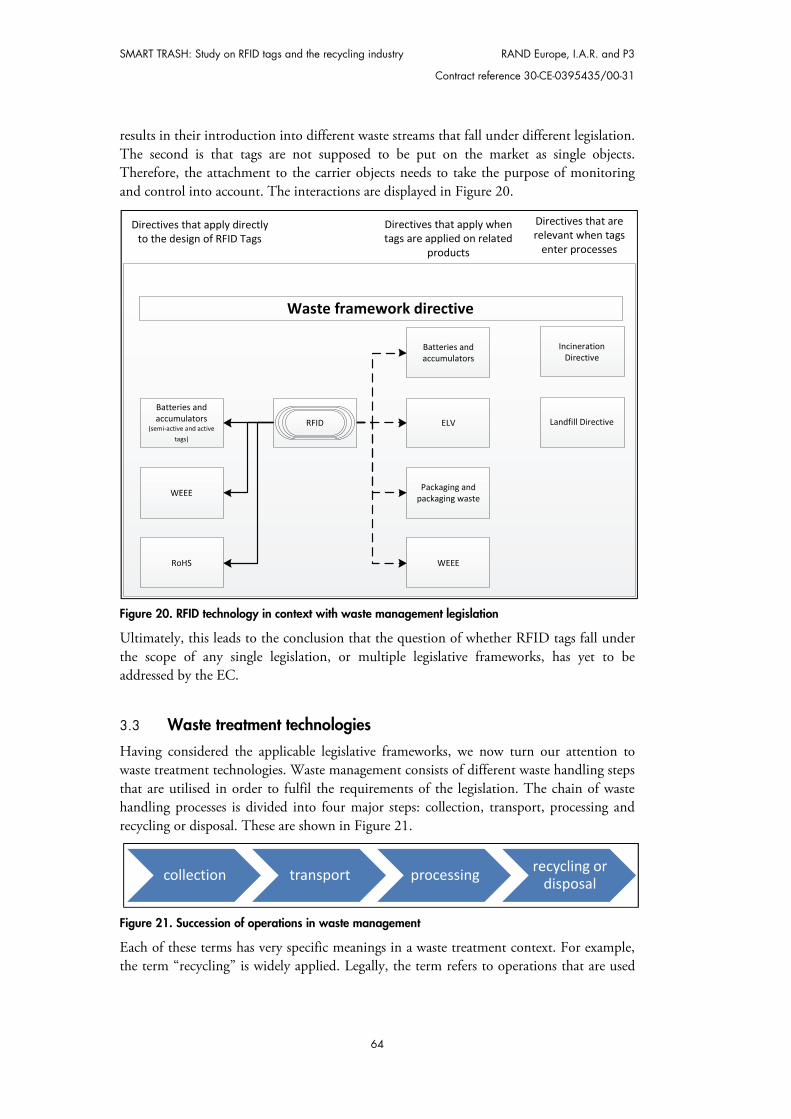
SMART TRASH: Study on RFID tags and the recycling industry RAND Europe, I.A.R. and P3
Contract reference 30-CE-0395435/00-31
64
results in their introduction into different waste streams that fall under different legislation. The second is that tags are not supposed to be put on the market as single objects. Therefore, the attachment to the carrier objects needs to take the purpose of monitoring and control into account. The interactions are displayed in Figure 20.
Figure 20. RFID technology in context with waste management legislation
Ultimately, this leads to the conclusion that the question of whether RFID tags fall under the scope of any single legislation, or multiple legislative frameworks, has yet to be addressed by the EC.
3.3 Waste treatment technologies
Having considered the applicable legislative frameworks, we now turn our attention to waste treatment technologies. Waste management consists of different waste handling steps that are utilised in order to fulfil the requirements of the legislation. The chain of waste handling processes is divided into four major steps: collection, transport, processing and recycling or disposal. These are shown in Figure 21.
Figure 21. Succession of operations in waste management
Each of these terms has very specific meanings in a waste treatment context. For example, the term “recycling” is widely applied. Legally, the term refers to operations that are used
Directives that apply directly to the design of RFID Tags
WEEE
ELV
Packaging and packaging waste
RoHS
Batteries and accumulators
WEEE
RFID
Batteries and accumulators
(semi-active and active tags)
Directives that apply when tags are applied on related
products
Waste framework directive
Directives that are relevant when tags
enter processes
Incineration Directive
Landfill Directive
collection transport processing recycling or disposal
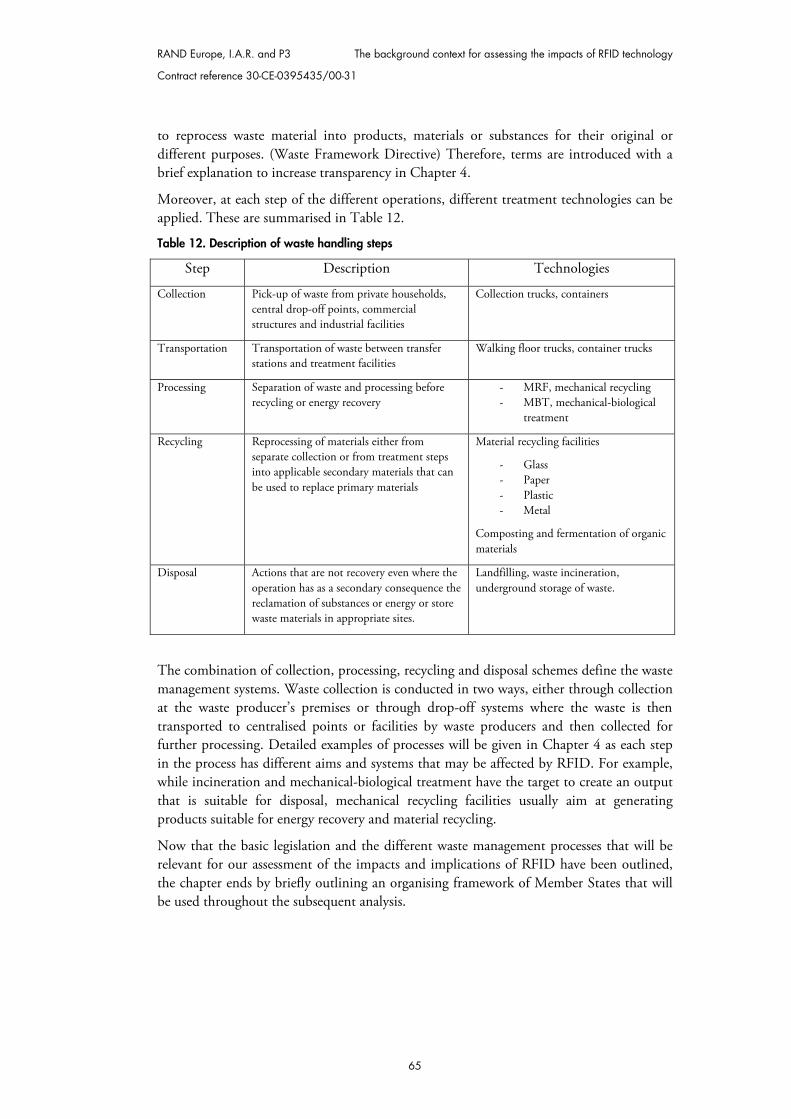
RAND Europe, I.A.R. and P3 The background context for assessing the impacts of RFID technology
Contract reference 30-CE-0395435/00-31
65
to reprocess waste material into products, materials or substances for their original or different purposes. (Waste Framework Directive) Therefore, terms are introduced with a brief explanation to increase transparency in Chapter 4.
Moreover, at each step of the different operations, different treatment technologies can be applied. These are summarised in Table 12.
Table 12. Description of waste handling steps
Step Description Technologies
Collection Pick-up of waste from private households, central drop-off points, commercial structures and industrial facilities
Collection trucks, containers
Transportation Transportation of waste between transfer stations and treatment facilities
Walking floor trucks, container trucks
Processing Separation of waste and processing before recycling or energy recovery
- MRF, mechanical recycling - MBT, mechanical-biological
treatment
Recycling Reprocessing of materials either from separate collection or from treatment steps into applicable secondary materials that can be used to replace primary materials
Material recycling facilities
- Glass - Paper - Plastic - Metal
Composting and fermentation of organic materials
Disposal Actions that are not recovery even where the operation has as a secondary consequence the reclamation of substances or energy or store waste materials in appropriate sites.
Landfilling, waste incineration, underground storage of waste.
The combination of collection, processing, recycling and disposal schemes define the waste management systems. Waste collection is conducted in two ways, either through collection at the waste producer’s premises or through drop-off systems where the waste is then transported to centralised points or facilities by waste producers and then collected for further processing. Detailed examples of processes will be given in Chapter 4 as each step in the process has different aims and systems that may be affected by RFID. For example, while incineration and mechanical-biological treatment have the target to create an output that is suitable for disposal, mechanical recycling facilities usually aim at generating products suitable for energy recovery and material recycling.
Now that the basic legislation and the different waste management processes that will be relevant for our assessment of the impacts and implications of RFID have been outlined, the chapter ends by briefly outlining an organising framework of Member States that will be used throughout the subsequent analysis.
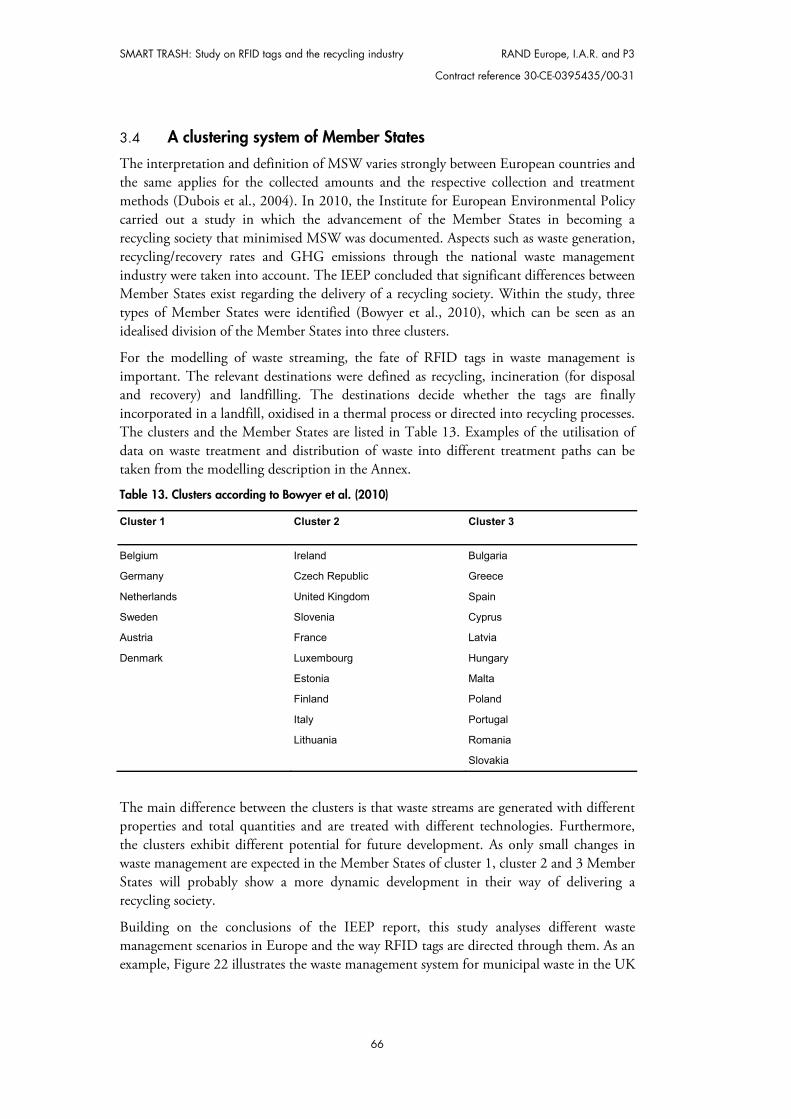
SMART TRASH: Study on RFID tags and the recycling industry RAND Europe, I.A.R. and P3
Contract reference 30-CE-0395435/00-31
66
3.4 A clustering system of Member States
The interpretation and definition of MSW varies strongly between European countries and the same applies for the collected amounts and the respective collection and treatment methods (Dubois et al., 2004). In 2010, the Institute for European Environmental Policy carried out a study in which the advancement of the Member States in becoming a recycling society that minimised MSW was documented. Aspects such as waste generation, recycling/recovery rates and GHG emissions through the national waste management industry were taken into account. The IEEP concluded that significant differences between Member States exist regarding the delivery of a recycling society. Within the study, three types of Member States were identified (Bowyer et al., 2010), which can be seen as an idealised division of the Member States into three clusters.
For the modelling of waste streaming, the fate of RFID tags in waste management is important. The relevant destinations were defined as recycling, incineration (for disposal and recovery) and landfilling. The destinations decide whether the tags are finally incorporated in a landfill, oxidised in a thermal process or directed into recycling processes. The clusters and the Member States are listed in Table 13. Examples of the utilisation of data on waste treatment and distribution of waste into different treatment paths can be taken from the modelling description in the Annex.
Table 13. Clusters according to Bowyer et al. (2010)
Cluster 1
Cluster 2
Cluster 3
Belgium Ireland Bulgaria
Germany Czech Republic Greece
Netherlands United Kingdom Spain
Sweden Slovenia Cyprus
Austria France Latvia
Denmark Luxembourg Hungary
Estonia Malta
Finland Poland
Italy Portugal
Lithuania Romania
Slovakia
The main difference between the clusters is that waste streams are generated with different properties and total quantities and are treated with different technologies. Furthermore, the clusters exhibit different potential for future development. As only small changes in waste management are expected in the Member States of cluster 1, cluster 2 and 3 Member States will probably show a more dynamic development in their way of delivering a recycling society.
Building on the conclusions of the IEEP report, this study analyses different waste management scenarios in Europe and the way RFID tags are directed through them. As an example, Figure 22 illustrates the waste management system for municipal waste in the UK
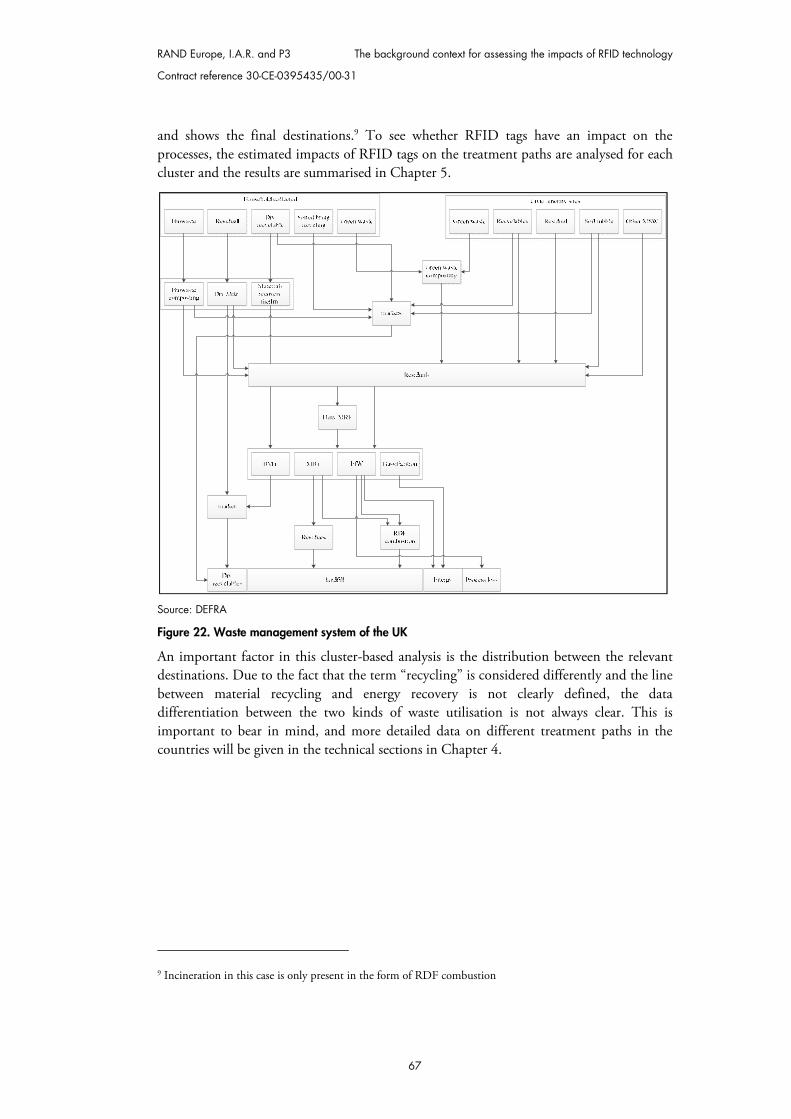
RAND Europe, I.A.R. and P3 The background context for assessing the impacts of RFID technology
Contract reference 30-CE-0395435/00-31
67
and shows the final destinations.9 To see whether RFID tags have an impact on the processes, the estimated impacts of RFID tags on the treatment paths are analysed for each cluster and the results are summarised in Chapter 5.
Source: DEFRA
Figure 22. Waste management system of the UK
An important factor in this cluster-based analysis is the distribution between the relevant destinations. Due to the fact that the term “recycling” is considered differently and the line between material recycling and energy recovery is not clearly defined, the data differentiation between the two kinds of waste utilisation is not always clear. This is important to bear in mind, and more detailed data on different treatment paths in the countries will be given in the technical sections in Chapter 4.
9 Incineration in this case is only present in the form of RDF combustion

RAND Europe, I.A.R. and P3 Contract reference 30-CE-0395435/00-31
69
CHAPTER 4 RFID tags in the waste processing industry
4.1 Interaction between RFID tags and waste treatment processes
It is important to state that the implications of RFID tags on waste streams cannot be generalised. This is because we have to distinguish whether RFID tags contribute to an existing range of materials in a waste stream (which is true for mixed waste streams) or whether they contribute to a specific increase of special/unwanted components (which may be the case for most single material streams). Untangling this requires a distinction between the different waste streams themselves, as well as their ultimate purpose. One way of making this distinction between waste streams is the utilisation of the EU waste codes. Another way is to ask whether a waste stream is providing single material for material recycling or not.
Separately collected waste streams can either be developed to isolate specific materials or to concentrate specific properties. Table 14 gives an overview of what the waste streams from private households and commercial areas are, why the waste stream exists and what its properties are.
This Chapter shows that the type of impact created through the introduction of RFID tags in waste treatment operations depends on the interaction between tag and object.
End-of-life phases are introduced to understand which treatment paths RFID tags can take after their disposal.
The technologies applied in the different end-of-life phases are analysed. The behaviour and impacts of RFID tags in the different processes are
summarised and the call for further research is elaborated.
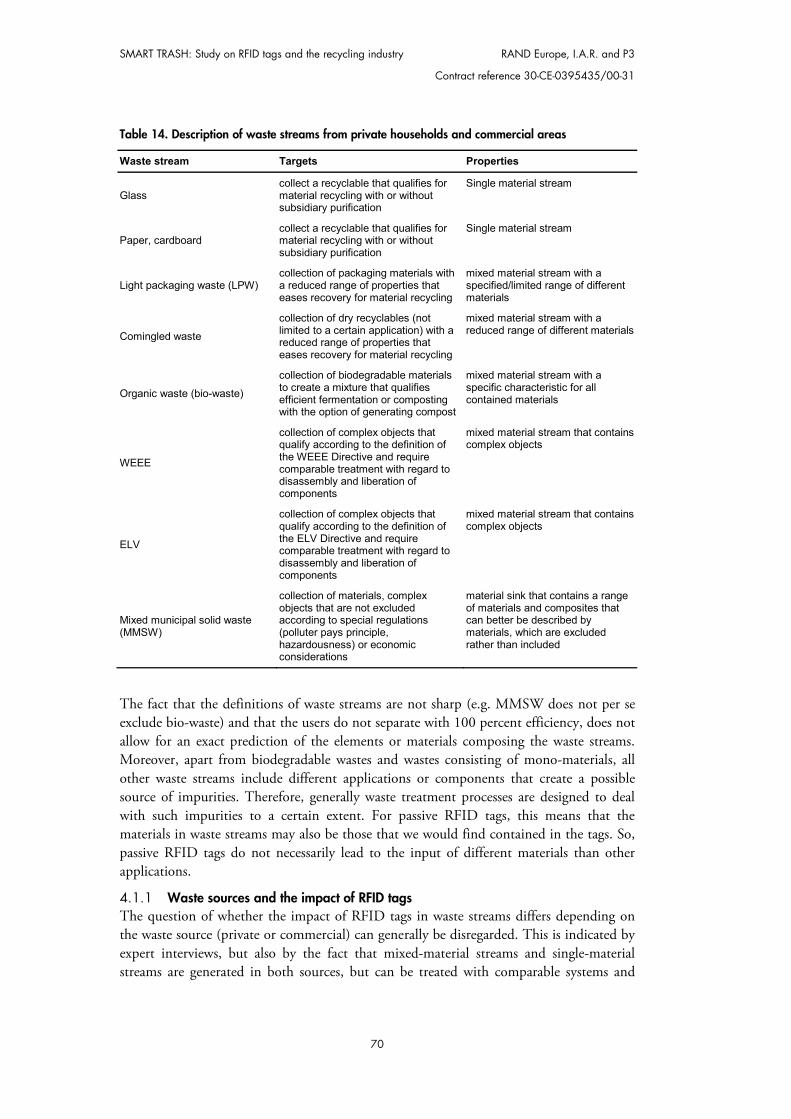
SMART TRASH: Study on RFID tags and the recycling industry RAND Europe, I.A.R. and P3
Contract reference 30-CE-0395435/00-31
70
Table 14. Description of waste streams from private households and commercial areas
Waste stream Targets Properties
Glass collect a recyclable that qualifies for material recycling with or without subsidiary purification
Single material stream
Paper, cardboard collect a recyclable that qualifies for material recycling with or without subsidiary purification
Single material stream
Light packaging waste (LPW) collection of packaging materials with a reduced range of properties that eases recovery for material recycling
mixed material stream with a specified/limited range of different materials
Comingled waste
collection of dry recyclables (not limited to a certain application) with a reduced range of properties that eases recovery for material recycling
mixed material stream with a reduced range of different materials
Organic waste (bio-waste)
collection of biodegradable materials to create a mixture that qualifies efficient fermentation or composting with the option of generating compost
mixed material stream with a specific characteristic for all contained materials
WEEE
collection of complex objects that qualify according to the definition of the WEEE Directive and require comparable treatment with regard to disassembly and liberation of components
mixed material stream that contains complex objects
ELV
collection of complex objects that qualify according to the definition of the ELV Directive and require comparable treatment with regard to disassembly and liberation of components
mixed material stream that contains complex objects
Mixed municipal solid waste (MMSW)
collection of materials, complex objects that are not excluded according to special regulations (polluter pays principle, hazardousness) or economic considerations
material sink that contains a range of materials and composites that can better be described by materials, which are excluded rather than included
The fact that the definitions of waste streams are not sharp (e.g. MMSW does not per se exclude bio-waste) and that the users do not separate with 100 percent efficiency, does not allow for an exact prediction of the elements or materials composing the waste streams. Moreover, apart from biodegradable wastes and wastes consisting of mono-materials, all other waste streams include different applications or components that create a possible source of impurities. Therefore, generally waste treatment processes are designed to deal with such impurities to a certain extent. For passive RFID tags, this means that the materials in waste streams may also be those that we would find contained in the tags. So, passive RFID tags do not necessarily lead to the input of different materials than other applications.
4.1.1 Waste sources and the impact of RFID tags The question of whether the impact of RFID tags in waste streams differs depending on the waste source (private or commercial) can generally be disregarded. This is indicated by expert interviews, but also by the fact that mixed-material streams and single-material streams are generated in both sources, but can be treated with comparable systems and
RAND Europe, I.A.R. and P3 RFID tags in the waste processing industry
Contract reference 30-CE-0395435/00-31
71
technologies.10 In other words, waste treatment practices depend on the composition of waste streams rather than the waste’s origin.
Nevertheless, data have been collected on the basis of waste sources and our analysis will refer to these data. However, it is important to note that in contrast to municipal waste and similar commercial and industrial waste, no specific reporting targets exist for commercial and industrial waste (Eurostat, 2011a). Moreover, Eurostat does not provide the relevant statistical information. While commercial waste, similar to municipal solid waste, is usually collected and treated together, the impacts estimated for these facilities apply to the waste from both sources, not each individual source. Industrial and special commercial waste that is not similar to municipal solid waste is processed differently depending on aspects and properties such as:
Responsibility Composition Hazardousness Recyclability.
Member States are required to use the European List of Wastes given in Table 15 below as a means of classifying their wastes. The sources for waste that are significant with regard to the presence of RFID tags are wastes that fall under Chapters 15 and 20. The other waste codes are generally connected with specific industrial processes, which is why the availability of data is limited according to public reporting and monitoring. Eurostat has commented that:
The reporting of waste from both the commercial and industrial sectors is varied in its implementation across Member States. This is, in part, due to the overlap in classification of commercial and municipal wastes. Reporting of industrial wastes is covered under the Waste Statistics Regulation, however, good quality time series data is still lacking. (Eurostat, 2011a)
The data on waste streams in Europe used within this study to estimate mass relations between tags and waste materials in selected streams or scenarios, have been primarily taken from Eurostat and are therefore based on the NACE classification system (Eurostat, 2011a).
10 The same infrastructure can be used for different waste streams, e.g., waste incinerators accept MMSW but may also accept SRF or sludge from waste-water cleaning or separately collected bulky waste
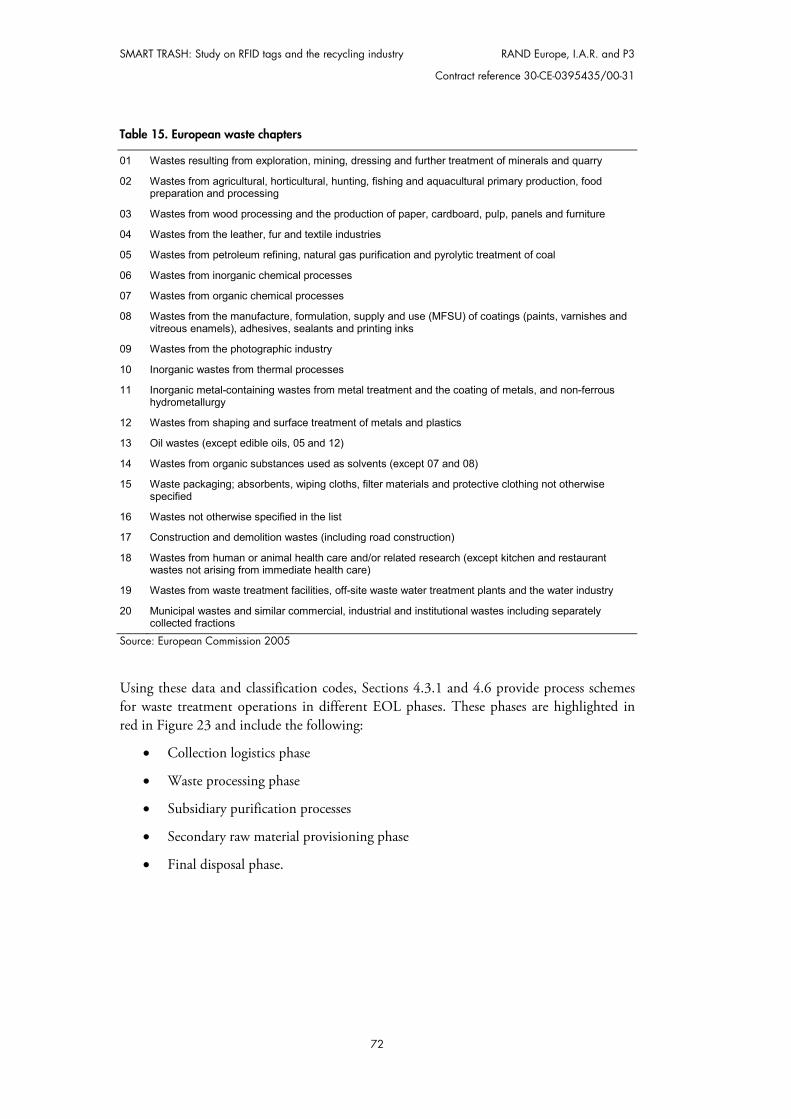
SMART TRASH: Study on RFID tags and the recycling industry RAND Europe, I.A.R. and P3
Contract reference 30-CE-0395435/00-31
72
Table 15. European waste chapters
01 Wastes resulting from exploration, mining, dressing and further treatment of minerals and quarry
02 Wastes from agricultural, horticultural, hunting, fishing and aquacultural primary production, food preparation and processing
03 Wastes from wood processing and the production of paper, cardboard, pulp, panels and furniture
04 Wastes from the leather, fur and textile industries
05 Wastes from petroleum refining, natural gas purification and pyrolytic treatment of coal
06 Wastes from inorganic chemical processes
07 Wastes from organic chemical processes
08 Wastes from the manufacture, formulation, supply and use (MFSU) of coatings (paints, varnishes and vitreous enamels), adhesives, sealants and printing inks
09 Wastes from the photographic industry
10 Inorganic wastes from thermal processes
11 Inorganic metal-containing wastes from metal treatment and the coating of metals, and non-ferrous hydrometallurgy
12 Wastes from shaping and surface treatment of metals and plastics
13 Oil wastes (except edible oils, 05 and 12)
14 Wastes from organic substances used as solvents (except 07 and 08)
15 Waste packaging; absorbents, wiping cloths, filter materials and protective clothing not otherwise specified
16 Wastes not otherwise specified in the list
17 Construction and demolition wastes (including road construction)
18 Wastes from human or animal health care and/or related research (except kitchen and restaurant wastes not arising from immediate health care)
19 Wastes from waste treatment facilities, off-site waste water treatment plants and the water industry
20 Municipal wastes and similar commercial, industrial and institutional wastes including separately collected fractions
Source: European Commission 2005
Using these data and classification codes, Sections 4.3.1 and 4.6 provide process schemes for waste treatment operations in different EOL phases. These phases are highlighted in red in Figure 23 and include the following:
Collection logistics phase
Waste processing phase
Subsidiary purification processes
Secondary raw material provisioning phase
Final disposal phase.
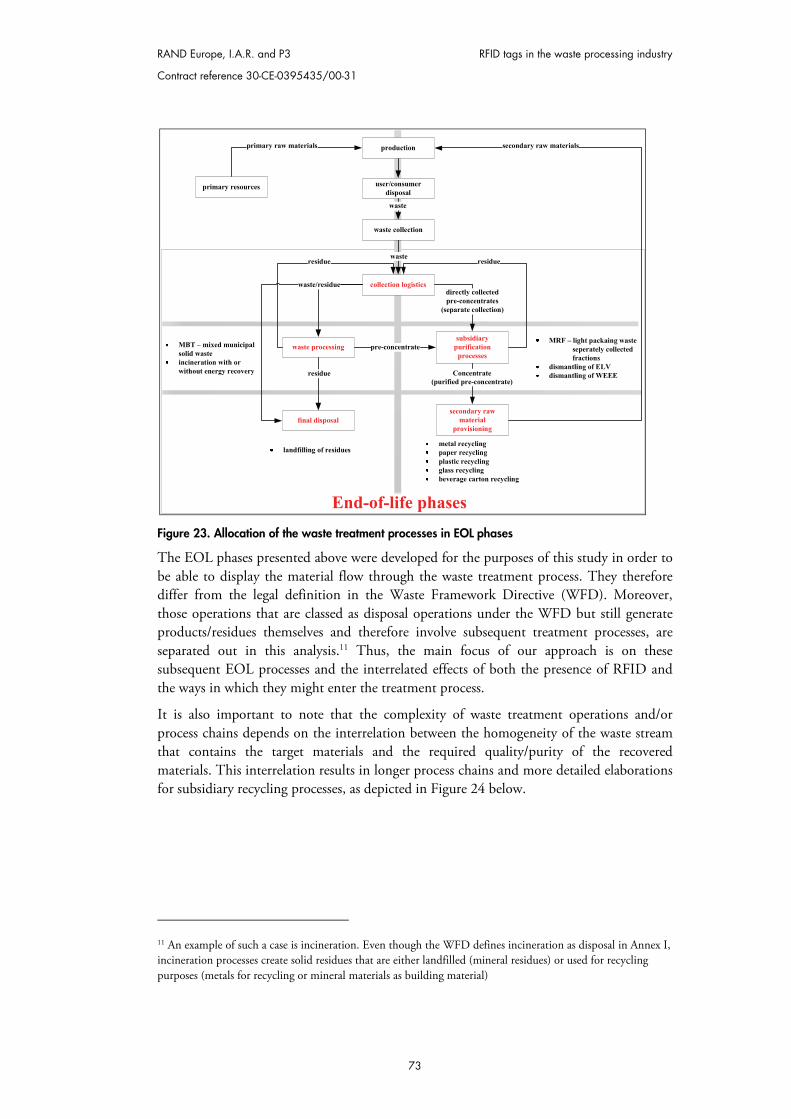
RAND Europe, I.A.R. and P3 RFID tags in the waste processing industry
Contract reference 30-CE-0395435/00-31
73
Figure 23. Allocation of the waste treatment processes in EOL phases
The EOL phases presented above were developed for the purposes of this study in order to be able to display the material flow through the waste treatment process. They therefore differ from the legal definition in the Waste Framework Directive (WFD). Moreover, those operations that are classed as disposal operations under the WFD but still generate products/residues themselves and therefore involve subsequent treatment processes, are separated out in this analysis.11 Thus, the main focus of our approach is on these subsequent EOL processes and the interrelated effects of both the presence of RFID and the ways in which they might enter the treatment process.
It is also important to note that the complexity of waste treatment operations and/or process chains depends on the interrelation between the homogeneity of the waste stream that contains the target materials and the required quality/purity of the recovered materials. This interrelation results in longer process chains and more detailed elaborations for subsidiary recycling processes, as depicted in Figure 24 below.
11 An example of such a case is incineration. Even though the WFD defines incineration as disposal in Annex I, incineration processes create solid residues that are either landfilled (mineral residues) or used for recycling purposes (metals for recycling or mineral materials as building material)
waste collection
waste processingsubsidiary
purification processes
user/consumer disposal
collection logistics
final disposal
waste
waste
directly collectedpre-concentrates
(separate collection)
pre-concentrate
residue
secondary raw material
provisioning
Concentrate(purified pre-concentrate)
residueresidue
waste/residue
secondary raw materials
MBT – mixed municipal solid wasteincineration with or without energy recovery
metal recyclingpaper recyclingplastic recyclingglass recyclingbeverage carton recycling
landfilling of residues
MRF – light packaing wasteseperately collected fractions
dismantling of ELVdismantling of WEEE
production
primary resources
primary raw materials
End-of-life phases
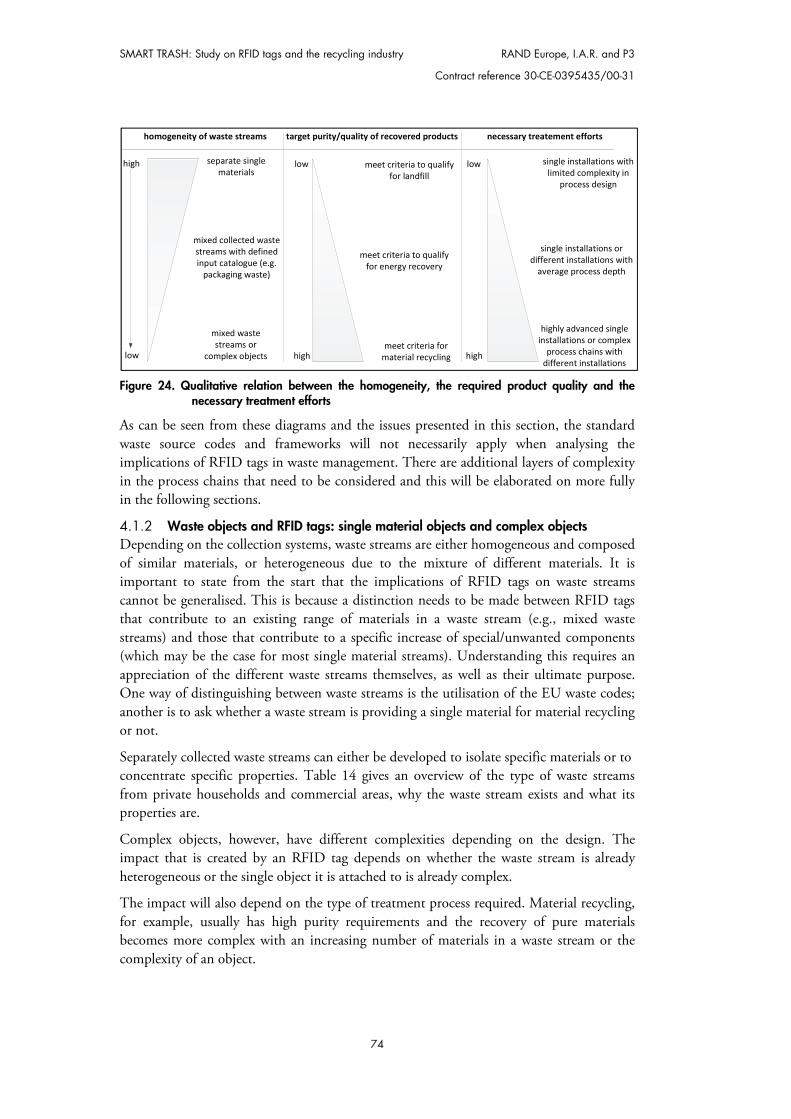
SMART TRASH: Study on RFID tags and the recycling industry RAND Europe, I.A.R. and P3
Contract reference 30-CE-0395435/00-31
74
Figure 24. Qualitative relation between the homogeneity, the required product quality and the
necessary treatment efforts
As can be seen from these diagrams and the issues presented in this section, the standard waste source codes and frameworks will not necessarily apply when analysing the implications of RFID tags in waste management. There are additional layers of complexity in the process chains that need to be considered and this will be elaborated on more fully in the following sections.
4.1.2 Waste objects and RFID tags: single material objects and complex objects Depending on the collection systems, waste streams are either homogeneous and composed of similar materials, or heterogeneous due to the mixture of different materials. It is important to state from the start that the implications of RFID tags on waste streams cannot be generalised. This is because a distinction needs to be made between RFID tags that contribute to an existing range of materials in a waste stream (e.g., mixed waste streams) and those that contribute to a specific increase of special/unwanted components (which may be the case for most single material streams). Understanding this requires an appreciation of the different waste streams themselves, as well as their ultimate purpose. One way of distinguishing between waste streams is the utilisation of the EU waste codes; another is to ask whether a waste stream is providing a single material for material recycling or not.
Separately collected waste streams can either be developed to isolate specific materials or to concentrate specific properties. Table 14 gives an overview of the type of waste streams from private households and commercial areas, why the waste stream exists and what its properties are.
Complex objects, however, have different complexities depending on the design. The impact that is created by an RFID tag depends on whether the waste stream is already heterogeneous or the single object it is attached to is already complex.
The impact will also depend on the type of treatment process required. Material recycling, for example, usually has high purity requirements and the recovery of pure materials becomes more complex with an increasing number of materials in a waste stream or the complexity of an object.
homogeneity of waste streams
high
low
mixed waste streams or
complex objects
separate single materials
target purity/quality of recovered products
low
high
mixed collected waste streams with defined input catalogue (e.g.
packaging waste)
meet criteria to qualify for landfill
meet criteria to qualify for energy recovery
meet criteria for material recycling
necessary treatement efforts
low
high
single installations with limited complexity in
process design
highly advanced single installations or complex
process chains with different installations
single installations or different installations with
average process depth
RAND Europe, I.A.R. and P3 RFID tags in the waste processing industry
Contract reference 30-CE-0395435/00-31
75
In fact, even attaching an RFID tag to a single material object means the recycling becomes more complex. It is therefore expected that adding a composite (in this case the RFID tag) to processes designed for the treatment of single material objects will increase treatment costs. Conversely, there is not necessarily an impact for complex objects, because they already consist of a variety of different materials and the processes are already designed to cope with the related technical problems (e.g., the liberation of material compounds such as beverage cartons or electronic equipment such as cell phones or computers).
The level of complexity of materials and objects will determine what technologies can be applied for recycling recovery or disposal. Complex objects usually require dismantling, deconstruction or comminution to liberate the materials contained within them. If possible, these liberated materials are purified to an extent that allows them to be fed into material reuse/recycling processes. Another possibility is that compounds are used in the same process; either according to an overall calorific value that qualifies for energy recovery or, in the case of material recycling, because all unwanted materials except the target material can be removed or destroyed.12 Yet another option is that RFID tags can be removed manually or remain applied to dismantled parts from complex objects and go into the subsequent recycling or energy recovery steps. An example of this option is an RFID tag applied to a plastic part of a laptop: if the tag is not removed, it will be fed into the plastic recycling process and possible impacts could take place there. Conversely, the primary dismantling process would not be influenced by the presence of the tag.
With the basic considerations that underpin this analysis in place, the impact of RFID tags on each of the EOL phases identified and summarised above will now be considered.
4.2 The impact of RFID tags on waste collection processes
In Figure 23, which summarises the EOL phases, collection takes place in the “collection logistics phase”. Collection includes municipal solid waste (MSW) and commercial and industrial waste. MSW comprises a wide range of materials. Many different types of collection schemes are established, with wide variations in the types of recyclable materials targeted by individual authorities. This emanates from the different characteristics of the households and commercial structures within an area and the interrelationships between the various collection systems, sorting methods and frequency of collection, and also from the requirements of those processing and utilising the collected material. In addition, residual waste and different recyclable materials can be collected separately with different collection frequencies or separate collecting equipment. In the UK, for example, recyclables can be collected with the residual waste and picked up by the same vehicle using different-coloured sacks to differentiate the materials (Letcher & Vallero 2011).
12 For example, the utilisation of printed circuit board assemblies (PCBAs) in smelting processes, where the plastics applied are oxidised in the smelting process while metals are obtained as secondary raw materials
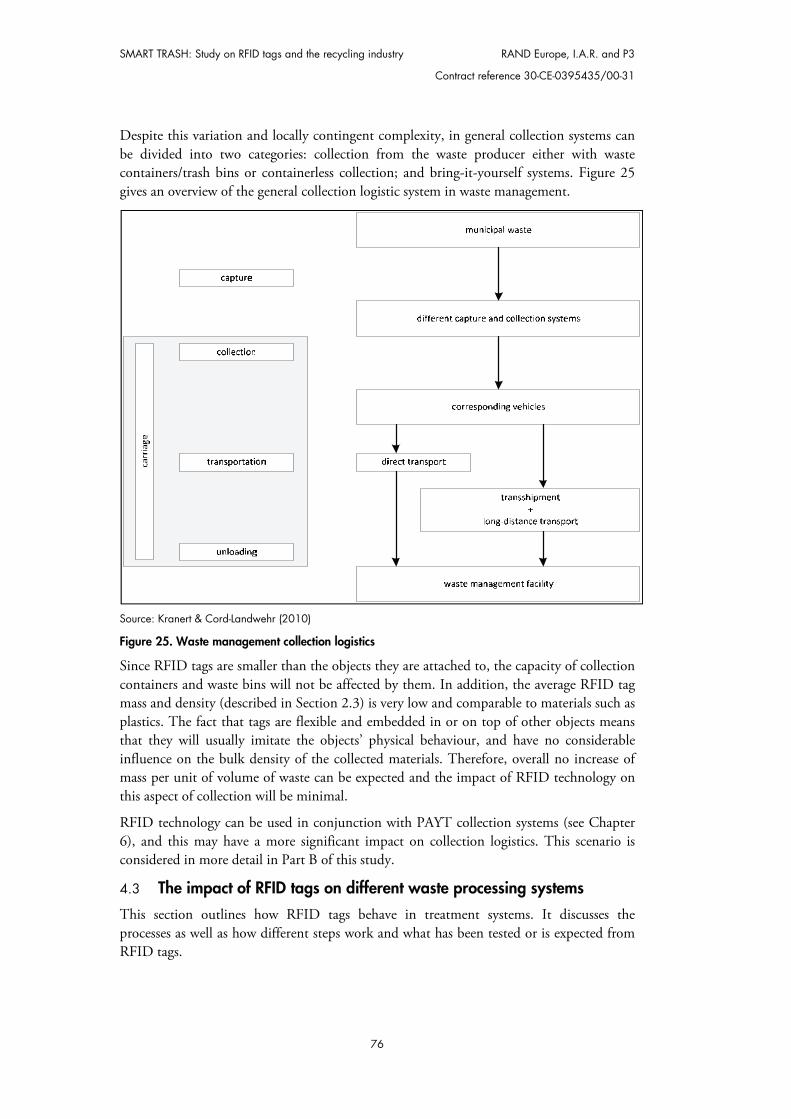
SMART TRASH: Study on RFID tags and the recycling industry RAND Europe, I.A.R. and P3
Contract reference 30-CE-0395435/00-31
76
Despite this variation and locally contingent complexity, in general collection systems can be divided into two categories: collection from the waste producer either with waste containers/trash bins or containerless collection; and bring-it-yourself systems. Figure 25 gives an overview of the general collection logistic system in waste management.
Source: Kranert & Cord-Landwehr (2010)
Figure 25. Waste management collection logistics
Since RFID tags are smaller than the objects they are attached to, the capacity of collection containers and waste bins will not be affected by them. In addition, the average RFID tag mass and density (described in Section 2.3) is very low and comparable to materials such as plastics. The fact that tags are flexible and embedded in or on top of other objects means that they will usually imitate the objects’ physical behaviour, and have no considerable influence on the bulk density of the collected materials. Therefore, overall no increase of mass per unit of volume of waste can be expected and the impact of RFID technology on this aspect of collection will be minimal.
RFID technology can be used in conjunction with PAYT collection systems (see Chapter 6), and this may have a more significant impact on collection logistics. This scenario is considered in more detail in Part B of this study.
4.3 The impact of RFID tags on different waste processing systems
This section outlines how RFID tags behave in treatment systems. It discusses the processes as well as how different steps work and what has been tested or is expected from RFID tags.
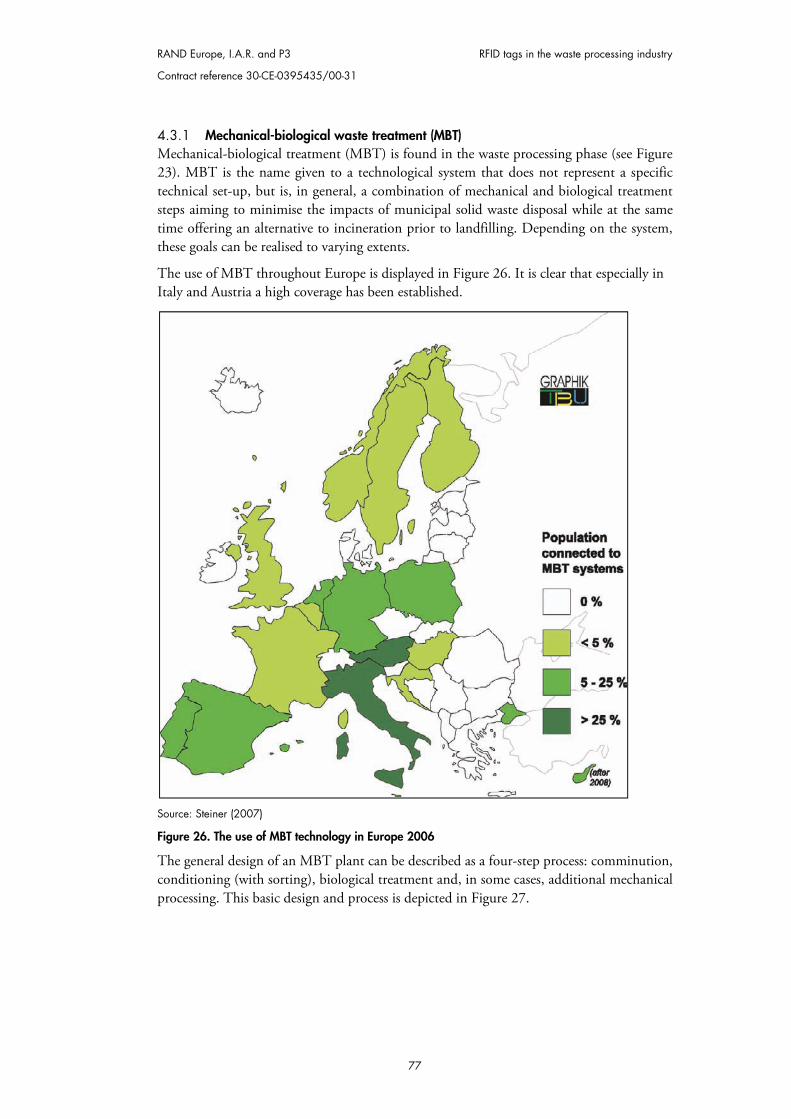
RAND Europe, I.A.R. and P3 RFID tags in the waste processing industry
Contract reference 30-CE-0395435/00-31
77
4.3.1 Mechanical-biological waste treatment (MBT) Mechanical-biological treatment (MBT) is found in the waste processing phase (see Figure 23). MBT is the name given to a technological system that does not represent a specific technical set-up, but is, in general, a combination of mechanical and biological treatment steps aiming to minimise the impacts of municipal solid waste disposal while at the same time offering an alternative to incineration prior to landfilling. Depending on the system, these goals can be realised to varying extents.
The use of MBT throughout Europe is displayed in Figure 26. It is clear that especially in Italy and Austria a high coverage has been established.
Source: Steiner (2007)
Figure 26. The use of MBT technology in Europe 2006
The general design of an MBT plant can be described as a four-step process: comminution, conditioning (with sorting), biological treatment and, in some cases, additional mechanical processing. This basic design and process is depicted in Figure 27.

SMART TRASH: Study on RFID tags and the recycling industry RAND Europe, I.A.R. and P3
Contract reference 30-CE-0395435/00-31
78
Figure 27. Basic scheme of an MBT plant
The purpose of the comminution and the mechanical processing technologies in the conditioning phase is usually the generation of material streams with a reduced organic content and a stream in which the organic matter is concentrated. The material streams extracted before the biological treatment generally go for energy recovery or material recycling in the case of the metals. The biological process is usually composting (in some cases a part of the material is anaerobically digested). The target of the biological treatment is to reduce the GHG emission potential that would be unlocked through anaerobic digestion of the readily degradable carbon inside the landfill body. If the contained organic matter is reduced in content, the generation of landfill gas through fermentation of organics in landfills is reduced.
In the following paragraphs the different steps are described in further detail and consideration is given to their target, functional concept and the effect of RFID tags.
Comminution This first step and its processes are designed to liberate compounds and create a steady material flow for the subsequent process steps. To some extent the plant is designed to withstand mechanical stress and so none of the components in RFID tags would be large enough to create any problems. Even though metals and silica are part of the tags, they will be present in comparably low quantities and will therefore not create a problem.
Conditioning phase The conditioning phase is usually comprised of screening processes that separate the material stream according to particle size. This phase also includes processes that sort materials by density or object geometry. The separation of metals happens via magnetic separation or eddy current separators. None of these processes are likely to suffer from the presence of RFID tags.
Biological treatment Biological treatment is either aerobic or anaerobic. Both procedures depend on process parameters, such as the proportion of biodegradable material. RFID tags will not contribute to this, even if bio-polymers or biodegradable plastics are used, as the duration of the biological process is usually not sufficient for bio-polymers to be fermented/composted. However, the biological processes could suffer from materials or substances that are either bio-toxic or antiseptic. If active or semi-active tags contain a battery, they should be prevented from reaching wastes going into biological processes. This could happen either through legislation that precludes batteries from waste designated for biological treatment, or through technical installations that could be used to separate
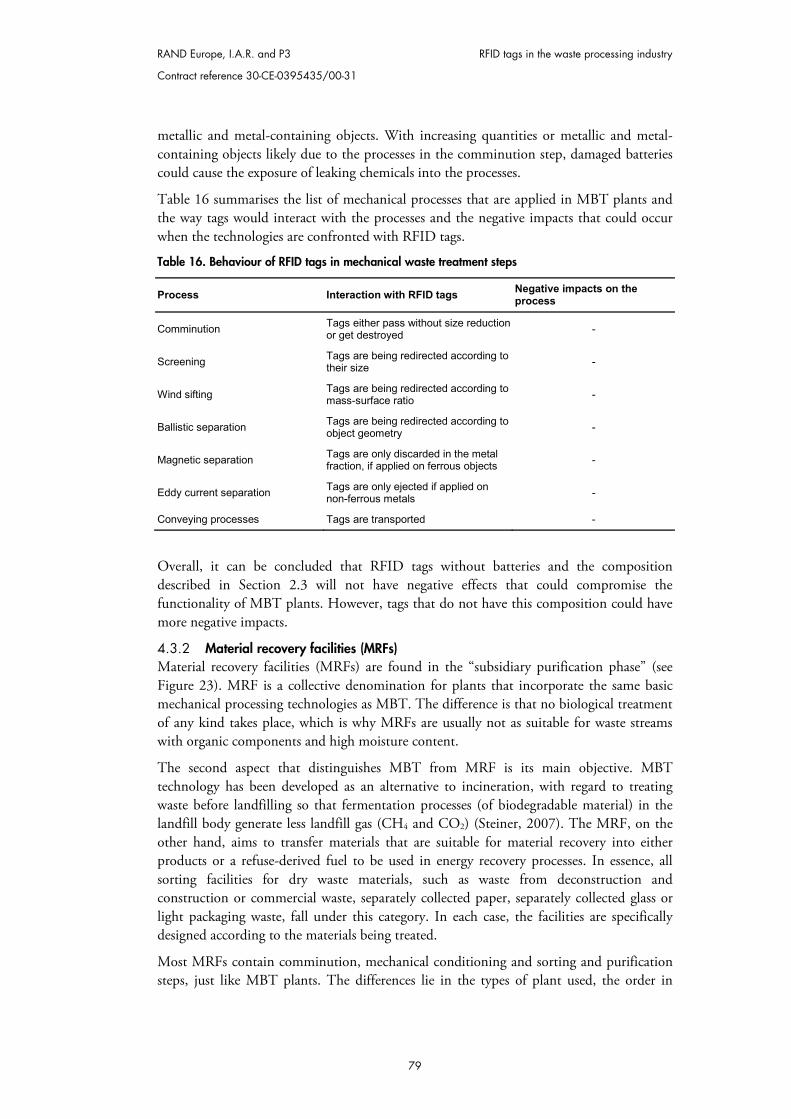
RAND Europe, I.A.R. and P3 RFID tags in the waste processing industry
Contract reference 30-CE-0395435/00-31
79
metallic and metal-containing objects. With increasing quantities or metallic and metal-containing objects likely due to the processes in the comminution step, damaged batteries could cause the exposure of leaking chemicals into the processes.
Table 16 summarises the list of mechanical processes that are applied in MBT plants and the way tags would interact with the processes and the negative impacts that could occur when the technologies are confronted with RFID tags.
Table 16. Behaviour of RFID tags in mechanical waste treatment steps
Process Interaction with RFID tags Negative impacts on the process
Comminution Tags either pass without size reduction or get destroyed -
Screening Tags are being redirected according to their size -
Wind sifting Tags are being redirected according to mass-surface ratio -
Ballistic separation Tags are being redirected according to object geometry -
Magnetic separation Tags are only discarded in the metal fraction, if applied on ferrous objects -
Eddy current separation Tags are only ejected if applied on non-ferrous metals -
Conveying processes Tags are transported -
Overall, it can be concluded that RFID tags without batteries and the composition described in Section 2.3 will not have negative effects that could compromise the functionality of MBT plants. However, tags that do not have this composition could have more negative impacts.
4.3.2 Material recovery facilities (MRFs) Material recovery facilities (MRFs) are found in the “subsidiary purification phase” (see Figure 23). MRF is a collective denomination for plants that incorporate the same basic mechanical processing technologies as MBT. The difference is that no biological treatment of any kind takes place, which is why MRFs are usually not as suitable for waste streams with organic components and high moisture content.
The second aspect that distinguishes MBT from MRF is its main objective. MBT technology has been developed as an alternative to incineration, with regard to treating waste before landfilling so that fermentation processes (of biodegradable material) in the landfill body generate less landfill gas (CH4 and CO2) (Steiner, 2007). The MRF, on the other hand, aims to transfer materials that are suitable for material recovery into either products or a refuse-derived fuel to be used in energy recovery processes. In essence, all sorting facilities for dry waste materials, such as waste from deconstruction and construction or commercial waste, separately collected paper, separately collected glass or light packaging waste, fall under this category. In each case, the facilities are specifically designed according to the materials being treated.
Most MRFs contain comminution, mechanical conditioning and sorting and purification steps, just like MBT plants. The differences lie in the types of plant used, the order in
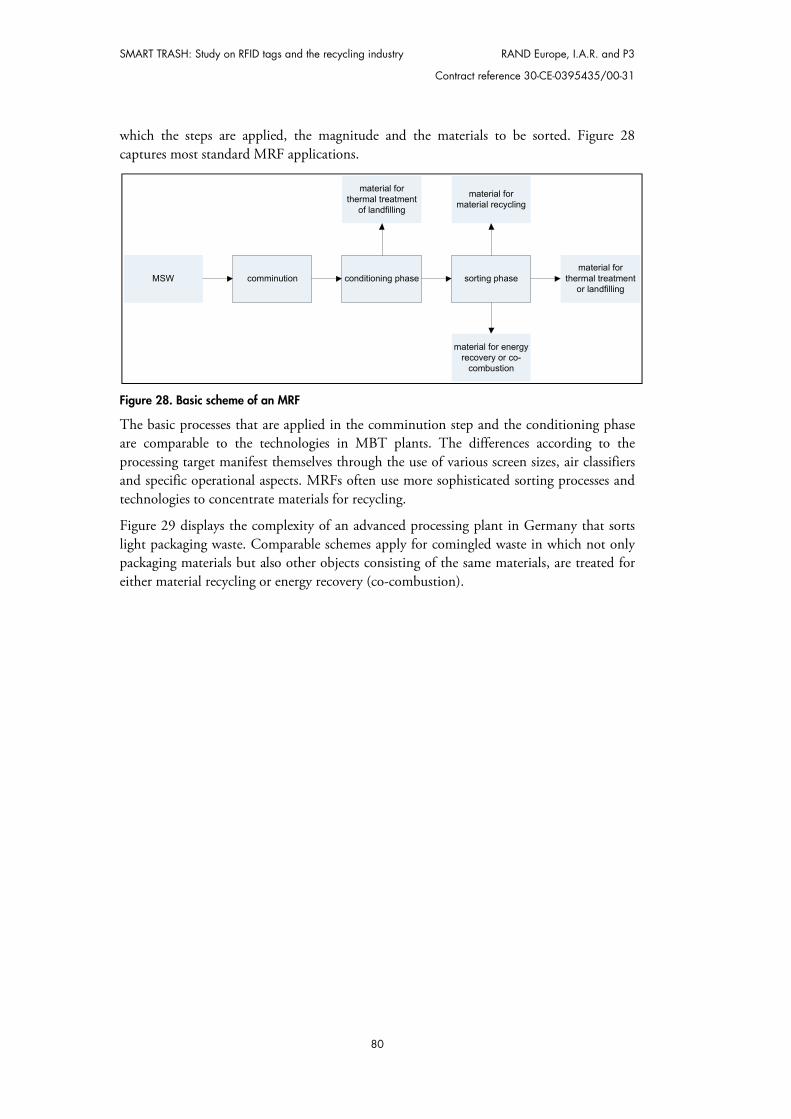
SMART TRASH: Study on RFID tags and the recycling industry RAND Europe, I.A.R. and P3
Contract reference 30-CE-0395435/00-31
80
which the steps are applied, the magnitude and the materials to be sorted. Figure 28 captures most standard MRF applications.
Figure 28. Basic scheme of an MRF
The basic processes that are applied in the comminution step and the conditioning phase are comparable to the technologies in MBT plants. The differences according to the processing target manifest themselves through the use of various screen sizes, air classifiers and specific operational aspects. MRFs often use more sophisticated sorting processes and technologies to concentrate materials for recycling.
Figure 29 displays the complexity of an advanced processing plant in Germany that sorts light packaging waste. Comparable schemes apply for comingled waste in which not only packaging materials but also other objects consisting of the same materials, are treated for either material recycling or energy recovery (co-combustion).
MSW comminution conditioning phase sorting phasematerial for
thermal treatment or landfilling
material for thermal treatment
of landfilling
material for material recycling
material for energy recovery or co-
combustion
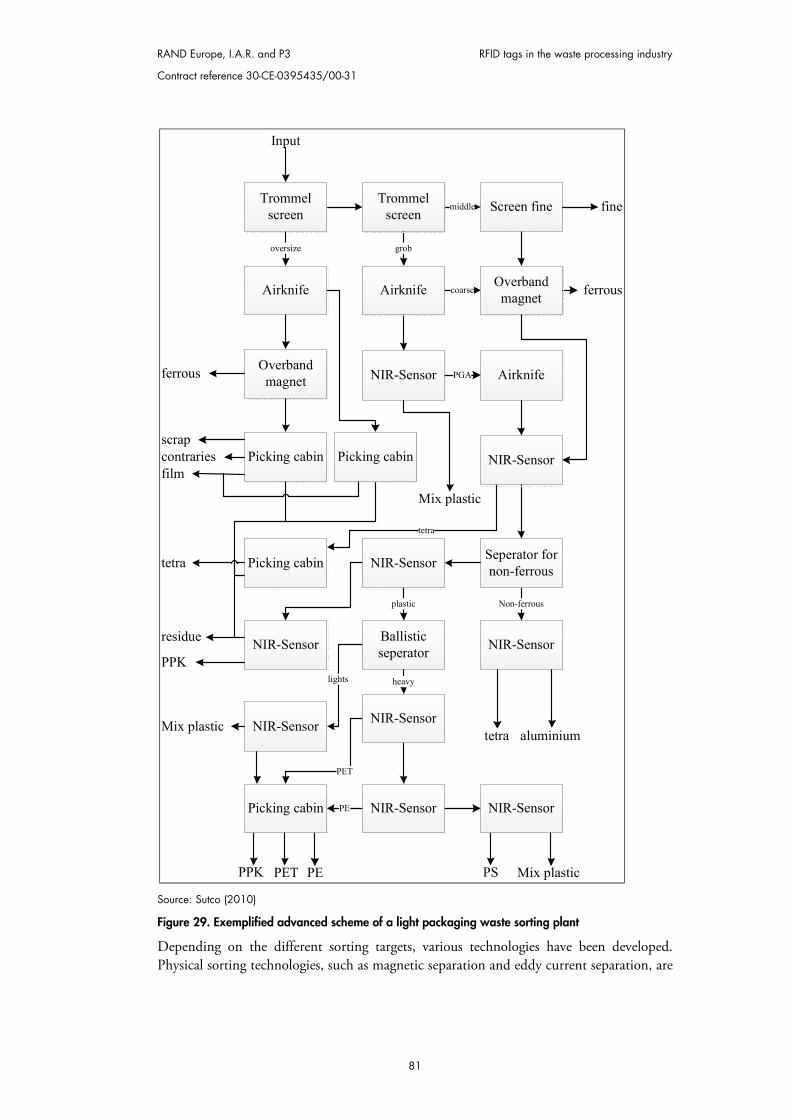
RAND Europe, I.A.R. and P3 RFID tags in the waste processing industry
Contract reference 30-CE-0395435/00-31
81
Source: Sutco (2010)
Figure 29. Exemplified advanced scheme of a light packaging waste sorting plant
Depending on the different sorting targets, various technologies have been developed. Physical sorting technologies, such as magnetic separation and eddy current separation, are
Input
oversize grob
middle fine
ferrous
scrapcontraries
Mix plastic
PGA
coarse
Non-ferrous
residue
PPK
tetra aluminium
plastic
lights heavy
tetra
Mix plastic
tetra
Mix plasticPSPET PEPPK
film
ferrous
PET
PE
Trommel screen
Airknife
Trommel screen
Airknife
Screen fine
Picking cabin
Overband magnet
Overband magnet
Picking cabin
NIR-Sensor Airknife
NIR-Sensor
Seperator for non-ferrous
NIR-Sensor
NIR-Sensor
NIR-Sensor Ballistic seperator
NIR-Sensor
NIR-Sensor NIR-Sensor
NIR-Sensor
Picking cabin
Picking cabin
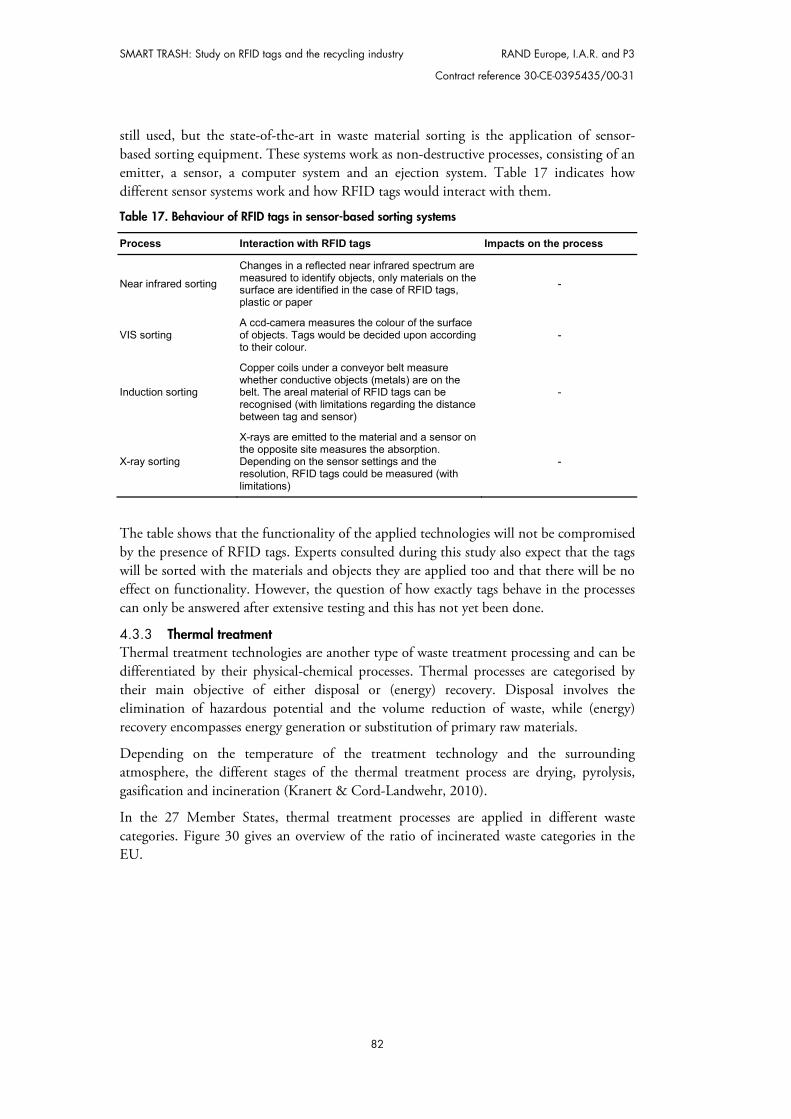
SMART TRASH: Study on RFID tags and the recycling industry RAND Europe, I.A.R. and P3
Contract reference 30-CE-0395435/00-31
82
still used, but the state-of-the-art in waste material sorting is the application of sensor-based sorting equipment. These systems work as non-destructive processes, consisting of an emitter, a sensor, a computer system and an ejection system. Table 17 indicates how different sensor systems work and how RFID tags would interact with them.
Table 17. Behaviour of RFID tags in sensor-based sorting systems
Process Interaction with RFID tags Impacts on the process
Near infrared sorting
Changes in a reflected near infrared spectrum are measured to identify objects, only materials on the surface are identified in the case of RFID tags, plastic or paper
-
VIS sorting A ccd-camera measures the colour of the surface of objects. Tags would be decided upon according to their colour.
-
Induction sorting
Copper coils under a conveyor belt measure whether conductive objects (metals) are on the belt. The areal material of RFID tags can be recognised (with limitations regarding the distance between tag and sensor)
-
X-ray sorting
X-rays are emitted to the material and a sensor on the opposite site measures the absorption. Depending on the sensor settings and the resolution, RFID tags could be measured (with limitations)
-
The table shows that the functionality of the applied technologies will not be compromised by the presence of RFID tags. Experts consulted during this study also expect that the tags will be sorted with the materials and objects they are applied too and that there will be no effect on functionality. However, the question of how exactly tags behave in the processes can only be answered after extensive testing and this has not yet been done.
4.3.3 Thermal treatment Thermal treatment technologies are another type of waste treatment processing and can be differentiated by their physical-chemical processes. Thermal processes are categorised by their main objective of either disposal or (energy) recovery. Disposal involves the elimination of hazardous potential and the volume reduction of waste, while (energy) recovery encompasses energy generation or substitution of primary raw materials.
Depending on the temperature of the treatment technology and the surrounding atmosphere, the different stages of the thermal treatment process are drying, pyrolysis, gasification and incineration (Kranert & Cord-Landwehr, 2010).
In the 27 Member States, thermal treatment processes are applied in different waste categories. Figure 30 gives an overview of the ratio of incinerated waste categories in the EU.
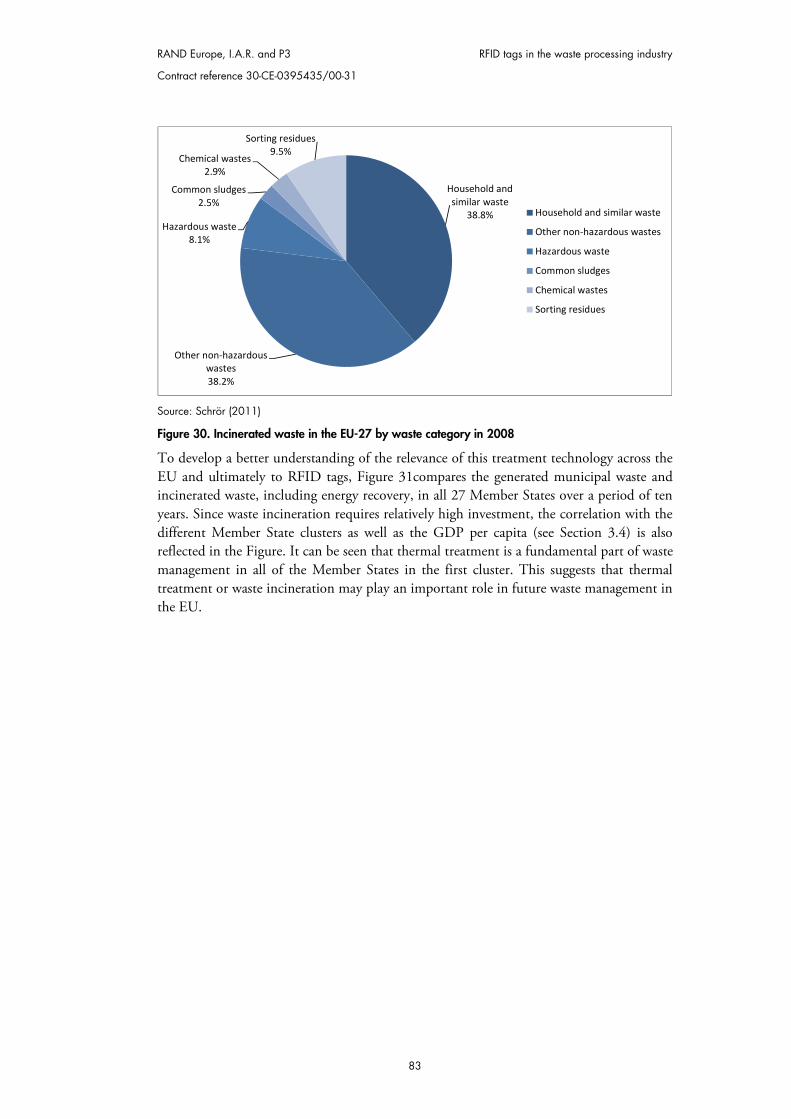
RAND Europe, I.A.R. and P3 RFID tags in the waste processing industry
Contract reference 30-CE-0395435/00-31
83
Source: Schrör (2011)
Figure 30. Incinerated waste in the EU-27 by waste category in 2008
To develop a better understanding of the relevance of this treatment technology across the EU and ultimately to RFID tags, Figure 31compares the generated municipal waste and incinerated waste, including energy recovery, in all 27 Member States over a period of ten years. Since waste incineration requires relatively high investment, the correlation with the different Member State clusters as well as the GDP per capita (see Section 3.4) is also reflected in the Figure. It can be seen that thermal treatment is a fundamental part of waste management in all of the Member States in the first cluster. This suggests that thermal treatment or waste incineration may play an important role in future waste management in the EU.
Household and similar waste
38.8%
Other non-hazardous wastes38.2%
Hazardous waste8.1%
Common sludges2.5%
Chemical wastes2.9%
Sorting residues9.5%
Household and similar waste
Other non-hazardous wastes
Hazardous waste
Common sludges
Chemical wastes
Sorting residues
SMART TRASH: Study on RFID tags and the recycling industry RAND Europe, I.A.R. and P3
Contract reference 30-CE-0395435/00-31
84
Source: Eurostat (2011b)
Figure 31. Amount of generated and incinerated waste in the EU-27 (1999–2009)
Nowadays, almost every thermal waste treatment process is equipped with some kind of energy recovery system (heat, electricity). The most common thermal treatment process for the destruction of organic contaminants in industrial and municipal waste is incineration.
Incineration facilities differ in the design of their combustion chamber. The most commonly used waste incinerators are equipped with grate combustion systems (European Commission, 2006b). Today’s incineration processes are designed for a wide range of chemical compositions already contained in MMSW. Therefore, the presence of RFID tags in the waste streams is not likely to cause any problems (VDI/VDE, 2007). This conclusion is also made on the basis that the materials incorporated in RFID tags are introduced into the process through other objects in the waste streams.
As an alternative to grate combustion systems, fluidised bed incinerators are often used for mechanically pre-treated materials like refuse-derived fuel (RDF) or solid recovered fuel (SRF). Pre-treatment of the material is necessary, because usually there are requirements concerning particle size, energy content and contained substances. This means heterogeneous mixed wastes such as MMSW cannot enter this system. Due to the fact that during the pre-treatment not all unwanted materials are discharged, the techniques used in fluidised bed incinerators are usually able to handle a moderate level of impurities. Therefore, hardly any impacts from RFID tags on this combustion technology are expected.
Other thermal treatment processes for disposal of hazardous waste, sewage sludge or clinical waste must also be evaluated. Widely applied techniques for such wastes are rotary
0
100
200
300
400
500
600
700
800
900
amou
nt [k
g/ca
pita
*a]
1999 2000 2001 2002 2003 2004 2005 2006 2007 2008 2009
0
100
200
300
400
500
600
700
800
900
Was
te q
uant
ities
[kg/
capi
ta*a
]
1999 2000 2001 2002 2003 2004 2005 2006 2007 2008 2009waste generation 1999-2009 incineration incl. energy recovery 1999-2009
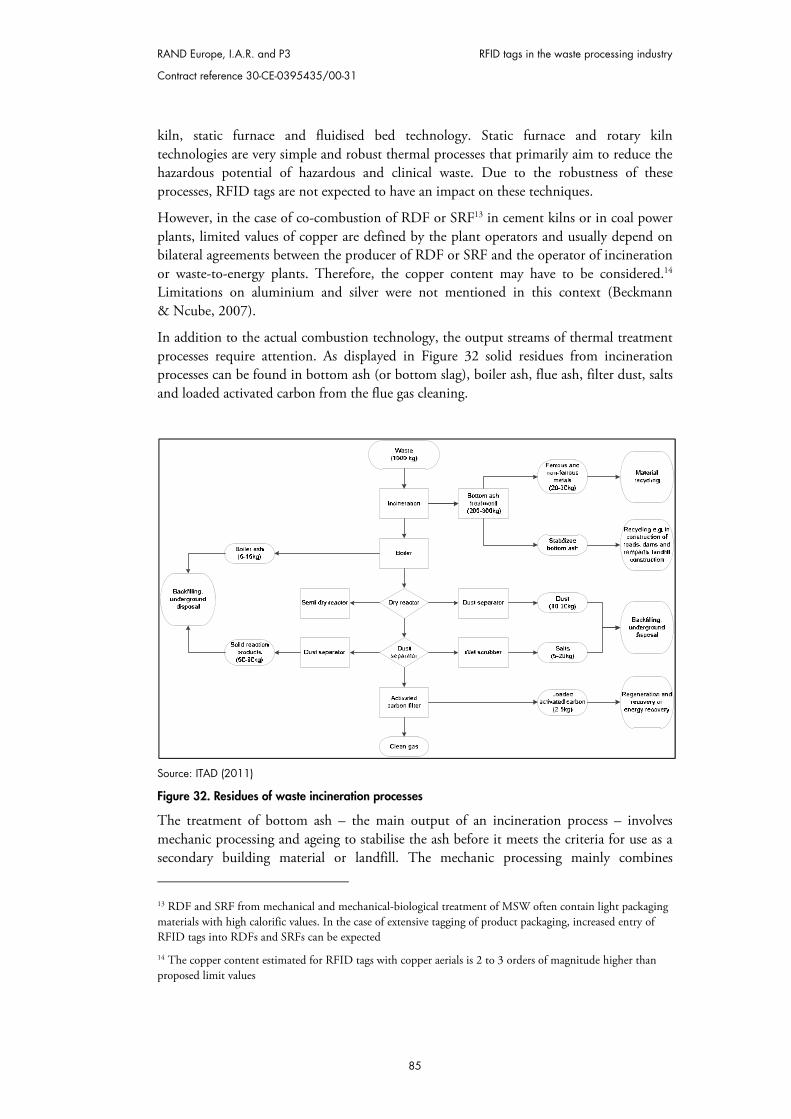
RAND Europe, I.A.R. and P3 RFID tags in the waste processing industry
Contract reference 30-CE-0395435/00-31
85
kiln, static furnace and fluidised bed technology. Static furnace and rotary kiln technologies are very simple and robust thermal processes that primarily aim to reduce the hazardous potential of hazardous and clinical waste. Due to the robustness of these processes, RFID tags are not expected to have an impact on these techniques.
However, in the case of co-combustion of RDF or SRF13 in cement kilns or in coal power plants, limited values of copper are defined by the plant operators and usually depend on bilateral agreements between the producer of RDF or SRF and the operator of incineration or waste-to-energy plants. Therefore, the copper content may have to be considered.14 Limitations on aluminium and silver were not mentioned in this context (Beckmann & Ncube, 2007).
In addition to the actual combustion technology, the output streams of thermal treatment processes require attention. As displayed in Figure 32 solid residues from incineration processes can be found in bottom ash (or bottom slag), boiler ash, flue ash, filter dust, salts and loaded activated carbon from the flue gas cleaning.
Source: ITAD (2011)
Figure 32. Residues of waste incineration processes
The treatment of bottom ash – the main output of an incineration process – involves mechanic processing and ageing to stabilise the ash before it meets the criteria for use as a secondary building material or landfill. The mechanic processing mainly combines
13 RDF and SRF from mechanical and mechanical-biological treatment of MSW often contain light packaging materials with high calorific values. In the case of extensive tagging of product packaging, increased entry of RFID tags into RDFs and SRFs can be expected
14 The copper content estimated for RFID tags with copper aerials is 2 to 3 orders of magnitude higher than proposed limit values
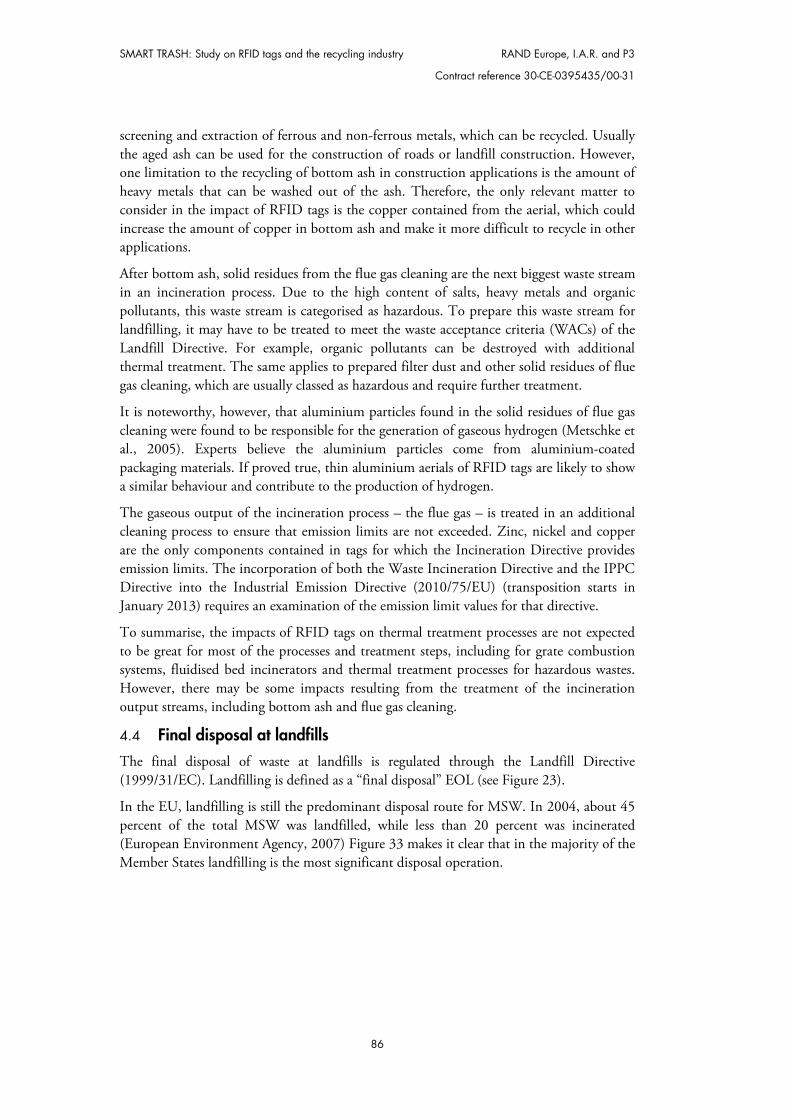
SMART TRASH: Study on RFID tags and the recycling industry RAND Europe, I.A.R. and P3
Contract reference 30-CE-0395435/00-31
86
screening and extraction of ferrous and non-ferrous metals, which can be recycled. Usually the aged ash can be used for the construction of roads or landfill construction. However, one limitation to the recycling of bottom ash in construction applications is the amount of heavy metals that can be washed out of the ash. Therefore, the only relevant matter to consider in the impact of RFID tags is the copper contained from the aerial, which could increase the amount of copper in bottom ash and make it more difficult to recycle in other applications.
After bottom ash, solid residues from the flue gas cleaning are the next biggest waste stream in an incineration process. Due to the high content of salts, heavy metals and organic pollutants, this waste stream is categorised as hazardous. To prepare this waste stream for landfilling, it may have to be treated to meet the waste acceptance criteria (WACs) of the Landfill Directive. For example, organic pollutants can be destroyed with additional thermal treatment. The same applies to prepared filter dust and other solid residues of flue gas cleaning, which are usually classed as hazardous and require further treatment.
It is noteworthy, however, that aluminium particles found in the solid residues of flue gas cleaning were found to be responsible for the generation of gaseous hydrogen (Metschke et al., 2005). Experts believe the aluminium particles come from aluminium-coated packaging materials. If proved true, thin aluminium aerials of RFID tags are likely to show a similar behaviour and contribute to the production of hydrogen.
The gaseous output of the incineration process – the flue gas – is treated in an additional cleaning process to ensure that emission limits are not exceeded. Zinc, nickel and copper are the only components contained in tags for which the Incineration Directive provides emission limits. The incorporation of both the Waste Incineration Directive and the IPPC Directive into the Industrial Emission Directive (2010/75/EU) (transposition starts in January 2013) requires an examination of the emission limit values for that directive.
To summarise, the impacts of RFID tags on thermal treatment processes are not expected to be great for most of the processes and treatment steps, including for grate combustion systems, fluidised bed incinerators and thermal treatment processes for hazardous wastes. However, there may be some impacts resulting from the treatment of the incineration output streams, including bottom ash and flue gas cleaning.
4.4 Final disposal at landfills The final disposal of waste at landfills is regulated through the Landfill Directive (1999/31/EC). Landfilling is defined as a “final disposal” EOL (see Figure 23).
In the EU, landfilling is still the predominant disposal route for MSW. In 2004, about 45 percent of the total MSW was landfilled, while less than 20 percent was incinerated (European Environment Agency, 2007) Figure 33 makes it clear that in the majority of the Member States landfilling is the most significant disposal operation.
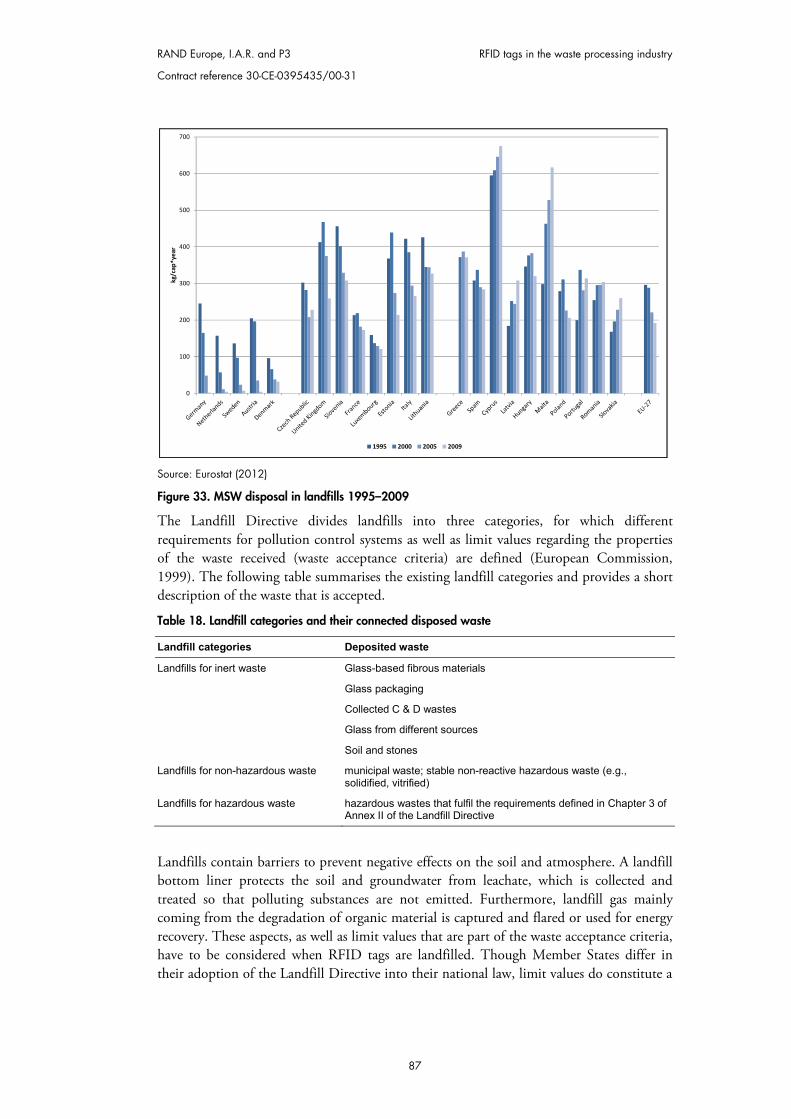
RAND Europe, I.A.R. and P3 RFID tags in the waste processing industry
Contract reference 30-CE-0395435/00-31
87
Source: Eurostat (2012)
Figure 33. MSW disposal in landfills 1995–2009
The Landfill Directive divides landfills into three categories, for which different requirements for pollution control systems as well as limit values regarding the properties of the waste received (waste acceptance criteria) are defined (European Commission, 1999). The following table summarises the existing landfill categories and provides a short description of the waste that is accepted.
Table 18. Landfill categories and their connected disposed waste
Landfill categories Deposited waste
Landfills for inert waste Glass-based fibrous materials
Glass packaging
Collected C & D wastes
Glass from different sources
Soil and stones
Landfills for non-hazardous waste municipal waste; stable non-reactive hazardous waste (e.g., solidified, vitrified)
Landfills for hazardous waste hazardous wastes that fulfil the requirements defined in Chapter 3 of Annex II of the Landfill Directive
Landfills contain barriers to prevent negative effects on the soil and atmosphere. A landfill bottom liner protects the soil and groundwater from leachate, which is collected and treated so that polluting substances are not emitted. Furthermore, landfill gas mainly coming from the degradation of organic material is captured and flared or used for energy recovery. These aspects, as well as limit values that are part of the waste acceptance criteria, have to be considered when RFID tags are landfilled. Though Member States differ in their adoption of the Landfill Directive into their national law, limit values do constitute a
0
100
200
300
400
500
600
700
kg/c
ap*y
ear
1995 2000 2005 2009
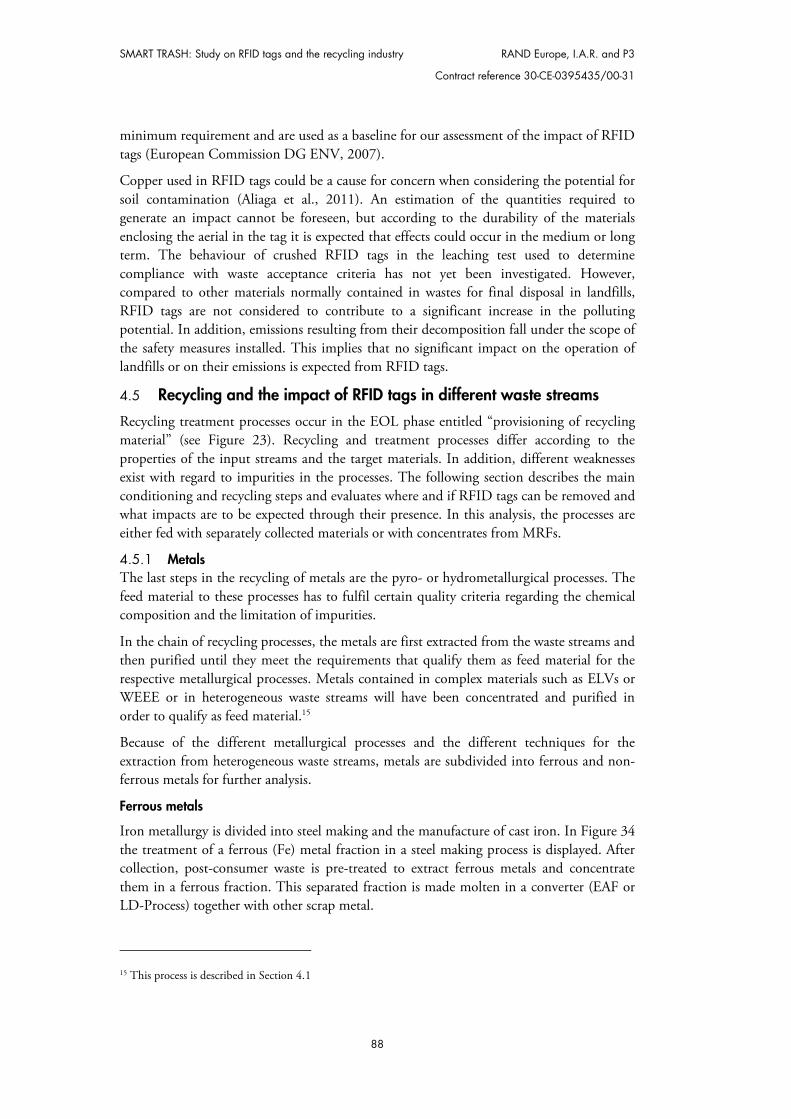
SMART TRASH: Study on RFID tags and the recycling industry RAND Europe, I.A.R. and P3
Contract reference 30-CE-0395435/00-31
88
minimum requirement and are used as a baseline for our assessment of the impact of RFID tags (European Commission DG ENV, 2007).
Copper used in RFID tags could be a cause for concern when considering the potential for soil contamination (Aliaga et al., 2011). An estimation of the quantities required to generate an impact cannot be foreseen, but according to the durability of the materials enclosing the aerial in the tag it is expected that effects could occur in the medium or long term. The behaviour of crushed RFID tags in the leaching test used to determine compliance with waste acceptance criteria has not yet been investigated. However, compared to other materials normally contained in wastes for final disposal in landfills, RFID tags are not considered to contribute to a significant increase in the polluting potential. In addition, emissions resulting from their decomposition fall under the scope of the safety measures installed. This implies that no significant impact on the operation of landfills or on their emissions is expected from RFID tags.
4.5 Recycling and the impact of RFID tags in different waste streams Recycling treatment processes occur in the EOL phase entitled “provisioning of recycling material” (see Figure 23). Recycling and treatment processes differ according to the properties of the input streams and the target materials. In addition, different weaknesses exist with regard to impurities in the processes. The following section describes the main conditioning and recycling steps and evaluates where and if RFID tags can be removed and what impacts are to be expected through their presence. In this analysis, the processes are either fed with separately collected materials or with concentrates from MRFs.
4.5.1 Metals The last steps in the recycling of metals are the pyro- or hydrometallurgical processes. The feed material to these processes has to fulfil certain quality criteria regarding the chemical composition and the limitation of impurities.
In the chain of recycling processes, the metals are first extracted from the waste streams and then purified until they meet the requirements that qualify them as feed material for the respective metallurgical processes. Metals contained in complex materials such as ELVs or WEEE or in heterogeneous waste streams will have been concentrated and purified in order to qualify as feed material.15
Because of the different metallurgical processes and the different techniques for the extraction from heterogeneous waste streams, metals are subdivided into ferrous and non-ferrous metals for further analysis.
Ferrous metals
Iron metallurgy is divided into steel making and the manufacture of cast iron. In Figure 34 the treatment of a ferrous (Fe) metal fraction in a steel making process is displayed. After collection, post-consumer waste is pre-treated to extract ferrous metals and concentrate them in a ferrous fraction. This separated fraction is made molten in a converter (EAF or LD-Process) together with other scrap metal.
15 This process is described in Section 4.1
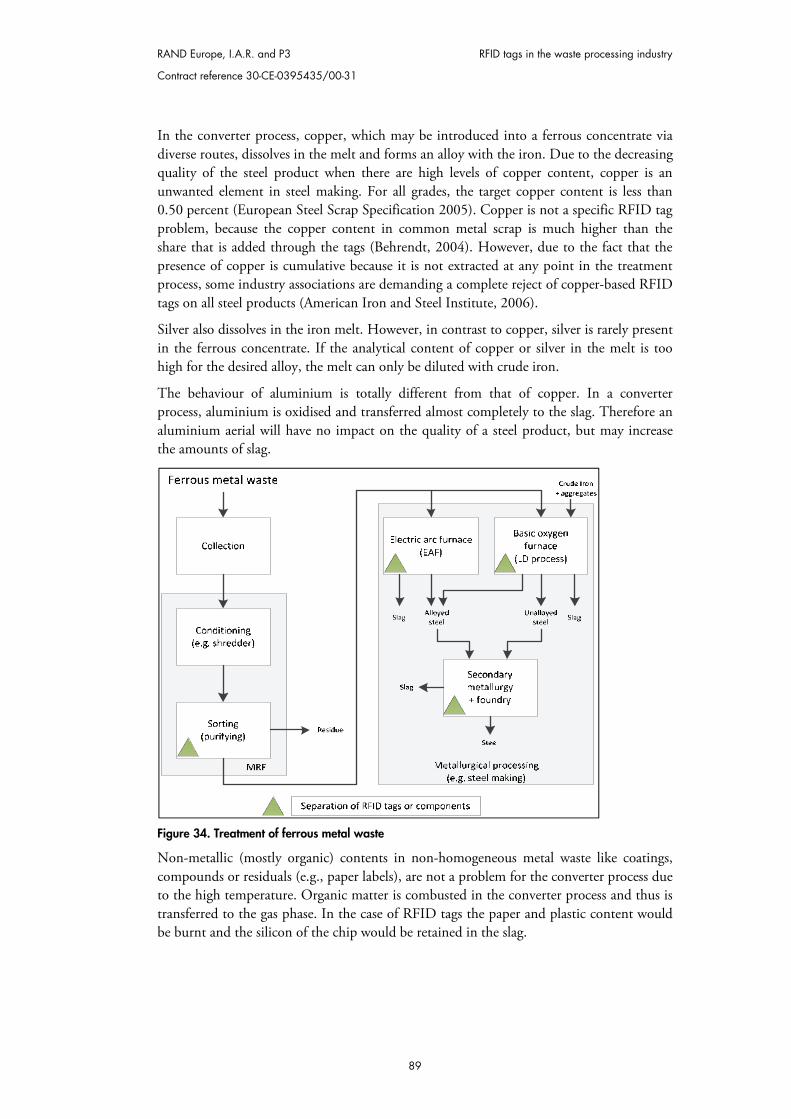
RAND Europe, I.A.R. and P3 RFID tags in the waste processing industry
Contract reference 30-CE-0395435/00-31
89
In the converter process, copper, which may be introduced into a ferrous concentrate via diverse routes, dissolves in the melt and forms an alloy with the iron. Due to the decreasing quality of the steel product when there are high levels of copper content, copper is an unwanted element in steel making. For all grades, the target copper content is less than 0.50 percent (European Steel Scrap Specification 2005). Copper is not a specific RFID tag problem, because the copper content in common metal scrap is much higher than the share that is added through the tags (Behrendt, 2004). However, due to the fact that the presence of copper is cumulative because it is not extracted at any point in the treatment process, some industry associations are demanding a complete reject of copper-based RFID tags on all steel products (American Iron and Steel Institute, 2006).
Silver also dissolves in the iron melt. However, in contrast to copper, silver is rarely present in the ferrous concentrate. If the analytical content of copper or silver in the melt is too high for the desired alloy, the melt can only be diluted with crude iron.
The behaviour of aluminium is totally different from that of copper. In a converter process, aluminium is oxidised and transferred almost completely to the slag. Therefore an aluminium aerial will have no impact on the quality of a steel product, but may increase the amounts of slag.
Figure 34. Treatment of ferrous metal waste
Non-metallic (mostly organic) contents in non-homogeneous metal waste like coatings, compounds or residuals (e.g., paper labels), are not a problem for the converter process due to the high temperature. Organic matter is combusted in the converter process and thus is transferred to the gas phase. In the case of RFID tags the paper and plastic content would be burnt and the silicon of the chip would be retained in the slag.
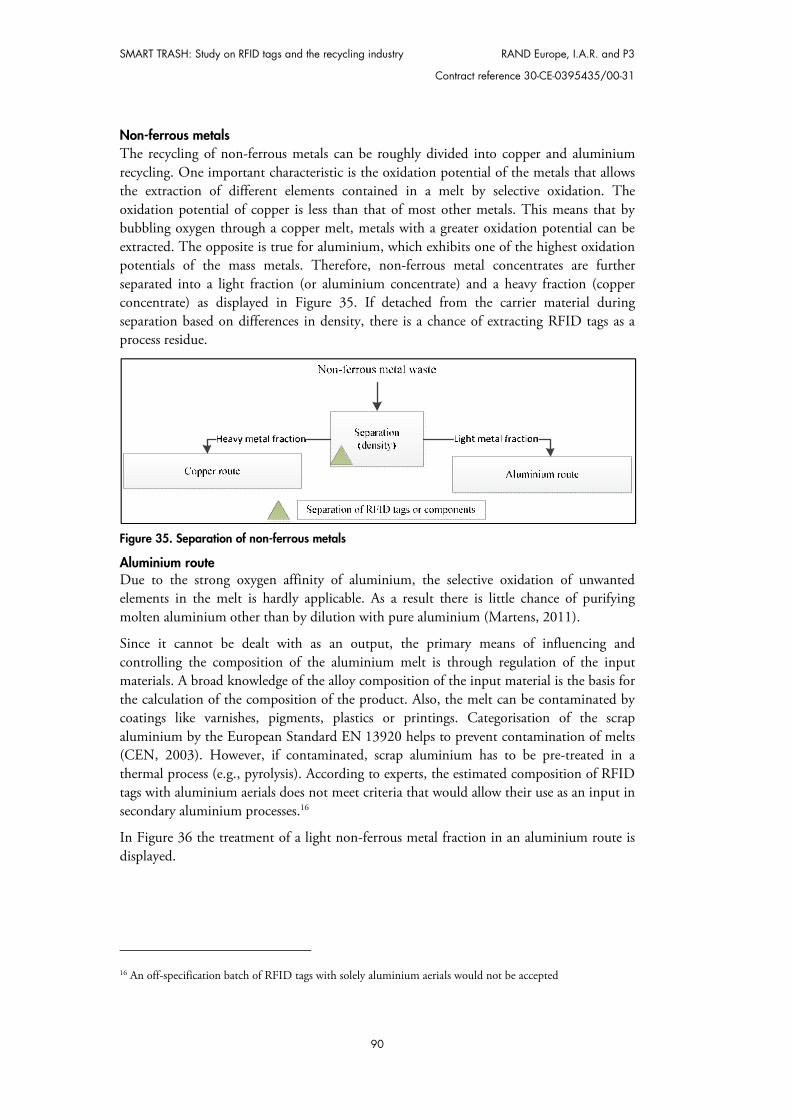
SMART TRASH: Study on RFID tags and the recycling industry RAND Europe, I.A.R. and P3
Contract reference 30-CE-0395435/00-31
90
Non-ferrous metals The recycling of non-ferrous metals can be roughly divided into copper and aluminium recycling. One important characteristic is the oxidation potential of the metals that allows the extraction of different elements contained in a melt by selective oxidation. The oxidation potential of copper is less than that of most other metals. This means that by bubbling oxygen through a copper melt, metals with a greater oxidation potential can be extracted. The opposite is true for aluminium, which exhibits one of the highest oxidation potentials of the mass metals. Therefore, non-ferrous metal concentrates are further separated into a light fraction (or aluminium concentrate) and a heavy fraction (copper concentrate) as displayed in Figure 35. If detached from the carrier material during separation based on differences in density, there is a chance of extracting RFID tags as a process residue.
Figure 35. Separation of non-ferrous metals
Aluminium route Due to the strong oxygen affinity of aluminium, the selective oxidation of unwanted elements in the melt is hardly applicable. As a result there is little chance of purifying molten aluminium other than by dilution with pure aluminium (Martens, 2011).
Since it cannot be dealt with as an output, the primary means of influencing and controlling the composition of the aluminium melt is through regulation of the input materials. A broad knowledge of the alloy composition of the input material is the basis for the calculation of the composition of the product. Also, the melt can be contaminated by coatings like varnishes, pigments, plastics or printings. Categorisation of the scrap aluminium by the European Standard EN 13920 helps to prevent contamination of melts (CEN, 2003). However, if contaminated, scrap aluminium has to be pre-treated in a thermal process (e.g., pyrolysis). According to experts, the estimated composition of RFID tags with aluminium aerials does not meet criteria that would allow their use as an input in secondary aluminium processes.16
In Figure 36 the treatment of a light non-ferrous metal fraction in an aluminium route is displayed.
16 An off-specification batch of RFID tags with solely aluminium aerials would not be accepted
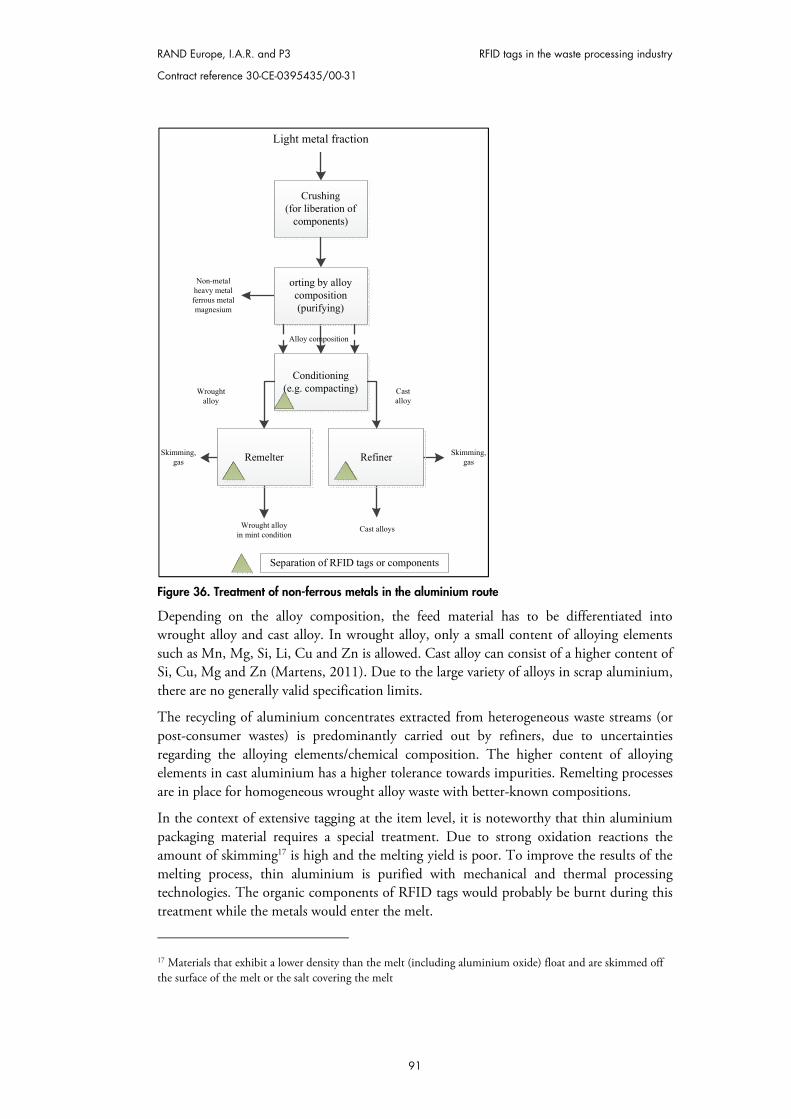
RAND Europe, I.A.R. and P3 RFID tags in the waste processing industry
Contract reference 30-CE-0395435/00-31
91
Figure 36. Treatment of non-ferrous metals in the aluminium route
Depending on the alloy composition, the feed material has to be differentiated into wrought alloy and cast alloy. In wrought alloy, only a small content of alloying elements such as Mn, Mg, Si, Li, Cu and Zn is allowed. Cast alloy can consist of a higher content of Si, Cu, Mg and Zn (Martens, 2011). Due to the large variety of alloys in scrap aluminium, there are no generally valid specification limits.
The recycling of aluminium concentrates extracted from heterogeneous waste streams (or post-consumer wastes) is predominantly carried out by refiners, due to uncertainties regarding the alloying elements/chemical composition. The higher content of alloying elements in cast aluminium has a higher tolerance towards impurities. Remelting processes are in place for homogeneous wrought alloy waste with better-known compositions.
In the context of extensive tagging at the item level, it is noteworthy that thin aluminium packaging material requires a special treatment. Due to strong oxidation reactions the amount of skimming17 is high and the melting yield is poor. To improve the results of the melting process, thin aluminium is purified with mechanical and thermal processing technologies. The organic components of RFID tags would probably be burnt during this treatment while the metals would enter the melt.
17 Materials that exhibit a lower density than the melt (including aluminium oxide) float and are skimmed off the surface of the melt or the salt covering the melt
Non-metal heavy metalferrous metalmagnesium
Crushing (for liberation of
components)
Conditioning(e.g. compacting)
Alloy composition
Wrought alloy
Cast alloy
Cast alloysWrought alloy in mint condition
Skimming,gas Remelter Skimming,
gasRefiner
orting by alloy composition(purifying)
Separation of RFID tags or components
Light metal fraction
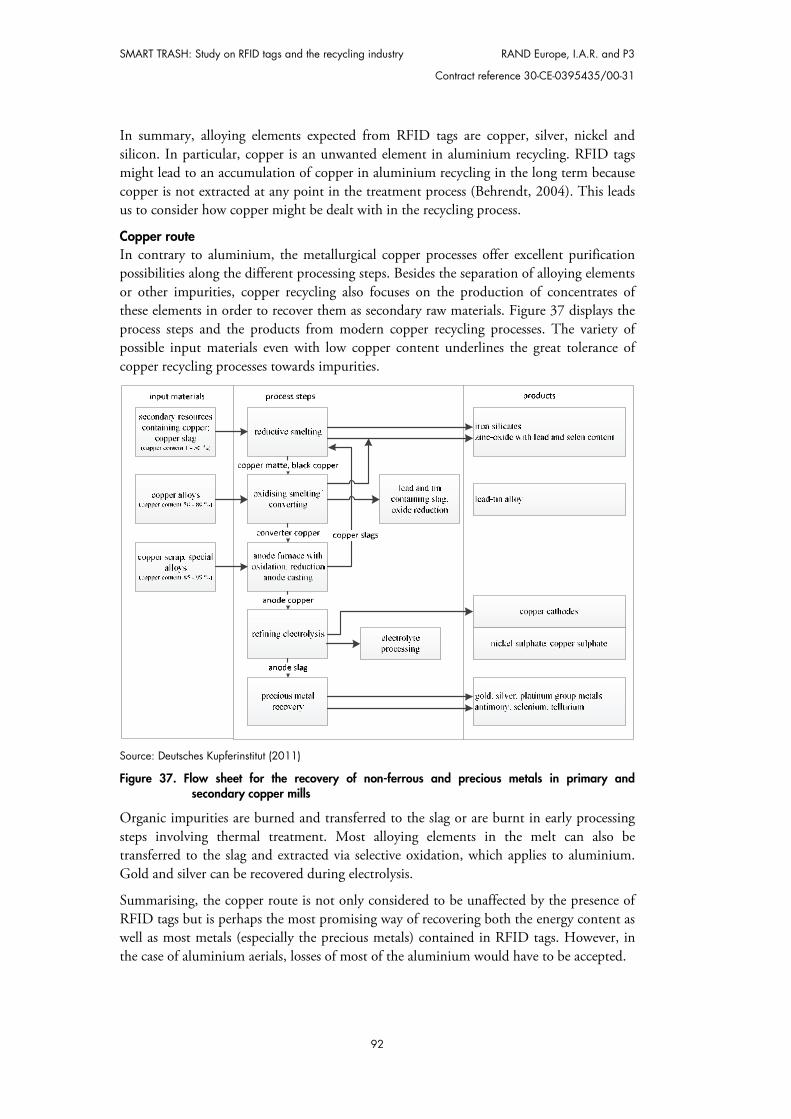
SMART TRASH: Study on RFID tags and the recycling industry RAND Europe, I.A.R. and P3
Contract reference 30-CE-0395435/00-31
92
In summary, alloying elements expected from RFID tags are copper, silver, nickel and silicon. In particular, copper is an unwanted element in aluminium recycling. RFID tags might lead to an accumulation of copper in aluminium recycling in the long term because copper is not extracted at any point in the treatment process (Behrendt, 2004). This leads us to consider how copper might be dealt with in the recycling process.
Copper route In contrary to aluminium, the metallurgical copper processes offer excellent purification possibilities along the different processing steps. Besides the separation of alloying elements or other impurities, copper recycling also focuses on the production of concentrates of these elements in order to recover them as secondary raw materials. Figure 37 displays the process steps and the products from modern copper recycling processes. The variety of possible input materials even with low copper content underlines the great tolerance of copper recycling processes towards impurities.
Source: Deutsches Kupferinstitut (2011)
Figure 37. Flow sheet for the recovery of non-ferrous and precious metals in primary and secondary copper mills
Organic impurities are burned and transferred to the slag or are burnt in early processing steps involving thermal treatment. Most alloying elements in the melt can also be transferred to the slag and extracted via selective oxidation, which applies to aluminium. Gold and silver can be recovered during electrolysis.
Summarising, the copper route is not only considered to be unaffected by the presence of RFID tags but is perhaps the most promising way of recovering both the energy content as well as most metals (especially the precious metals) contained in RFID tags. However, in the case of aluminium aerials, losses of most of the aluminium would have to be accepted.
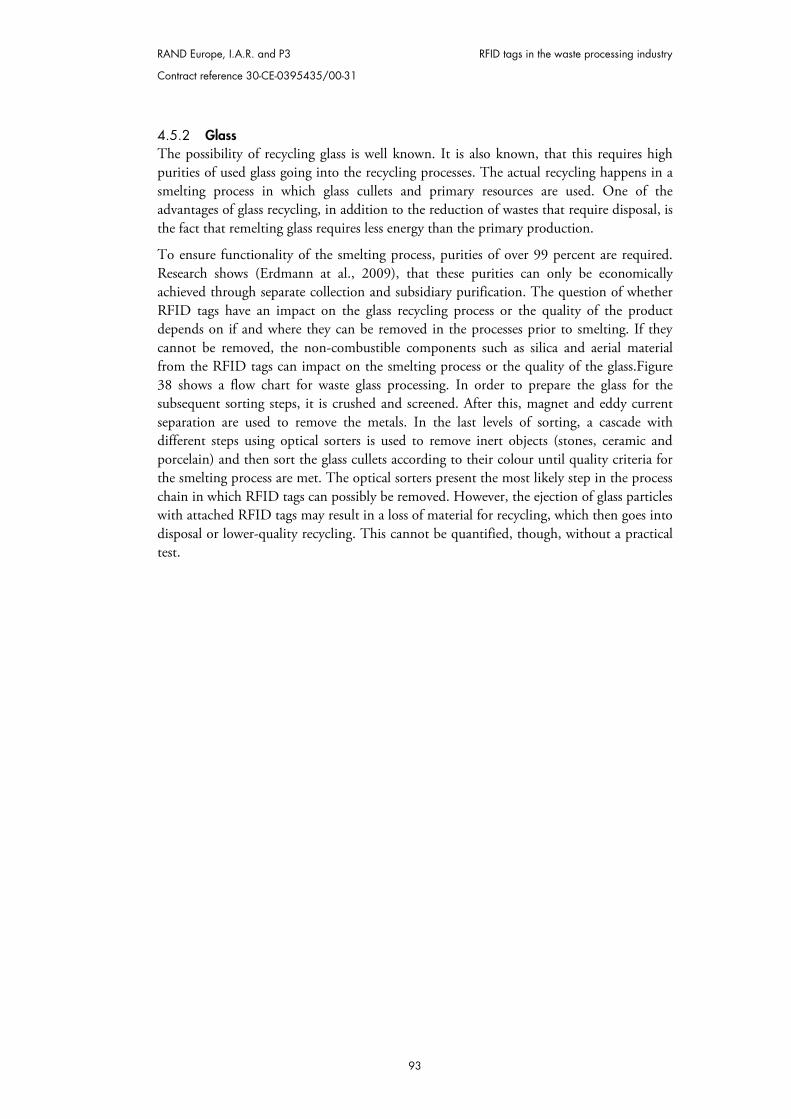
RAND Europe, I.A.R. and P3 RFID tags in the waste processing industry
Contract reference 30-CE-0395435/00-31
93
4.5.2 Glass The possibility of recycling glass is well known. It is also known, that this requires high purities of used glass going into the recycling processes. The actual recycling happens in a smelting process in which glass cullets and primary resources are used. One of the advantages of glass recycling, in addition to the reduction of wastes that require disposal, is the fact that remelting glass requires less energy than the primary production.
To ensure functionality of the smelting process, purities of over 99 percent are required. Research shows (Erdmann at al., 2009), that these purities can only be economically achieved through separate collection and subsidiary purification. The question of whether RFID tags have an impact on the glass recycling process or the quality of the product depends on if and where they can be removed in the processes prior to smelting. If they cannot be removed, the non-combustible components such as silica and aerial material from the RFID tags can impact on the smelting process or the quality of the glass.Figure 38 shows a flow chart for waste glass processing. In order to prepare the glass for the subsequent sorting steps, it is crushed and screened. After this, magnet and eddy current separation are used to remove the metals. In the last levels of sorting, a cascade with different steps using optical sorters is used to remove inert objects (stones, ceramic and porcelain) and then sort the glass cullets according to their colour until quality criteria for the smelting process are met. The optical sorters present the most likely step in the process chain in which RFID tags can possibly be removed. However, the ejection of glass particles with attached RFID tags may result in a loss of material for recycling, which then goes into disposal or lower-quality recycling. This cannot be quantified, though, without a practical test.
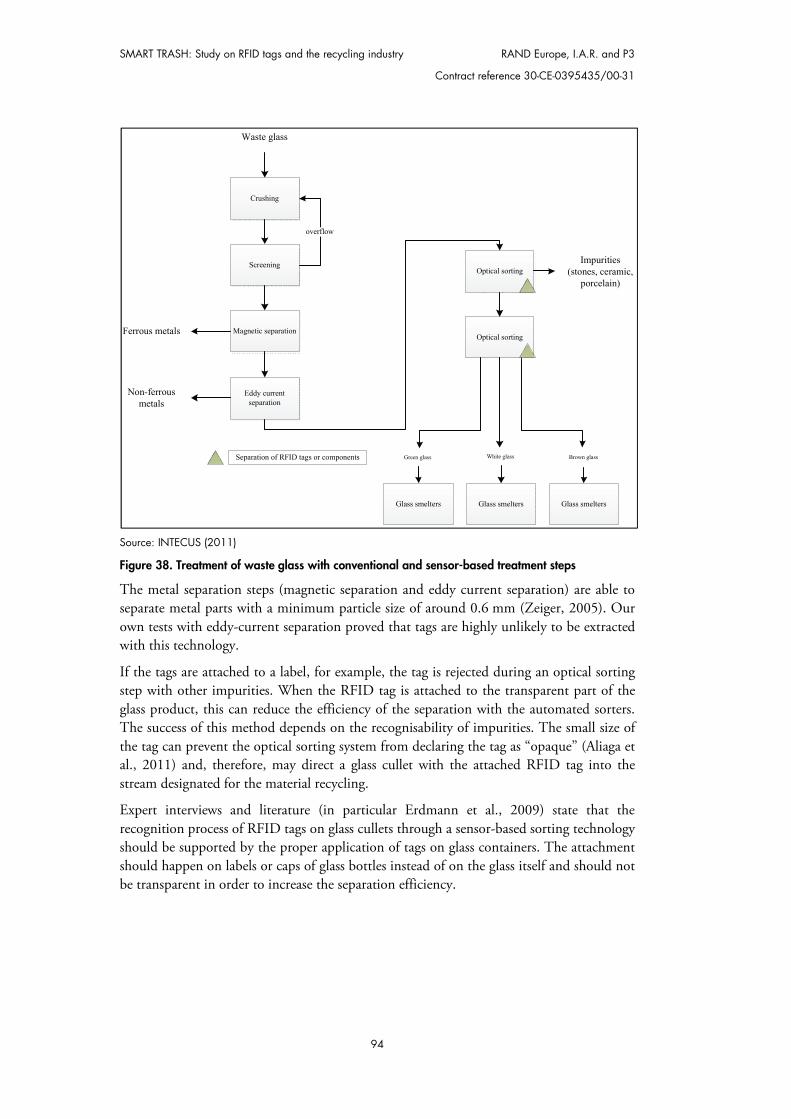
SMART TRASH: Study on RFID tags and the recycling industry RAND Europe, I.A.R. and P3
Contract reference 30-CE-0395435/00-31
94
Source: INTECUS (2011)
Figure 38. Treatment of waste glass with conventional and sensor-based treatment steps
The metal separation steps (magnetic separation and eddy current separation) are able to separate metal parts with a minimum particle size of around 0.6 mm (Zeiger, 2005). Our own tests with eddy-current separation proved that tags are highly unlikely to be extracted with this technology.
If the tags are attached to a label, for example, the tag is rejected during an optical sorting step with other impurities. When the RFID tag is attached to the transparent part of the glass product, this can reduce the efficiency of the separation with the automated sorters. The success of this method depends on the recognisability of impurities. The small size of the tag can prevent the optical sorting system from declaring the tag as “opaque” (Aliaga et al., 2011) and, therefore, may direct a glass cullet with the attached RFID tag into the stream designated for the material recycling.
Expert interviews and literature (in particular Erdmann et al., 2009) state that the recognition process of RFID tags on glass cullets through a sensor-based sorting technology should be supported by the proper application of tags on glass containers. The attachment should happen on labels or caps of glass bottles instead of on the glass itself and should not be transparent in order to increase the separation efficiency.
Screening
Crushing
Magnetic separation
Eddy current separation
Ferrous metals
overflow
Optical sorting
Optical sorting
Brown glass
Impurities(stones, ceramic,
porcelain)
White glass
Waste glass
Separation of RFID tags or components
Non-ferrous metals
Green glass
Glass smelters Glass smelters Glass smelters
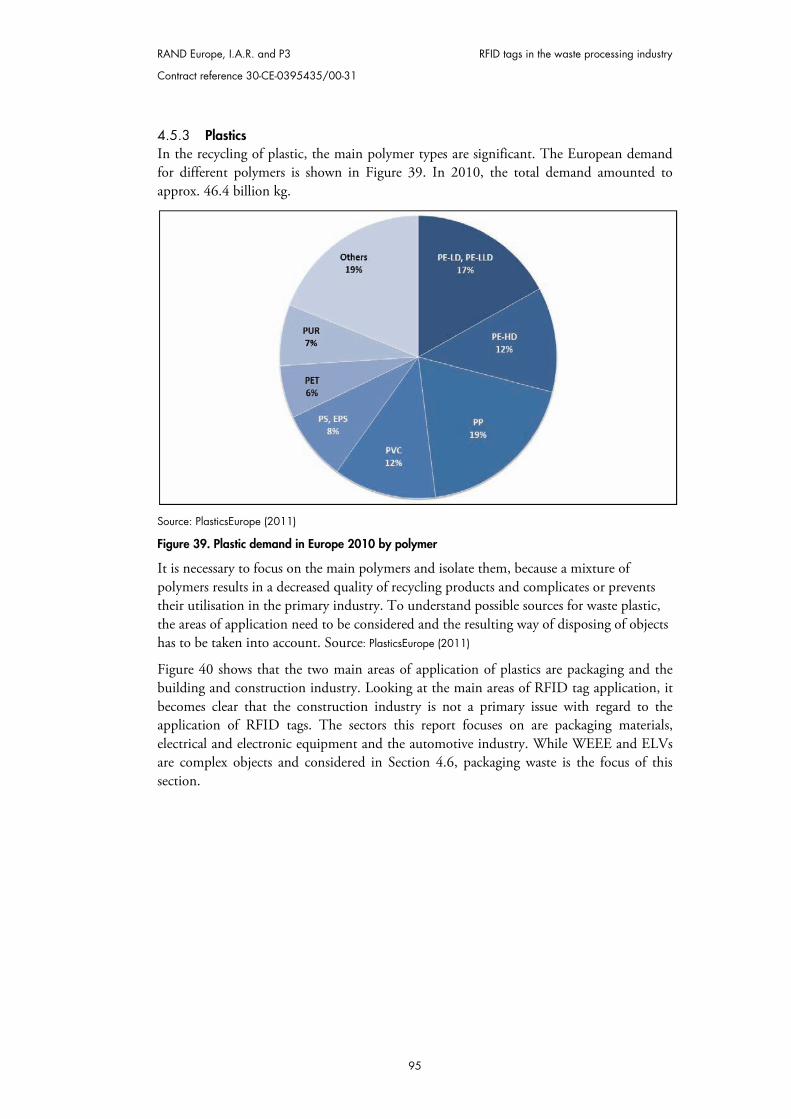
RAND Europe, I.A.R. and P3 RFID tags in the waste processing industry
Contract reference 30-CE-0395435/00-31
95
4.5.3 Plastics In the recycling of plastic, the main polymer types are significant. The European demand for different polymers is shown in Figure 39. In 2010, the total demand amounted to approx. 46.4 billion kg.
Source: PlasticsEurope (2011)
Figure 39. Plastic demand in Europe 2010 by polymer
It is necessary to focus on the main polymers and isolate them, because a mixture of polymers results in a decreased quality of recycling products and complicates or prevents their utilisation in the primary industry. To understand possible sources for waste plastic, the areas of application need to be considered and the resulting way of disposing of objects has to be taken into account. Source: PlasticsEurope (2011)
Figure 40 shows that the two main areas of application of plastics are packaging and the building and construction industry. Looking at the main areas of RFID tag application, it becomes clear that the construction industry is not a primary issue with regard to the application of RFID tags. The sectors this report focuses on are packaging materials, electrical and electronic equipment and the automotive industry. While WEEE and ELVs are complex objects and considered in Section 4.6, packaging waste is the focus of this section.
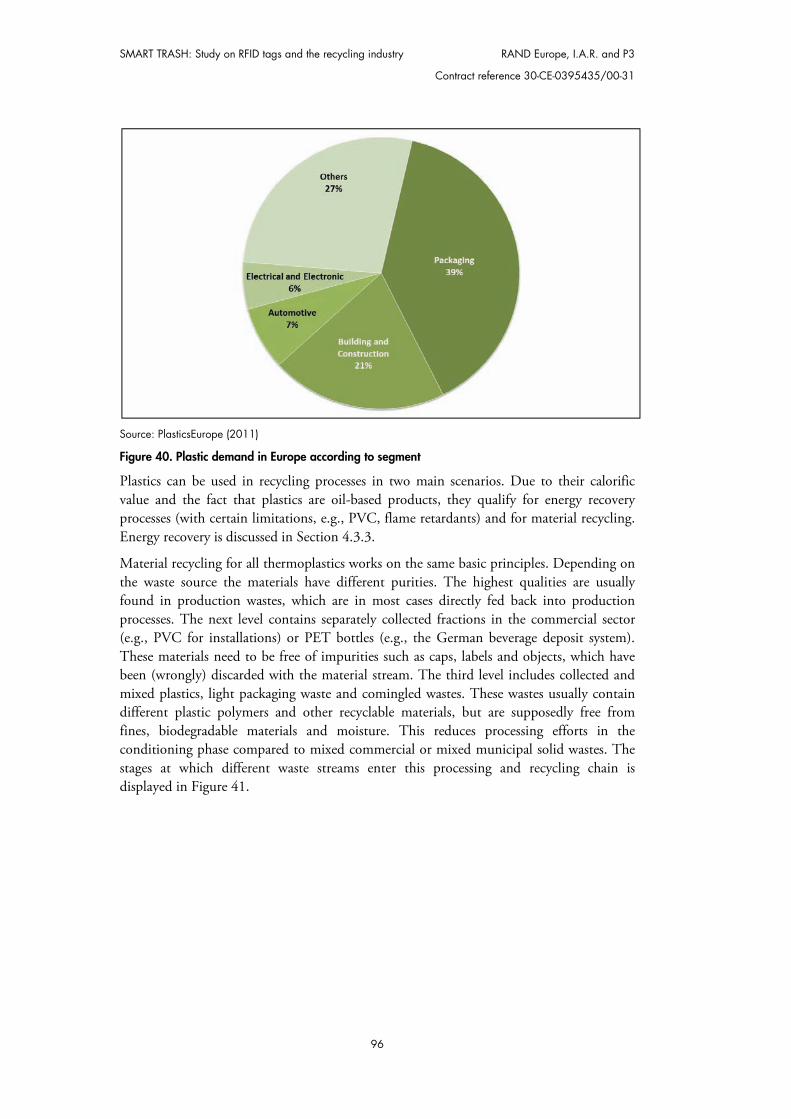
SMART TRASH: Study on RFID tags and the recycling industry RAND Europe, I.A.R. and P3
Contract reference 30-CE-0395435/00-31
96
Source: PlasticsEurope (2011)
Figure 40. Plastic demand in Europe according to segment
Plastics can be used in recycling processes in two main scenarios. Due to their calorific value and the fact that plastics are oil-based products, they qualify for energy recovery processes (with certain limitations, e.g., PVC, flame retardants) and for material recycling. Energy recovery is discussed in Section 4.3.3.
Material recycling for all thermoplastics works on the same basic principles. Depending on the waste source the materials have different purities. The highest qualities are usually found in production wastes, which are in most cases directly fed back into production processes. The next level contains separately collected fractions in the commercial sector (e.g., PVC for installations) or PET bottles (e.g., the German beverage deposit system). These materials need to be free of impurities such as caps, labels and objects, which have been (wrongly) discarded with the material stream. The third level includes collected and mixed plastics, light packaging waste and comingled wastes. These wastes usually contain different plastic polymers and other recyclable materials, but are supposedly free from fines, biodegradable materials and moisture. This reduces processing efforts in the conditioning phase compared to mixed commercial or mixed municipal solid wastes. The stages at which different waste streams enter this processing and recycling chain is displayed in Figure 41.
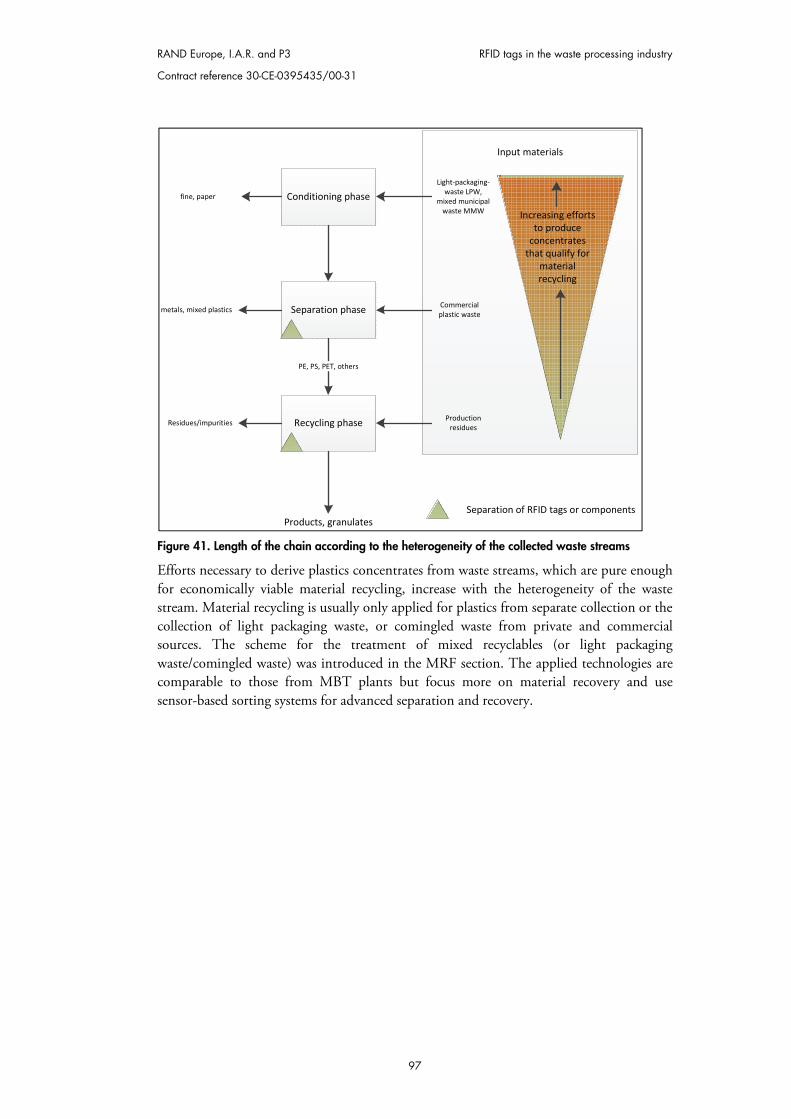
RAND Europe, I.A.R. and P3 RFID tags in the waste processing industry
Contract reference 30-CE-0395435/00-31
97
Figure 41. Length of the chain according to the heterogeneity of the collected waste streams
Efforts necessary to derive plastics concentrates from waste streams, which are pure enough for economically viable material recycling, increase with the heterogeneity of the waste stream. Material recycling is usually only applied for plastics from separate collection or the collection of light packaging waste, or comingled waste from private and commercial sources. The scheme for the treatment of mixed recyclables (or light packaging waste/comingled waste) was introduced in the MRF section. The applied technologies are comparable to those from MBT plants but focus more on material recovery and use sensor-based sorting systems for advanced separation and recovery.
Input materials
Conditioning phase
Separation phase
Recycling phase
PE, PS, PET, others
Light-packaging-waste LPW,
mixed municipal waste MMW
Commercial plastic waste
Production residues
fine, paper
metals, mixed plastics
Products, granulates
Residues/impurities
Increasing efforts to produce
concentrates that qualify for
material recycling
Separation of RFID tags or components
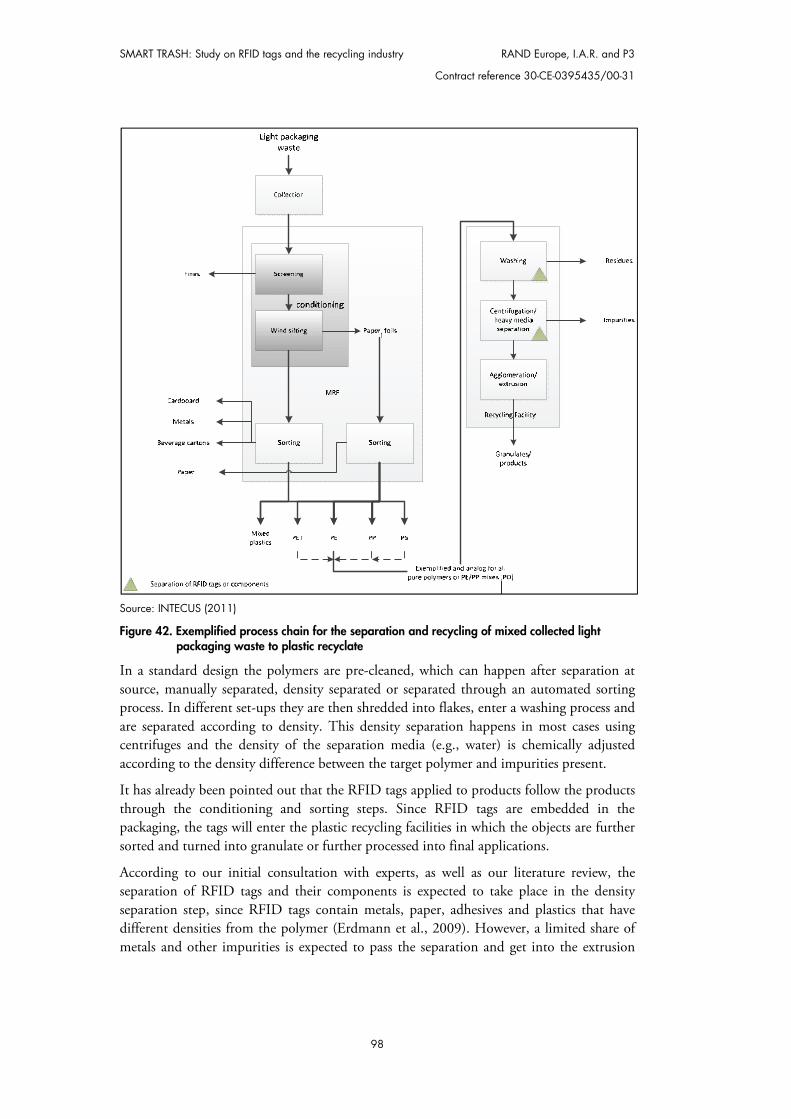
SMART TRASH: Study on RFID tags and the recycling industry RAND Europe, I.A.R. and P3
Contract reference 30-CE-0395435/00-31
98
Source: INTECUS (2011)
Figure 42. Exemplified process chain for the separation and recycling of mixed collected light packaging waste to plastic recyclate
In a standard design the polymers are pre-cleaned, which can happen after separation at source, manually separated, density separated or separated through an automated sorting process. In different set-ups they are then shredded into flakes, enter a washing process and are separated according to density. This density separation happens in most cases using centrifuges and the density of the separation media (e.g., water) is chemically adjusted according to the density difference between the target polymer and impurities present.
It has already been pointed out that the RFID tags applied to products follow the products through the conditioning and sorting steps. Since RFID tags are embedded in the packaging, the tags will enter the plastic recycling facilities in which the objects are further sorted and turned into granulate or further processed into final applications.
According to our initial consultation with experts, as well as our literature review, the separation of RFID tags and their components is expected to take place in the density separation step, since RFID tags contain metals, paper, adhesives and plastics that have different densities from the polymer (Erdmann et al., 2009). However, a limited share of metals and other impurities is expected to pass the separation and get into the extrusion
RAND Europe, I.A.R. and P3 RFID tags in the waste processing industry
Contract reference 30-CE-0395435/00-31
99
process. Such components can create technical disturbances blocking screens or nozzles of extruders and can reduce the throughput (Aliaga et al., 2011).
In the German study, the Eidgenössische Materialprüfungs- und Forschungsanstalt (EMPA; Swiss Federal Laboratories for Materials Science and Technology) conducted tests with RFID tags and shredded plastics. Tags were washed in a sodium hydroxide solution and remained in their compound, which supports the assumption that a separation in the process is technically feasible (Erdmann et al., 2009).
According to experts (Erdmann, 2010) different actions are advisable. The adaption of screens or the embedding of RFID tags into components in a way that supports the separation in existing processes in one action, as is the technical analysis of tags in large-scale tests. Future predictions regarding the development of RFID tags, their composition and the future quantities of RFID tags also have to be considered.
For all materials entering recycling processes, purity is a major concern. Even if technical impacts on the processes are not expected or cannot be controlled, they impact on the processing costs and/or the quality of products. A related factor is the material loss and the recovery rate, which both suffer from attachments that are complicated to remove.
According to experts from the plastic recycling industry in Europe (European Plastics Recyclers, EuPR), a clear hierarchy regarding the application of other objects on plastics for recycling is needed:
1. The number of components should be as small as possible (single materials). 2. If attachments are necessary, they should not be detachable with manual stress. 3. If mechanical influence is necessary, the following hierarchy applies
a. Detachment through mechanical stress (friction or comminution) b. Short exposure to moisture
4. If attachments are required that cannot be detached as suggested under point 3, the density of the attached objects or materials to the material to be recycled needs to be significantly larger or smaller to enable separation according to density.
An increase of materials in the recyclate of mono-polymers is undesired, but different sources exist. The idea of printing RFID tags directly onto plastic products only seems advisable if technologies to remove the printings are available. As for the state-of-the-art plastic recycling processes, the application of such printed electronics will otherwise be undesired by recyclers.
4.5.4 Paper According to recycling market research, the total potential for paper in the EU in 2006 was approximately 80.5 billion kg and the overall recycling rate amounted to approximately 67 percent (Alwast et al., 2010).
The recycling of paper and cardboard is a well-established industry, which depends on a separate collection of paper waste or a collection that ensures the absence of fine particles, moisture and biodegradable material.
The process chain of paper waste from its source to the recycling plant and subsequent use as a secondary raw material is displayed in Figure 43. The separately collected material requires a treatment that includes the removal of pollutants such as fines and ferrous
SMART TRASH: Study on RFID tags and the recycling industry RAND Europe, I.A.R. and P3
Contract reference 30-CE-0395435/00-31
100
objects and a sorting into different paper types (e.g., graphic papers, de-inking paper, cardboard). This sorting can be done manually or by sensor-based sorting equipment (as introduced in Section 4.3.2). This processing step is carried out either in special waste sorting facilities, which represent one type of MRF, or in processing facilities that are integrated within paper mills. The subsidiary processing, which is displayed for paper type B in Figure 43,18 happens in a similar way to the other sorting processes. The only difference is that the de-inking process is not applied for paper types that do not have printings.
The different paper types are then transported to paper mills and are dissolved in a pulping process. While paper is dissolved and exists in the process in the form of fibres, the metal and plastic components keep their structure. This effect is used to separate impurities before the recycling processes.
Since paper waste already contains small-scale metal and plastic objects, such as stickers or paper clips, it is important to have separation technologies to eject these materials. Smaller components remaining in the paper pulp are later discharged in hydro cyclones and curved or slotted screens.
After the mechanical processing, papers with printing (especially graphic papers) will enter a de-inking process in which washing solutions bleach the fibres and remove the colour-giving component. After the de-inking process the fibres are “sorted” according to their length, which basically happens through screening processes, and can then be used in the process of paper making.
In the first phase of the processes, namely the conditioning and the manual or automated sorting of waste paper, no impacts from the presence of RFID tags are to be expected. We can be confident of this because these processes have already been considered in Section 4.3.1 and we saw there that no negative interactions with the processes are expected. Therefore, tags will remain on the items they are attached to and follow them into the subsidiary treatment paths. In the pulping process, paper-based RFID tags will be dissolved and the metals and the chip will remain as solid objects in the solution. Plastic labels will not be dissolved and therefore remain as complete objects. The items that are not dissolved are then subjected to separation processes either according to densities higher or lower than the paper pulp. This process happens directly in the pulping process itself or afterwards in hydro cyclones or curved screens (Jansen et al., 2007).
18 A comparable set-up is applied for paper type A and cardboard in the figure
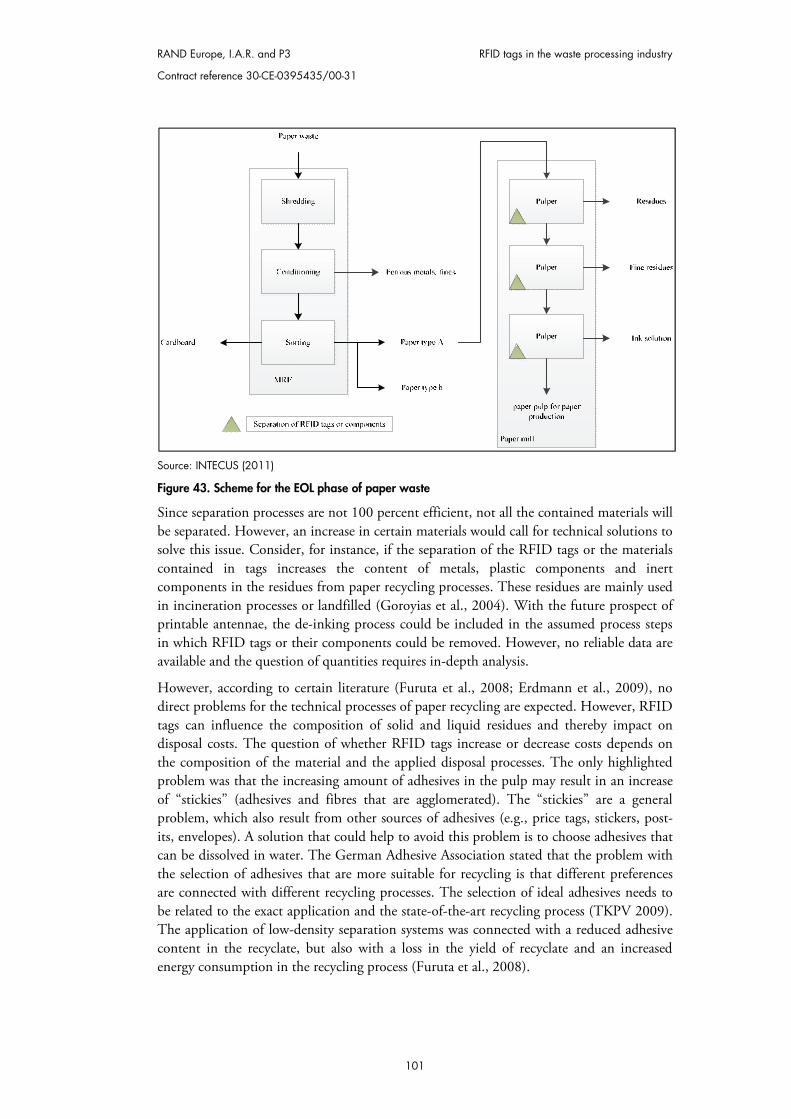
RAND Europe, I.A.R. and P3 RFID tags in the waste processing industry
Contract reference 30-CE-0395435/00-31
101
Source: INTECUS (2011)
Figure 43. Scheme for the EOL phase of paper waste
Since separation processes are not 100 percent efficient, not all the contained materials will be separated. However, an increase in certain materials would call for technical solutions to solve this issue. Consider, for instance, if the separation of the RFID tags or the materials contained in tags increases the content of metals, plastic components and inert components in the residues from paper recycling processes. These residues are mainly used in incineration processes or landfilled (Goroyias et al., 2004). With the future prospect of printable antennae, the de-inking process could be included in the assumed process steps in which RFID tags or their components could be removed. However, no reliable data are available and the question of quantities requires in-depth analysis.
However, according to certain literature (Furuta et al., 2008; Erdmann et al., 2009), no direct problems for the technical processes of paper recycling are expected. However, RFID tags can influence the composition of solid and liquid residues and thereby impact on disposal costs. The question of whether RFID tags increase or decrease costs depends on the composition of the material and the applied disposal processes. The only highlighted problem was that the increasing amount of adhesives in the pulp may result in an increase of “stickies” (adhesives and fibres that are agglomerated). The “stickies” are a general problem, which also result from other sources of adhesives (e.g., price tags, stickers, post-its, envelopes). A solution that could help to avoid this problem is to choose adhesives that can be dissolved in water. The German Adhesive Association stated that the problem with the selection of adhesives that are more suitable for recycling is that different preferences are connected with different recycling processes. The selection of ideal adhesives needs to be related to the exact application and the state-of-the-art recycling process (TKPV 2009). The application of low-density separation systems was connected with a reduced adhesive content in the recyclate, but also with a loss in the yield of recyclate and an increased energy consumption in the recycling process (Furuta et al., 2008).
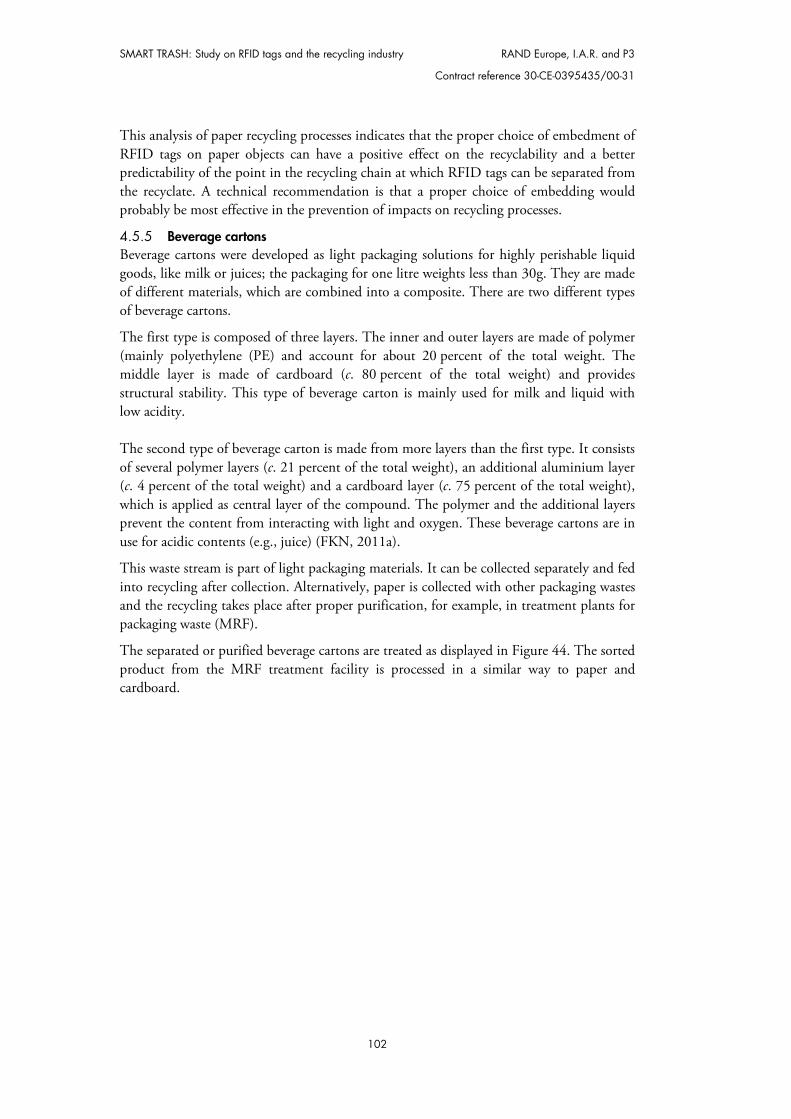
SMART TRASH: Study on RFID tags and the recycling industry RAND Europe, I.A.R. and P3
Contract reference 30-CE-0395435/00-31
102
This analysis of paper recycling processes indicates that the proper choice of embedment of RFID tags on paper objects can have a positive effect on the recyclability and a better predictability of the point in the recycling chain at which RFID tags can be separated from the recyclate. A technical recommendation is that a proper choice of embedding would probably be most effective in the prevention of impacts on recycling processes.
4.5.5 Beverage cartons Beverage cartons were developed as light packaging solutions for highly perishable liquid goods, like milk or juices; the packaging for one litre weights less than 30g. They are made of different materials, which are combined into a composite. There are two different types of beverage cartons.
The first type is composed of three layers. The inner and outer layers are made of polymer (mainly polyethylene (PE) and account for about 20 percent of the total weight. The middle layer is made of cardboard (c. 80 percent of the total weight) and provides structural stability. This type of beverage carton is mainly used for milk and liquid with low acidity. The second type of beverage carton is made from more layers than the first type. It consists of several polymer layers (c. 21 percent of the total weight), an additional aluminium layer (c. 4 percent of the total weight) and a cardboard layer (c. 75 percent of the total weight), which is applied as central layer of the compound. The polymer and the additional layers prevent the content from interacting with light and oxygen. These beverage cartons are in use for acidic contents (e.g., juice) (FKN, 2011a).
This waste stream is part of light packaging materials. It can be collected separately and fed into recycling after collection. Alternatively, paper is collected with other packaging wastes and the recycling takes place after proper purification, for example, in treatment plants for packaging waste (MRF).
The separated or purified beverage cartons are treated as displayed in Figure 44. The sorted product from the MRF treatment facility is processed in a similar way to paper and cardboard.
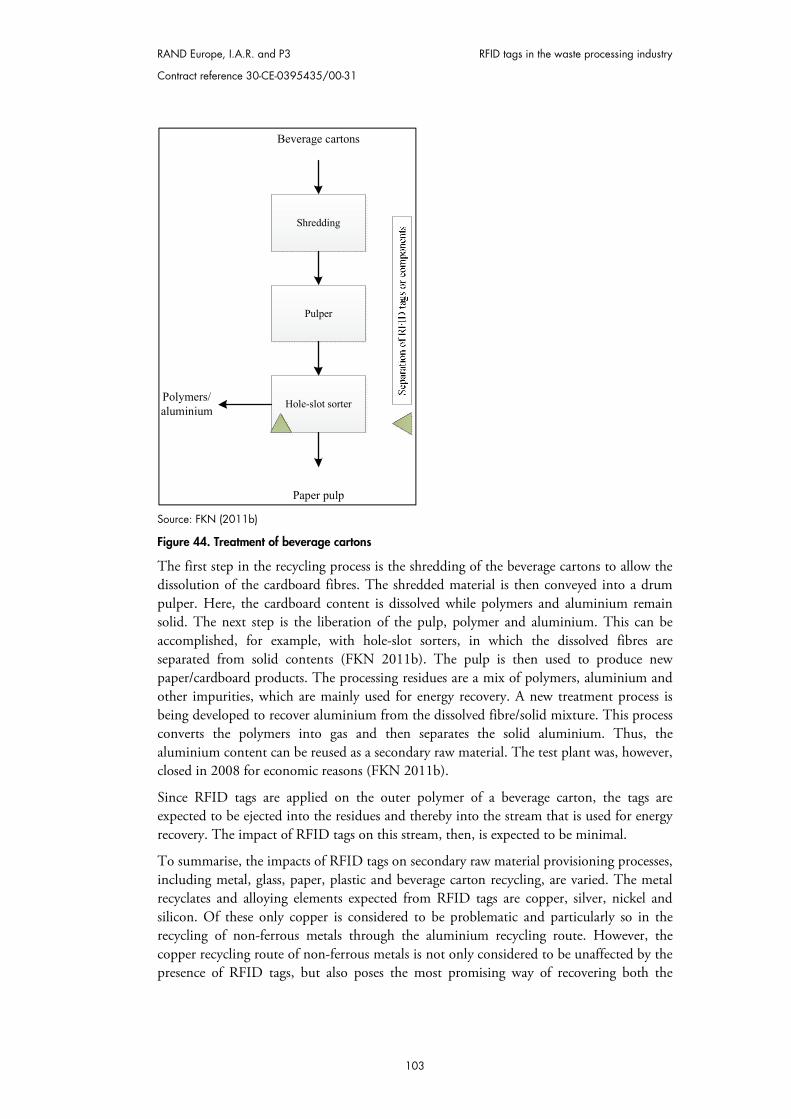
RAND Europe, I.A.R. and P3 RFID tags in the waste processing industry
Contract reference 30-CE-0395435/00-31
103
Source: FKN (2011b)
Figure 44. Treatment of beverage cartons
The first step in the recycling process is the shredding of the beverage cartons to allow the dissolution of the cardboard fibres. The shredded material is then conveyed into a drum pulper. Here, the cardboard content is dissolved while polymers and aluminium remain solid. The next step is the liberation of the pulp, polymer and aluminium. This can be accomplished, for example, with hole-slot sorters, in which the dissolved fibres are separated from solid contents (FKN 2011b). The pulp is then used to produce new paper/cardboard products. The processing residues are a mix of polymers, aluminium and other impurities, which are mainly used for energy recovery. A new treatment process is being developed to recover aluminium from the dissolved fibre/solid mixture. This process converts the polymers into gas and then separates the solid aluminium. Thus, the aluminium content can be reused as a secondary raw material. The test plant was, however, closed in 2008 for economic reasons (FKN 2011b).
Since RFID tags are applied on the outer polymer of a beverage carton, the tags are expected to be ejected into the residues and thereby into the stream that is used for energy recovery. The impact of RFID tags on this stream, then, is expected to be minimal.
To summarise, the impacts of RFID tags on secondary raw material provisioning processes, including metal, glass, paper, plastic and beverage carton recycling, are varied. The metal recyclates and alloying elements expected from RFID tags are copper, silver, nickel and silicon. Of these only copper is considered to be problematic and particularly so in the recycling of non-ferrous metals through the aluminium recycling route. However, the copper recycling route of non-ferrous metals is not only considered to be unaffected by the presence of RFID tags, but also poses the most promising way of recovering both the
Pulper
Shredding
Hole-slot sorter
Paper pulp
Polymers/aluminium
Beverage cartons
SMART TRASH: Study on RFID tags and the recycling industry RAND Europe, I.A.R. and P3
Contract reference 30-CE-0395435/00-31
104
energy content as well as most metals (especially the precious metals) contained in RFID tags.
4.6 Subsidiary purification phase The final EOL phase considered in this analysis is the subsidiary purification phase. This phase includes MRF treatment processes, as well as the dismantling of WEEE and ELVs. Since MRF was already considered earlier due to its similarities with MBT processes, we only consider the impacts of RFID tags on WEEE and ELV dismantling here.
4.6.1 Waste electric and electronic equipment (WEEE) The treatment or disassembly of WEEE appears as part of the EOL subsidiary purification phase (see Figure 23). The treatment of waste generated through the disposal of electric and electronic equipment is subjected to a separate treatment to fulfil the requirements of Directive 2002/96/EC, as amended. Electric and electronic equipment belong to a group of complex objects, which is why the impact of RFID technology is only considered when the separation of dismantled EEE into materials or mixtures destined for recycling, energy recovery or disposal occurs. The recycling targets in the Directive vary, depending on the type of application, between a minimum of 70 percent and 80 percent by an average weight per appliance, and between 50 percent and 75 percent of components, material and substances reuse and recycling by an average weight per appliance.
The dismantling process for EEE is displayed in Figure 45. Dismantling includes manual dismantling and depollution and depends on the types of items that are being treated. After this first step, the comminution aims to liberate the materials with the main mass share, and they are purified for further recycling, energy recovery or disposal.
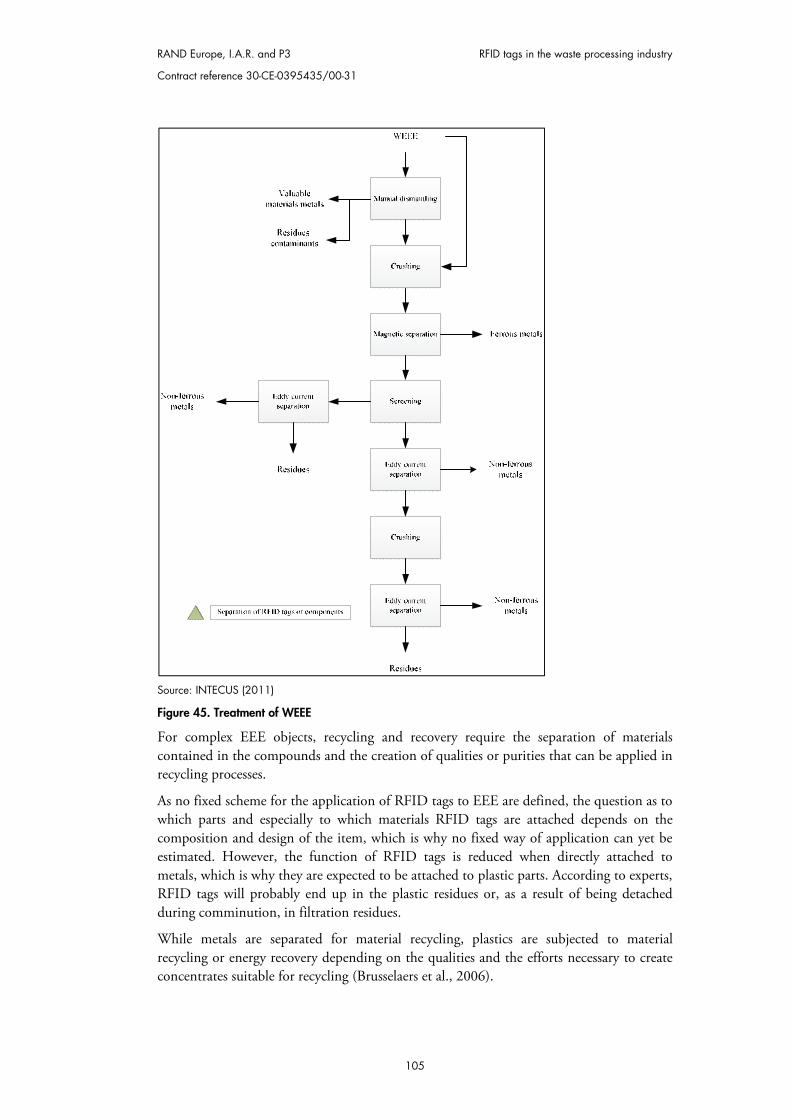
RAND Europe, I.A.R. and P3 RFID tags in the waste processing industry
Contract reference 30-CE-0395435/00-31
105
Source: INTECUS (2011)
Figure 45. Treatment of WEEE
For complex EEE objects, recycling and recovery require the separation of materials contained in the compounds and the creation of qualities or purities that can be applied in recycling processes.
As no fixed scheme for the application of RFID tags to EEE are defined, the question as to which parts and especially to which materials RFID tags are attached depends on the composition and design of the item, which is why no fixed way of application can yet be estimated. However, the function of RFID tags is reduced when directly attached to metals, which is why they are expected to be attached to plastic parts. According to experts, RFID tags will probably end up in the plastic residues or, as a result of being detached during comminution, in filtration residues.
While metals are separated for material recycling, plastics are subjected to material recycling or energy recovery depending on the qualities and the efforts necessary to create concentrates suitable for recycling (Brusselaers et al., 2006).
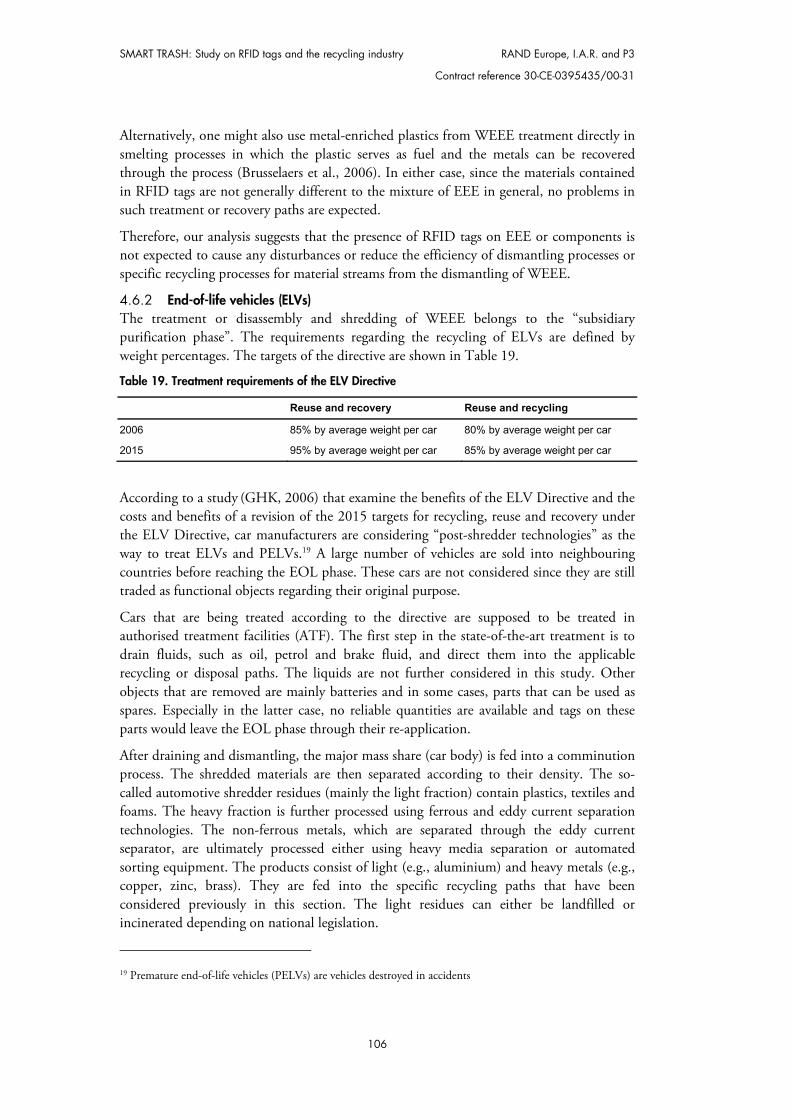
SMART TRASH: Study on RFID tags and the recycling industry RAND Europe, I.A.R. and P3
Contract reference 30-CE-0395435/00-31
106
Alternatively, one might also use metal-enriched plastics from WEEE treatment directly in smelting processes in which the plastic serves as fuel and the metals can be recovered through the process (Brusselaers et al., 2006). In either case, since the materials contained in RFID tags are not generally different to the mixture of EEE in general, no problems in such treatment or recovery paths are expected.
Therefore, our analysis suggests that the presence of RFID tags on EEE or components is not expected to cause any disturbances or reduce the efficiency of dismantling processes or specific recycling processes for material streams from the dismantling of WEEE.
4.6.2 End-of-life vehicles (ELVs) The treatment or disassembly and shredding of WEEE belongs to the “subsidiary purification phase”. The requirements regarding the recycling of ELVs are defined by weight percentages. The targets of the directive are shown in Table 19.
Table 19. Treatment requirements of the ELV Directive
Reuse and recovery Reuse and recycling
2006 85% by average weight per car 80% by average weight per car
2015 95% by average weight per car 85% by average weight per car
According to a study (GHK, 2006) that examine the benefits of the ELV Directive and the costs and benefits of a revision of the 2015 targets for recycling, reuse and recovery under the ELV Directive, car manufacturers are considering “post-shredder technologies” as the way to treat ELVs and PELVs.19 A large number of vehicles are sold into neighbouring countries before reaching the EOL phase. These cars are not considered since they are still traded as functional objects regarding their original purpose.
Cars that are being treated according to the directive are supposed to be treated in authorised treatment facilities (ATF). The first step in the state-of-the-art treatment is to drain fluids, such as oil, petrol and brake fluid, and direct them into the applicable recycling or disposal paths. The liquids are not further considered in this study. Other objects that are removed are mainly batteries and in some cases, parts that can be used as spares. Especially in the latter case, no reliable quantities are available and tags on these parts would leave the EOL phase through their re-application.
After draining and dismantling, the major mass share (car body) is fed into a comminution process. The shredded materials are then separated according to their density. The so-called automotive shredder residues (mainly the light fraction) contain plastics, textiles and foams. The heavy fraction is further processed using ferrous and eddy current separation technologies. The non-ferrous metals, which are separated through the eddy current separator, are ultimately processed either using heavy media separation or automated sorting equipment. The products consist of light (e.g., aluminium) and heavy metals (e.g., copper, zinc, brass). They are fed into the specific recycling paths that have been considered previously in this section. The light residues can either be landfilled or incinerated depending on national legislation.
19 Premature end-of-life vehicles (PELVs) are vehicles destroyed in accidents
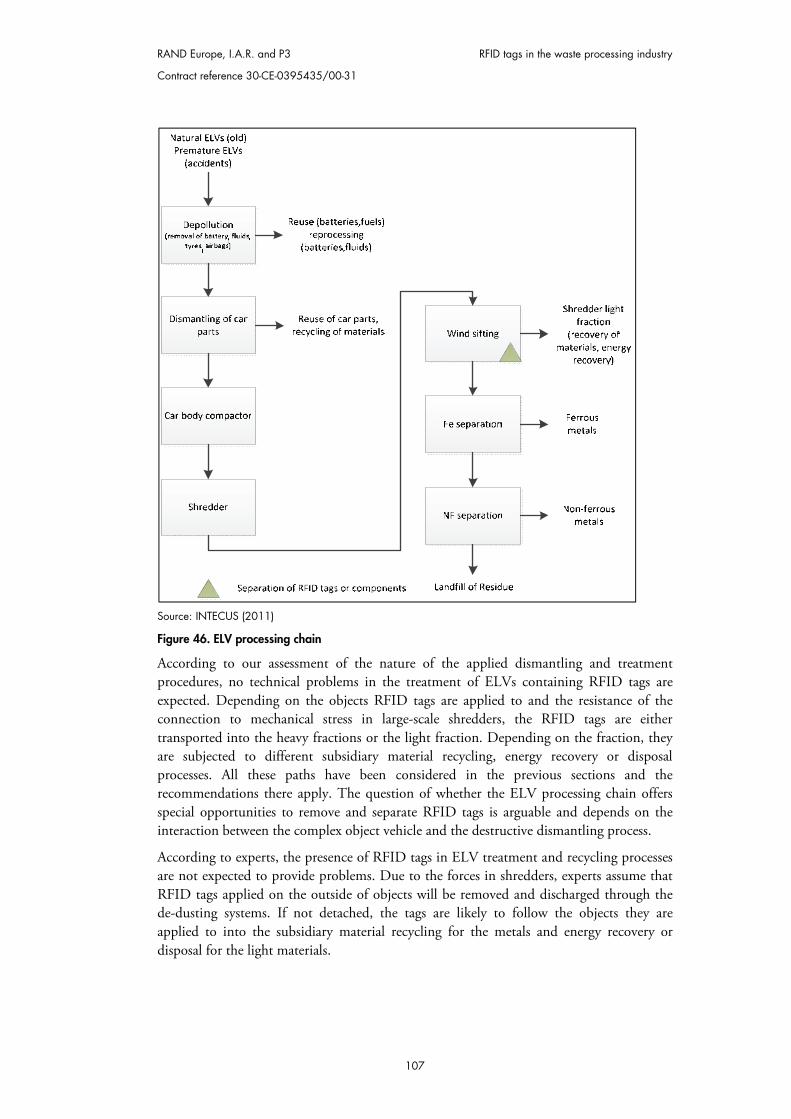
RAND Europe, I.A.R. and P3 RFID tags in the waste processing industry
Contract reference 30-CE-0395435/00-31
107
Source: INTECUS (2011)
Figure 46. ELV processing chain
According to our assessment of the nature of the applied dismantling and treatment procedures, no technical problems in the treatment of ELVs containing RFID tags are expected. Depending on the objects RFID tags are applied to and the resistance of the connection to mechanical stress in large-scale shredders, the RFID tags are either transported into the heavy fractions or the light fraction. Depending on the fraction, they are subjected to different subsidiary material recycling, energy recovery or disposal processes. All these paths have been considered in the previous sections and the recommendations there apply. The question of whether the ELV processing chain offers special opportunities to remove and separate RFID tags is arguable and depends on the interaction between the complex object vehicle and the destructive dismantling process.
According to experts, the presence of RFID tags in ELV treatment and recycling processes are not expected to provide problems. Due to the forces in shredders, experts assume that RFID tags applied on the outside of objects will be removed and discharged through the de-dusting systems. If not detached, the tags are likely to follow the objects they are applied to into the subsidiary material recycling for the metals and energy recovery or disposal for the light materials.
SMART TRASH: Study on RFID tags and the recycling industry RAND Europe, I.A.R. and P3
Contract reference 30-CE-0395435/00-31
108
The interactions between the material and the processes do not allow assumptions as to where RFID tags will accumulate in the process. The important point is that no negative technical impacts on the draining, dismantling and the shredder process are expected through the presence of RFID tags.
The impacts of RFID tags in the treatment of complex objects (exemplified by WEEE and ELVs) can be summarised as follows. The fact that complex objects are either subjected to dismantling and recycling of dismantled and separated material groups, shifts possible impacts into the “recycling phase” (e.g., metal from ELVs or WEEE into metal recycling [see Section 4.5.14.5.1]). The dismantling processes are designed not to suffer from the presence of RFID tags. Due to the size of the tags, a controlled detachment is not expected by experts, which is why the RFID tags either go into residual streams or follow the materials they are applied to into the respective treatment paths.
RAND Europe, I.A.R. and P3 Contract reference 30-CE-0395435/00-31
109
CHAPTER 5 Conclusions on the impacts on waste treatment technologies and implications for national waste systems
Chapter 5 summarises the findings from a combination of the clustering of Member States into different levels of compliance with EU waste management targets, and the technical considerations of possible impacts through RFID tags in different waste treatment paths, particularly the EOL phases not considered under the Waste Framework Directive. The overall findings from the German study (Erdmann et al., 2009) are generally verified by this approach. The important difference between this study and the German one is that the scope has been broadened to EU level and considers differences in waste management in the different Member States.
The reason that RFID tags are considered controversial is that they are integrated into a wide range of applications (and products). At the same time, the allocation of materials into recycling streams is decided according to material (paper, glass, plastic), possible treatment (biodegradable), complexity and hazardousness. Hence, the different components of RFID tags find their way into different waste treatment paths. The question being considered here is whether specific impacts from RFID tags in waste streams can be expected, and if so, in what ways. In order to answer this question, the impacts on the range of technical implications for waste treatment in the Member States are used as a basis for comparison. Depending on the waste management systems in each Member State, different ways of treating waste are applied. The level to which a country is affected depends on the combination of quantities
This chapter summarises the analysis conducted in Part A of the study. It outlines technical, environmental, economic and policy-relevant impacts of
RFID as inert objects. The distribution of RFID tags into waste treatment paths is modelled for one
country per cluster. Recommendations to support the sustainable future application of RFID
technology are given and research potential is outlined.
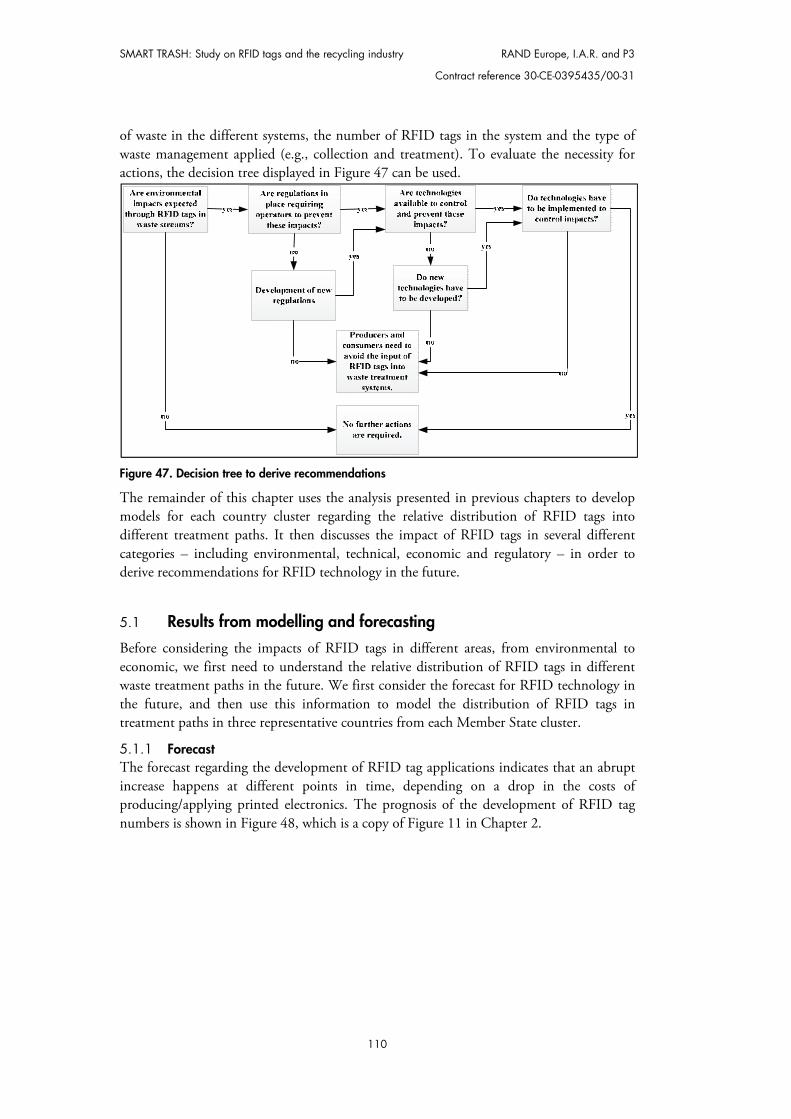
SMART TRASH: Study on RFID tags and the recycling industry RAND Europe, I.A.R. and P3
Contract reference 30-CE-0395435/00-31
110
of waste in the different systems, the number of RFID tags in the system and the type of waste management applied (e.g., collection and treatment). To evaluate the necessity for actions, the decision tree displayed in Figure 47 can be used.
Figure 47. Decision tree to derive recommendations
The remainder of this chapter uses the analysis presented in previous chapters to develop models for each country cluster regarding the relative distribution of RFID tags into different treatment paths. It then discusses the impact of RFID tags in several different categories – including environmental, technical, economic and regulatory – in order to derive recommendations for RFID technology in the future.
5.1 Results from modelling and forecasting
Before considering the impacts of RFID tags in different areas, from environmental to economic, we first need to understand the relative distribution of RFID tags in different waste treatment paths in the future. We first consider the forecast for RFID technology in the future, and then use this information to model the distribution of RFID tags in treatment paths in three representative countries from each Member State cluster.
5.1.1 Forecast The forecast regarding the development of RFID tag applications indicates that an abrupt increase happens at different points in time, depending on a drop in the costs of producing/applying printed electronics. The prognosis of the development of RFID tag numbers is shown in Figure 48, which is a copy of Figure 11 in Chapter 2.
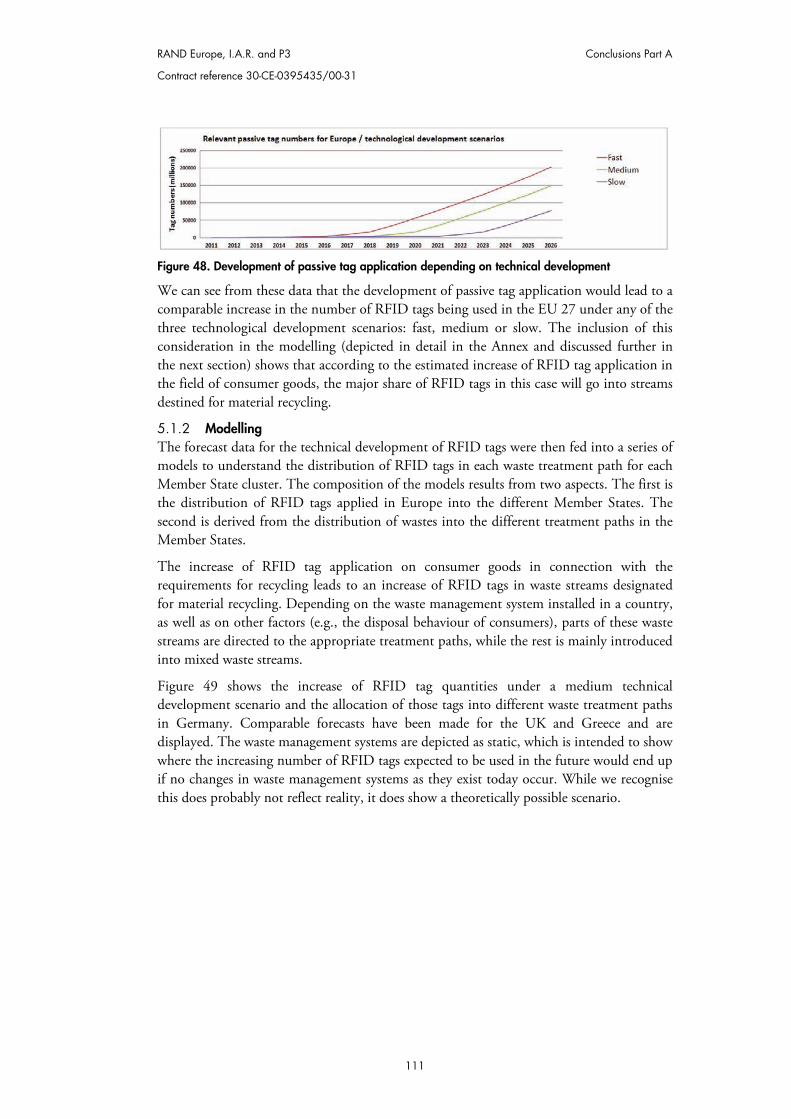
RAND Europe, I.A.R. and P3 Conclusions Part A
Contract reference 30-CE-0395435/00-31
111
Figure 48. Development of passive tag application depending on technical development
We can see from these data that the development of passive tag application would lead to a comparable increase in the number of RFID tags being used in the EU 27 under any of the three technological development scenarios: fast, medium or slow. The inclusion of this consideration in the modelling (depicted in detail in the Annex and discussed further in the next section) shows that according to the estimated increase of RFID tag application in the field of consumer goods, the major share of RFID tags in this case will go into streams destined for material recycling.
5.1.2 Modelling The forecast data for the technical development of RFID tags were then fed into a series of models to understand the distribution of RFID tags in each waste treatment path for each Member State cluster. The composition of the models results from two aspects. The first is the distribution of RFID tags applied in Europe into the different Member States. The second is derived from the distribution of wastes into the different treatment paths in the Member States.
The increase of RFID tag application on consumer goods in connection with the requirements for recycling leads to an increase of RFID tags in waste streams designated for material recycling. Depending on the waste management system installed in a country, as well as on other factors (e.g., the disposal behaviour of consumers), parts of these waste streams are directed to the appropriate treatment paths, while the rest is mainly introduced into mixed waste streams.
Figure 49 shows the increase of RFID tag quantities under a medium technical development scenario and the allocation of those tags into different waste treatment paths in Germany. Comparable forecasts have been made for the UK and Greece and are displayed. The waste management systems are depicted as static, which is intended to show where the increasing number of RFID tags expected to be used in the future would end up if no changes in waste management systems as they exist today occur. While we recognise this does probably not reflect reality, it does show a theoretically possible scenario.
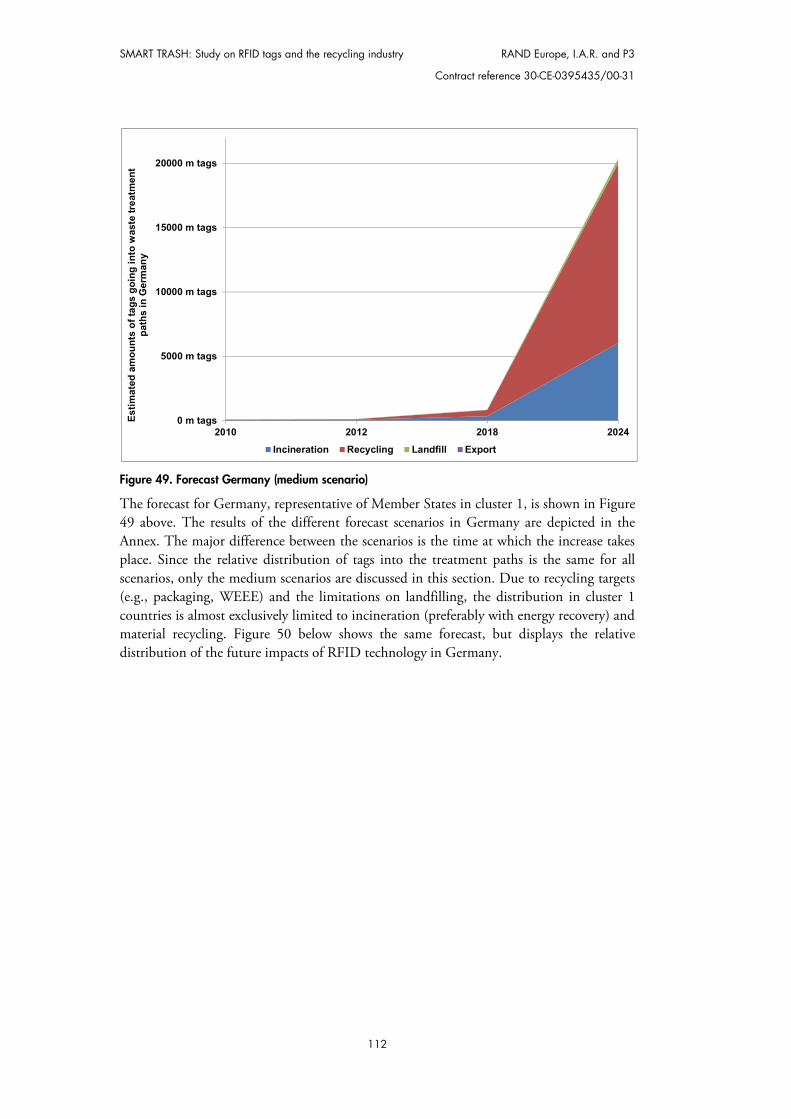
SMART TRASH: Study on RFID tags and the recycling industry RAND Europe, I.A.R. and P3
Contract reference 30-CE-0395435/00-31
112
Figure 49. Forecast Germany (medium scenario)
The forecast for Germany, representative of Member States in cluster 1, is shown in Figure 49 above. The results of the different forecast scenarios in Germany are depicted in the Annex. The major difference between the scenarios is the time at which the increase takes place. Since the relative distribution of tags into the treatment paths is the same for all scenarios, only the medium scenarios are discussed in this section. Due to recycling targets (e.g., packaging, WEEE) and the limitations on landfilling, the distribution in cluster 1 countries is almost exclusively limited to incineration (preferably with energy recovery) and material recycling. Figure 50 below shows the same forecast, but displays the relative distribution of the future impacts of RFID technology in Germany.
0 m tags
5000 m tags
10000 m tags
15000 m tags
20000 m tags
2010 2012 2018 2024
Estim
ated
am
ount
s of
tags
goi
ng in
to w
aste
trea
tmen
t pa
ths
in G
erm
any
Incineration Recycling Landfill Export
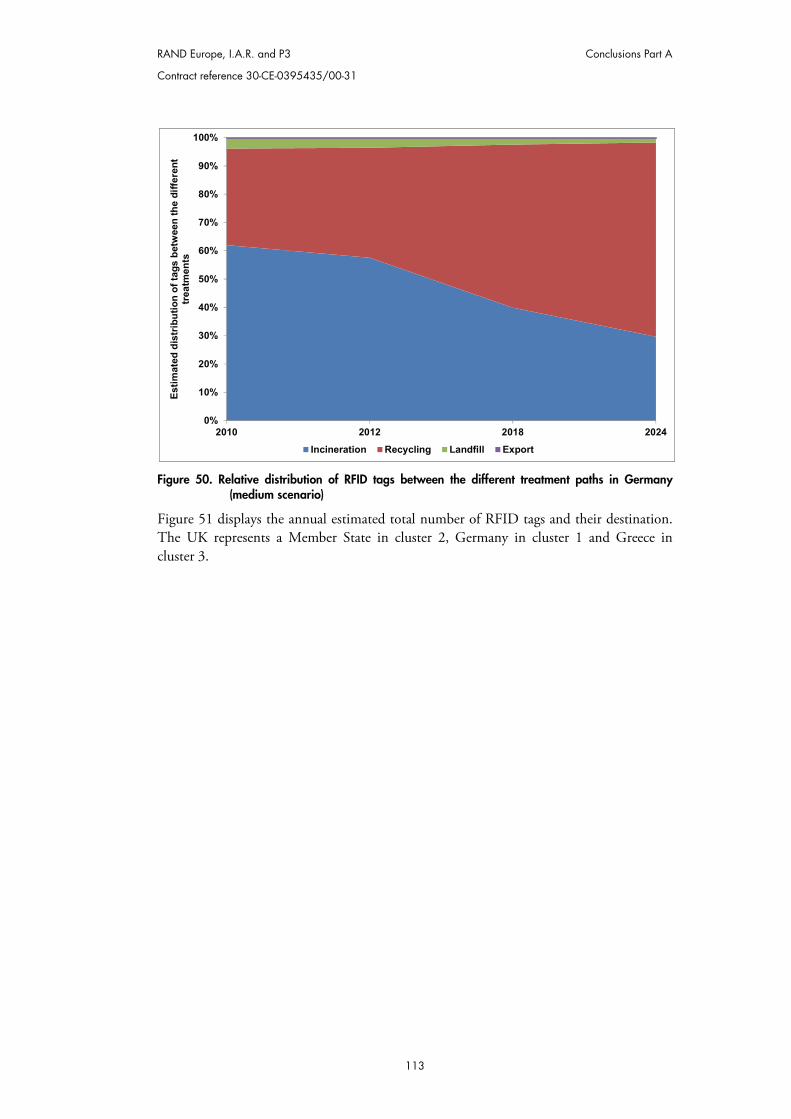
RAND Europe, I.A.R. and P3 Conclusions Part A
Contract reference 30-CE-0395435/00-31
113
Figure 50. Relative distribution of RFID tags between the different treatment paths in Germany
(medium scenario)
Figure 51 displays the annual estimated total number of RFID tags and their destination. The UK represents a Member State in cluster 2, Germany in cluster 1 and Greece in cluster 3.
0%
10%
20%
30%
40%
50%
60%
70%
80%
90%
100%
2010 2012 2018 2024
Estim
ated
dis
trib
utio
n of
tags
bet
wee
n th
e di
ffere
nt
trea
tmen
ts
Incineration Recycling Landfill Export
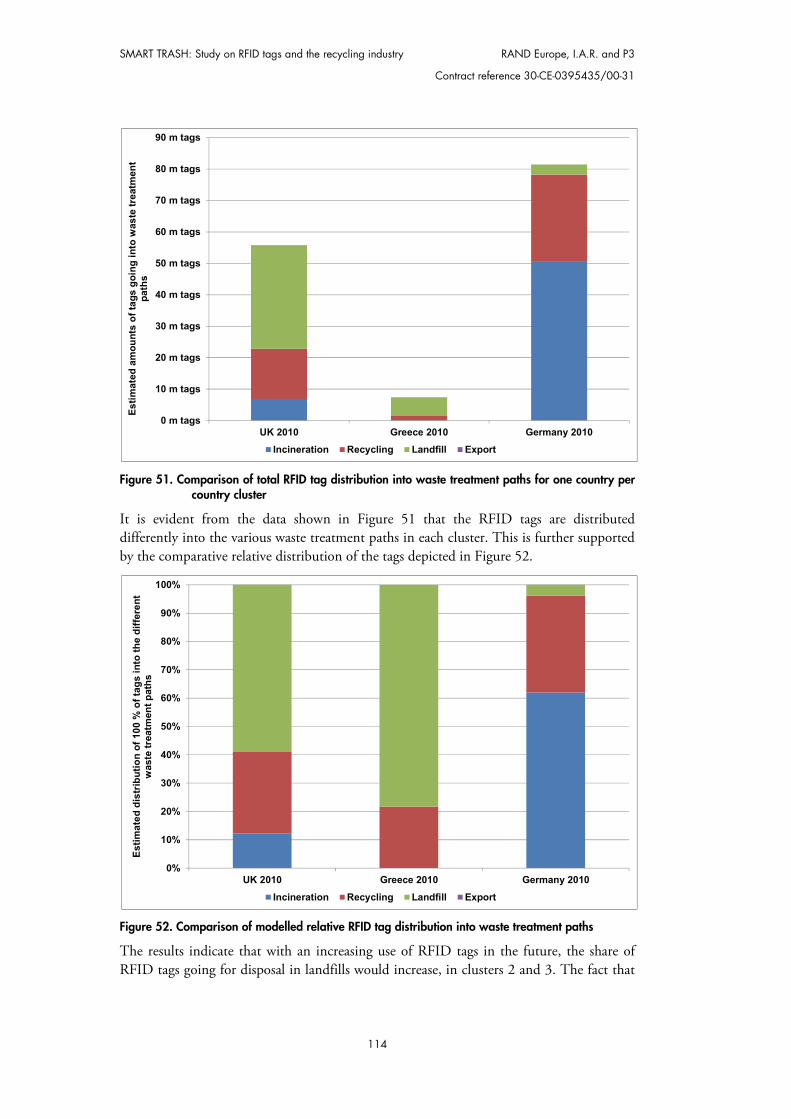
SMART TRASH: Study on RFID tags and the recycling industry RAND Europe, I.A.R. and P3
Contract reference 30-CE-0395435/00-31
114
Figure 51. Comparison of total RFID tag distribution into waste treatment paths for one country per
country cluster
It is evident from the data shown in Figure 51 that the RFID tags are distributed differently into the various waste treatment paths in each cluster. This is further supported by the comparative relative distribution of the tags depicted in Figure 52.
Figure 52. Comparison of modelled relative RFID tag distribution into waste treatment paths
The results indicate that with an increasing use of RFID tags in the future, the share of RFID tags going for disposal in landfills would increase, in clusters 2 and 3. The fact that
0 m tags
10 m tags
20 m tags
30 m tags
40 m tags
50 m tags
60 m tags
70 m tags
80 m tags
90 m tags
UK 2010 Greece 2010 Germany 2010
Estim
ated
am
ount
s of
tags
goi
ng in
to w
aste
trea
tmen
t pa
ths
Incineration Recycling Landfill Export
0%
10%
20%
30%
40%
50%
60%
70%
80%
90%
100%
UK 2010 Greece 2010 Germany 2010
Estim
ated
dis
trib
utio
n of
100
% o
f tag
s in
to th
e di
ffere
nt
was
te tr
eatm
ent p
aths
Incineration Recycling Landfill Export
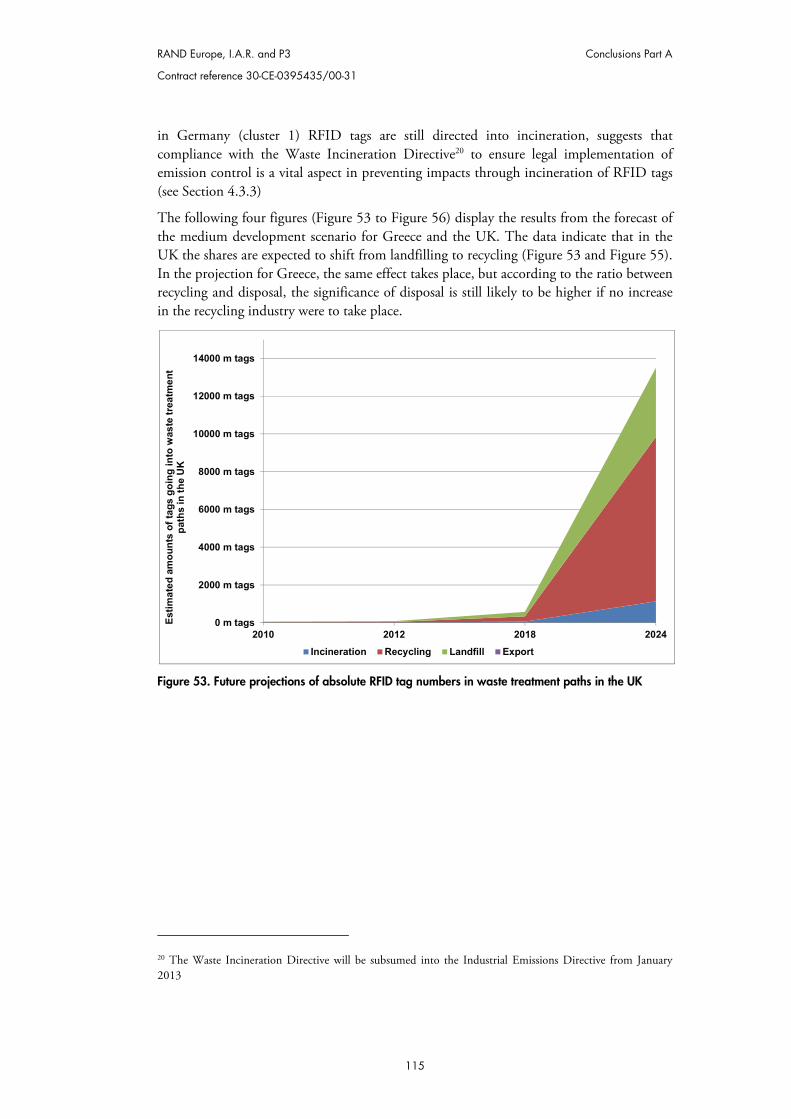
RAND Europe, I.A.R. and P3 Conclusions Part A
Contract reference 30-CE-0395435/00-31
115
in Germany (cluster 1) RFID tags are still directed into incineration, suggests that compliance with the Waste Incineration Directive20 to ensure legal implementation of emission control is a vital aspect in preventing impacts through incineration of RFID tags (see Section 4.3.3)
The following four figures (Figure 53 to Figure 56) display the results from the forecast of the medium development scenario for Greece and the UK. The data indicate that in the UK the shares are expected to shift from landfilling to recycling (Figure 53 and Figure 55). In the projection for Greece, the same effect takes place, but according to the ratio between recycling and disposal, the significance of disposal is still likely to be higher if no increase in the recycling industry were to take place.
Figure 53. Future projections of absolute RFID tag numbers in waste treatment paths in the UK
20 The Waste Incineration Directive will be subsumed into the Industrial Emissions Directive from January 2013
0 m tags
2000 m tags
4000 m tags
6000 m tags
8000 m tags
10000 m tags
12000 m tags
14000 m tags
2010 2012 2018 2024
Estim
ated
am
ount
s of
tags
goi
ng in
to w
aste
trea
tmen
t pa
ths
in th
e U
K
Incineration Recycling Landfill Export
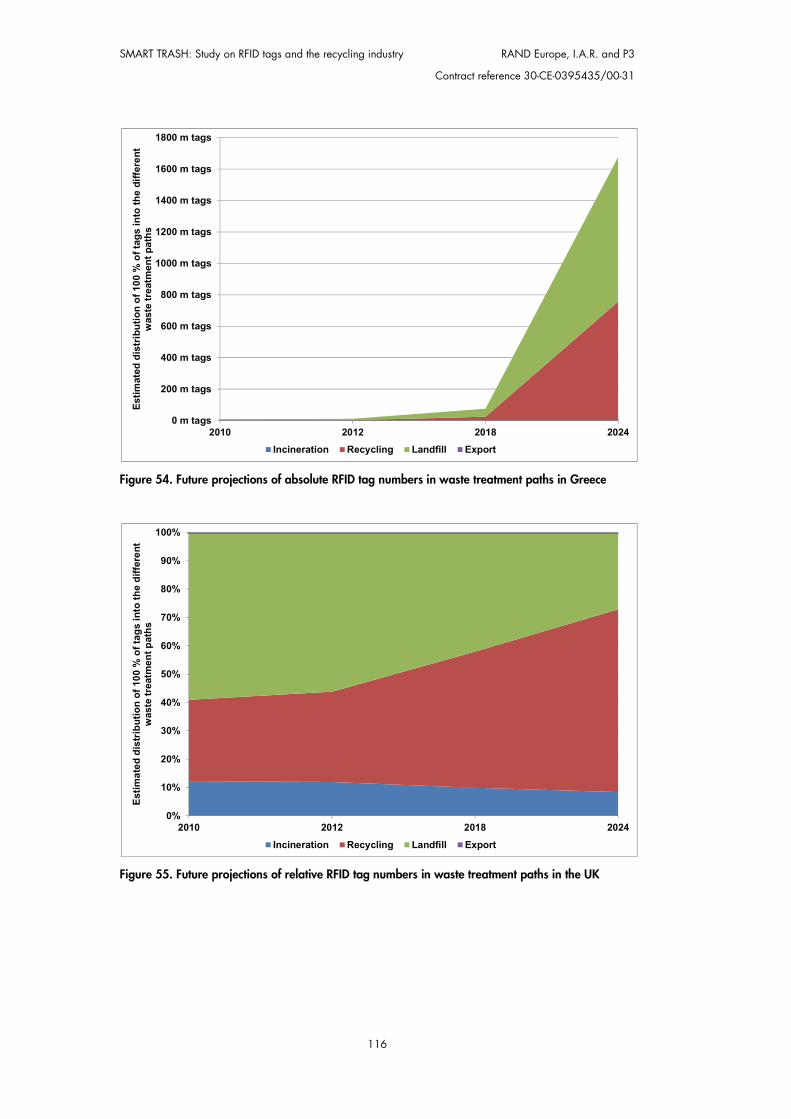
SMART TRASH: Study on RFID tags and the recycling industry RAND Europe, I.A.R. and P3
Contract reference 30-CE-0395435/00-31
116
Figure 54. Future projections of absolute RFID tag numbers in waste treatment paths in Greece
Figure 55. Future projections of relative RFID tag numbers in waste treatment paths in the UK
0 m tags
200 m tags
400 m tags
600 m tags
800 m tags
1000 m tags
1200 m tags
1400 m tags
1600 m tags
1800 m tags
2010 2012 2018 2024
Estim
ated
dis
trib
utio
n of
100
% o
f tag
s in
to th
e di
ffere
nt
was
te tr
eatm
ent p
aths
Incineration Recycling Landfill Export
0%
10%
20%
30%
40%
50%
60%
70%
80%
90%
100%
2010 2012 2018 2024
Estim
ated
dis
trib
utio
n of
100
% o
f tag
s in
to th
e di
ffere
nt
was
te tr
eatm
ent p
aths
Incineration Recycling Landfill Export
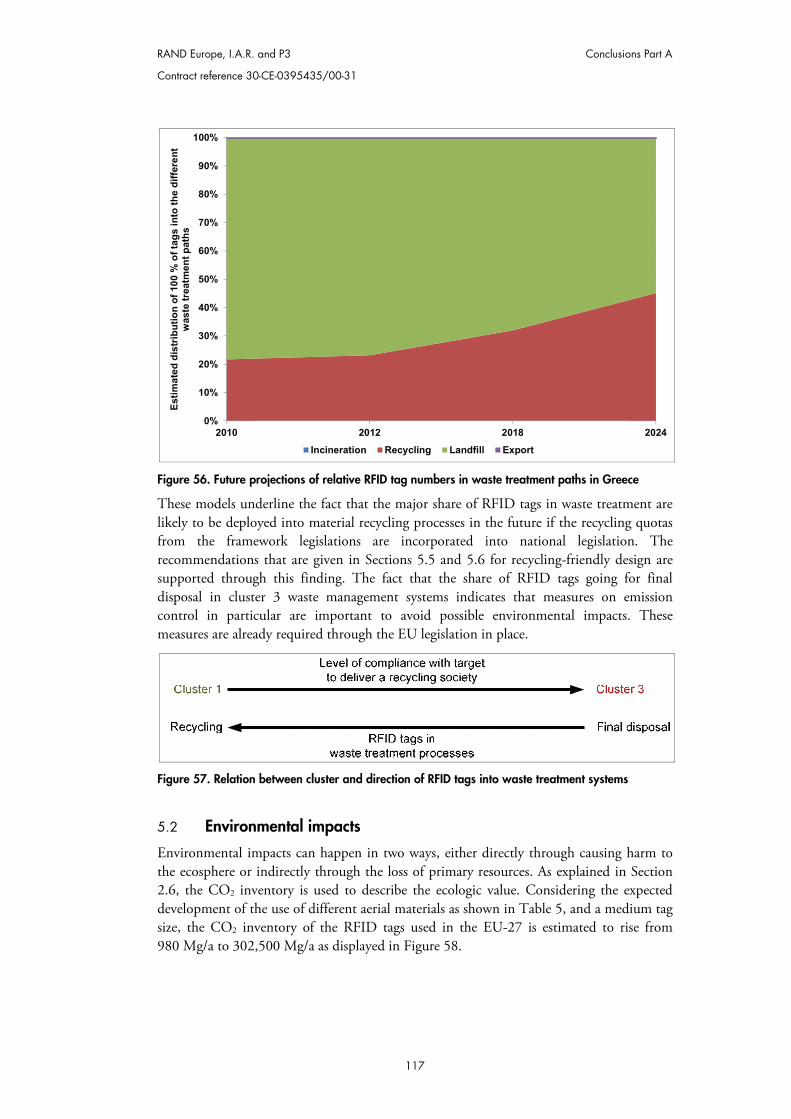
RAND Europe, I.A.R. and P3 Conclusions Part A
Contract reference 30-CE-0395435/00-31
117
Figure 56. Future projections of relative RFID tag numbers in waste treatment paths in Greece
These models underline the fact that the major share of RFID tags in waste treatment are likely to be deployed into material recycling processes in the future if the recycling quotas from the framework legislations are incorporated into national legislation. The recommendations that are given in Sections 5.5 and 5.6 for recycling-friendly design are supported through this finding. The fact that the share of RFID tags going for final disposal in cluster 3 waste management systems indicates that measures on emission control in particular are important to avoid possible environmental impacts. These measures are already required through the EU legislation in place.
Figure 57. Relation between cluster and direction of RFID tags into waste treatment systems
5.2 Environmental impacts
Environmental impacts can happen in two ways, either directly through causing harm to the ecosphere or indirectly through the loss of primary resources. As explained in Section 2.6, the CO2 inventory is used to describe the ecologic value. Considering the expected development of the use of different aerial materials as shown in Table 5, and a medium tag size, the CO2 inventory of the RFID tags used in the EU-27 is estimated to rise from 980 Mg/a to 302,500 Mg/a as displayed in Figure 58.
0%
10%
20%
30%
40%
50%
60%
70%
80%
90%
100%
2010 2012 2018 2024
Estim
ated
dis
trib
utio
n of
100
% o
f tag
s in
to th
e di
ffere
nt
was
te tr
eatm
ent p
aths
Incineration Recycling Landfill Export
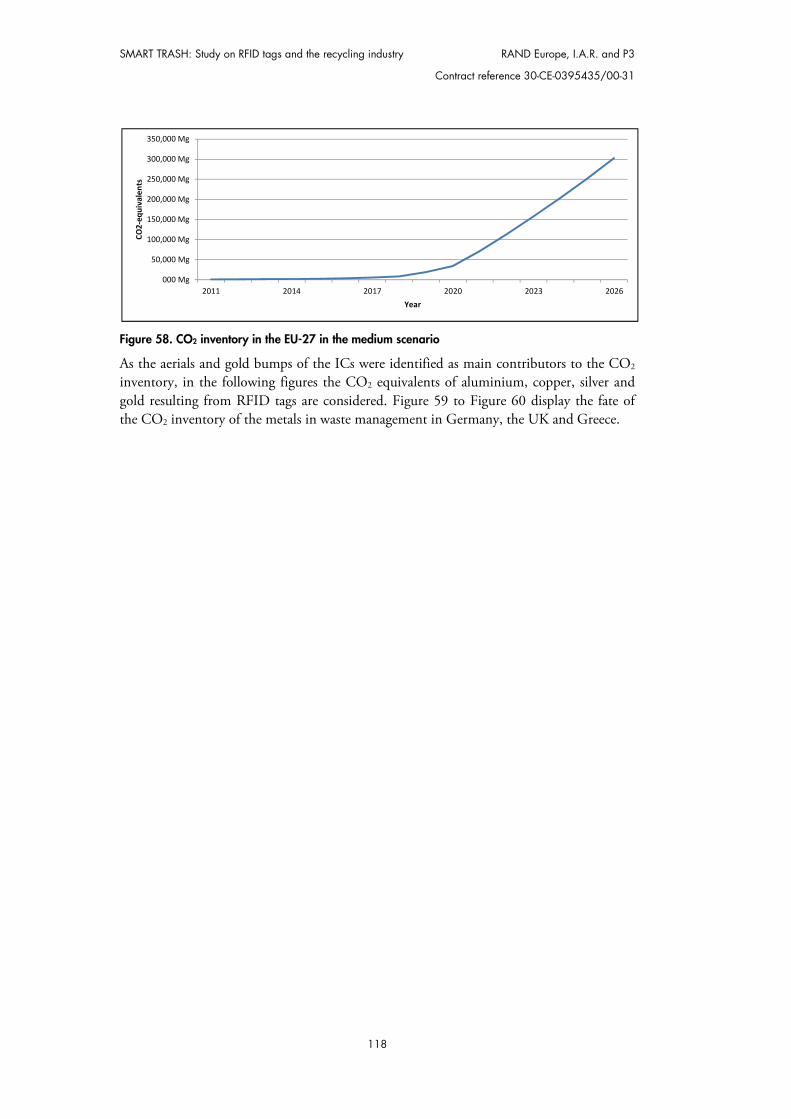
SMART TRASH: Study on RFID tags and the recycling industry RAND Europe, I.A.R. and P3
Contract reference 30-CE-0395435/00-31
118
Figure 58. CO2 inventory in the EU-27 in the medium scenario
As the aerials and gold bumps of the ICs were identified as main contributors to the CO2 inventory, in the following figures the CO2 equivalents of aluminium, copper, silver and gold resulting from RFID tags are considered. Figure 59 to Figure 60 display the fate of the CO2 inventory of the metals in waste management in Germany, the UK and Greece.
000 Mg
50,000 Mg
100,000 Mg
150,000 Mg
200,000 Mg
250,000 Mg
300,000 Mg
350,000 Mg
2011 2014 2017 2020 2023 2026
CO2-
equi
vale
nts
Year
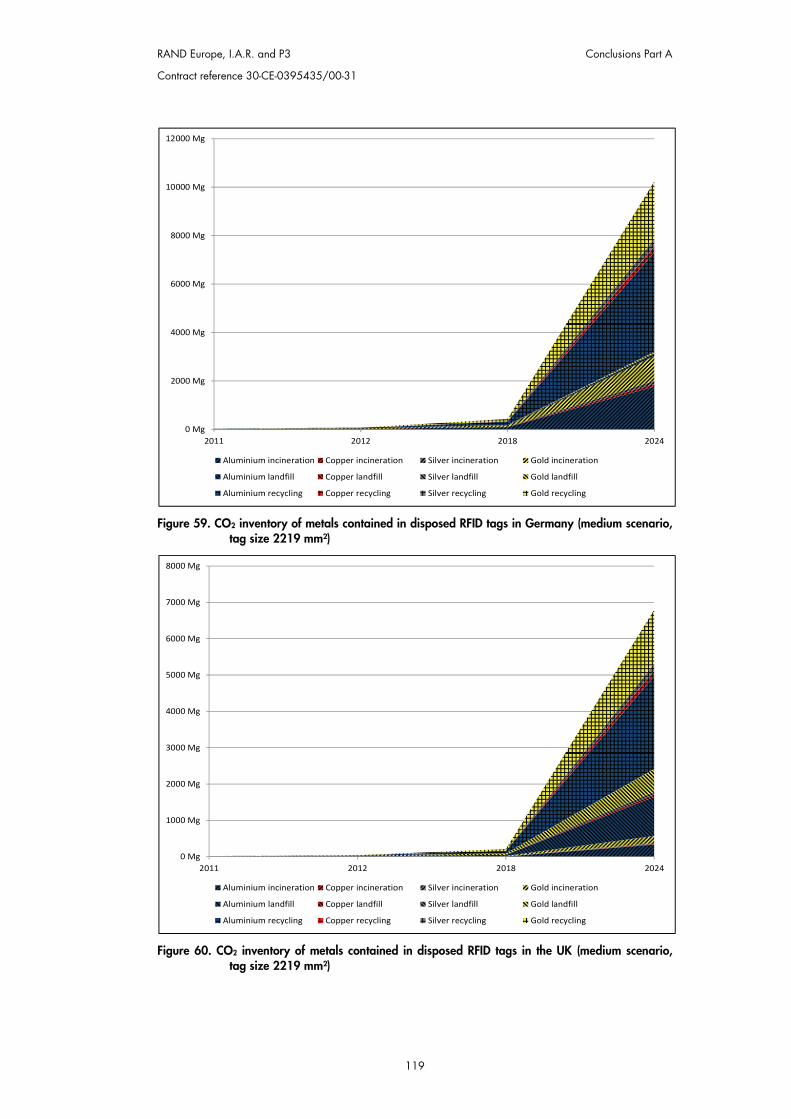
RAND Europe, I.A.R. and P3 Conclusions Part A
Contract reference 30-CE-0395435/00-31
119
Figure 59. CO2 inventory of metals contained in disposed RFID tags in Germany (medium scenario,
tag size 2219 mm²)
Figure 60. CO2 inventory of metals contained in disposed RFID tags in the UK (medium scenario,
tag size 2219 mm²)
0 Mg
2000 Mg
4000 Mg
6000 Mg
8000 Mg
10000 Mg
12000 Mg
2011 2012 2018 2024
Aluminium incineration Copper incineration Silver incineration Gold incineration
Aluminium landfill Copper landfill Silver landfill Gold landfill
Aluminium recycling Copper recycling Silver recycling Gold recycling
0 Mg
1000 Mg
2000 Mg
3000 Mg
4000 Mg
5000 Mg
6000 Mg
7000 Mg
8000 Mg
2011 2012 2018 2024
Aluminium incineration Copper incineration Silver incineration Gold incineration
Aluminium landfill Copper landfill Silver landfill Gold landfill
Aluminium recycling Copper recycling Silver recycling Gold recycling
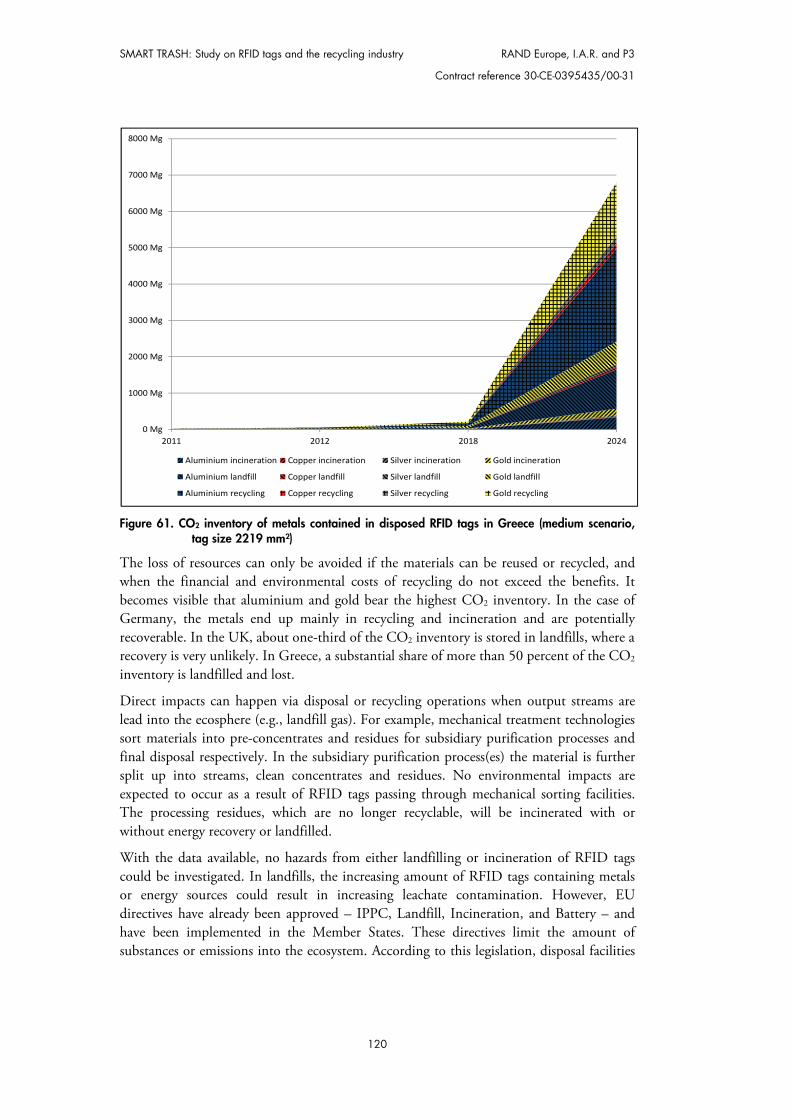
SMART TRASH: Study on RFID tags and the recycling industry RAND Europe, I.A.R. and P3
Contract reference 30-CE-0395435/00-31
120
Figure 61. CO2 inventory of metals contained in disposed RFID tags in Greece (medium scenario,
tag size 2219 mm²)
The loss of resources can only be avoided if the materials can be reused or recycled, and when the financial and environmental costs of recycling do not exceed the benefits. It becomes visible that aluminium and gold bear the highest CO2 inventory. In the case of Germany, the metals end up mainly in recycling and incineration and are potentially recoverable. In the UK, about one-third of the CO2 inventory is stored in landfills, where a recovery is very unlikely. In Greece, a substantial share of more than 50 percent of the CO2 inventory is landfilled and lost.
Direct impacts can happen via disposal or recycling operations when output streams are lead into the ecosphere (e.g., landfill gas). For example, mechanical treatment technologies sort materials into pre-concentrates and residues for subsidiary purification processes and final disposal respectively. In the subsidiary purification process(es) the material is further split up into streams, clean concentrates and residues. No environmental impacts are expected to occur as a result of RFID tags passing through mechanical sorting facilities. The processing residues, which are no longer recyclable, will be incinerated with or without energy recovery or landfilled.
With the data available, no hazards from either landfilling or incineration of RFID tags could be investigated. In landfills, the increasing amount of RFID tags containing metals or energy sources could result in increasing leachate contamination. However, EU directives have already been approved – IPPC, Landfill, Incineration, and Battery – and have been implemented in the Member States. These directives limit the amount of substances or emissions into the ecosystem. According to this legislation, disposal facilities
0 Mg
1000 Mg
2000 Mg
3000 Mg
4000 Mg
5000 Mg
6000 Mg
7000 Mg
8000 Mg
2011 2012 2018 2024
Aluminium incineration Copper incineration Silver incineration Gold incineration
Aluminium landfill Copper landfill Silver landfill Gold landfill
Aluminium recycling Copper recycling Silver recycling Gold recycling
RAND Europe, I.A.R. and P3 Conclusions Part A
Contract reference 30-CE-0395435/00-31
121
need to comply with emission limits, which are achieved through emission control systems. These technical installations should be adapted to the type of waste received.
This leaves two scenarios to consider. The first is that emissions from RFID tags cannot be controlled by the emission control systems. The composition of RFID tags does not indicate that this could happen. The second scenario is that the presence of certain materials or substances increases the operational costs for emission control systems. According to experts, this is considered unlikely.
With regards to the impact of RFID tags containing batteries, it is not yet known whether active or semi-active RFID tags will be disposed of with used batteries. To increase the recycling of batteries, Member States are obliged to take all available measures to enforce the separate collection of batteries and accumulators and prevent their disposal with mixed municipal solid waste streams. As the composition and design of large-scale applications of active and semi-active RFID tags cannot be accurately forecasted, the impacts can only be measured in terms of quality, not quantity.
In general, the emission of heavy metals through means of final disposal has to be controlled according to EU legislation. It is possible that the large-scale application of active or semi-active RFID tags could result in an overcharge of the control systems if batteries incorporated in RFID tags are considered outside the scope of the Battery Directive. Quantification of this can only be carried out when the design of active or semi-active RFID tags and the applicable energy sources can be produced for prices that qualify for mass applications, and where the design and the applied materials are known. According to experts, at this point in time new batteries are under development, which could perhaps be disposed of with other wastes without harming the environment.
5.3 Technical impacts
The first step after waste generation, wwaste collection and transport, is not expected to be subject to any impacts through the presence of RFID tags in waste streams. However, the presence of RFID tags could lead to disturbances in RFID-supported waste logistic schemes. This has not yet been verified, but no interference has been observed in pilot projects.
Technical impacts on ffinal disposal and treatment prior to final disposal (landfills, incinerators) are in general unlikely due to the fact that these installations (if operated according to EU legislation) are designed to be able to process the components introduced through passive RFID tags. One aspect to consider, though, is that an increase of copper and aluminium could impact either on the composition of bottom ashes or the residues from the flue gas treatment in incineration processes.
No technical impacts were estimated for the technologies applied to mixed material streams into different subsidiary recycling or disposal paths. These technologies can be divided into two main groups:
MBT – mechanical-biological treatment MRF – materials recovery facility
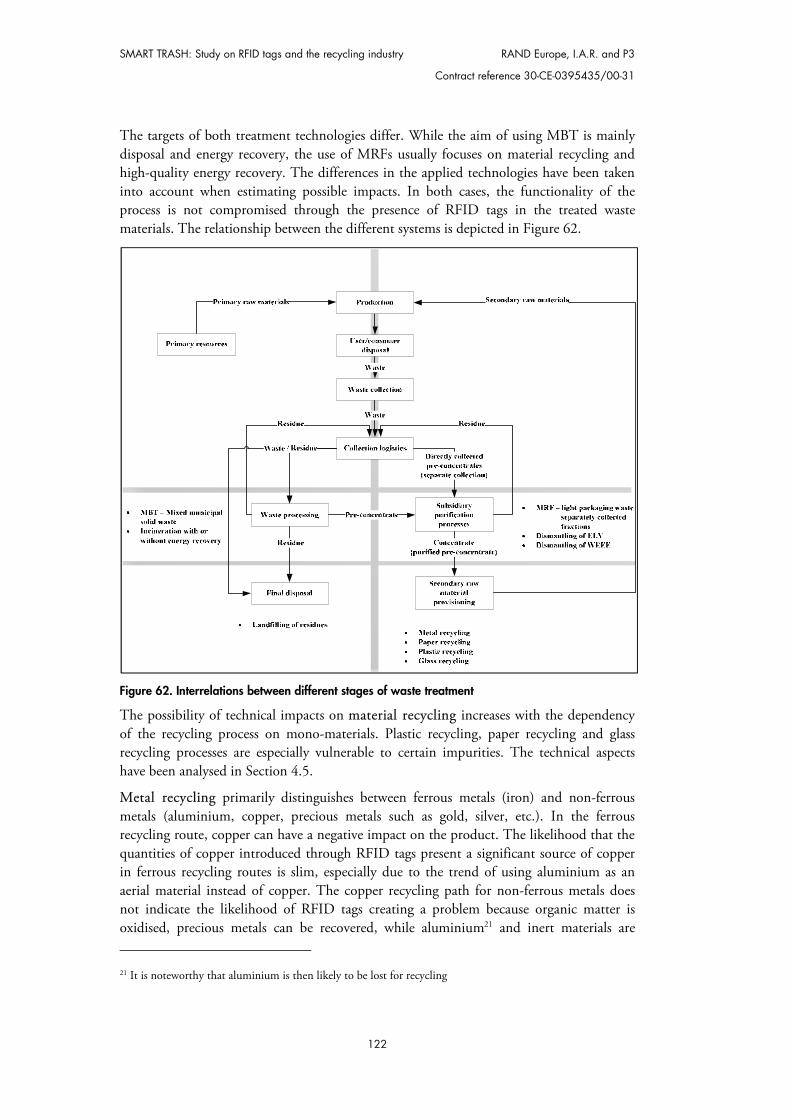
SMART TRASH: Study on RFID tags and the recycling industry RAND Europe, I.A.R. and P3
Contract reference 30-CE-0395435/00-31
122
The targets of both treatment technologies differ. While the aim of using MBT is mainly disposal and energy recovery, the use of MRFs usually focuses on material recycling and high-quality energy recovery. The differences in the applied technologies have been taken into account when estimating possible impacts. In both cases, the functionality of the process is not compromised through the presence of RFID tags in the treated waste materials. The relationship between the different systems is depicted in Figure 62.
Figure 62. Interrelations between different stages of waste treatment
The possibility of technical impacts on mmaterial recycling increases with the dependency of the recycling process on mono-materials. Plastic recycling, paper recycling and glass recycling processes are especially vulnerable to certain impurities. The technical aspects have been analysed in Section 4.5.
Metal recycling primarily distinguishes between ferrous metals (iron) and non-ferrous metals (aluminium, copper, precious metals such as gold, silver, etc.). In the ferrous recycling route, copper can have a negative impact on the product. The likelihood that the quantities of copper introduced through RFID tags present a significant source of copper in ferrous recycling routes is slim, especially due to the trend of using aluminium as an aerial material instead of copper. The copper recycling path for non-ferrous metals does not indicate the likelihood of RFID tags creating a problem because organic matter is oxidised, precious metals can be recovered, while aluminium21 and inert materials are 21 It is noteworthy that aluminium is then likely to be lost for recycling
RAND Europe, I.A.R. and P3 Conclusions Part A
Contract reference 30-CE-0395435/00-31
123
converted into slag and are lost. In the aluminium route, copper goes into the alloy and cannot be removed, which could result in an undesired increase in copper content in the aluminium product. Therefore, the use of RFID tags with a copper aerial on ferrous metal and aluminium products should be avoided.
In pplastic recycling, the purity of the plastic material is a precondition to ensure the functionality of the final step in the recycling process and the quality of the product that is comparable to primary materials. According to the plastic recyclers, the recycling processes require applications to be removed as easily as possible in the recycling process. One problem with labels in general arises from the adhesives used to connect a label with an object. The adhesives can cause blockages in filtration or extrusion processes. Therefore, the solubility of the adhesives should be appropriate for the process and RFID tags need to be applied according to the needs of the recycling processes.
Two major requirements can help to reduce or avoid technical impacts:
RFID tags should be applied in a way that allows detachment. Adhesives applied should be suitable for the material recycling processes.
Paper recycling is different from plastic recycling, since paper is dissolved in a solution and all non-soluble objects can be separated. Problems in paper recycling processes can be generally be attributed to adhesives, which can compromise the quality of the product or cause blockages in the recycling process and reduce the efficiency of filtration systems. The possibility of printing RFID tags instead of application with adhesives needs to be aligned with the fact that not all types of paper are subject to treatment in de-inking processes.
Three major requirements can help to reduce or avoid technical impacts:
In order to facilitate the separation, RFID tags should not dissolve with the paper. Applications with adhesives should be suitable for the recycling process and
designed to reduce the generation of “stickies”. Printed electronics incorporated into inks need to be suitable for de-inking
processes and should not be applied to papers that will not be treated with de-inking processes.
In gglass recycling the main pollutants are the inert components such as metals and chips. With increasing quantities and the inability to separate RFID tags or glass cullets with tags from the pure cullets destined for the smelting (recycling) process, the possibility of inclusions in the final product increases. The melted glass leaves the melting bath in the form of a stream via the bottom of the container/vessel. The opening in the bottom of melting baths can be blocked by inert materials. The small size of the tags suggests that this may not be a significant problem. However, in order to prevent this, RFID tags should be designed or attached in a way that allows separation in the purification process before the actual recycling step.
Two major requirements can help to reduce or avoid technical impacts:
RFID tags should be applied to labels or caps to increase the chance for discharge through optical sorting systems prior to the recycling process.
SMART TRASH: Study on RFID tags and the recycling industry RAND Europe, I.A.R. and P3
Contract reference 30-CE-0395435/00-31
124
If RFID tags have to be applied to the glass itself they should be less transparent and different in colour to the glass they are attached to (this approach allows sorting, but will probably cause material losses).
The treatment of ccomplex objects cannot be displayed as a general scheme. As described, the constructive variety between different complex objects is significant (e.g., constructive difference between mobile phones, cars and TVs). The aim of some producer responsibility legislation such as ELV or WEEE is to facilitate the liberation or recovery of the contained metals and the use of plastics for energy recovery processes. These processes are usually designed to cope with the problem of complex objects so that no major impacts of RFID tags, which can also be considered complex objects, are expected.
5.4 Economic impacts
The question of economic impacts through RFID tags in the waste management and recycling industry cannot be answered at this point in time, either for the EU as a whole, or for a single Member State. The complexity of the waste treatment industries and the diversion of responsibilities between the EU, the governments, the public waste management authorities and the private waste management industry are still subject to changes in the implementation of EU legislation. Even in the producer responsibility legislation, the costs of implementing waste management legislation have been shifted from the communities to the producer, who has had to develop collection or take-back systems. Without further additional data, the allocation of costs to specific processes or even more detailed units is not possible.
The impacts from waste management and from materials in waste streams on the environment have to be controlled and the means need to be financed. With rising raw material prices, the revenues for recycling or energy recovery are increasing. Costs could be associated directly with RFID tags if the materials incorporated are not used for any other purpose, and could therefore be directly backtracked to the tagging. According to the data on RFID tag composition, the materials applied are not limited to RFID tags, which prevents a direct allocation. Adhesives in paper and plastic recycling are not only introduced through RFID tags, but also through any other sticker application.
At the same time, the costs for final disposal are rising in most countries when either stricter legislation is implemented and/or technical requirements become more complicated in order to prevent harm to the population or the environment. The costs are distributed between the private and public sector and depend on a number of factors such as legal requirements, national specifications and regional specifications.
5.5 Regulatory and policy impacts at EU and national levels
According to the findings from different studies, sources and expert consultants, there are no direct impacts that could be controlled or avoided through specific legislative measures or political incentives. Future perspectives in the literature and in the approaches carried out for this study are subjective and differ strongly depending on the intentions and perspectives or backgrounds of the stakeholders involved. The complicated interrelations
RAND Europe, I.A.R. and P3 Conclusions Part A
Contract reference 30-CE-0395435/00-31
125
between stakeholders in the waste management industry make clear that the definition of technology-specific legislation is complicated. Examples for ELVs or WEEE cannot be transferred to RFID tags hence the RFID tag only appears in connection with other objects and items. This causes a wide spread of RFID tags into a growing number of areas and waste streams that are already regulated. Any additional regulation would need to be developed in a way that would not counteract legislation already in place.
A possibility would be to develop framework requirements for the application of RFID tags to items regarding the possible ways of treatment, recycling or disposal. However, this can only function within a scenario where all relevant pending legislation had been implemented. In any other case, the number of possibilities and choices resulting from Member States is likely to create a range of possible scenarios that would not be feasible to consider.
As a result of this study, the recommendation from the German study has been found to be relevant. Since all possible impacts depend on the future application of RFID tags (i.e., quantities and composition), it appears to be unwise to seek a direct reaction from political stakeholders.
5.6 Implications for national waste systems and stakeholders
It is important to highlight that stakeholders in this context have been chosen on the basis of RFID tags as inert objects in waste streams and in a technical context. Aspects connected with the function of and information on RFID tags are not considered in Part A of this study. The main stakeholder groups based on the above-mentioned criteria are:
Public authorities RFID tag producers RFID tag users Waste processors, including recyclers and final disposers Waste producers
The multi stakeholder approach that was proposed in the German study is based on IOS (2008), which proposed an approach that can be described in 6 steps (Erdmann et al., 2009):
1. Theoretical assessment of the possibility that state-of-the-art recycling processes are compromised through the presence of RFID tags.
2. Performance of tests to analyse whether state-of-the-art processes can compensate for the possible negative effects or if the effects can be compensated for by process modifications.
3. Development of regulations that can be used by RFID producers and recyclers. Validation of these regulations by third parties (universities and research and development institutions) with experience in the considered waste streams.
4. Communication of the validated regulation with national or regional environmental authorities for approval.

SMART TRASH: Study on RFID tags and the recycling industry RAND Europe, I.A.R. and P3
Contract reference 30-CE-0395435/00-31
126
5. Publication of the regulations for the professional associations of producers and users to minimise impacts and maximise positive aspects.
6. Developing or nominating control authorities that approve whether specific RFID tags fulfil the regulations (conformity declaration).
The first steps for points 1 and 2 have been undertaken already in the German study and the study at hand. The other steps include a recommendation on how stakeholders should interact. A systematic approach to develop RFID tags or material/adhesive/RFID tag connections, which are suitable for recycling processes, is the most obvious strategy to prevent problems. This approach would include:
A specification of the requirements of material-specific recycling processes. The development of RFID tags for specific applications,22 including development
of an adhesive that fulfils requirements regarding solubility and an RFID tag that fulfils requirements regarding the separation from the material for recycling.
Lab-scale testing of RFID tags already in use or newly developed RFID tags with the system “material/adhesive/RFID tag”.
An industrial-scale testing of the system “material/adhesive/RFID tag”. The validation of results through R&D institutions. Approval by political authorities. The development of a seal of approval for RFID tags that clears an RFID tag for
application on specific materials.
The above would ensure the qualification of RFID tags for use in combination with state-of-the-art recycling facilities and would increase specific experiences with regard to RFID tags in the recycling industry, thus offering a chance to unveil possible future problems before they even occur. The necessity for legislation in such an approach should be limited to the legal requirement for RFID tags to be approved for recycling before application. Since at this point in time no urgent measures appear to be required, this could happen with the necessary preparation time to give RFID tag producers and the tagging industry sectors time to develop the necessary systems and materials to prevent a slowdown of technical developments.
In addition, the position of passive, semi-active and active RFID tags with regard to existing framework legislation should be decided upon by the EC, to prevent delaying the above introduced measures due to a lack of legislative transparency.
22 An example would be the development or approval procedure for RFID tags applicable on PET bottles, which are suitable for PET materials recycling processes. The solubility of the adhesive that is used to attach the RFID tag to the bottle should match requirements to increase the chances of detaching the RFID tag from the bottle.
RAND Europe, I.A.R. and P3 Contract reference 30-CE-0395435/00-31
127
SMART TRASH: PART B


RAND Europe, I.A.R. and P3 Contract reference 30-CE-0395435/00-31
129
CHAPTER 6 Assessment of current and potential use of RFID as a green technology in recycling
This chapter gives an overview of the current state of play of RFID as a green technology in the EOL phases of a product’s lifecycle.
This is followed by the derivation of distinct use cases for RFID technology.
The methodology behind how the use case research was conducted is briefly described.
Two promising use cases are assessed more deeply. The underlying methodology of these studies is also explained.
6.1 Understanding the present state of play
RFID can attach a material object to a stream of data. This can be done either by a unique identifier, linking the object to data that is stored in back-end systems or by reading and writing essential data directly to and from a tag. Connecting object and data has direct benefits. Therefore RFID is becoming more important in the field of product manufacturing, forward logistics and retail.
There are many procedures in which RFID tag data can be used – manufacturing lines, recall management, asset tracking and inventory management, assignment of responsibilities, etc. However, this use of data is usually connected to systems with a high degree of technology and, therefore, investment.
Manufacturing a TV set or a car, for example, is a highly automated procedure. Bringing it to the market over a global supply chain also poses many challenges (e.g., cost), involving logistic operations, product responsibility concerning manufacturer liability and many other important issues. However, if these processes are designed efficiently, a high return-of-investment can be expected.
RFID is currently penetrating the manufacturing and retail processes of a range of high-value products. For low-value-added products, the retail sector is expected to drive the demand for RFID. In the retail sector, RFID saves time during business-to-customer interactions. For example, checking out at a supermarket by simply pushing out the shopping trolley and having the cost deducted from a credit card is one such scenario.
SMART TRASH: Study on RFID tags and the recycling industry RAND Europe, I.A.R. and P3
Contract reference 30-CE-0395435/00-31
130
These scenarios share one common factor: they raise the number of RFID tags that are part of sold objects. A central aspect of this study is how environmental benefits could be realised by using these tags.
RFID tags are already being used in some sectors as a green technology, particularly in relation to the “green” management of supply chains. Paramount, for example, is a producer of fresh food in the USA that uses RFID to “rationalise” the processing of fresh food deliveries from its suppliers. Walmart uses RFID technology throughout its supply chain to manage logistics and to reduce CO2 emissions by minimising the movement of goods. Recycle Bank, Rewards for Recycling and Concept2Solution all employ various forms of RFID systems to encourage recycling behaviours. Smart Vareflyt and Nestle are using RFID to improve the flow of perishable goods through their supply chains and reduce waste, and TruckTag uses RFID to support better and faster truck security inspections at a busy port, thereby improving air quality (Bose & Yan, 2011). Most of these applications aim to rationalise beginning-of-life (BOL) and middle-of-life (MOL) processes. Through the optimisation of logistics, a cost-cutting effect is achieved (the operator’s focus), while savings in transport movements, amount of trucks necessary, etc., have a direct positive effect on the environmental performance as well.
One main challenge is the different capitalisation of EOL and BOL processes. While manufacturing and selling a product may entail high profits, the EOL of a product is still widely seen as a cost factor. Therefore the uptake of RFID in EOL processes is slow and special attention is paid to the drivers for the uptake of RFID in EOL processes.
6.1.1 RFID as a green technology Globalisation is driving changes in the nature of interactions amongst and within global value chains and the way people, products and businesses interact within and amongst each other. RFID has the potential to be a technology that can allow for a more holistic approach to product lifecycle management, thereby enhancing environmental sustainability and helping companies to reduce costs and generate revenues through the exploration of new market opportunities (Edwards, 2008; Angeles, 2010; Bose & Yan, 2011). However, the opportunities presented through RFID tags depend on the agreement of all participants in the product lifecycle, starting with resource extraction, resource conversion, production of the product and transportation of the product to the market it will be sold in. In some cases, resources from three continents are used to create a product that is shipped to another country and sold there. This is depicted in the diagram below.
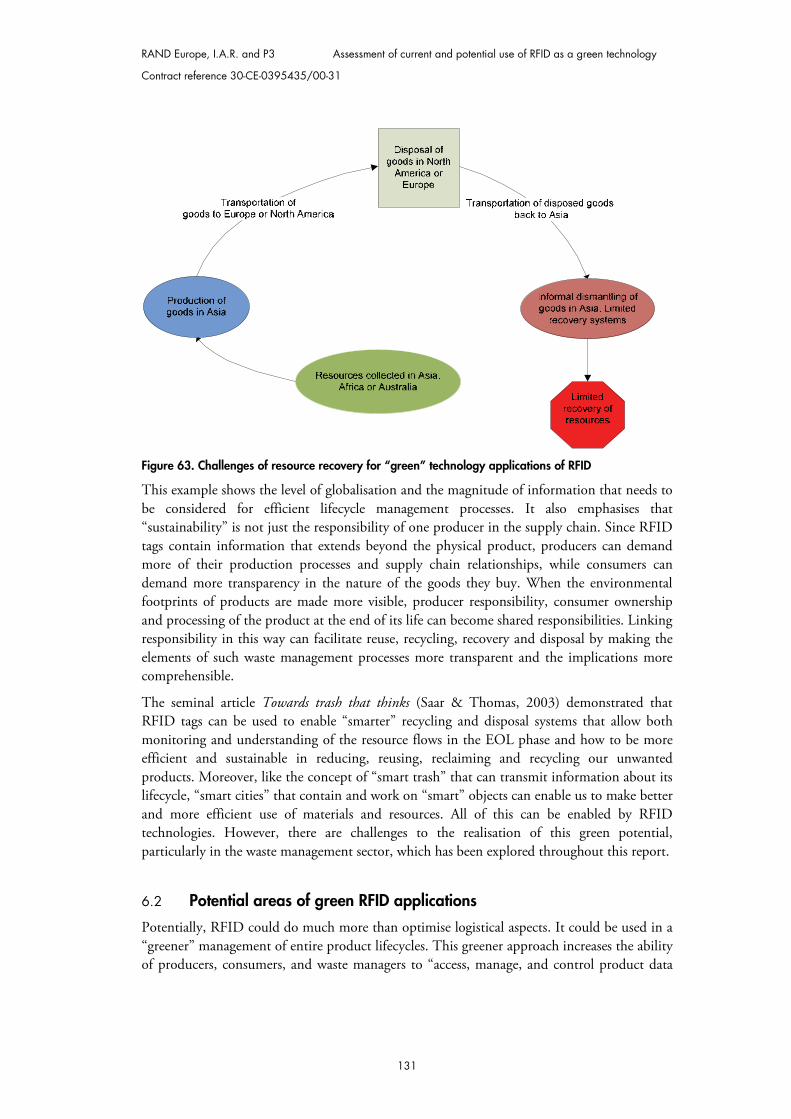
RAND Europe, I.A.R. and P3 Assessment of current and potential use of RFID as a green technology
Contract reference 30-CE-0395435/00-31
131
Figure 63. Challenges of resource recovery for “green” technology applications of RFID
This example shows the level of globalisation and the magnitude of information that needs to be considered for efficient lifecycle management processes. It also emphasises that “sustainability” is not just the responsibility of one producer in the supply chain. Since RFID tags contain information that extends beyond the physical product, producers can demand more of their production processes and supply chain relationships, while consumers can demand more transparency in the nature of the goods they buy. When the environmental footprints of products are made more visible, producer responsibility, consumer ownership and processing of the product at the end of its life can become shared responsibilities. Linking responsibility in this way can facilitate reuse, recycling, recovery and disposal by making the elements of such waste management processes more transparent and the implications more comprehensible.
The seminal article Towards trash that thinks (Saar & Thomas, 2003) demonstrated that RFID tags can be used to enable “smarter” recycling and disposal systems that allow both monitoring and understanding of the resource flows in the EOL phase and how to be more efficient and sustainable in reducing, reusing, reclaiming and recycling our unwanted products. Moreover, like the concept of “smart trash” that can transmit information about its lifecycle, “smart cities” that contain and work on “smart” objects can enable us to make better and more efficient use of materials and resources. All of this can be enabled by RFID technologies. However, there are challenges to the realisation of this green potential, particularly in the waste management sector, which has been explored throughout this report.
6.2 Potential areas of green RFID applications
Potentially, RFID could do much more than optimise logistical aspects. It could be used in a “greener” management of entire product lifecycles. This greener approach increases the ability of producers, consumers, and waste managers to “access, manage, and control product data
SMART TRASH: Study on RFID tags and the recycling industry RAND Europe, I.A.R. and P3
Contract reference 30-CE-0395435/00-31
132
and information over the whole product lifecycle” (Jun et al., 2009). This applies at the BOL, MOL and EOL stages, and more detailed examples of these potential applications have been presented throughout this chapter.
At the disposal phase of a product, RFID tags could also help to improve the efficiency of waste management processes. RFID could provide for more efficient recycling processes improving reuse or the recovery rate of materials. It plays a major role in most PAYT initiatives and could provide information on RFID-based filling levels for bins, the management of infectious waste, and the recovery of electronic materials at the EOL stage. Evaluating these options forms a major part of the use case research in this study, as there are significant challenges and operational logistics about which we know too little.
One of the most promising areas of green RFID technology is in improved product recovery and recycling at the EOL stage. There are real cost savings that can be attained through improvements to product recovery systems (Parlikad & McFarlane, 2007), but it is in product recovery in the waste management sector that some of the biggest challenges to RFID use are posed. In order to be used and applied most effectively, RFID tags are embedded or connected with their carrier objects in different ways. It is this very embedding within different objects that can be problematic as the effects the materials within RFID tags will have on different waste streams is unknown. In addition, the private consumption or commercial utilisation of goods influences the way RFID tags are ultimately disposed of and enter waste streams. Waste from private households emerges from a larger number of sources and is supposed to be connected to a collection system, which is controlled by a public authority, while the disposal routes for commercial waste can be chosen by the waste producer himself (within defined limitations).
RFID technology can also enable consumers to make more informed choices about the sustainability of the products they purchase. Applications of RFID technology in this way focus on the MOL and EOL stages in providing both purchasing and disposal information.
Following this basic assessment, the principal areas of green applications can initially be clustered into three main areas:
Improved sorting and treatment processes RFID and sustainable consumption and production Improved (reverse) logistics.
6.2.1 Overview of use cases and case studies Based on this guidance a systematic literature review was carried out and enhanced by expert opinions in order to identify further relevant journals and sources. Following standard practice, relevant industry, scholarly and peer-reviewed literature was matched within the overall relevant product lifecycle frameworks and mapped to distinct products and infrastructure. This approach is detailed in Section 6.3. Summing up, the literature review raised the following industrialised applications, pilots or ideas for further use case modelling.
In this study, a use case consists of applications of RFID technology (used in a pilot, described in literature or at least as a plausible concept). The applications considered as use cases have a unique, inherent set of characteristics and fulfil a certain purpose.
RAND Europe, I.A.R. and P3 Assessment of current and potential use of RFID as a green technology
Contract reference 30-CE-0395435/00-31
133
Improved sorting and treatment processes 1. RFID-based WEEE EOL processes. Waste handlers can look up information on the
electronic device or subcomponent with the help of an RFID system connected to an information system. The system helps to decide on the economically best way to deal with the electronic devices or subcomponents: reuse, remanufacture, refurbish, cannibalise or final disposal.
2. RFID-based ELV EOL processes. Waste handlers can look up information on the vehicle or part with the help of an RFID system connected to an information system. The system helps to decide on the economically best way to deal with the vehicles or parts: reuse, remanufacture, refurbish, cannibalise or final disposal.
RFID and sustainable consumption and production 3. RFID-based consumer disposal decision support (donate, sell, repair, dispose). The
consumer can look up information on the product s/he is about to throw away with the help of an RFID-enabled mobile device, e.g., a mobile phone with an NFC (Near Field Communication) or UHF (Ultra-High Frequency) reader connected to an information system. The system helps the owner to decide on what to do with the product: donate or sell when the system indicates that the product still has value, repair when repair manuals and parts are available or trash it.
4. Consumer purchase decision support based on environmental performance: the consumer can look up information on the environmental impacts and other features of the product s/he is considering purchasing with the help of an RFID-enabled mobile device, e.g., a mobile phone with an NFC (Near Field Communication) or UHF (Ultra-High Frequency) reader connected to an information database.
Improved logistics and waste handling 5. RFID-based disposal management of infectious waste. Tracking and control of (bio-)
hazardous waste from hospitals (e.g., medical waste, infectious waste) can be supported by RFID. Tags or external databases store information about data on chemical media, which can be used for decision support, transport, documentation and further processing.
6. RFID-based filling level measurement. RFID is used to identify the public waste bins in order to establish an optimised collection tour based on statistical data.
7. RFID-based waste sorting. Waste from private households is sorted at the recycling stage. Waste that is not correctly disposed of can be automatically identified and separated based on RFID.
Based on expert feedback, use cases 1 and 3 were selected for further case-study modelling.
6.3 Assessing the use of RFID
To assess the different possibilities of using RFID as a green technology, an overarching framework was developed. The framework uses the lifecycle of a product as an entry point for the assessment of any RFID deployment.
Applications can be grouped in two ways: by product lifecycle and by types of tagged item. Product lifecycle can be divided into the BOL, MOL and EOL phases. The lifecycle can be
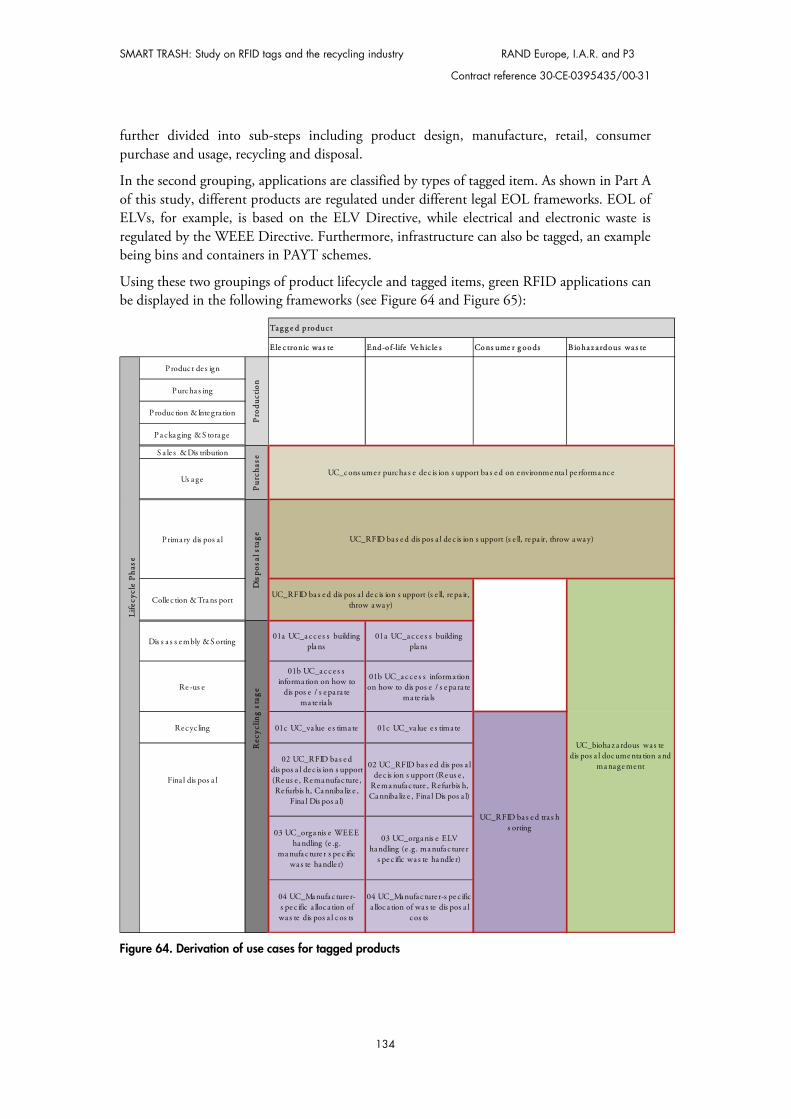
SMART TRASH: Study on RFID tags and the recycling industry RAND Europe, I.A.R. and P3
Contract reference 30-CE-0395435/00-31
134
further divided into sub-steps including product design, manufacture, retail, consumer purchase and usage, recycling and disposal.
In the second grouping, applications are classified by types of tagged item. As shown in Part A of this study, different products are regulated under different legal EOL frameworks. EOL of ELVs, for example, is based on the ELV Directive, while electrical and electronic waste is regulated by the WEEE Directive. Furthermore, infrastructure can also be tagged, an example being bins and containers in PAYT schemes.
Using these two groupings of product lifecycle and tagged items, green RFID applications can be displayed in the following frameworks (see Figure 64 and Figure 65):
Figure 64. Derivation of use cases for tagged products
Ele c tronic wa s te End-of-life Ve hic le s Co ns ume r g oo ds B ioha z a rdous wa s te
P roduc t de s ign
Purc ha s ing
Produc tion & Inte gra tion
Pa c ka ging & S tora ge
S a le s & Dis tribution
Us a ge
Prima ry dis pos a l
Colle c tion & Tra ns port
Dis s a s s embly & S orting01a UC_a c c e s s building
pla ns01a UC_a c ce s s building
plans
Re -us e
01b UC_a c c e s s informa tion on how to
dis pos e / s e pa ra te ma te ria ls
01b UC_a c c e s s information on how to dis pos e / s e pa ra te
ma te ria ls
Rec yc ling 01c UC_va lue e s tima te 01c UC_va lue e s tima te
Fina l dis pos a l
02 UC_RFID ba s e d dis pos a l de c is ion s upport (Re us e , Re ma nufac ture , Re furbis h, Ca nniba liz e ,
Fina l Dis pos a l)
02 UC_RFID ba s e d dis pos a l de c is ion s upport (Re us e ,
Rema nufa c ture , Re furbis h, Ca nniba liz e , Fina l Dis pos a l)
03 UC_orga nis e WEEE ha ndling (e .g.
ma nufa c ture r s pe c ific wa s te handle r)
03 UC_orga nis e ELV ha ndling (e .g. ma nufa c ture r
s pe c ific wa s te ha ndle r)
04 UC_Ma nufa c ture r-s pe c ific a lloc a tion of wa s te dis pos a l c os ts
04 UC_Ma nufac ture r-s pe c ific a lloc a tion of wa s te dis pos a l
c os ts
Ta g g e d produc t
UC_c ons ume r purc ha s e de c is ion s upport ba s e d on environme nta l pe rforma nc e
Life
cycl
e P
hase
Rec
yclin
g st
age
Dis
posa
l sta
geP
rodu
ctio
nP
urch
ase
UC_RFID ba s e d tra s h s orting
UC_RFID ba s e d dis pos a l de c is ion s upport (s e ll, re pa ir, throw a wa y)
UC_bioha z a rdous was te dis pos a l doc ume nta tion a nd
ma nage ment
UC_RFID ba s e d dis pos a l de c is ion s upport (s e ll, re pa ir, throw a wa y)
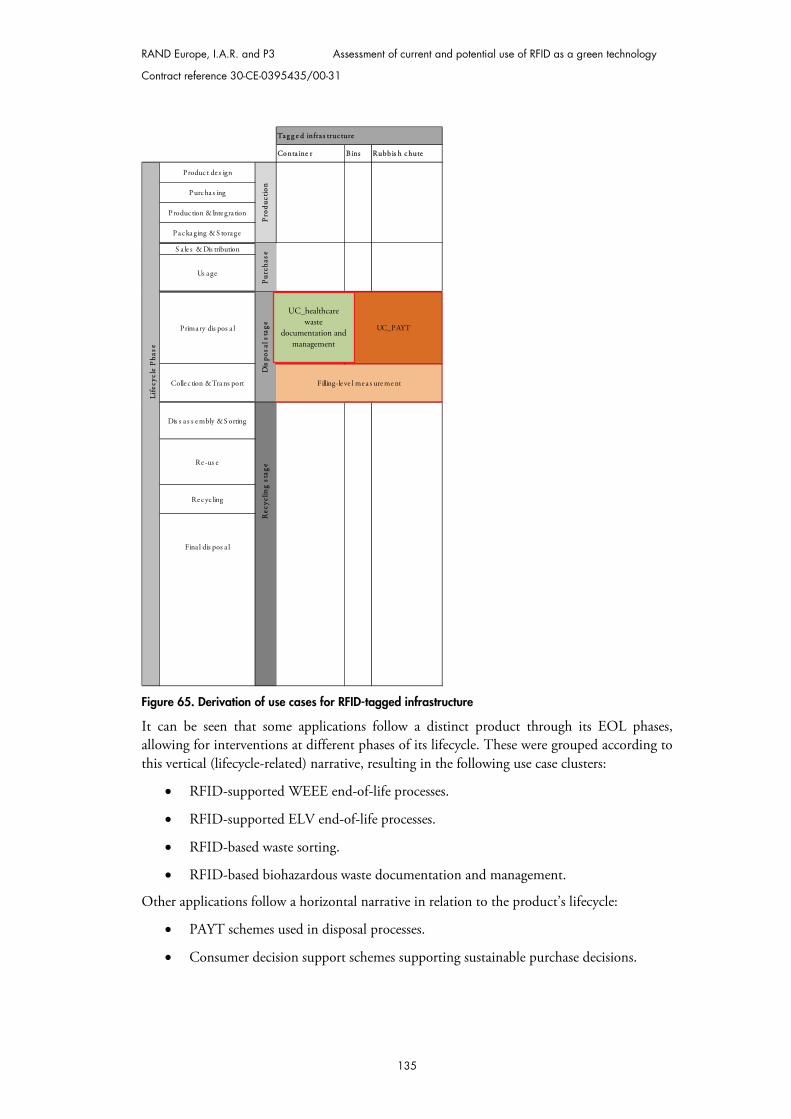
RAND Europe, I.A.R. and P3 Assessment of current and potential use of RFID as a green technology
Contract reference 30-CE-0395435/00-31
135
Figure 65. Derivation of use cases for RFID-tagged infrastructure
It can be seen that some applications follow a distinct product through its EOL phases, allowing for interventions at different phases of its lifecycle. These were grouped according to this vertical (lifecycle-related) narrative, resulting in the following use case clusters:
RFID-supported WEEE end-of-life processes.
RFID-supported ELV end-of-life processes.
RFID-based waste sorting.
RFID-based biohazardous waste documentation and management.
Other applications follow a horizontal narrative in relation to the product’s lifecycle:
PAYT schemes used in disposal processes.
Consumer decision support schemes supporting sustainable purchase decisions.
Conta ine r B ins Rubbis h c hute
Produc t de s ign
P urc ha s ing
P roduc tion & Inte gra tion
P a c ka ging & S tora ge
S a le s & Dis tribution
Us age
Prima ry dis pos a l
UC_bioha z a rdous wa s te dis pos a l
doc ume nta tion and ma na ge me nt
Colle c tion & Tra ns port
Dis s a s s e mbly & S orting
Re -us e
Re c yc ling
Fina l dis pos a l
Tag g e d infra s truc ture
Life
cycl
e P
hase
Rec
yclin
g st
age
Dis
posa
l sta
geP
rodu
ctio
nP
urch
ase
UC_PAYT
Filling-le ve l me a s ure me nt
UC_healthcare waste
documentation and management
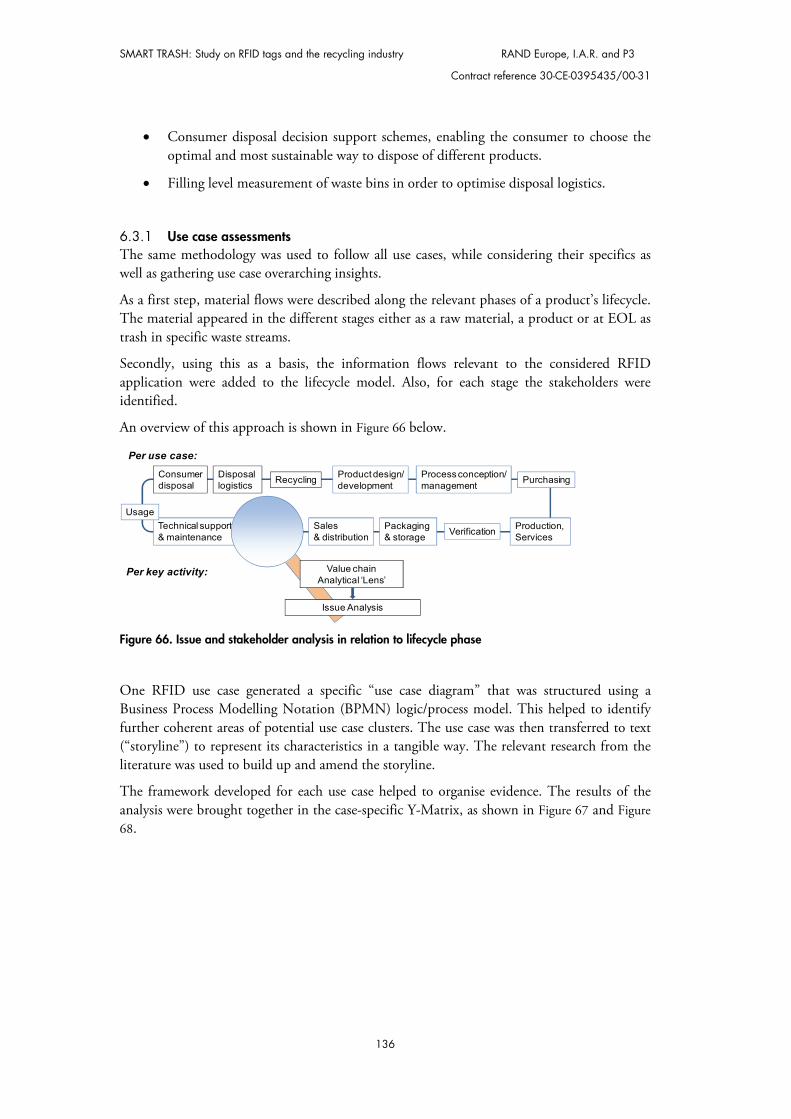
SMART TRASH: Study on RFID tags and the recycling industry RAND Europe, I.A.R. and P3
Contract reference 30-CE-0395435/00-31
136
Consumer disposal decision support schemes, enabling the consumer to choose the optimal and most sustainable way to dispose of different products.
Filling level measurement of waste bins in order to optimise disposal logistics.
6.3.1 Use case assessments The same methodology was used to follow all use cases, while considering their specifics as well as gathering use case overarching insights.
As a first step, material flows were described along the relevant phases of a product’s lifecycle. The material appeared in the different stages either as a raw material, a product or at EOL as trash in specific waste streams.
Secondly, using this as a basis, the information flows relevant to the considered RFID application were added to the lifecycle model. Also, for each stage the stakeholders were identified.
An overview of this approach is shown in Figure 66 below.
Figure 66. Issue and stakeholder analysis in relation to lifecycle phase
One RFID use case generated a specific “use case diagram” that was structured using a Business Process Modelling Notation (BPMN) logic/process model. This helped to identify further coherent areas of potential use case clusters. The use case was then transferred to text (“storyline”) to represent its characteristics in a tangible way. The relevant research from the literature was used to build up and amend the storyline.
The framework developed for each use case helped to organise evidence. The results of the analysis were brought together in the case-specific Y-Matrix, as shown in Figure 67 and Figure 68.
RecyclingDisposal logistics
Consumerdisposal
Product design/development
Process conception/management Purchasing
Production, ServicesVerificationPackaging
& storageSales & distribution
Installation & EIS
Technical support& maintenance
Usage
Per key activity:
Per use case:
Value chain Analytical ‘Lens’
Issue Analysis
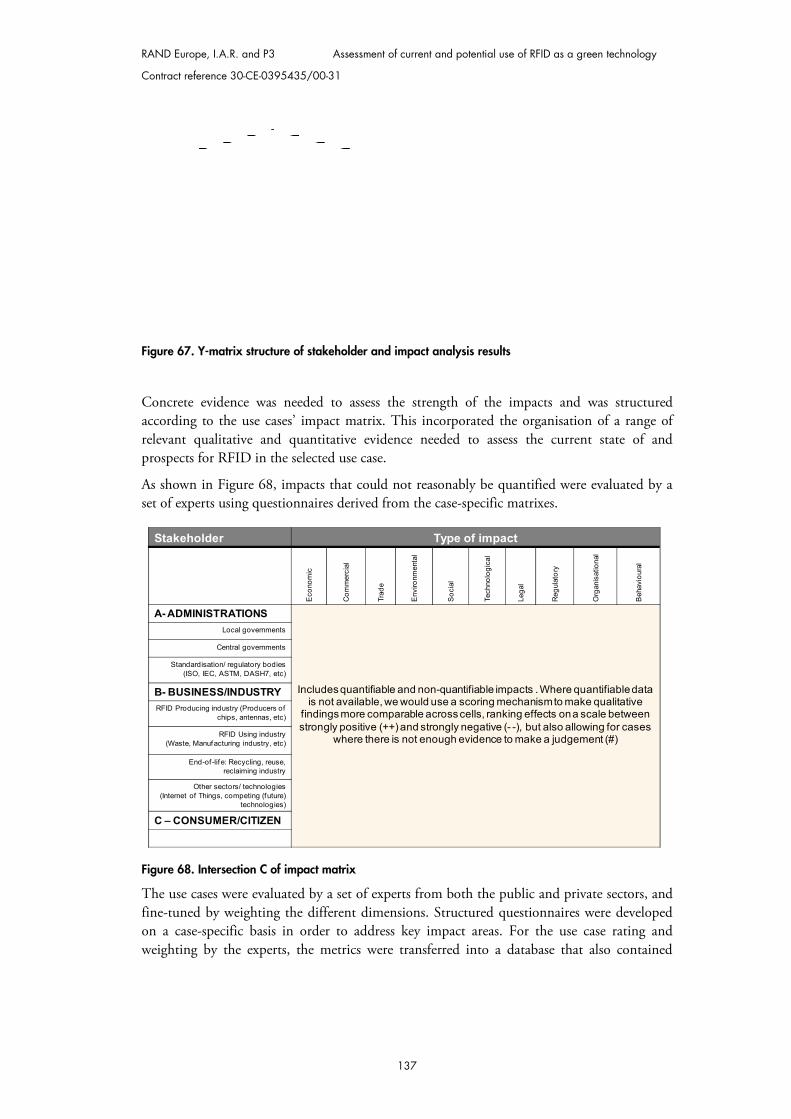
RAND Europe, I.A.R. and P3 Assessment of current and potential use of RFID as a green technology
Contract reference 30-CE-0395435/00-31
137
Figure 67. Y-matrix structure of stakeholder and impact analysis results
Concrete evidence was needed to assess the strength of the impacts and was structured according to the use cases’ impact matrix. This incorporated the organisation of a range of relevant qualitative and quantitative evidence needed to assess the current state of and prospects for RFID in the selected use case.
As shown in Figure 68, impacts that could not reasonably be quantified were evaluated by a set of experts using questionnaires derived from the case-specific matrixes.
Figure 68. Intersection C of impact matrix
The use cases were evaluated by a set of experts from both the public and private sectors, and fine-tuned by weighting the different dimensions. Structured questionnaires were developed on a case-specific basis in order to address key impact areas. For the use case rating and weighting by the experts, the metrics were transferred into a database that also contained
Stakeholder Type of impact
Eco
nom
ic
Com
mer
cial
Trad
e
Env
ironm
enta
l
Soc
ial
Tech
nolo
gica
l
Lega
l
Reg
ulat
ory
Org
anis
atio
nal
Beh
avio
ural
A- ADMINISTRATIONS
Includes quantifiable and non-quantifiable impacts . Where quantifiable data is not available, we would use a scoring mechanism to make qualitative
findings more comparable across cells, ranking effects on a scale between strongly positive (++) and strongly negative (- -), but also allowing for cases
where there is not enough evidence to make a judgement (#)
Local governments
Central governments
Standardisation/ regulatory bodies (ISO, IEC, ASTM, DASH7, etc)
B- BUSINESS/INDUSTRYRFID Producing industry (Producers of
chips, antennas, etc)
RFID Using industry (Waste, Manufacturing industry, etc)
End-of -life: Recycling, reuse, reclaiming industry
Other sectors/ technologies (Internet of Things, competing (future)
technologies)
C – CONSUMER/CITIZEN
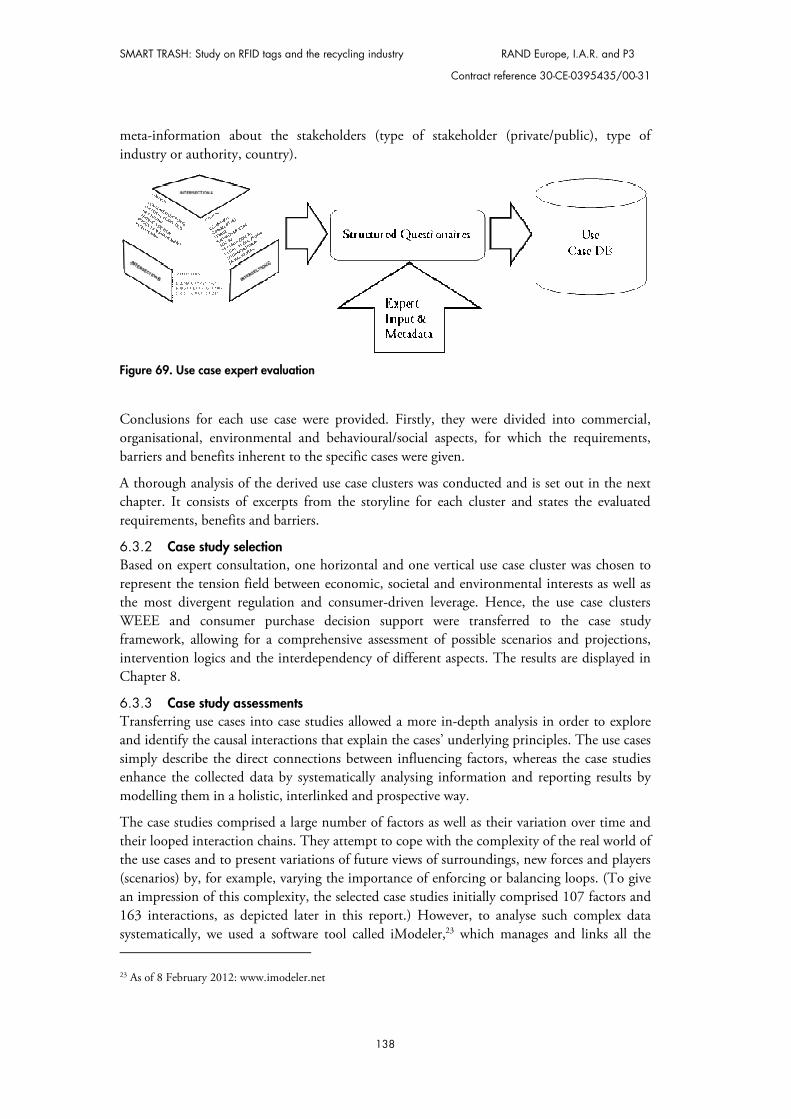
SMART TRASH: Study on RFID tags and the recycling industry RAND Europe, I.A.R. and P3
Contract reference 30-CE-0395435/00-31
138
meta-information about the stakeholders (type of stakeholder (private/public), type of industry or authority, country).
Figure 69. Use case expert evaluation
Conclusions for each use case were provided. Firstly, they were divided into commercial, organisational, environmental and behavioural/social aspects, for which the requirements, barriers and benefits inherent to the specific cases were given.
A thorough analysis of the derived use case clusters was conducted and is set out in the next chapter. It consists of excerpts from the storyline for each cluster and states the evaluated requirements, benefits and barriers.
6.3.2 Case study selection Based on expert consultation, one horizontal and one vertical use case cluster was chosen to represent the tension field between economic, societal and environmental interests as well as the most divergent regulation and consumer-driven leverage. Hence, the use case clusters WEEE and consumer purchase decision support were transferred to the case study framework, allowing for a comprehensive assessment of possible scenarios and projections, intervention logics and the interdependency of different aspects. The results are displayed in Chapter 8.
6.3.3 Case study assessments Transferring use cases into case studies allowed a more in-depth analysis in order to explore and identify the causal interactions that explain the cases’ underlying principles. The use cases simply describe the direct connections between influencing factors, whereas the case studies enhance the collected data by systematically analysing information and reporting results by modelling them in a holistic, interlinked and prospective way.
The case studies comprised a large number of factors as well as their variation over time and their looped interaction chains. They attempt to cope with the complexity of the real world of the use cases and to present variations of future views of surroundings, new forces and players (scenarios) by, for example, varying the importance of enforcing or balancing loops. (To give an impression of this complexity, the selected case studies initially comprised 107 factors and 163 interactions, as depicted later in this report.) However, to analyse such complex data systematically, we used a software tool called iModeler,23 which manages and links all the 23 As of 8 February 2012: www.imodeler.net
RAND Europe, I.A.R. and P3 Assessment of current and potential use of RFID as a green technology
Contract reference 30-CE-0395435/00-31
139
quantitative and qualitative evidence of literature, research and expert consultation, thus interconnecting chains of thought.
For the upcoming expert consultation, the tool will support analysis by systematically and efficiently depicting, identifying and validating key findings, the relevance of impact factors and looped interactions. Furthermore, the software will enable the generation of a set of hypotheses (e.g., key impacts or drivers) and recommendations (e.g., interaction loops to steer).
The results of the analysis were calculated by making use of the background simulation of impulses, which were sent through the cause and impact model. The outcome was a potential impact that a factor can have on a chosen target factor. Furthermore, the results indicated how the development will be realised using feedback loops. The mmathematical function used for calculation by the iModeler is as follows:
F(t) = w1*F1(t) + wn*Fn(t) F = influenced factor w1-n = weighting of interconnection of influencing factor F1-n = influencing factor Through a qualitative model it is possible to identify ccause and effect relationships between the factors. In order to make an analysis, target factors need to be defined first. Then further factors can be introduced that directly or indirectly influence the target factor in a positive or negative way. The influence of one factor on another is an interconnection that can be weighted by roughly estimating the influences as increasing or decreasing, as weak, medium or strong, and as immediate, mid-term or long-term. While developing the model, different perspectives focusing on various parts of a use case can be viewed by setting different factors as targets in the centre of the model. The case study analysis was supported by an eevaluation matrix, which enabled the identification of possible risks and important levers over time. The horizontal axis shows the impact different paths of influence may have on a chosen factor. The vertical axis shows the short-term impact of feedback loops, which in the case of a dominance of rreinforcing feedback loops will lead to an increase in the positive or negative impact of a factor. Balancing feedback loops in turn lead to a decrease or stagnation in the impact of a factor over time. Furthermore the evaluation matrix presents how selected factors are impacted in the short, medium and long term.
In summary, the cases studies assessment provided insights and comprehensive findings on:
Identification of key parameters, leverage points, triggers, limiting factors/weaknesses of existing practices and long-term trends.
Causal effect chains and their relative strengths to form a holistic impact analysis building the central framework logic.
Impacts on specific segments of the value chain. Impacts of major discontinuities where the interests of stakeholders collide or looped
interactions compensate themselves in a negative sense.
SMART TRASH: Study on RFID tags and the recycling industry RAND Europe, I.A.R. and P3
Contract reference 30-CE-0395435/00-31
140
Areas of leveraging at political, societal, private and industrial level. Obstacles to large-scale realisations, including recommendations to overcome them.

RAND Europe, I.A.R. and P3 Contract reference 30-CE-0395435/00-31
141
CHAPTER 7 RFID as a green technology: use case analysis
In the following chapter, the derived use case clusters are analysed according to the methodology detailed in Section 6.3.1.
The main characteristics and insights are also summarised at the beginning of each use case sub-chapter.
For each case, requirements, benefits and barriers are elaborated.
Results of a privacy assessment related to the cases are given.
At the end of the chapter, the use case findings are summarised.
7.1 Use case analyses and preliminary findings
7.1.1 Pay-as-you-throw (PAYT)
Use case summary:
Pay-as-you-throw (PAYT) is an RFID-based waste pricing model for the disposal of municipal solid waste, meaning that waste is charged according to the user’s actual waste generation, measured by weight or volume. There are two different types of PAYT systems: either the disposed waste is linked to waste producers or to waste bins. The latter is widespread and has already been implemented in many countries.
Several prerequisites need to be considered to ensure a successful implementation of PAYT. Systems that include incentive schemes based on waste recycling for private households have proven to be more successful, because citizens are motivated to reduce waste if it is linked to cost savings. Furthermore, a mature RFID infrastructure with maintenance services, consumer support services and billing systems must be present. Additionally, a comprehensive education programme is essential in order to inform consumers about the new system and policies. Privacy concerns are still very dominant and hinder the acceptance of PAYT. Although the implementation of PAYT schemes is subject to high investment costs, PAYT incentive schemes or reward system-based waste recycling provide opportunities for
SMART TRASH: Study on RFID tags and the recycling industry RAND Europe, I.A.R. and P3
Contract reference 30-CE-0395435/00-31
142
municipalities and waste hauliers to earn money from waste. In addition, the increased transparency reduces costs for falsely unacquainted bins and containers, enabling better services.
According to the EWC (European Waste Catalogue, valid from 01/01/2002) “municipal wastes including separately collected fractions” can be household waste and similar commercial, industrial and institutional wastes (Environmental Protection Agency, 2002). Due to already existing schemes for the latter three, this use case will only address private households (denoted as “PAYT users”). PAYT users’ waste is charged for according to actual waste generation measured by weight or volume.
Two scenarios are possible in the PAYT use case: waste that is disposed of can either be linked to a waste bin or to a certain waste producer. The latter describes the “bring scheme”, where users are identified by using an RFID ID card that unlocks a so-called chamber system or waste lock installation. These are waste storage devices such as containers that require the waste to be passed through a feeding chamber. When waste enters this chamber, the user is registered and the amount of waste can be measured by weight or volume with the help of a technical device such as a weight scale (Reichenbach, 2008). Another option is recycling at drop-off centres, where citizens may gain access by identifying themselves with chip cards. The drop-off centres may be split between an area where waste disposal is chargeable for certain types of waste, and an area where waste disposal is free of charge for recyclables like glass (Urban, 2009). Also worth noting in this context is the use of rubbish chutes in apartment buildings, where waste producers can use a chip card to identify themselves; the waste thrown into the chute can be measured by weight or volume by an integrated weight scale or by scanning of dimensions.
Waste bin identification is the most widespread PAYT system. The amount of waste collected in bins is linked to fee models and individual incentives, independently of the person who filled the waste bin. Waste can either be measured by volume or by weight.
Figure 70 shows an overview of the principle PAYT implementation alternatives:
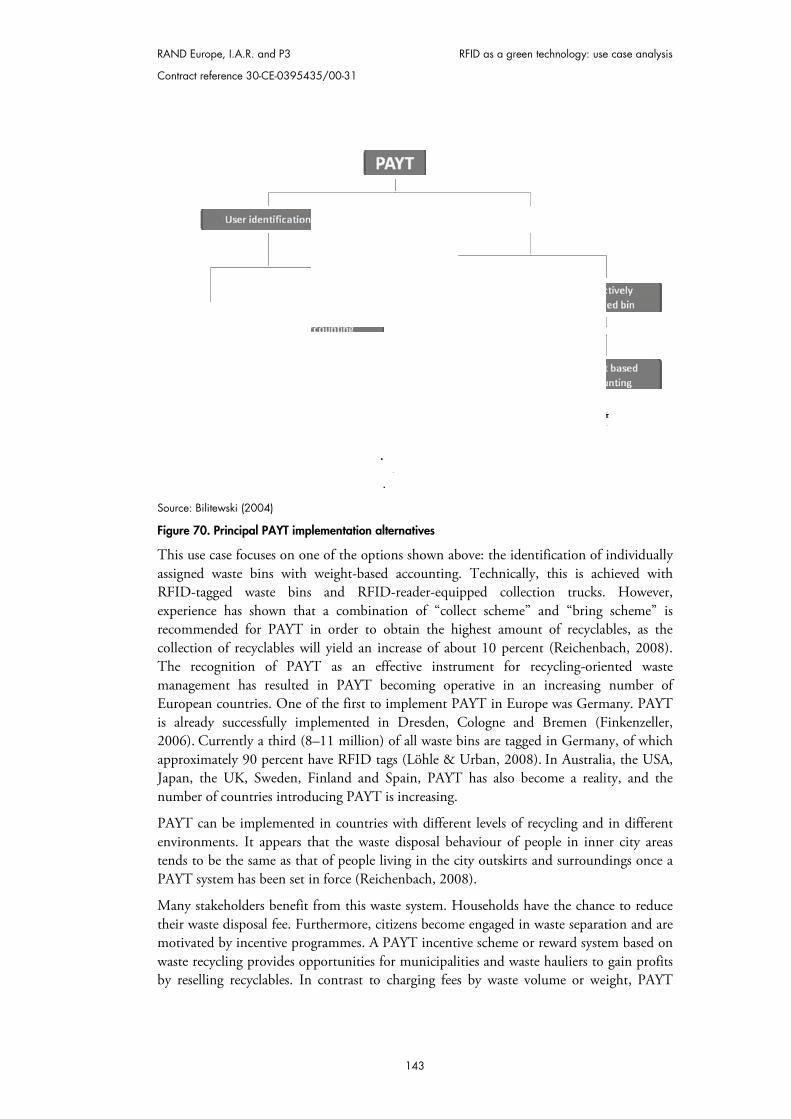
RAND Europe, I.A.R. and P3
Contract reference 30-CE-039543
Source: Bilitewski (2004)
Figure 70. Principal PAYT imp
This use case focuses on onassigned waste bins with RFID-tagged waste binsexperience has shown tharecommended for PAYT icollection of recyclables wiThe recognition of PAYmanagement has resulted European countries. One ois already successfully imp2006). Currently a third (8approximately 90 percent hJapan, the UK, Sweden, Fnumber of countries introd
PAYT can be implementedenvironments. It appears ttends to be the same as thaPAYT system has been set i
Many stakeholders benefit their waste disposal fee. Furmotivated by incentive progwaste recycling provides opby reselling recyclables. In
RFID as a green technology: use
35/00-31
143
plementation alternatives
ne of the options shown above: the identification of iweight-based accounting. Technically, this is ach and RFID-reader-equipped collection trucks.
at a combination of “collect scheme” and “bring in order to obtain the highest amount of recyclabill yield an increase of about 10 percent (Reichenb
YT as an effective instrument for recycling-oriein PAYT becoming operative in an increasing
of the first to implement PAYT in Europe was Germplemented in Dresden, Cologne and Bremen (F
8–11 million) of all waste bins are tagged in Germanhave RFID tags (Löhle & Urban, 2008). In AustraliaFinland and Spain, PAYT has also become a realiducing PAYT is increasing.
d in countries with different levels of recycling and that the waste disposal behaviour of people in inneat of people living in the city outskirts and surroundin force (Reichenbach, 2008).
from this waste system. Households have the chancrthermore, citizens become engaged in waste separatgrammes. A PAYT incentive scheme or reward syste
pportunities for municipalities and waste hauliers to n contrast to charging fees by waste volume or wei
e case analysis
individually hieved with
However, scheme” is
bles, as the ach, 2008).
ented waste number of
many. PAYT Finkenzeller, ny, of which a, the USA, ty, and the
in different er city areas dings once a
ce to reduce tion and are em based on gain profits ight, PAYT
SMART TRASH: Study on RFID tags and the recycling industry RAND Europe, I.A.R. and P3
Contract reference 30-CE-0395435/00-31
144
offers incentives for recycling by partially transferring profits to the customer (Wyld, 2010). For example, Recyclebank, a waste management company, rewards waste disposers with Recyclebank points that are based on the volume of the recycled waste. These points can be honoured by local and national reward partners (Wyld, 2010).
By observing the current market situation it is obvious that new PAYT systems are constantly being developed and implemented. For instance MetroSense, a Finnish company that develops different waste sorting solutions, invented a PAYT system that allows households to collect separated waste in conventional plastic bags (MetroSense, 2009). The bags must be closed with waste identification stickers including an RFID tag (which has to be purchased). The bags are thrown into regular waste containers. RFID readers at the recycling centre automatically detect the type of waste, which can be separated accordingly. Although this procedure does not represent a traditional PAYT approach, the principle of the collect scheme can be recognised in this use case when bags are weighed at the recycling centre, and the RFID tag provides the waste producer’s data.
Requirements Commercial requirements: municipalities have to set up system maintenance
services, data infrastructure, consumer support services and billing systems. In addition to system-related costs, investments to enhance the systems for collecting separated waste fractions and implementing public education measures also need to be taken into account.
Tax policies as well as pertinent legislation on waste would support PAYT in controlling an increase in waste and the use of landfill, and would promote reuse and recycling. PAYT does introduce the risk that people stop using waste services and engage in unwanted disposal practices instead. This could result from privacy concerns or the unwillingness to pay for waste disposal. A fixed fee or mandatory minimum of payable services included in the waste charge is recommended.
A strong organisational requirement is that PAYT needs to ensure the simplicity of the recycling scheme and of billing. Also, new waste collection concepts for different urban structures and environments must be adapted to specific city planning and aesthetic concerns.
Customer-oriented incentives and disincentives (rebates and fees) play an essential role in a successful PAYT implementation (Saar & Thomas, 2003).
Educating the business community before/during implementation about a program’s final design and informing residents about how to participate will also be the key to PAYT success.
Generating positive media coverage will also be key to PAYT success. Informing citizens about PAYT system goals and also the consequences of
wrongful conduct is of critical importance to the introduction of PAYT. This is considered to contribute to minimising misbehaviour encouraged by individual waste charging (Reichenbach, 2008).
Municipalities need to ensure equal recycling possibilities for every citizen by means of accessibility, distance to container sites, simplicity of recycling schemes, adequate amount of containers, etc. (Bilitewski, 2004).
In view of large families and families with low income, innovative campaigns assuring an equal treatment of all citizens have to be established (Bilitewski, 2004).

RAND Europe, I.A.R. and P3 RFID as a green technology: use case analysis
Contract reference 30-CE-0395435/00-31
145
The robustness of technical systems will be key to the success of PAYT. Procedural fall-backs to overcome system failures are mandatory and need to be efficient. Also, RFID hardware implementation has to withstand the challenges of extreme weather conditions such as high temperatures, rain, mud and snow. Potential technical failures of RFID tags in PAYT applications have to be safeguarded against with fallback processes (Löhle & Urban, 2008).
Technical measures like locked waste bins or containers are beneficial to the introduction of PAYT in order to prevent misbehaviour (Reichenbach, 2008).
The integration of RFID in the context of PAYT takes one year to be fully operative, mainly due to the required data management system and the IT infrastructure (Löhle & Urban, 2008).
Bins need to be securely locked to hinder waste tourism (people throwing their waste into other users’ bins).
Benefits of using PAYT
Commercial benefit: PAYT incentive schemes or reward system-based waste recycling provide opportunities for municipalities and waste hauliers to earn money from waste. In contrast to charging fees by waste volume or weight, this scheme provides incentives for recycling (Wyld, 2010).
The PAYT system provides the basis for highly transparent waste invoicing (Friedrich & Neidhardt, 2005).
The waste haulier profits from permanent waste bin inventory checks. This additional transparency reduces costs for falsely unacquainted bins and containers (Friedrich & Neidhardt, 2005).
PAYT leads to higher collection of recyclables and increased revenues from selling them (Bilitewski, 2004).
The waste haulier can profit from competitive advantages due to relatively high initial investments that could prevent competitors from accessing the market. For PAYT users, the system provides potential savings in waste fees. Overall, potential savings outweigh the initial investment (Friedrich & Neidhardt, 2005).
Experts note several environmental benefits: PAYT enables the reduction of collected residual waste in parallel to an almost proportional growth of the quantities collected by systems for source-separated materials (Reichenbach, 2008). Further development and advanced standardisation of RFID transponder technology could enable increased transparency of waste masses and allocation, which will allow paperless waste haulier route planning and bin cleaning planning (Löhle & Urban, 2008). Waste hauliers have a greater understanding of supply and demand and may be able to profit from reducing their truck pool (Friedrich & Neidhardt, 2005).
In Germany, where a third of waste collection uses RFID systems, municipal waste disposal has been reduced by 35 percent and recycling has been increased by 17 percent (Thomas, 2008).
Moreover, experts note that the closer the link between the waste charge and the actual amount of residual waste services received, the higher the tendency of people to engage in source separation and recycling efforts (Reichenbach, 2008).
SMART TRASH: Study on RFID tags and the recycling industry RAND Europe, I.A.R. and P3
Contract reference 30-CE-0395435/00-31
146
Inventory transparency, which accompanies PAYT roll-out, provides additional gains (~3 percent) for municipalities by assessing unacquainted bins and container (Friedrich & Neidhardt, 2005).
The implementation of PAYT reduces waste in bins and bags and encourages households to do home composting (Dahlén & Lagerkvist, 2010). It also leads to increased sorting of recyclables by private households.
Among the organisational benefits, experts recognise that waste hauliers and waste service providers can benefit from higher transparency of service and thus promotion of a more reliable public image. They also benefit from legally admissible emptying data for service confirmation, which helps prevent customer claims (Friedrich & Neidhardt, 2005). Waste collectors are also able to optimise their collection logistics based on generated data.
Another organisational benefit is that for PAYT users, the system eliminates tasks like the procurement and application of waste fee labels or waste fee tokens (Friedrich & Neidhardt, 2005).
Moreover, when stolen or unregistered bins are recognised by an RFID system, the clearance of the bin is aborted, and the free-rider problem is solved (Kreck, 2007).
Experts recognise PAYT as a fairer waste fee system from a user’s perspective (Friedrich & Neidhardt, 2005).
The higher general waste management costs are, and the more municipalities are forced to commit their residents to these costs, the more people will demand the chance to influence these costs. PAYT addresses this demand.
PAYT can already use a commercially available and industrialised RFID system set-up (Saar & Thomas, 2003).
Barriers to using PAYT
Commercial barrier: in densely inhabited areas accountability needs to be ensured via measures such as individually locked bins, locked container boxes and wire cages set up for a known circle of users. This leads to more difficult accessibility for waste collectors (Reichenbach, 2008).
In some countries, there is strong opposition towards PAYT, as citizens consider their privacy may be infringed or are afraid of being charged more for waste collections.
Municipalities need to ensure that a certain amount of waste reaches their waste treatment facilities in order to keep operating costs and amortisation at reasonable levels (Bilitewski, 2004).
Besides an increase in unregulated disposal to bypass the system, impurities in source-separated material can also grow as people can dispose of non-recycables in free or less costly waste streams for recyclables (Bilitewski, 2004).
Current regulations might not be strict enough to deal with misbehaviour regarding aspects such as littering, bypassing the system, etc.
Social barriers include the concern that PAYT users might avoid costs by burning waste or transferring it to outside the PAYT area (Bilitewski, 2004).
RAND Europe, I.A.R. and P3 RFID as a green technology: use case analysis
Contract reference 30-CE-0395435/00-31
147
A very strong barrier, as agreed by experts, is that management of PAYT for multifamily housing sharing one bin may lead to conflicts among the families.
The implementation of PAYT can also lead to household waste being disposed of at working places (Dahlén & Lagerkvist, 2010).
There are also several technological barriers, including shortage of storage capacity for source-separated waste in households, as well as poorly developed or not easy to use systems for selective waste collection (Reichenbach, 2008).
7.1.2 RFID-based filling level measurement
Use case summary:
Most current waste collection techniques are not efficient, since collection trucks usually empty waste bins at regular intervals. But, especially in the case of public waste bins and recycling containers for glass or paper, the volume of waste can vary seasonally or geographically.
The route and schedule of collection trucks can be optimised via statistical filling level data, gained by identifying and weighing bins using RFID. Each waste bin is equipped with an RFID tag, which is read while emptying the waste bin. Several collections are necessary in order to collect a sufficient amount of information to establish average filling levels. Using this input, optimised collection truck routes for each individual tour can be developed.
The advantages of an RFID-based filling level measurement system are decreased maintenance costs through fewer trucks and fewer tours, reduced taxes and fees, as well as less air pollution and emissions through fewer tours and lower loading weight. Furthermore, efficiency and flexibility of waste collectors increases.
Current waste collection techniques are often inefficient. In most cases, including private households, waste bins are emptied at regular intervals, irrespective of the bin filling level. Therefore, collection truck routes are longer than necessary or may drive through neighbourhoods where collection is not needed at a particular point in time. Optimisation of collection routes is of special importance, considering the fact that removal trucks are among the least efficient vehicles on the road (One Plus Corp., 2011).
This problem is even more pronounced in the case of public waste bins (e.g., recycling containers for glass or paper, waste bins in parks, etc.). The need for emptying varies significantly between different public bins, depending on the season and the location.
If future waste collection systems are to be more efficient, precise information on the bin filling level needs to be gained and communicated to the waste collector. This system needs to be automated because the problem with the traditional collecting scheme is that the data can be misread, misreported or mistyped, or workers can even refuse to collect the data manually (Arebey et al., 2010). Furthermore, this is time consuming and adds extra tasks to the truck driver’s core work.
As has been stated by Vicentini & Giusti (2009), “In order to design and implement a suitable urban solid waste system, the first task is to forecast the quantity and variance of solid waste as it relates to residual population, consumer index, season, etc. Then the major
SMART TRASH: Study on RFID tags and the recycling industry RAND Europe, I.A.R. and P3
Contract reference 30-CE-0395435/00-31
148
effort is to focus on optimizing the schedule and routing of transportation trucks considering cost, waste weight and volume, distances, road condition, etc.”
Collection costs can be reduced by up to 40 percent by using such a system because fuel consumption and air pollution will decrease (One Plus Corp, 2011).
In order to provide real time information about the precise bin-filling level, several solutions are currently being studied by various companies. Most of these use technologies such as ultrasonic sensors or cameras in order to measure the filling level and further GPS (Global Positioning System), GPRS (General Packet Radio Service) and GIS (Geographic Information System) technology to transfer the data to the waste collector and thereby enable real-time tour planning. RFID is only a secondary supporting technology and does not play an important role in determining the filling level in this process. Therefore, this use case will not focus on this scenario. For the sake of completeness, examples of this system include “SmartBin”, developed by an Irish company, and the Finnish MetroSense.24
The focus of this use case is on route optimisation via statistical filling level data, gained by identifying and weighing bins (similarly to PAYT). Each waste container is equipped with an RFID tag. Before emptying, the collection truck identifies the waste bin via an RFID reader and weighs the content. This information is uploaded into a database after the return of the truck to the collection centre.
After several non-optimised tours by the recycling truck during the introduction of the system, average filling levels can be established. Using this input, optimised collection truck routes for each individual tour are developed.
For example, some waste bins will have to be emptied twice a week, while others will only need one single emptying per week or even once every two weeks. The bi-weekly tours can therefore be shortened by only passing through the “bi-weekly full” bins and half of the “weekly full” bins, reducing the duration of the tours and therefore the emissions generated too. Thereafter, the collection truck continues to register and weigh the waste bins in order to detect changes in the filling-pattern of the bins. Such changes are then regularly integrated into the routes. By doing so, over-full waste bins can also be avoided.
Taking into account the focus on emptying public waste bins, another possibility is to include municipal event scheduling in the tour planning. Statistically calculated waste amounts can be predicted for public events.
Requirements Expenses for hardware as well as additional labour costs through bin tagging. There should be quantity and variance forecasts (Vicentini & Giusti, 2009). In terms of organisational requirements, truck driver training to get accustomed to
the new technology would be needed. Truck drivers would also need to be educated about the benefits of this system.
24 As of 8 February 2012, see www.smartbin.com and www.metrosense.com/waste-sorting/flv/wasteamount/animation.html
RAND Europe, I.A.R. and P3 RFID as a green technology: use case analysis
Contract reference 30-CE-0395435/00-31
149
Experience shows that a time span of one year is needed before a system with the required complexity runs reliably.
Public events or construction works on the route should be considered. To estimate savings, accurate information about the truck routes is necessary. The key technological requirement is having appropriate hardware. Experts also note that it is important for local communities to be educated about
RFID bin tagging, to reduce any health/privacy concerns that are sometimes associated with RFID applications.
Benefits of using RFID-based filling level measurement
Expert consultation has highlighted several commercial benefits, such as decreasing maintenance costs through fewer trucks and fewer tours needed; reduced taxes and fees; reduced emissions through fewer tours and lower loading weight; increased efficiency; and increased flexibility of waste collectors as they can use their resources for versatile tasks (One Plus Corp, 2011).
There are also substantial environmental benefits, including reduced fuel consumption and air pollution through decreased number of tours as well as reduced road works because there is less wear and tear on the streets (One Plus Corp, 2011).
Among organisational benefits, experts agree that with RFID technology, full/over-full containers can be avoided.
Barriers to using RFID-based filling level management Lack of appropriate understanding about the benefits of using RFID technology.
There needs to be an appropriate education programme aimed at different stakeholder groups – for instance local community members, truck drivers, etc. – about the costs and benefits of using RFID applications.
7.1.3 RFID-based waste sorting Use case summary: This use case describes the use of RFID to enable the extraction of homogenous waste fractions and/or the separation of hazardous materials (e.g., batteries) from non-homogeneous waste mixtures. Besides the required application of RFID tags, the availability of data on the material composition of the tagged products is essential. The main benefits of RFID-based waste sorting are seen in more purified waste fractions resulting in a higher market value for these fractions and subsequently less waste being disposed of in landfills. The requirement for data on the material composition of products could be problematic for manufacturers who do not want to share this information with competitors. An important trend in the waste processing industry (next to the preference for prevention and reuse over recycling) is the reorientation from a disposing towards a reuse/recycling
SMART TRASH: Study on RFID tags and the recycling industry RAND Europe, I.A.R. and P3
Contract reference 30-CE-0395435/00-31
150
economy, which requires sufficient management of material streams. This trend is encouraged by the Waste Framework Directive. Another trend is increasing material costs in the industrial sector, which are driving the transformation of recyclables into new materials.
In terms of waste stream management, it is essential to gather all information regarding material or product composition. According to Löhle et al. (2009), the lack of this information is impeding optimised and specific recycling of resources.
This use case describes the application of RFID technology in making the necessary data accessible to enable the extraction of homogenous waste fractions and the separation of hazardous substances or impurities from non-homogeneous waste mixtures, and build new potentials for the recovery of recyclables (Löhle & Urban, 2008).
An essential requirement for the use of RFID is the application of RFID tags to the products/items to which automatic sorting is going to be applied. To identify a product using RFID, embedded information such as a Universal Product Code (UPC) is necessary. Product codes might be used to sort items at a range of points along the EOL supply chain: in households, at kerbside, at recyclers, or for pre-processing before incineration, landfilling or smelting (Thomas, 2009).
As proven in the grocery sector, the use of a UPC provides potentials for savings. Similar savings might be applicable for the waste management sector (Thomas, 2009). As a result of the increase in product variety, and thus waste variety, through the introduction of UPCs it is logical to put more emphasis on waste sorting concepts (Thomas, 2009).
The applicability of RFID technology to waste sorting processes was assessed in a test facility at the Faculty of Waste Engineering at the University of Kassel. Successful identification of tagged packaging has been demonstrated by these tests (Löhle & Urban, 2009).
As described in Löhle et al. (2009), automatic and manual (traditional) waste sorting is composed of 5 steps:
1. The feeding and dispersion/singularisation of the fraction that is intended to be separated.
2. The identification of objects.
3. The identification of object location and position.
4. The classification of objects according to predefined identification requirements.
5. Mechanic or manual separation of identified objects (Löhle & Urban, 2009).
The main task for RFID is to enable step 2, the identification of objects within the waste stream. Although there are already other ways to identify materials in Material Recovery Facilities (MRF), such as optical sorting mechanisms, RFID has a high potential to increase efficiency (Löhle &Urban, 2009).
There are two ways of realising this task. Firstly, the identification of the object through additional information such as the material composition of the identified object stored in the tag’s memory, and secondly, just the identification of an object and the look-up of
RAND Europe, I.A.R. and P3 RFID as a green technology: use case analysis
Contract reference 30-CE-0395435/00-31
151
additional information in a database. After an object is identified, the system triggers an automated sorting mechanism or indicates the presence of an object by a signal and determines the object’s location within the stream.
A waste fraction that is pre-sorted in this way would be homogenous and therefore easier to deal with in subsequent recycling processes, which may also raise its market value.
In the subsidiary purification process phase RFID might serve as an additional control mechanism to ensure that pre-sorted waste from municipalities or industry does not contain objects that might contaminate waste fractions (e.g., through tagging of hazardous waste like batteries or oil cans).
According to Thomas (2009), items in focus are small electronics, batteries, products containing batteries or electronics, plastic-containing products, small fluorescent light bulbs, athletic shoes and specially tagged valuables.
In addition, Urban (2006) states that the main application field for RFID technology might be (pre-sorted) waste streams containing recyclable materials. A potential application for residual waste streams, where only the rejection of hazardous materials (e.g., batteries or electronics) seems realistic, does not appear profitable since residual waste is comprised of a large share of organic material and small- and medium-sized components (e.g., fragments) for which tagging is not expected (Urban, 2006).
Today, mandatory tagging may prevail only for some product groups. Two scenarios are possible: 1) a negative selection where a recycling process might benefit from the removal of products containing hazardous materials from the waste fraction; 2) a positive selection where products containing valuable materials are sorted out. The latter scenario might soon be adapted when manufacturers are required to or have an interest in regaining their products and are therefore willing to tag their products (Urban, 2006). Here the increasing prices for raw materials are seen as the main driver.
On the other hand, Urban (2006) states that “the public interest in increasing the recycling of batteries is based on environmental considerations rather than economic considerations. An environmental assessment of the costs and benefits of battery recycling would include environmental impacts of the entire lifecycle of the batteries, their material content, and the relative merits of recycling versus incineration or land filling”.
Referring to the earlier introduced lifecycle model this use case takes place in the waste processing phase and the subsidiary purification process phase. The main involved stakeholders are recyclers as well as manufacturers, as it is a prerequisite that manufacturers tag their products and/or packaging at an item level and provide information such as the material composition (either through storing it in the memory of the tag or in a database that is accessible to other stakeholders).
Requirements Commercial requirements: expenses for RFID hardware and middleware; expenses
for data management and maintenance; critical mass of products must be tagged to gain efficiency; individual tag location determination will generate additional costs.
SMART TRASH: Study on RFID tags and the recycling industry RAND Europe, I.A.R. and P3
Contract reference 30-CE-0395435/00-31
152
Environmental requirement: tags mustn’t alter the classification of already eco-friendly products.
Organisational requirements include: a common naming scheme (Främling et al., 2006); tags need to be applied directly to the product (Löhle et al., 2009); access to product information must be limited to authorised organisations (Löhle et al., 2009); closer cooperation between manufacturer and waste haulier (Saar & Thomas, 2003); data should be saved on a back-end system as they may not fit on the tag (Främling et al., 2006); waste processor need to assess the material's impact.
Technological requirements include: hardware and data infrastructure; long lifespan (Urban, 2006); classification criteria to be stored on the tag (Löhle et al., 2009); standardisation for common product identification (Jun et al., 2009); tags need to be suitably integrated, taking into account the material composition of the tagged product, size, frequency, orientation and placement of tags; to optimise tag readings a standardised use of the tag’s memory areas is required (Urban, 2006); in-stream product location needs to be reliable.
Benefits of using RFID-based waste sorting
Commercial benefit: more purified fractions are of greater value. Several environmental benefits, including: less waste in landfills; less hazardous
waste in landfills. Also, today’s impurified fractions can be further separated. There is also a strong technological benefit as RFID can support existing optical
sensor systems. Barriers to using RFID-based waste sorting
Commercial barriers: unnecessary increase in costs if tagged products do not need be extracted from waste fraction; differing frequency ranges; real benefit is questionable due to already efficient processes; Original Equipment Manufacturer (OEMs) don’t want to share product information with potential competitors.
Since today’s state of the art waste sorting processes are already efficient the additional benefit might be questionable.
Environmental barrier: raw material of the tag can hardly be recycled due to small quantity (Löhle & Urban, 2008).
Legal barriers: data protection laws may hinder use of stored information; user might unintentionally be associated with the tagged products; information gathering might infringe privacy protection laws (Löhle & Urban, 2008).
Organisational barriers: huge amounts of data require complex coordination of back-end systems; interrupted information chain if tag is removed from product by user; common standardisation efforts among all stakeholders needed (Urban, 2006).
Social barriers: removed or destroyed tags have negative impact on efficiency; successful systems might make consumer pre-sorting obsolete.
Technological barriers: metal or other materials can have an impact on tag readability, as can metal-coated product packaging (Löhle et al., 2009); tags using
RAND Europe, I.A.R. and P3 RFID as a green technology: use case analysis
Contract reference 30-CE-0395435/00-31
153
differing coding schemes can have negative impact on reading rate (Urban, 2006); differing working frequencies are hindering cross-sector operation (Urban, 2006).
7.1.4 Consumer purchase decision support based on environmental performance Use case summary: The consumer purchase decision support (CPDS) use case describes the use of RFID on products to support the consumer’s decision when he or she is about to purchase a product. Here RFID facilitates the look up of product-related information regarding its environmental performance (dynamic carbon footprint, energy consumption, hazardous materials). The main requirements for this use case besides the tagging of the relevant products are the availability of adequate ICT infrastructure and the needed product information. The main benefits are of a environmental and commercial nature, setting incentives for manufacturers to produce more eco-friendly or fair products. The high investment costs caused by the required ICT infrastructure and the market penetration of NFC-enabled devices in Europe are problematic. Also, standardisation of environmental performance information and organisations providing fair and reliable data would need to be set up or supported at a political level. Consumer awareness is also a strong prerequisite.
This use case describes the use of RFID to facilitate the look up of product-related environmental information for eco-friendly consumers at the point of sale using a mobile device (e.g., an RFID-enabled smartphone in combination with service applications). The products in focus are mostly consumer-packaged goods (CPGs), vehicles, electronic devices (PCs, mobile phones, flat-screens, etc.) and products containing hazardous materials.
This use case is partially based on the ideas and concepts of previous studies and of various experts who revealed the challenges of carbon footprint accounting and its possible influence on a consumer’s purchase decision.
To have any possible influence on a consumer’s decision, the first essential requirement is to make the information about a specific product publicly available. This is secured by providing a Product Lifecycle Management (PLM) database that contains useful and interesting facts about the product. This database is fed by the manufacturer with information about the product (e.g., product ID, its composition, place and state of production). The manufacturer is either forced to legally include information about the product, or the manufacturer provides this information voluntarily, thereby highlighting the eco-friendly or fair-traded features of the product. Pilot studies demonstrate increasing ambitions to voluntarily inform consumers about the carbon footprint of products (Thomas, 2008).
The data provided to the consumer can either be random information about the product itself (e.g., product composition, manufacturer), and/or recycling advice that supports the right disposal method (Urban, 2006). Both types of information can influence purchasing
SMART TRASH: Study on RFID tags and the recycling industry RAND Europe, I.A.R. and P3
Contract reference 30-CE-0395435/00-31
154
decisions since eco-friendly waste management at the EOL phase is of major interest to eco-friendly consumers.
RFID technology can provide consumers with information about a product due to its capability to bridge the digital and the physical world (Riekki et al., 2006). For this to work, it is necessary to a) equip the consumer with a reading device, and b) to integrate an RFID tag on the product and/or its packaging. Later on, the tag will be used to look up information in databases with the help of a mobile device. Mobile devices are evolving into constant companions (Reischach et al., 2009a). It is logical to consider them as the most relevant device to use, especially taking into account that mobile apps are more preferred by users than web browsers. These applications are easier to handle and provide faster services (Parks Associates, 2010). They also involve ubiquitous services (Reischach et al., 2009b) such as fetching product information to confirm the authenticity of goods (Friedlos, 2011).
A technological alternative already in use today is the barcode (1-dimensional or 2-dimensional). Consumers can already use this technology with most mobile phones. An integrated camera is the only technical prerequisite to scan the code, although the camera and the product code always have to be in line of sight. Barcode labels are also very sensitive. They can be easily obliterated by contact with liquid substances or scratching.
These difficulties can be overcome by RFID tags, which can be read, for example, using Near Field Communication (NFC). The latest smartphones of diverse brands (e.g., Nokia, Samsung, Google) provide NFC functionality and can thereby read NFC tags and most high frequency (HF) tags that comply with ISO/IEC 18092. Today, NFC is already applied in electronic payments (e.g., in supermarkets) and for ticketing in stadiums (Tagawa, 2011). Forrester Research Inc. (2011) named NFC as its top mobile trend for 2011. The outlook shows that more mobile phone makers and even a tablet PC manufacturer will launch NFC products in the near future. Other research work states that by 2014 one in six users will have an NFC-enabled smartphone (Tagawa, 2011). Unfortunately, the read range of NFC tags is not wide enough to be used for supply chain monitoring.
Alternatively, two tags on a product can be integrated, one for HF and one for UHF (ultra-high frequency). But this is likely to be too costly and cumbersome. Two possible developments might solve this dilemma: either the application of a dual band tag or the equipment of mobile devices with UHF reader modules.
The feasibility of a dual band tag antenna has been demonstrated by manufactured prototypes (Mayer & Scholtz, 2008). A smartphone with a UHF reader module is expected to have enormous potential in the consumer market (Friedlos, 2011). SK (South Korean) Telecom developed the first inexpensive RFID UHF reader module in 2011; it can be integrated into mobile phones, and its usability has already been tested. Furthermore, SK Telecom has also developed a prototype integrating both UHF and HF reader modules, to eliminate the need for multiple separate readers (Friedlos, 2011).
This use case has focused mainly on environmental data on products available to the customer. To gather this information, a suitable method of providing relevant data needs to be in place.
RAND Europe, I.A.R. and P3 RFID as a green technology: use case analysis
Contract reference 30-CE-0395435/00-31
155
Current Greenhouse Gas (GHG) accounting cannot determine the carbon footprint of individual products. However, with RFID technology customers can get accurate information about the CO2 emissions of a particular product. Emission-relevant data are dynamic in the sense that they change with time and among different variations of the same product. These frequent variations have implications for calculating the product carbon footprint values (Dada et al., 2009). With RFID they can be assigned to a specific product at item level (e.g., reflecting changes or improvements in the production process).
For example, the Electronic Product Code (EPC) (Dada et al., 2008) network can provide carbon footprint-related data to a consumer using the specific ID-number of the product, which is stored and classified in the EPC Discovery Service. In this case, the particular product-related emission can be compared to the average and the deviation displayed on the consumer’s mobile device (Dada et al., 2009). One alternative to EPC provider EPC Global Inc. – beside some others – is ID@URI, an identifier format linking tangible goods to their information sources on the Internet. However, EPC is the state-of-the-art in this field at present.
Requirements Consumers need to be properly equipped with an appropriate reading advice that
can recognise an RFID tag. Before entering the market, goods should be tested and rated by non-profit
organizations such as environmental or consumer protection agencies, so that consumers do not have to solely rely on the manufacturer’s information.
Initial expert consultation also uncovered several requirements, including: o The need for a regulatory framework regarding product information
availability as well as security and privacy issues. o Commercial requirements: tag prices need to be feasible. There are also
expenses associated with RFID infrastructure and data management. o There is a need for a business model to measure the value of using RFID
in this consumer support context. o The tag itself must not significantly alter the carbon footprint of the
product. o In terms of organisational requirements, experts noted that a
manufacturer-independent recommendation system should be implemented and situation-dependent information should be made available (the position of a consumer, determined via GPS, influences the carbon footprint of the product’s transport logistics).
o Research on more efficient ways to display carbon footprints on mobile phones is needed. A common vocabulary should be adopted.
o Overall, there should be security, controllability and social acceptance. o The application should propose near-by alternatives (e.g., the same type
of food manufactured in a more eco-friendly way or closer to the customer).
o There needs to be an appropriate hardware/infrastructure, middleware and adequate storage and administration for information.
o Tags need to be suitably integrated with common and comprehensive standards.
SMART TRASH: Study on RFID tags and the recycling industry RAND Europe, I.A.R. and P3
Contract reference 30-CE-0395435/00-31
156
Benefits of using RFID to contribute to CPDS
The application of RFID has benefits for the retail logistics sector. After the entire logistic process has been completely tracked and traced, the generated data are used to create a consistent product lifecycle assessment (LCA), e.g., the dynamic footprints of products. LCA is a standardised methodology (ISO 14040 series) that quantifies resource consumption and potential environmental impacts of products traced over their entire lifecycle (Dada et al., 2009).
RFID technology is cost-effective for the retailer, who can store and categorise goods more efficiently.
Consumers also benefit from using RFID-enabled mobile devices (e.g., smartphones) to request product information and to make purchases. Consumers become more empowered because they can make comparisons in terms of eco-friendliness across a range of products.
The use of RFID allows consumers to rate a product and to express their experiences with their purchase. Several shopping platforms, notably Amazon, already provide rating possibilities (Thomas, 2008). This practice contributes to the notion of a decentralised consumer, which is deemed of high value (Reischach, 2009).
The initial expert consultation has further contributed to greater understanding of the benefits, including:
o Commercial benefits: RFID would enable real-time decision making as well as checking of the authenticity of goods.
o Environmental benefits: less GHG emissions through carbon footprint awareness promotes eco-friendliness, which in turn could result in less landfill and decreasing energy consumption.
o There would be an increased level of granularity of carbon accounting. o RFID could have social benefits by informing consumers and helping
them make more rational decisions. o Use of RFID could contribute to the increase in this area of research.
Barriers to using RFID to contribute to CPDS
Substantial monetary costs, at least in some cases (for instance, initial costs associated with setting up RFID technology).
Costs associated with the development of carbon footprinting, which tends to be time consuming and expensive.
From an environmental point of view, experts note that tags can lead to supplementary pollution.
A huge organisational effort is needed to guarantee information availability. Consumers might not adopt the system. From a technological perspective, item tagging is not economically feasible, and
liquids and metal have a negative impact on readability. Experts also note that NFC tags might not be the ideal choice, due to their limited
read range.
RAND Europe, I.A.R. and P3 RFID as a green technology: use case analysis
Contract reference 30-CE-0395435/00-31
157
Selecting the right application from a high number of offered applications may be difficult.
7.1.5 RFID-based disposal decision support (sell, donate, repair, dispose) Use case summary: The disposal decision support use case describes the use of RFID to support the consumer’s decision when the tagged product is no longer of use. Here RFID facilitates the look up of product-related information in relation to what to do with it (sell, donate, repair, dispose) or how it should be handled (how and where to dispose it) when it is at the intersection between the MOL and EOL phases. The main requirements for this use case are the RFID tagging of the relevant products and an adequate ICT infrastructure to enable consumer access to the needed data. The main benefits are environmental and commercial. The challenges of this use case are relatively high investment costs (caused by the tagging of products), the back-end systems needed, and the availability of reliable data to support an informed customer decision. This use case assesses the use of RFID to facilitate the look up of product-related information in relation to what to do with it or how it should be handled when at the intersection between the MOL and EOL phases.
The products in focus for this use case are mostly consumer packaged goods (CPGs), electronic devices (e.g., PCs, mobile phones, flat-screens), and other products containing hazardous materials like car batteries or oil cans.
Due to today’s heavy industrial processing in EOL operating enterprises, and labour-intensive piecework as in computer refurbishing, a need for optimisation and an increase of efficiency in these processes is required, along with the increased involvement of consumers (Thomas, 2009).
To gain consumers’ commitment, they need to be able to benefit from these applications directly or indirectly. By supplying information about a product (e.g., material composition, manufacturer, place of production, estimated expiry date) purchasing decisions are made easier and more rational, and recycling decisions support the right disposal (Urban, 2006). The availability of this information to consumers may satisfy the so-called “Green Conscience” and may benefit local enterprises by securing the authenticity of purchased goods, and by contributing to savings on disposal fees.
Technically this could be realised by using RFID technology combined with mobile devices such as smartphones, as described above.
Additionally, the mobile device could be equipped with a GPS module that would enable location-based services – showing the user the way to the next recycling centre or helping people to adapt to specific regional recycling policies. A mobile phone equipped with an
SMART TRASH: Study on RFID tags and the recycling industry RAND Europe, I.A.R. and P3
Contract reference 30-CE-0395435/00-31
158
integrated camera might also serve to directly upload pictures of the identified product to an online auction service or to a repair shop.
RFID should be taken into account as a possible technology to apply the mandatory tagging of recyclables (Vogel & Strassner, 2004). RFID application at an item level, enabling refurbishment and reuse, is seen as a promising application by many authors (Thomas, 2008).
“Owing to RFID technology, a PLM system can gather accurate data related to product lifecycle history at the collecting and dismantling phase of EOL products, e.g. which components they consist of, what materials they contain, who manufactured them, and other data that facilitate reuse of materials, components and parts.” (Jun et al., 2009)
Requirements Technological hardware/infrastructure:
o Internet. o Mobile phone capable of reading RFID tags and with internet access and
operating at the same RFID frequency used by the manufacturer and retailer.
Optionally able to determine its own location (e.g., through GPS).
Optionally able to take photos. o Easy to use mobile application/product look-up service. o Data availability (product data, shop data, disposal data). o RFID tags and readers. o Material needs to be tagged at item level. o Back-end systems need to be implemented, sinceit is not feasible to store
all relevant PLM data on the tag (Främling et al., 2006). o Tags need to be suitably integrated, taking into account reading materials,
size, frequency, orientation and placement of tags, in order to handle still existing technical limitations of RFID (Jun et al., 2009).
o The use of RFID in all PLM phases does require new standards, especially regarding different kinds of product identification IDs and the required architecture for data transmission (Jun et al., 2009).
o The ideal tag location needs to be determined for each type of device. This will result in additional costs for the manufacturer compared to existing packaging labelling practices (Urban, 2006).
Benefits of RFID-based disposal decision support
Commercial benefits: RFID is an efficient protection from counterfeit products; RFID enables more efficient supply chains; and waste management costs could decrease as more products end up in the right treatment paths.
Environmental benefits: fewer products disposed of because more are recycled and reused; less incorrect packaging disposal.
Organisational benefit: efficiency of waste processes increased through pre-sorting by consumer.
RAND Europe, I.A.R. and P3 RFID as a green technology: use case analysis
Contract reference 30-CE-0395435/00-31
159
Social benefits: more awareness of disposal rules; increasing awareness of charity organisations; social conscience of consumer satisfaction; availability of information technology abroad as more functioning used products could possibly be sold to secondary markets providing, for example, better education access in developing countries.
Technological benefit: USIM card phones might serve as a substitute for fixed interrogators; a passive tag would be sufficient.
Barriers to using RFID-based disposal decision support
Commercial barriers: investment costs; increased reuse might reduce number of sales; expenses for back-end data management.
Environmental barriers: supplemental environmental pollution through item-level tagging; tag itself might alter a product’s carbon footprint.
Social barriers: consumer might not adopt the system; older generation of users might have difficulties using modern technology.
Technological barriers: differing requirements among involved stakeholders. Commercial requirement: tag prices need to reach feasible level. Legal requirements: potential need for a regulatory framework regarding product
information availability; need for a regulatory framework regarding security and privacy issues.
Organisational requirements: information availability; common standard for product ID; consistent placement of symbols; common naming scheme.
Technological requirement: hardware/infrastructure; individual tag location determination.
SMART TRASH: Study on RFID tags and the recycling industry RAND Europe, I.A.R. and P3
Contract reference 30-CE-0395435/00-31
160
7.1.6 RFID-based WEEE end-of-life processes Use case summary:
Waste electronic and electrical equipment (WEEE) represents the fastest growing waste stream in Europe. A lot of precious materials but also hazardous substances are contained in WEEE. RFID could enhance collection, disassembly, reuse, refurbishment, recycling, reassembly and disposal processes. The cost-saving effects presumed in electronic equipment EOL handlings are comparable to those in certain retail businesses.
RFID could greatly improve the recovery of value from EOL equipment and provide for safer WEEE treatment, enforce individual manufacturer responsibility, and therefore push for more eco-friendly designs.
The need for relatively high up-front investment in necessary hardware installations and for organisational changes in the recycling industry are one of the strongest barriers here. Also, RFID-based procedures can only become effective following a long lead-time, until tagged EEE products have penetrated the market and end up in EOL processes.
Common standards for a lifecycle-phase overarching PLM or at least for appropriate tag data content could foster the uptake of RFID in WEEE EOL processes. Also setting the right framework, incentivising eco friendly design through a strong manufacturer individual allocation of the of direct and indirect disposal costs, could foster the uptake of this use case.
This use case describes the utilisation of RFID to enhance EOL processes for electronic and electrical waste, which in the EU falls under the scope of the RoHS and WEEE directives. E-waste is the most rapidly growing waste stream in Europe and is increasing at a rate about three times faster than average (Parlikad & McFarlane, 2004). Some sources state a very high potential for future RFID-based EOL handling (Busch, Pötzsch, 2005; Jun et al., 2009). (EOL is the phase where EOL products are collected, disassembled, reused, refurbished, recycled, reassembled or disposed of (Jun et al., 2009), with potential RFID enabled cost-saving effects equal to or even higher than certain retail businesses (Thomas, 2009)).
The basic assumption for this use case is that future electronic devices will be tagged with an RFID label containing either unique product code data (Thomas, 2009) or even a label with more information, enabling item-level PLM. Some concepts even foresee the label containing, for example, the item’s individual maintenance history (Harrison et al., 2004).
At first, the consumer’s decision whether to dispose of an item or sell it can be supported. The consumer could assess the tag data with an NFC-enabled device such as a mobile phone (Friedlos, 2011). Should the consumer be advised to dispose of the item in question, RFID can be utilised to facilitate the consumer disposal process, indicating where the equipment needs to be brought to for disposal in a consumer-convenient and environmentally optimal way, fully conforming to the legislative framework in place. These aspects are outside the scope of this use case and are dealt with in Section 7.1.5.
Secondly, RFID can inform the consumer about the correct recycling operator’s site. The selection could take several aspects into account:
RAND Europe, I.A.R. and P3 RFID as a green technology: use case analysis
Contract reference 30-CE-0395435/00-31
161
Choosing operators who are specialised in dismantling or recycling a certain kind of device or recycling specific materials.
Choosing operators who are contracted by the OEM of the electronic device, enabling a manufacturer specific allocation of disposal cost (Löhle & Urban, 2008).
Thirdly, at the recycling operator’s site, the construction plans of the device could be assessed in order to enable best-practice dismantling operations. In this case a unique product code can be read from the RFID label, enabling the operator to access the device’s construction and material composition data via an externally stored database, most probably accessed via the Internet. If the identifier contains a larger amount of data allowing item-level PLM (Hans et al., 2010), intra-device part replacements and maintenance information could be stored in back-end database systems (at present, the option of having all data contained on the tag is only considered feasible for high-value objects.)
Having assessed this information, the operator would be able to:
Estimate the value of the device or the precious materials contained within it. This value could therefore be best manifested by either reusing the device, refurbishing it, remanufacturing it, cannibalising the device or recycling its materials, thus supporting the decision on how the device should be treated optimally (Parlikad & McFarlane, 2007).
Obtain information about how to dismantle the device and about potential hazardous substances contained within it. The optimal workplace and environmental protection legislation conformant procedures to dismantle can be chosen (Löhle & Urban, 2008).
As part of a visionary concept, literature indicates the possibility of “self-recycling-devices”, where RFID information enables a product to be processed by semi- or even fully automatic dismantling lines (Busch & Pötzsch, 2005).
Tracking WEEE EOL devices through RFID would also allow a real assignment of the recycling cost of a device to its manufacturer. So far, this is mostly implemented by making the manufacturers or retailers pay for the recycling of the same number of devices that they brought into the market. Therefore no real incentives currently exist for manufacturers to redesign their products in a more eco-friendly and easy-to-recycle way.
Requirements “A unique product identifier (e.g., EPC).
Radio Frequency tags and readers to ensure timely and automatic identification of product.
Filtering, collection and reporting mechanisms for managing tag reads.
An interface to a distributed product information database (e.g. the EPC Information Service) linked to an information look-up service (the Object Name Service) to ensure completeness and accuracy of product information.
SMART TRASH: Study on RFID tags and the recycling industry RAND Europe, I.A.R. and P3
Contract reference 30-CE-0395435/00-31
162
Standardised vocabularies for communication across the supply chain.” (Busch & Pötzsch, 2005)
Benefits of using RFID for WEEE end-of-life processes RFID could help WEEE waste end up in the right waste stream. Electronic and
electrical devices are often wrongly disposed of in mixed domestic waste. Through RFID, WEEE waste could be detected in domestic waste and separated from it. This could help to raise the recycling rate and partially solve the problem of inappropriate disposal (Löhle & Urban, 2008).
“Tags could increase recycling efficiency. Tags on electronic equipment could be linked to Web sites showing how to dismantle the product and how to make it easier for consumers to resell the items on the Internet.” (Thomas, 2008)
On entry of the product to the recycling site, the transmitted or queried information (age, composition, components) could serve as a basis for deciding whether to reuse, repair or cannibalise certain components. RFID-based dismantling would also be economically beneficial and environmentally friendly (Löhle & Urban, 2008).
In a mechanical treatment facility, material balances could be created if all treated devices entering it were equipped with RFID tags. The material composition of the devices going in could be read from the tags and compared with the weight of the recovered materials, allowing for an automated recycling quota determination and generating data to improve the facility’s efficiency (Löhle & Urban, 2008).
Moreover, the following benefits have been highlighted during the initial round of expert consultation:
o Commercial benefits: recyclers become more specialised; increasing profits through resale of returned products.
o Environmental benefits: increased reuse of products or parts; increased recycling rates; better handling of hazardous substances; less waste produced due to higher recovery rates; eco-design fostered in the long term.
o Legal benefit: recycling targets and manufacturer responsibility could be enforced or controlled.
o Organisational benefits: more specialised, safe and efficient workplaces established at recyclers; higher degree of automation; improved decisions through better information.
o Social benefits: image of waste management industry may improve; awareness of EOL processes may impact on purchase decisions; as more reliable information about used devices is available, trade in quality parts could be enabled.
o Technological benefits: better visibility of whole product lifecycle; more efficient disposal logistics; more automated dismantling processes; better material and value recovery.
Barriers to using RFID for WEEE end-of-life processes One problem for the implementation of the RFID-based procedure is a high lead
time: “To benefit from RFID in the disposal phase, every product needs at least
RAND Europe, I.A.R. and P3 RFID as a green technology: use case analysis
Contract reference 30-CE-0395435/00-31
163
one tag. This is problematic especially regarding the market penetration of long-life products even when product tagging would be mandatory from now on for each product.” (Urban, 2006)
“Unlike conventional manufacturing and assembly processes, demanufacturing and disassembly operations are characterised by a high variety in the type, quality, and condition of raw materials (i.e., returned products) and because of the numerous options available, this leads to high levels of uncertainties in determining the destiny of a product at the end of its life. As a result of the uncertainties associated with returned products, effective recovery of value requires extensive information about the product identity and its condition at the time of return.” (Parlikad & McFarlane, 2007)
In addition, the following barriers and requirements have been highlighted during the initial round of expert consultation:
o Commercial barriers: investment in automation; increased reuse could decrease number of sales.
o Legal barrier: current legislation doesn’t set the right incentives. o Organisational barriers: new knowledge profiles and working methods
needed; there is a need for specialisation. o Social barrier: stakeholders might not be willing to invest. o Technological barrier: high costs of infrastructure for collectors and
recyclers; automated dismantling might be very complex. o Commercial requirements: expenses for RFID infrastructure must be
acceptable for ELV handlers/recyclers; expenses for RFID infrastructure must be acceptable for OEMs; expenses for information handling and maintenance have to be considered.
o Legal requirements: manufacturer-specific allocation of disposal costs should be fostered; product ID cannot be deleted after point of sale (POS).
o Organisational requirements: product information about usage needs to be available at EOL; common standards.
o Social requirement: benefits of the system need to be promoted and become a selling point.
o Technological requirements: hardware/infrastructure; products or components need to be tagged; back-end systems need to be implemented and maintained; tags need to be suitably integrated; standards for identification; determination of placement of every single tag generates additional costs.
SMART TRASH: Study on RFID tags and the recycling industry RAND Europe, I.A.R. and P3
Contract reference 30-CE-0395435/00-31
164
7.1.7 RFID-based ELV end-of-life processes
Use case summary:
RFID could enhance the dismantling process of ELVs. Dismantling and depollution information needed to enhance vehicle treatment could be made available through RFID tagging of vehicle components or a PEID.
The status of exchanged parts in the vehicle that are still in adequate condition could be assessed, enabling greater reuse and resale of the used parts, since, for example, the vehicle’s maintenance history would be immediately available to the dismantler. This use case would also allow for a better monitoring of recycling quotas.
Next to a common standard of car part tagging and related data, investment and change of work processes would be needed from dismantlers. As car manufacturers seem to prefer to shred vehicles as a whole after depollution and then to separate the materials, the implementation and impact of this use case may be limited.
This use case describes the possible utilisations of RFID to enhance the treatment of ELVs, which generate between 8 and 9 million tonnes of waste per year in the European Union. To manage this waste, the ELV Directive was officially adopted in September 2000. It aims to make vehicle dismantling and recycling more environmentally friendly, setting clear quantified targets for reuse, recycling and recovery of vehicles and their components; and to push producers to manufacture new vehicles with a view to their recyclability.
The basic assumption for this use case is that an ELV and/or its subcomponents will be tagged with RFID labels containing a unique product code, or vehicles will be equipped with an RFID-enabled Product Embedded Information Device (PEID) (Cao, et al., 2009).
The literature (e.g., Vogel & Strassner, 2004) refers to the two options as:
Part-tracking: The car components are tagged, allowing for their identification. Related PLM data or item-level PLM data of the components are stored in back-end systems. RFID part-tracking could become an option in the near future as OEMs are obliged to mark recyclable materials and components. Simple, passive tags seem to be sufficient to identify related materials and components.
Soft-tracking: A tag with higher memory content is attached or integrated in the car’s bodyframe. It contains a unique identifier for the vehicle, and information about the car’s production parameters at the BOL phase. The data are continuously updated during the car’s MOL phase, recording, for example, registration information, license plate, usage parameters, repairs/part exchanges and maintenance information (Cao et al., 2009). At the EOL phase, certain procedures (e.g., if the car has already been depolluted at the treatment facility) could also be recorded in the PEID.
The EU-funded project PROMISE has developed an embedded “tagging” system that can record information on a product throughout its entire lifecycle, while the EU-funded CONCLORE project acquires PLC information using PEID devices (mostly RFID tags) integrated into automotive parts. Using PEID, tracking and tracing with advanced sensors
RAND Europe, I.A.R. and P3 RFID as a green technology: use case analysis
Contract reference 30-CE-0395435/00-31
165
and planning functionality for automated identification, sorting, classification, and routing during dismantling recycling and continuous quality reprocessing is improved (Khan et al., 2006).
There are several steps associated with treatment of ELVs; one is depollution. Here, hazardous substances like fuels, lubricants, tyres, airbags and batteries are removed. RFID could facilitate the choice of how such items are treated. They may be reused, reprocessed or recycled depending on the information available on the car’s PEID, or based on the specific components indicated on the tag. Based on the most economically feasible option, the transmitted or queried information (age, composition, components) could serve as a basis for deciding whether components should be reused, repaired or cannibalised.
RFID might provide similar information when dismantling a car. For example, if a gearbox has been recently replaced, it could be reused. The dismantler would disassemble the components of the vehicle, which would be processed accordingly. At the same time, the newly generated lifecycle information and knowledge would be transmitted to the PLM system, thus closing the product information loop (Cao et al., 2009).
Moreover, literature suggests a visionary closed-loop Decision Support System (DSS) as a consequence of soft- and part tracking: The dismantler can improve decision-making at EOL, exploring the usage data and information – measured by RFID sensors. The current quality of the parts and components can be examined. The expected residual life for each component can be predicted using the DSS, by comparison with the relevant product lifecycle knowledge available in the PLM. Recovery decision-making is a process for generating a list of components to be removed from the vehicle, as well as for deciding on their further usage (i.e., by reuse or remanufacture) (Cao et al., 2009).
In a less visionary approach, existing DSS could be enhanced by connecting physical objects with computer systems though RFID (Harrison et al., 2004), thereby facilitating data queries from recycling support systems already in place. The operator would no longer need to search by product code for a specific component or look through the car production plans. The following DSS are used at present:
The International Dismantling Information System (IDIS) is a software tool developed by the major automotive manufacturers to make the recycling of ELVs more effective. The software contains information on the component parts of vehicle models, including how the parts are fixed, materials, weights, etc. The tool is designed to assist in the dismantling of vehicles and the subsequent recycling of ELV parts (GHK, 2006).
The International Material Data System (IMDS) is a collective, computer-based material data system used primarily by automotive OEMs to manage environmentally relevant aspects of the different parts used in vehicles. It has been adopted as the global standard for reporting material content in the automotive industry. IMDS recognises hazardous substances by comparing the entered data with lists of prohibited substances. The OEMs harmonised their requirements for materials used by their suppliers with the establishment of one list, the Global Automotive Declarable Substance List (GADSL).
SMART TRASH: Study on RFID tags and the recycling industry RAND Europe, I.A.R. and P3
Contract reference 30-CE-0395435/00-31
166
Requirements Commercial requirements: expenses for RFID infrastructure need to be acceptable
for ELV handlers/recyclers and for OEMs; there will be expenses for information handling and maintenance.
Environmental requirement: the smallest possible environmental impact needs to be a motivation for the manufacturers.
Organisational requirements: product information about usage needs to be available at EOL; there needs to be a common standard; organisational framework needs to be set up according to requirements; PLM system needs to be in place and accessible to all stakeholders.
Social requirement: benefits of the system need to be promoted and become a selling point.
Technological requirements: hardware/infrastructure; vehicles or components need to have PEID; back-end systems need to be implemented and maintained; tags need to be suitably integrated; standards for identification are needed as well as standardisation of hardware and data; data must be very reliable.
Benefits of using RFID-based ELV end-of-life processes It would improve the dismantling process by making it more efficient and less
costly, which is particularly important in light of the ELV Directive. RFID could contribute to greater take-up of existing tools for DSS. For instance,
even such data-sharing tools as International Dismantling Information System (IDIS) are available on CD-ROM and DVD, they suffer from low usage (GHK, 2006). RFID could make the use of these systems simpler and foster their uptake.
Additionally, RFID has potential for contributing to the sorting of parts during dismantling by automating this process (CONCLORE Project, 2007) and promoting “self-recycling devices”, as well as semi- or even fully automatic dismantling lines (Vogel & Strassner, 2004; Busch & Pötzsch, 2005).
The use of RFID could also foster the market for used vehicle parts. At present, only 1–2 percent of reusable car parts are resold. This is due, in part, to the asymmetry of information between buyers and sellers of used vehicle parts. Through the RFID-enabled possibility of tracking a car’s usage history and the replacement and maintenance of its components, this asymmetry could be decreased (Vogel & Strassner, 2004).
In addition to the benefits listed in the literature, the initial expert consultation has highlighted the following additional benefits:
o Commercial benefits: increased profits through resale of returned products; lower costs due to reuse.
o Environmental benefits: increased reuse of products or parts; increased recycling rates; better handling of hazardous substances; less waste produced due to higher recovery rates; eco-design fostered in the long term.
o Legal benefits: Easier control of recycling quotes and enforced manufacturer responsibility.
RAND Europe, I.A.R. and P3 RFID as a green technology: use case analysis
Contract reference 30-CE-0395435/00-31
167
o Organisational benefits: more specialised, safe and efficient workplaces established at recyclers; dismantling design will facilitate dismantling processes; EOL data could become valuable in the BOL phase.
o Social benefits: image of waste management industry gets better; awareness of EOL data influences BOL decisions; enabled trade in quality used spare parts to bridge developed and developing countries; opportunities for green marketing; counterfeited spare parts could be identified.
o Technological benefits: better visibility of whole product lifecycle; more automated dismantling processes; better material and value recovery; low PEID price in relation to car price; spare parts are more difficult to counterfeit.
Barriers to using RFID-based ELV end-of-life processes Main barrier: The automotive industry is investing in research into optimal post-
shredder fractions of ELVs. This would result in ELVs being shredded after depollution, making the use of RFID obsolete. This point was stressed strongly by the automotive industry.
Commercial barriers: high investment in automation needed; increased reuse could decrease number of sales.
Legal barrier: missing standards. Organisational barriers: for mass-produced models, the recyclers are aware of how
to dismantle them. The need for dismantling information is considered low for experienced operators.
Social barrier: stakeholders might not be willing to invest. Technological barriers: high costs for hardware and infrastructure; automated
dismantling might be very complex.
SMART TRASH: Study on RFID tags and the recycling industry RAND Europe, I.A.R. and P3
Contract reference 30-CE-0395435/00-31
168
7.1.8 RFID-based disposal management of healthcare waste
Use case summary:
Medical waste, mainly produced in hospitals, can cause a health risk. How to handle and dispose of such potentially infectious waste is therefore strictly regulated at both the national and European levels.
Several pilot projects have already been set up in order to test infectious waste tracking by RFID. The tags can collect information about the nature and origin of waste, date of transport or persons responsible. It can thus be assured that infectious waste ends up in an incineration plant instead of being dumped illegally, for example. Moreover, RFID can contribute to a better classification of waste, assuming that pharmaceutical products are tagged and can be distinguish in waste types. This can lead to less hospital waste due to less erroneous disposal. Other benefits of medical waste tracking include the minimisation of the exposure of waste treatment employees to the waste-connected risks, and better transparency.
But the pilot projects have also shown that the idea of RFID-based disposal management of healthcare waste is not mature yet. There are still too many technical, environmental and legal barriers. As regards tagging medical waste directly instead of waste bins, it should be remembered that healthcare waste includes organic waste or tissues that cannot be tagged.
The medical waste disposal sector deals with materials generated as a result of the diagnosis, treatment, and immunisation of human beings or animals. Healthcare waste, including biohazardous waste, can be generated by hospitals, dentists, nursing homes, blood banks, funeral parlours, laboratories and research centres. Infectious waste includes human remains and organ parts, waste contaminated with bacteria, viruses and fungi, as well as larger quantities of blood and used medical equipment (notably cottons, needles, scalpels, etc.). Some 80 percent of the generated waste in primary health care centres is non-infectious (WHO, 2005). But inaccurate disposal of infectious waste can lead, for example, to the spread of infectious diseases and to genetic defects. It is estimated that in a developed country, about 1–5 kilograms of waste is produced per hospital bed per day (Yadav, 2001).
This sector, due to its significant potential health risk to the populace, is heavily regulated on a national and European level. The applicable European directive for the management of infectious waste from the health sector is the Waste Framework Directive. Other applicable documents have been published in the last few years, for example:
Rules and regulations from the hygiene sector and epidemics legislation.
Technical guidelines for the logistics involved in waste disposal.
International standards for waste transport.
Regulations for the handling of biological working substances.
Other regulations from the public health and safety sector.
There have already been several pilot projects testing RFID systems for managing medical waste. One example is the Japanese incineration service Kureha, which set up a waste
RAND Europe, I.A.R. and P3 RFID as a green technology: use case analysis
Contract reference 30-CE-0395435/00-31
169
traceability system using IC (Integrated Circuit) tags in cooperation with IBM Japan in 2004. The testing was conducted at the Kureha Hospital in Fukushima prefecture (Das, 2011). The aim was to test effectiveness of RFID tagging in tracking medical waste materials. Illegal waste disposal can thus be prevented by creating accountability for hospitals and transportation service companies (Sullivan, 2004).
Further pilot projects were initiated in Korea and Taiwan. In the Taiwanese En Chu Kong Hospital a comprehensive RFID system has been implemented, including a new waste management system. This pilot project started in January 2004 in cooperation with Hewlett Packard and has been partially successful (Tzeng et al., 2008). On a final note, no detailed results of these pilot projects have been accessible so far.
Requirements From an organisational perspective, personnel need to be trained to prevent
frustration and uncertainty among those who are responsible for implementing the system.
Experts also noted several key technological requirements, including the necessity of having appropriate hardware/infrastructure; middleware; connection between systems and databases; and common standards.
Tag design must consider the characteristics of objects. In order for RFID tags to provide more precise information on the risk level of the
waste contained in bins, a minimum level of information should be collected, including:
o Weight in tonnes of the waste disposed o Nature and origin of waste o Date of transport o Persons responsible o Name and registered place of business of the disposal company or waste
logistics operator o Nature and location of the waste disposal (Daschner, 2000).
Benefits of using RFID-based disposal management of healthcare waste
The supply and use of some pharmaceutical products has to be accurately documented. RFID reduces the error rate in the documentation as well as the workload of clinic personnel. If pharmaceutical companies tag their products with RFID, information about product composition, production date, obligatory disposal process, etc., can be saved in a PLM database.
Although a detailed analysis of this does not form part of this study, it should be added that the tagging of the pharmaceutical products could be an efficient way to combat counterfeited medicaments, optimise the reverse logistics, and improve recall management.
In the case of tagged medicaments, RFID enables a permanent inventory insight, since products are registered as soon as they are in use. This information is also stored in a PLM database. Thus the hospital is able to control its medicament flows, detect any anomalies, and avoid abuse.
RFID also contributes to better classification of waste. Medical waste is very expensive to dispose of and a subsequent separation is not possible due to health
SMART TRASH: Study on RFID tags and the recycling industry RAND Europe, I.A.R. and P3
Contract reference 30-CE-0395435/00-31
170
risks. An efficient and precise sorting is already necessary right after usage. This could minimise the amount of waste that gets into the disposal cycle. But the classification of waste according to material or contamination is only possible if the definition allows a clear distinction of waste types (Daschner, 2000).
RFID reduces uncertainty among the personnel charged with classifying hazardous waste. Hospital departments, in which medical waste is produced, are equipped with different waste containers. There is also a distinction between two waste streams: non-infectious waste that will be treated like domestic waste, and infectious waste that has to be disposed of and treated separately according to legislation. An RFID reader on a waste bin would help identify the right waste stream and thus significantly reduce the amount of non-hazardous waste, which is often wrongly sorted into the hazardous stream. As a result, costs of hazardous waste increase. The amount of hazardous waste tends to be higher because if personnel are not sure whether waste is infectious or not, they would dispose of it as hazardous to avoid potential risks. However, this increases the amount of infectious waste unnecessarily. At disposal, the reader automatically indicates into which container the waste should be placed. It classifies the tagged waste into the correct category and opens the appropriate lid of the bin. This is possible due to a comparison with data on a PLM database (Mallett et al., 2007).
The biggest advantage, next to improving traceability compared to a paper-based system, is the minimisation of the exposure of waste treatment employees to waste-connected risks. As most identification steps are automated, hardly any contact with the bins or bags is necessary. It is conceivable that an automated transport system could also be established. Due to the use of RFID technology, the automated system identifies the medical waste and transports it to the correct treatment facilities inside of the plant within a minimum of time. It should be noted that medical waste is usually not stored but treated as soon as possible after collection.
According to the initial expert consultation, the following benefits could apply: o Less hospital waste due to less erroneous disposal o Illegal disposal prevented o Potential for higher cost transparency for hospitals o Cost reduction through labour reduction o Border crossing containers can offer detailed information to customs.
Barriers to using RFID-based disposal management of healthcare waste
Disposal cannot be fully automated, as hospital personnel will still have to decide ad hoc whether usually uncontaminated material has been contaminated while being used. This would make it necessary to dispose of it in a special way.
Some experts expressed their concern about the usefulness of RFID technology in managing the disposal of healthcare waste. In particular, some EU Member States, for instance Germany, stated that the current disposal management process is already efficient:
o There are already effective electronic verification procedures existing today (e.g., an electronic chain of custody that is been running in all German hospitals for one year).
RAND Europe, I.A.R. and P3 RFID as a green technology: use case analysis
Contract reference 30-CE-0395435/00-31
171
o Some experts expressed the view that the optimisation of these procedures regarding hazardous waste with RFID is not worth the effort, since the mass of infectious waste is not as significant as the mass of non-infectious waste and, additionally, the generation of infectious waste does only take place in a couple of areas like medical centres or quarantine units.
Waste disposal decision support may not be very useful since hospital personnel usually know how to dispose of waste already.
Infectious waste usually includes organic waste or tissues that cannot be tagged. Despite this barrier, according to the initial expert consultation, it is important to note that resource separation via RFID within the hospital is worth considering, together with its application in the supply chain, and for storage of medicines.
Overall, several commercial, environmental, legal and technological barriers have been outlined in the initial expert consultation, including:
o A large part of separation prior to disposal will remain manual. o There needs to be some monetary effort for implementation, at least
initially. o There will be additional costs for data management. o In terms of legal requirements, experts stressed the importance of having
strict legislation. o Moreover, there needs to be public pressure for implementation. o It is important to bear in mind that liquids and metal can reduce
readability of tags.
7.1.9 RFID use cases privacy assessment Although data protection is already legally regulated by EU directives, the mass application of RFID technology in daily life still raises privacy concerns. After assessing the use cases presented in this chapter, experts were asked to choose which privacy risks they considered relevant (from the complete list in the PIA framework Annex III). The “Privacy Impact Assessment (PIA) is a process whereby a conscious and systematic effort is made to assess the privacy and data protection impacts of a specific RFID application with the view of taking appropriate actions to prevent or at least minimise those impacts.” (PIAw@tch, 2011).
Furthermore, the experts were asked to estimate the likelihood of occurrence as well as the magnitude of the privacy risks. The experts had the opportunity to explain their understanding of the risks associated with the use case, and identify possible mitigation actions. The results are summarised below.
Uncontrollable data gathering from RFID tags was identified as the most relevant risk. The problem in the context of specific use cases could be access control over the personal data that could possibly be linked to the tags carried around on the owned products. This was proposed to be solved by introducing access control mechanisms. On top of this risk, insufficient access rights management would also be likely to create a strong impact. The problem is caused by the fact that access is not really limited to the owner of a (tagged) product. To overcome this hurdle, an authentication mechanism, such as password protection, was suggested.
SMART TRASH: Study on RFID tags and the recycling industry RAND Europe, I.A.R. and P3
Contract reference 30-CE-0395435/00-31
172
Although the combination of personal and product-related data was seen to exceed its purpose only with low probability, it would have a strong impact on the application. Where, when and how data would be collected should be clearly determined (e.g., by using privacy-by-design approaches).
The high likelihood of occurrence and the strong impact of missing erasure policies or mechanisms might lead to refusal by consumers. Therefore, a regular review to delete unwanted data is required.
Generally, educating users about the circumstances and purpose of data collection is important. It was highlighted that involved consumers need to know where, when and how data related to their person is collected. Proposals included tagging making tags identifiable by a commonly agreed symbol or a similar mechanism. In either case, unauthorized direct access to private data or involuntarily linking a person to its purchased products needs to be prevented.
7.2 Use case conclusions
7.2.1 Emerging themes across the use cases Based on literature research on each use case, dominant statements have been derived describing requirements, benefits and barriers. As mentioned before, these statements have been initially validated by several experts. In the following, the consolidated expert feedback is summed up as emerging themes across all use cases, likewise structured into main statements, benefits, requirements and barriers:
Consumer Purchase Decision Support (CPDS) is already possible using barcodes. RFID would only gain a handling advantage when there is no line of sight needed. This advantage may not justify the investment effort to use RFID.
RFID supported EOL processes for WEEE are seen as the most promising use case, as there is potential to save materials of high value and scarce resources. The electronic products market is the largest economic sector worldwide.
RFID in ELV EOL handling is not considered very promising by the automotive industry, since industry-funded research is focused on post-shredder technologies (sorting of shredded waste by, e.g., material density, magnetic separation, sieving) in order to gain a high recycling rate. Prior to that pressed car bodies are put into a shredder or condirator as a whole. As a result, RFID use for disassembly facilitation or automation is not seen as of high potential by the automotive industry.
The use case of healthcare waste is not considered to have a high potential impact in developed countries because the amount of infectious waste in clinics is low compared to other waste streams and non-RFID systems are already in place and working. Furthermore, most material only becomes infectious after a particular use and is thus not tagged adequately beforehand.

RAND Europe, I.A.R. and P3 RFID as a green technology: use case analysis
Contract reference 30-CE-0395435/00-31
173
Some use cases require item-level product tagging to be implemented whereas others will be successful with only tag-based infrastructure. Product tagging does not affect the processes of tag-based infrastructure and vice-versa. The tagging of the infrastructure characterized by a limited number of tagged items could already be beneficial to optimise EOL processes (as demonstrated by the implementation of PAYT, for example), large-scale consumer product tagging, especially for low-value products is considered to require additional drivers and benefits in the BOL and MOL phases in order to sustainable or profitable implementation.
At the moment, the incentives to invest in more efficient automated processes in EOL alone are considered insufficient. Waste management is considered mainly as an additional cost factor by manufacturers. Green marketing, change of environmental awareness and behavioural patterns, rising raw material prices and legislative actions enforcing a strong and manufacturer-specific product responsibility could change this framework conditions in the coming decades. A closed-loop supply chain with strong connections between all lifecycle phases, looping back from EOL to BOL by recovering most value from the waste streams, could become a main competitive advantage for manufacturers.
In this context, nearly all use cases have common standardisation prerequisites for item-level product tagging and PLM. In addition, this leads to the assumption that standardisation, either driven by the industry’s target of realising BOL and MOL optimisation or driven legislatively in EOL by sustainability demands, could lay the basis for further applications. At the moment, the need for common standards is prominent, as it is seen as a platform enabling scale effects to realize a broad spectrum of use cases cost efficiently.
Furthermore, and aside from business retention in terms of cost-benefit ratio or standardisation, experts pointed out that RFID technology has acceptance problems foremost at a social level, primarily consolidated in privacy concerns. Acceptance issues should be addressed through information campaigns, visibility of data usage and strong privacy regulations to realise potential environmental benefits enabled by RFID application in EOL. The potentially profitable end-to-end RFID application comprising BOL, MOL and EOL is in a tension field with privacy concerns that manifest themselves in the requirement to completely erase tag information at the point-of-sale, deleting any added value for subsequent EOL processes.
Strongest requirements valid for all use cases were:
Investment costs for hardware (tags, readers, etc.), middleware and system maintenance need to be passed on to all involved stakeholders according to an agreed cost allocation key.
Controlling tools to measure the actual savings and benefits in a reliable way need to be set up for all use cases.
Legal frameworks for privacy protection and comprehensive information/ education about implementation needs to be in place in advance to increase the user’s acceptance and make them feel comfortable with the system.
SMART TRASH: Study on RFID tags and the recycling industry RAND Europe, I.A.R. and P3
Contract reference 30-CE-0395435/00-31
174
Simple schemes and positive media coverage will gain wider acceptance of users.
The engagement and participation of involved stakeholders would be increased by common standards applicable to all stakeholders with regard to product information availability, product naming schemes and thus product identification, used systems and gained connectivity among these.
Robustness of the technical system is crucial to avoid cost-intensive parallel fallback processes. The system’s robustness has to cope with different environmental conditions changing several times along the lifecycle, depending on the particular circumstances the product has to pass through.
The environmental benefits of RFID most strongly stressed throughout the use case evaluations were:
Comprehensive product tracking over the entire lifecycle is the basis for reliable carbon footprint accounting.
Easier and safer handling of hazardous substances. They could be removed from waste streams more easily.
Strongest rated barriers valid for all use cases were:
Reluctance to invest, especially with regard to the time it will take even after investment to make the system run properly and until the costs will be amortised. Stakeholders also expressed concerns that a potential investment would not pay off under the current framework conditions. This is seen as the strongest barrier of all.
Assuming RFID implementation in EOL processes, the current role and technological capability of recyclers managing waste of complex products (WEEE and ELVs) potentially needs to be converted into a more specific product or waste stream specialisation, where nowadays generalisation is competitive enough.
Some processes (like car disassembly) are too complex and expensive to fully automate under the current framework conditions. Other processes will need to remain under manual control (like decisions about not tagging organic waste in the case of healthcare waste handling).
Tags could negatively influence existing recycling processes in terms of material insertion and contamination of waste material treatment processes as assessed in Chapter 5.
Derived from the use case assessment, the following table summarises significant correlations between requirements, barriers and benefits that are valid for all use cases.
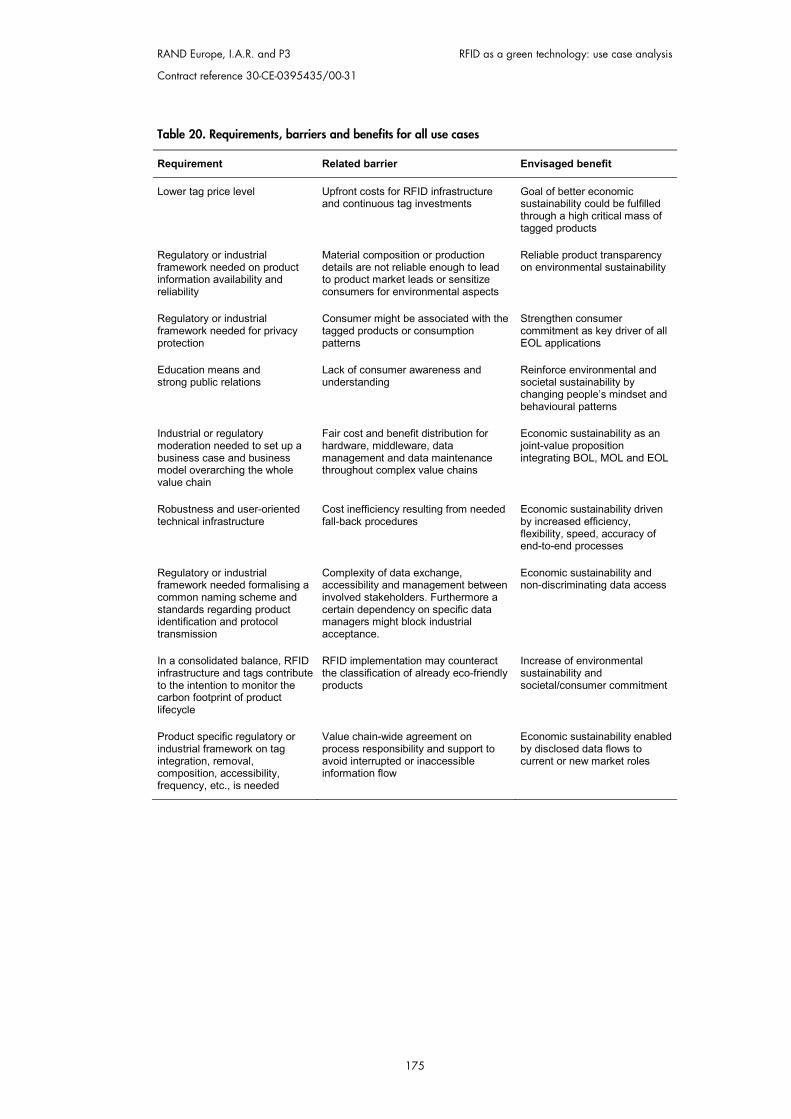
RAND Europe, I.A.R. and P3 RFID as a green technology: use case analysis
Contract reference 30-CE-0395435/00-31
175
Table 20. Requirements, barriers and benefits for all use cases
Requirement Related barrier Envisaged benefit
Lower tag price level Upfront costs for RFID infrastructure and continuous tag investments
Goal of better economic sustainability could be fulfilled through a high critical mass of tagged products
Regulatory or industrial framework needed on product information availability and reliability
Material composition or production details are not reliable enough to lead to product market leads or sensitize consumers for environmental aspects
Reliable product transparency on environmental sustainability
Regulatory or industrial framework needed for privacy protection
Consumer might be associated with the tagged products or consumption patterns
Strengthen consumer commitment as key driver of all EOL applications
Education means and strong public relations
Lack of consumer awareness and understanding
Reinforce environmental and societal sustainability by changing people’s mindset and behavioural patterns
Industrial or regulatory moderation needed to set up a business case and business model overarching the whole value chain
Fair cost and benefit distribution for hardware, middleware, data management and data maintenance throughout complex value chains
Economic sustainability as an joint-value proposition integrating BOL, MOL and EOL
Robustness and user-oriented technical infrastructure
Cost inefficiency resulting from needed fall-back procedures
Economic sustainability driven by increased efficiency, flexibility, speed, accuracy of end-to-end processes
Regulatory or industrial framework needed formalising a common naming scheme and standards regarding product identification and protocol transmission
Complexity of data exchange, accessibility and management betweeninvolved stakeholders. Furthermore a certain dependency on specific data managers might block industrial acceptance.
Economic sustainability and non-discriminating data access
In a consolidated balance, RFID infrastructure and tags contribute to the intention to monitor the carbon footprint of product lifecycle
RFID implementation may counteract the classification of already eco-friendly products
Increase of environmental sustainability and societal/consumer commitment
Product specific regulatory or industrial framework on tag integration, removal, composition, accessibility, frequency, etc., is needed
Value chain-wide agreement on process responsibility and support to avoid interrupted or inaccessible information flow
Economic sustainability enabled by disclosed data flows to current or new market roles

RAND Europe, I.A.R. and P3 Contract reference 30-CE-0395435/00-31
177
CHAPTER 8 Case studies of RFID as a green technology
In this chapter two case studies are conducted, resulting in specific cause and effect relation diagrams for green RFID usage in EOL processes.
Interpretation of these cause and effect relations is provided.
At the end of this chapter, the lifecycle overarching findings are summarised.
The process to select use cases for a more specific analysis within a case study assessment was driven by several considerations of comparable relevance. The most promising use cases were chosen according to their relevance to the tension field between the interests of industrial, societal and environmental sustainability. The case studies chosen, the first on WEEE and the second on CPDS, exemplify the importance of balancing and enforcing reaction loops throughout implementation and in-field management. Furthermore both case studies represent significantly different approaches and conditions within the tension field. Regulation played a major role in the RFID-enabled WEEE case study, whereas the individual consumer interest and participation was key to initialise and establish the RFID-enabled CPDS case study.

SMART TRASH: Study on RFID tags and the recycling industry RAND Europe, I.A.R. and P3
Contract reference 30-CE-0395435/00-31
178
Figure 71. Tension field of use case expert evaluation
Apart from these different leverages, the case studies cover the most promising, lifecycle and stakeholder overarching (cause-effect) factor relationships and correlations derived from the use case assessment as described in Section 6.2.
8.1 Case study 1: WEEE
The WEEE case study assessed the use of RFID in the EOL phases of electrical and electronic equipment. The conditions, requirements and barriers for this RFID deployment have been assessed in depth in Section 7.1.6. This use case is a prerequisite for understanding the work that has been carried out in this project. The use cases described in Chapter 6 resulted in structured findings that were transformed into factors. Each factor influencing the use case can be assigned to multiple lifecycle phases. After having identified the main factors, the main stakeholders were assigned to these through a brief stakeholder analysis. In a further step, a cross impact analysis provided first insights into the interrelated factors. These insights were used to build direct and indirect correlations between different factors. Factors can have a strong, medium or weak impact on each other. In the model, this is represented by the thickness of the connection between factors. Time effects are also considered. In fact, factors can have short-, medium-, or long-term effects on each other.
weighing of interests
Economicmotivation
Societalmotivation(positive
environmental effects)
Technological/
organisational feasibility
Societalopposition(privacy
concerns, behavioural
patterns)
Regulationweighing and balancing of interests
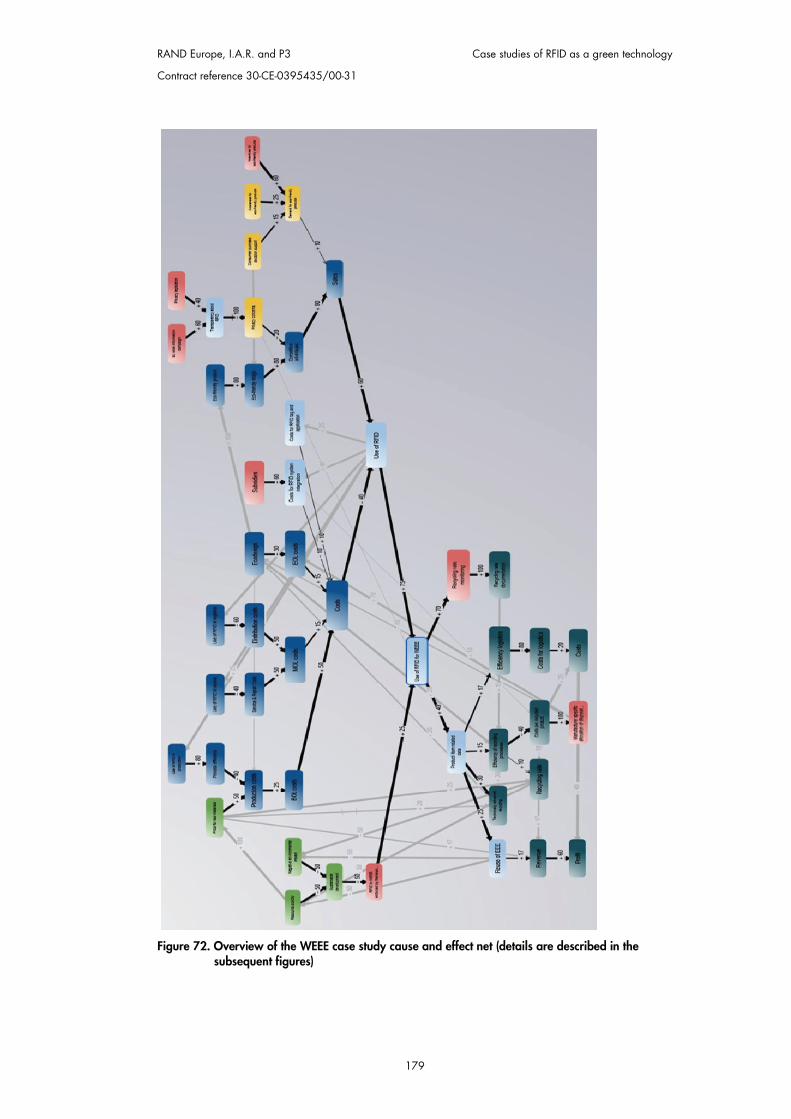
RAND Europe, I.A.R. and P3 Case studies of RFID as a green technology
Contract reference 30-CE-0395435/00-31
179
Figure 72. Overview of the WEEE case study cause and effect net (details are described in the subsequent figures)

SMART TRASH: Study on RFID tags and the recycling industry RAND Europe, I.A.R. and P3
Contract reference 30-CE-0395435/00-31
180
By using the iModeler tool we built-up the cause and effect graph using the product lifecycle phases as a guiding mechanism. In the top section of Figure 72, RFID-related effects (costs or benefits) for BOL processes (design and production) and MOL processes (logistics and retail) are depicted. The model helps to represent the beneficial effects of reducing specific BOL and MOL processes as opposed to the costs for the implementation of RFID tags and infrastructure set-up. The factors are set in relation to the specific cost segment, while they also result in environmental effects. For example, more efficient logistics result in a lower environmental impact through reduced transportation. How far commercial and environmental effects run in parallel or lever each other is also determined by certain external factors such as raw material prices. The implementation of RFID is driven by BOL and MOL requirements as a determining factor for the effects RFID application may have on the efficiency and environmental performance within EOL processes. RFID uptake resulting from EOL requirements such as mandatory recycling targets or recycling target monitoring is taken into account in the model.
In our model, stakeholders can be differentiated by different colours.
Table 21. Overview of WEEE stakeholders and colour-coding within the cause and effect net
Stakeholder Colour
Administration Government, EC, etc. Red
Business Multiple stakeholders OEM/Manufacturer
Light blue Blue
Recycling Operator Dark blue
Consumer Consumer Yellow
The table below captures the complex scenario model as described above. The first column includes the relevant stakeholders identified for this case study: consumers, administration, logistics operator, OEM, retailer, and multiple stakeholders. The second column lists the factors as they are named in the case study cause and effect model. The third column comprises social and behavioural impacts, as well as technological, organisational, legal and commercial impacts. In the last column, every factor is classified according to which lifecycle phases are most impacted.
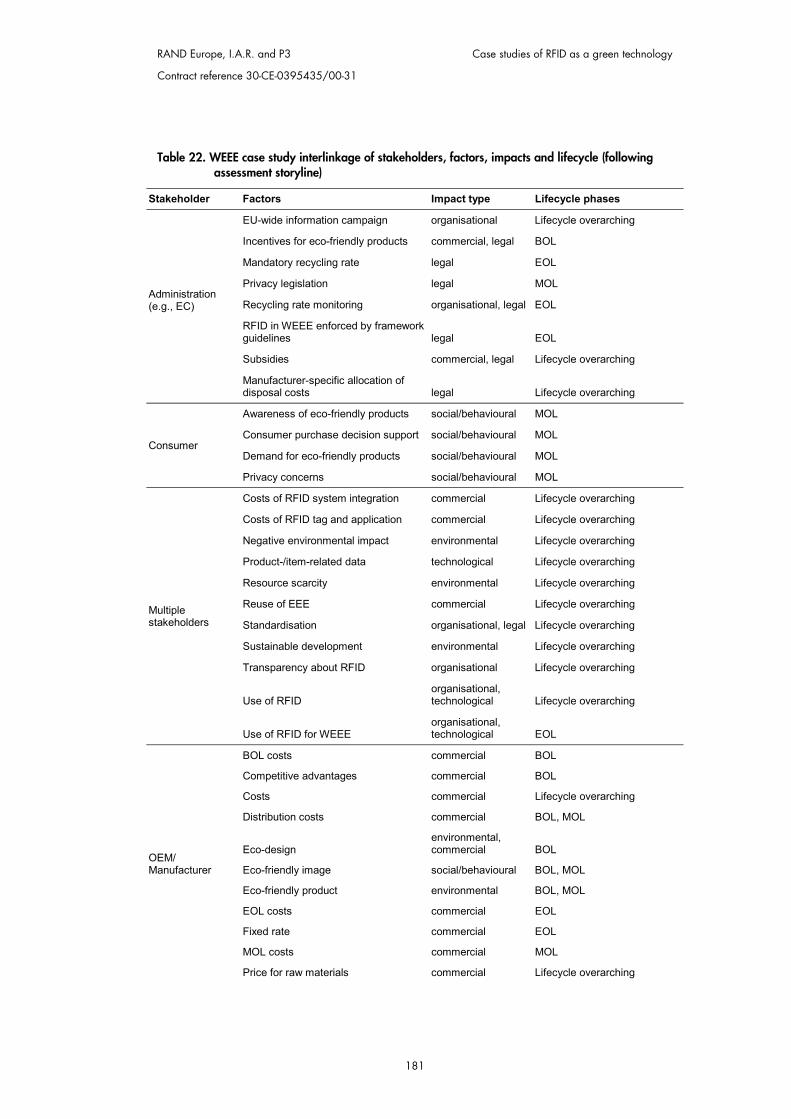
RAND Europe, I.A.R. and P3 Case studies of RFID as a green technology
Contract reference 30-CE-0395435/00-31
181
Table 22. WEEE case study interlinkage of stakeholders, factors, impacts and lifecycle (following assessment storyline)
Stakeholder Factors Impact type Lifecycle phases
Administration (e.g., EC)
EU-wide information campaign organisational Lifecycle overarching
Incentives for eco-friendly products commercial, legal BOL
Mandatory recycling rate legal EOL
Privacy legislation legal MOL
Recycling rate monitoring organisational, legal EOL
RFID in WEEE enforced by framework guidelines legal EOL
Subsidies commercial, legal Lifecycle overarching
Manufacturer-specific allocation of disposal costs legal Lifecycle overarching
Consumer
Awareness of eco-friendly products social/behavioural MOL
Consumer purchase decision support social/behavioural MOL
Demand for eco-friendly products social/behavioural MOL
Privacy concerns social/behavioural MOL
Multiple stakeholders
Costs of RFID system integration commercial Lifecycle overarching
Costs of RFID tag and application commercial Lifecycle overarching
Negative environmental impact environmental Lifecycle overarching
Product-/item-related data technological Lifecycle overarching
Resource scarcity environmental Lifecycle overarching
Reuse of EEE commercial Lifecycle overarching
Standardisation organisational, legal Lifecycle overarching
Sustainable development environmental Lifecycle overarching
Transparency about RFID organisational Lifecycle overarching
Use of RFID organisational, technological Lifecycle overarching
Use of RFID for WEEE organisational, technological EOL
OEM/ Manufacturer
BOL costs commercial BOL
Competitive advantages commercial BOL
Costs commercial Lifecycle overarching
Distribution costs commercial BOL, MOL
Eco-design environmental, commercial BOL
Eco-friendly image social/behavioural BOL, MOL
Eco-friendly product environmental BOL, MOL
EOL costs commercial EOL
Fixed rate commercial EOL
MOL costs commercial MOL
Price for raw materials commercial Lifecycle overarching
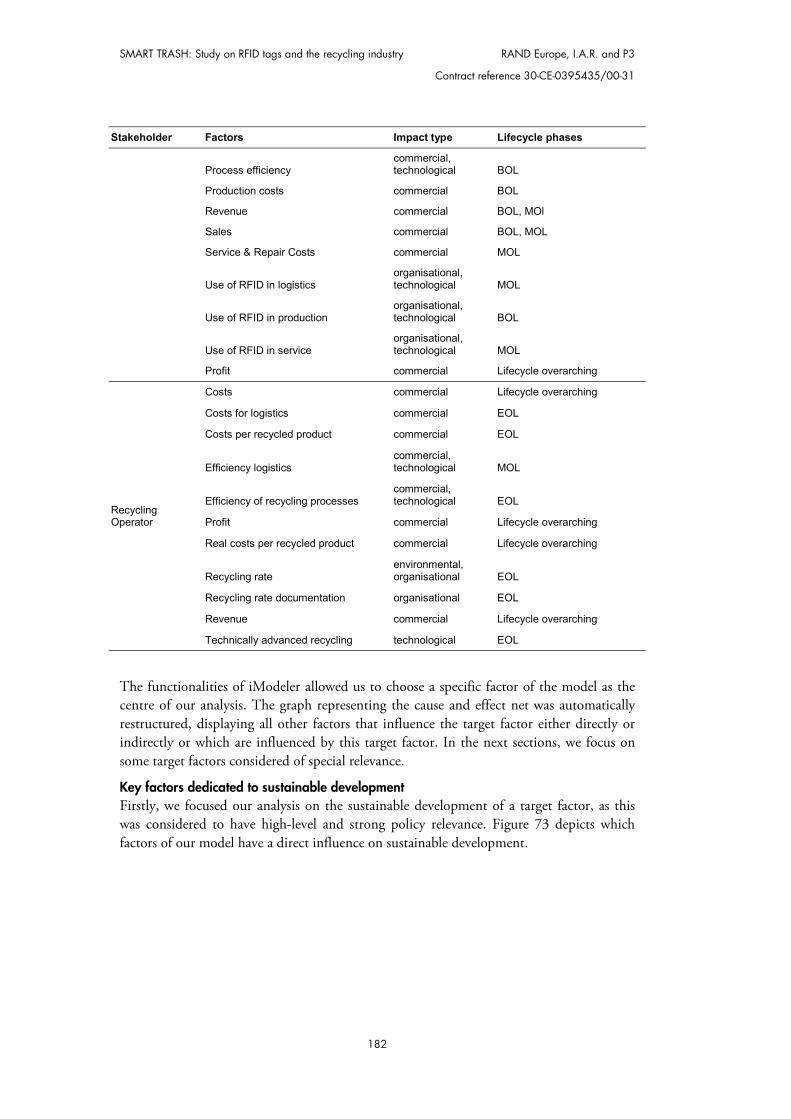
SMART TRASH: Study on RFID tags and the recycling industry RAND Europe, I.A.R. and P3
Contract reference 30-CE-0395435/00-31
182
Stakeholder Factors Impact type Lifecycle phases
Process efficiency commercial, technological BOL
Production costs commercial BOL
Revenue commercial BOL, MOl
Sales commercial BOL, MOL
Service & Repair Costs commercial MOL
Use of RFID in logistics organisational, technological MOL
Use of RFID in production organisational, technological BOL
Use of RFID in service organisational, technological MOL
Profit commercial Lifecycle overarching
Recycling Operator
Costs commercial Lifecycle overarching
Costs for logistics commercial EOL
Costs per recycled product commercial EOL
Efficiency logistics commercial, technological MOL
Efficiency of recycling processes commercial, technological EOL
Profit commercial Lifecycle overarching
Real costs per recycled product commercial Lifecycle overarching
Recycling rate environmental, organisational EOL
Recycling rate documentation organisational EOL
Revenue commercial Lifecycle overarching
Technically advanced recycling technological EOL
The functionalities of iModeler allowed us to choose a specific factor of the model as the centre of our analysis. The graph representing the cause and effect net was automatically restructured, displaying all other factors that influence the target factor either directly or indirectly or which are influenced by this target factor. In the next sections, we focus on some target factors considered of special relevance.
Key factors dedicated to sustainable development Firstly, we focused our analysis on the sustainable development of a target factor, as this was considered to have high-level and strong policy relevance. Figure 73 depicts which factors of our model have a direct influence on sustainable development.
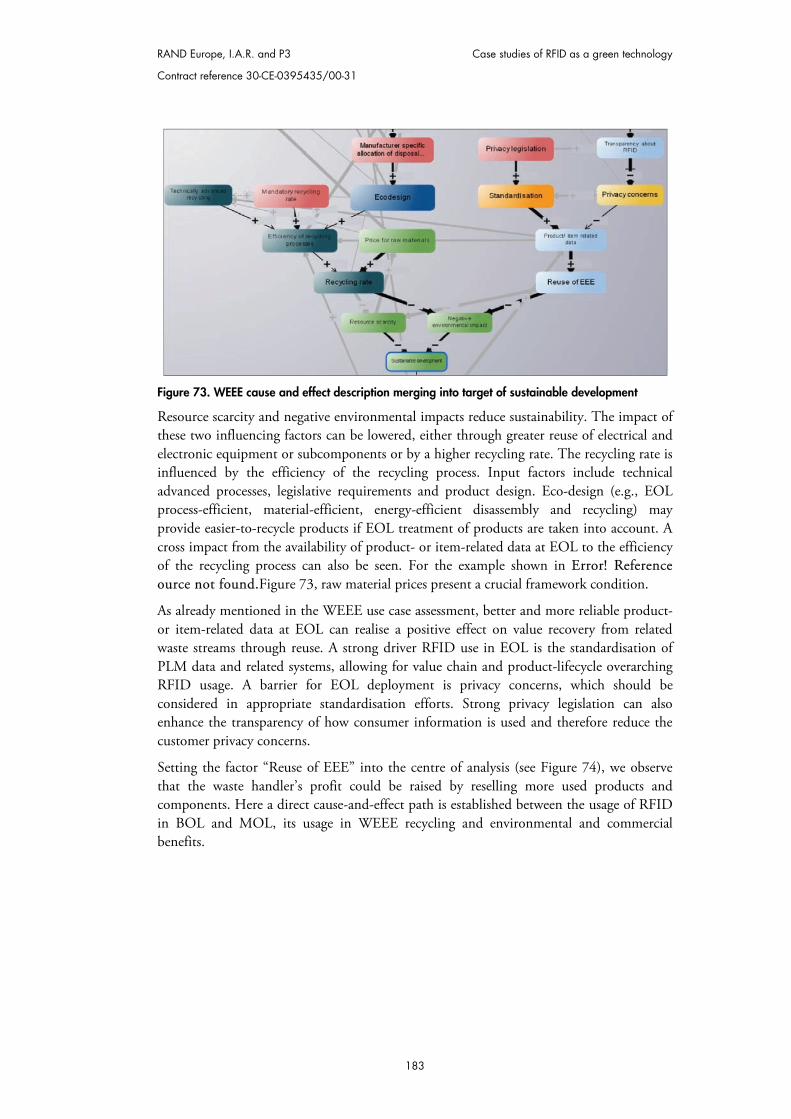
RAND Europe, I.A.R. and P3 Case studies of RFID as a green technology
Contract reference 30-CE-0395435/00-31
183
Figure 73. WEEE cause and effect description merging into target of sustainable development
Resource scarcity and negative environmental impacts reduce sustainability. The impact of these two influencing factors can be lowered, either through greater reuse of electrical and electronic equipment or subcomponents or by a higher recycling rate. The recycling rate is influenced by the efficiency of the recycling process. Input factors include technical advanced processes, legislative requirements and product design. Eco-design (e.g., EOL process-efficient, material-efficient, energy-efficient disassembly and recycling) may provide easier-to-recycle products if EOL treatment of products are taken into account. A cross impact from the availability of product- or item-related data at EOL to the efficiency of the recycling process can also be seen. For the example shown in EError! Reference ource not found.Figure 73, raw material prices present a crucial framework condition.
As already mentioned in the WEEE use case assessment, better and more reliable product- or item-related data at EOL can realise a positive effect on value recovery from related waste streams through reuse. A strong driver RFID use in EOL is the standardisation of PLM data and related systems, allowing for value chain and product-lifecycle overarching RFID usage. A barrier for EOL deployment is privacy concerns, which should be considered in appropriate standardisation efforts. Strong privacy legislation can also enhance the transparency of how consumer information is used and therefore reduce the customer privacy concerns.
Setting the factor “Reuse of EEE” into the centre of analysis (see Figure 74), we observe that the waste handler’s profit could be raised by reselling more used products and components. Here a direct cause-and-effect path is established between the usage of RFID in BOL and MOL, its usage in WEEE recycling and environmental and commercial benefits.
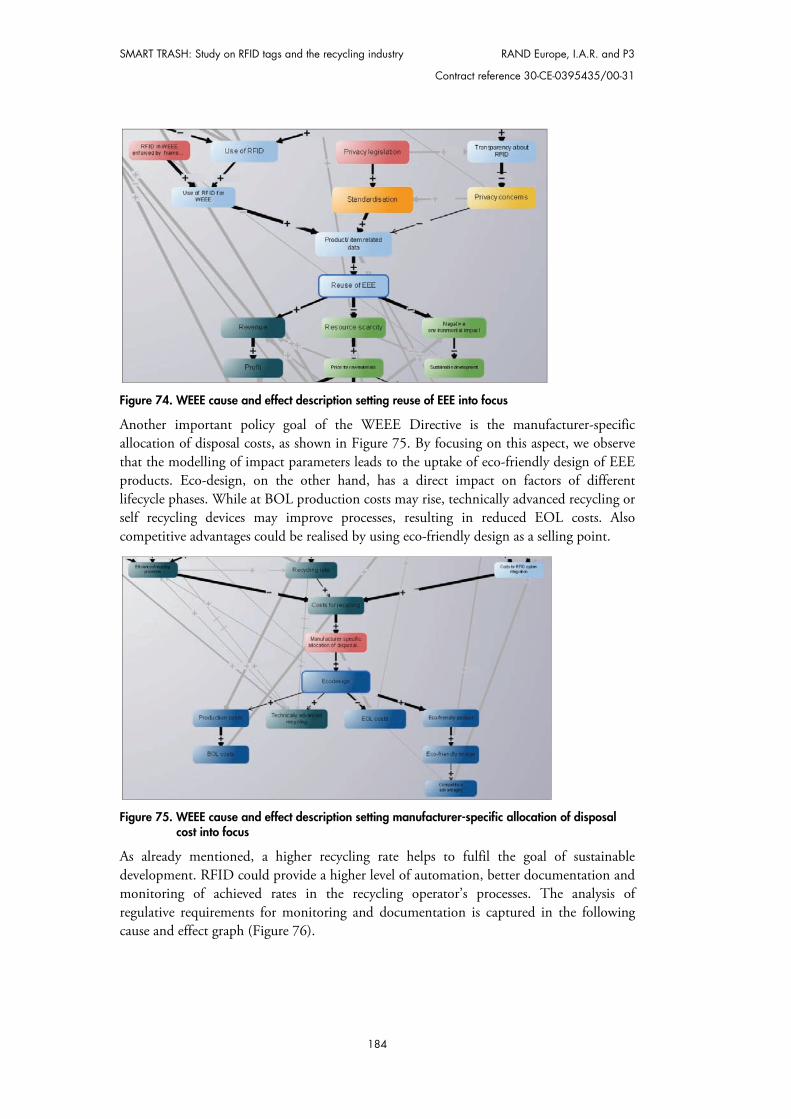
SMART TRASH: Study on RFID tags and the recycling industry RAND Europe, I.A.R. and P3
Contract reference 30-CE-0395435/00-31
184
Figure 74. WEEE cause and effect description setting reuse of EEE into focus
Another important policy goal of the WEEE Directive is the manufacturer-specific allocation of disposal costs, as shown in Figure 75. By focusing on this aspect, we observe that the modelling of impact parameters leads to the uptake of eco-friendly design of EEE products. Eco-design, on the other hand, has a direct impact on factors of different lifecycle phases. While at BOL production costs may rise, technically advanced recycling or self recycling devices may improve processes, resulting in reduced EOL costs. Also competitive advantages could be realised by using eco-friendly design as a selling point.
Figure 75. WEEE cause and effect description setting manufacturer-specific allocation of disposal
cost into focus
As already mentioned, a higher recycling rate helps to fulfil the goal of sustainable development. RFID could provide a higher level of automation, better documentation and monitoring of achieved rates in the recycling operator’s processes. The analysis of regulative requirements for monitoring and documentation is captured in the following cause and effect graph (Figure 76).
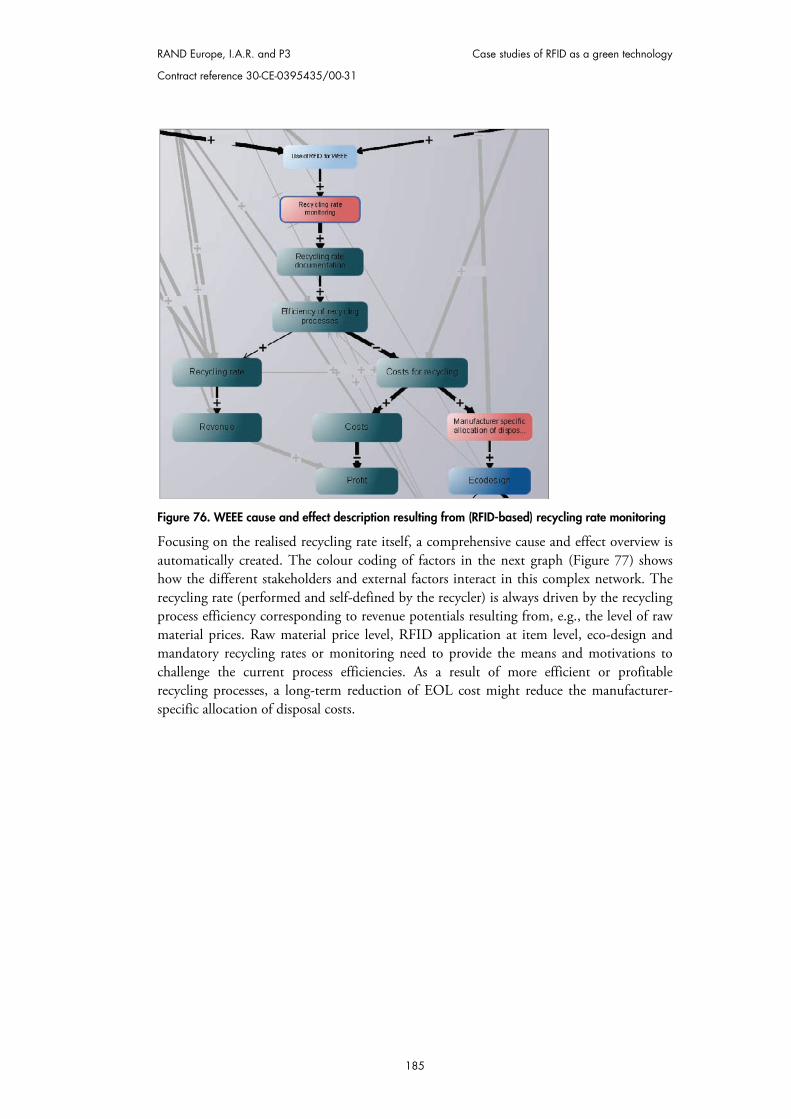
RAND Europe, I.A.R. and P3 Case studies of RFID as a green technology
Contract reference 30-CE-0395435/00-31
185
Figure 76. WEEE cause and effect description resulting from (RFID-based) recycling rate monitoring
Focusing on the realised recycling rate itself, a comprehensive cause and effect overview is automatically created. The colour coding of factors in the next graph (Figure 77) shows how the different stakeholders and external factors interact in this complex network. The recycling rate (performed and self-defined by the recycler) is always driven by the recycling process efficiency corresponding to revenue potentials resulting from, e.g., the level of raw material prices. Raw material price level, RFID application at item level, eco-design and mandatory recycling rates or monitoring need to provide the means and motivations to challenge the current process efficiencies. As a result of more efficient or profitable recycling processes, a long-term reduction of EOL cost might reduce the manufacturer-specific allocation of disposal costs.
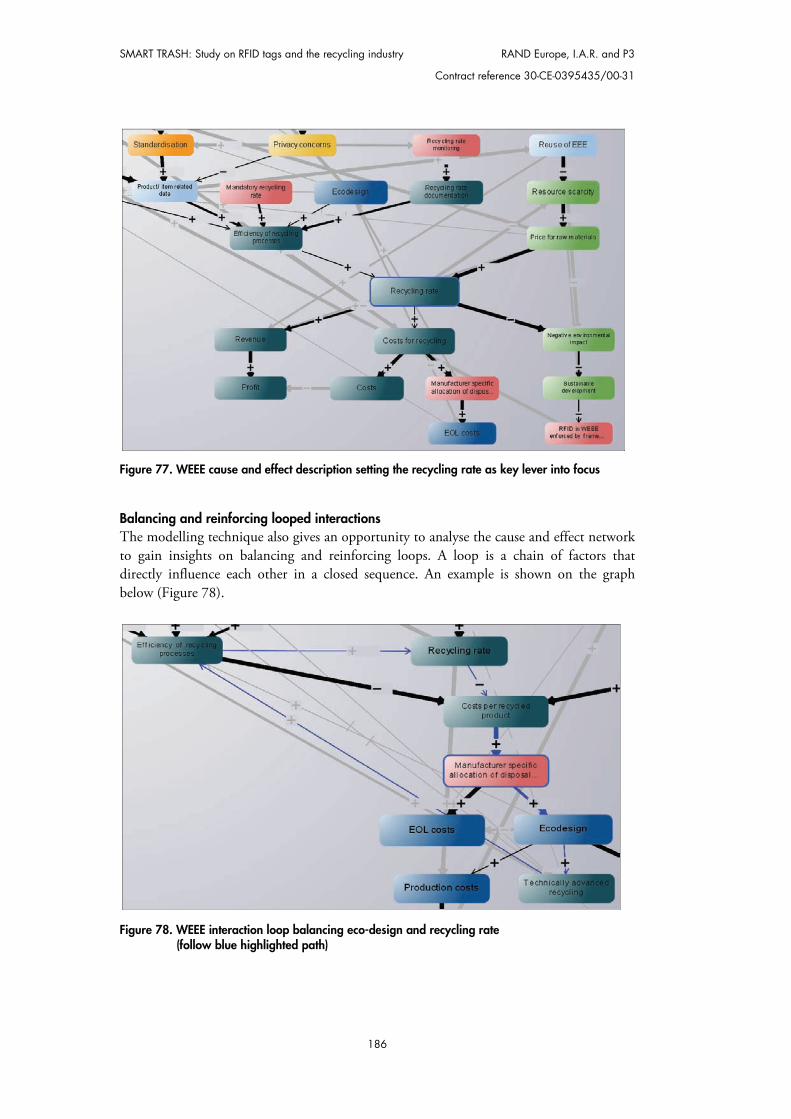
SMART TRASH: Study on RFID tags and the recycling industry RAND Europe, I.A.R. and P3
Contract reference 30-CE-0395435/00-31
186
Figure 77. WEEE cause and effect description setting the recycling rate as key lever into focus
Balancing and reinforcing looped interactions The modelling technique also gives an opportunity to analyse the cause and effect network to gain insights on balancing and reinforcing loops. A loop is a chain of factors that directly influence each other in a closed sequence. An example is shown on the graph below (Figure 78).
Figure 78. WEEE interaction loop balancing eco-design and recycling rate (follow blue highlighted path)

RAND Europe, I.A.R. and P3 Case studies of RFID as a green technology
Contract reference 30-CE-0395435/00-31
187
It becomes clear that the manufacturer-specific allocation of disposal cost is a main regulative element (red) linking EOL and BOL and therefore recycler processes (dark blue) and manufacturer processes (blue). The strength of the interrelations remains to be evaluated by further experts. However, it can be stated that individual producer responsibility will constitute a much closer EOL-BOL link or even close the product lifecycle with possible cost benefits for both recycler and manufacturer in a balanced system. Only lifecycle phase overarching deployments and co-operations of stakeholders could realise joint benefits here.
A reinforcing loop is shown in Figure 79. Here raw material prices are an important externality. Outside the shown loop, higher prices are expected to foster recycling. Further on, within the loop, a higher level of prices would result in higher manufacturing costs, presenting a potential barrier to investments in RFID implementation if no sufficient cost benefits could be realized by its usage. On the other hand, the availability of better and more reliable product data at the EOL phase of a product could enable more reuse and reselling of used EEE. This directly results in less demand for new products if a better-informed, reliable and more trusted secondhand market could be created. The literature (see Section 7.1.6) indicates the relevance of this, especially for developing countries. Also, more efficient recycling would result in higher generation of secondary raw materials from WEEE. Both mentioned cause and effect relations have an effect on lowering the raw material price as element of the loop.
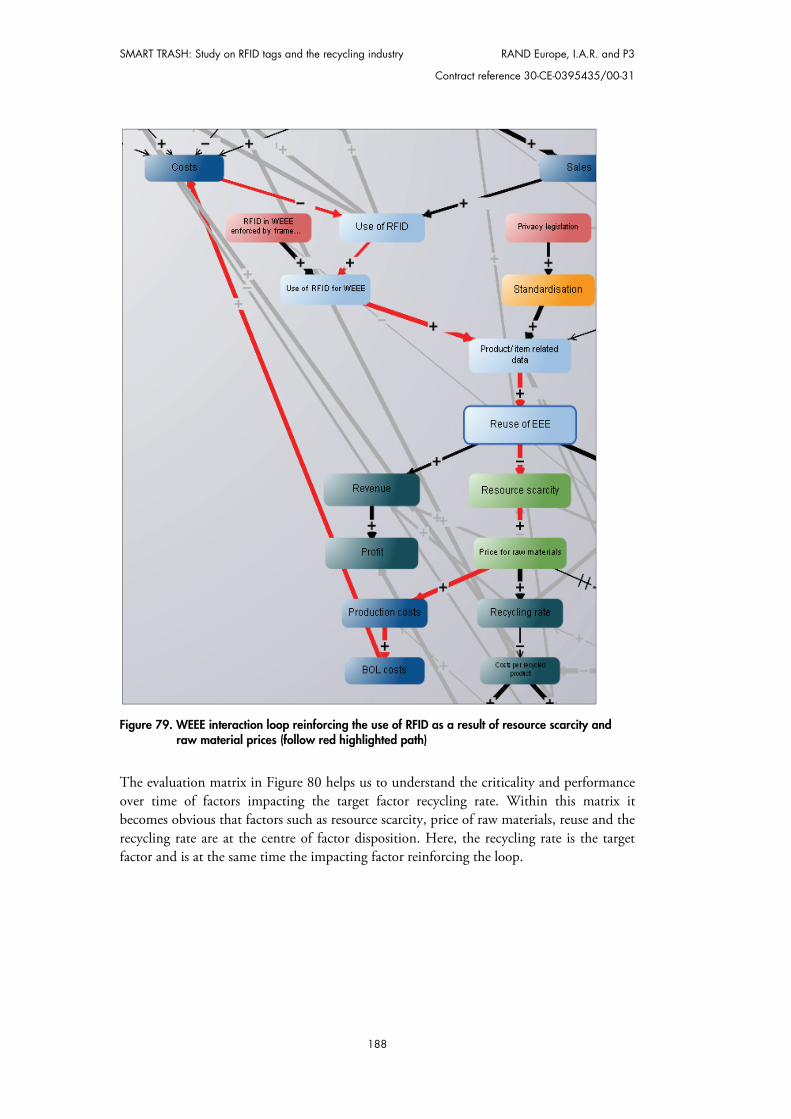
SMART TRASH: Study on RFID tags and the recycling industry RAND Europe, I.A.R. and P3
Contract reference 30-CE-0395435/00-31
188
Figure 79. WEEE interaction loop reinforcing the use of RFID as a result of resource scarcity and raw material prices (follow red highlighted path)
The evaluation matrix in Figure 80 helps us to understand the criticality and performance over time of factors impacting the target factor recycling rate. Within this matrix it becomes obvious that factors such as resource scarcity, price of raw materials, reuse and the recycling rate are at the centre of factor disposition. Here, the recycling rate is the target factor and is at the same time the impacting factor reinforcing the loop.
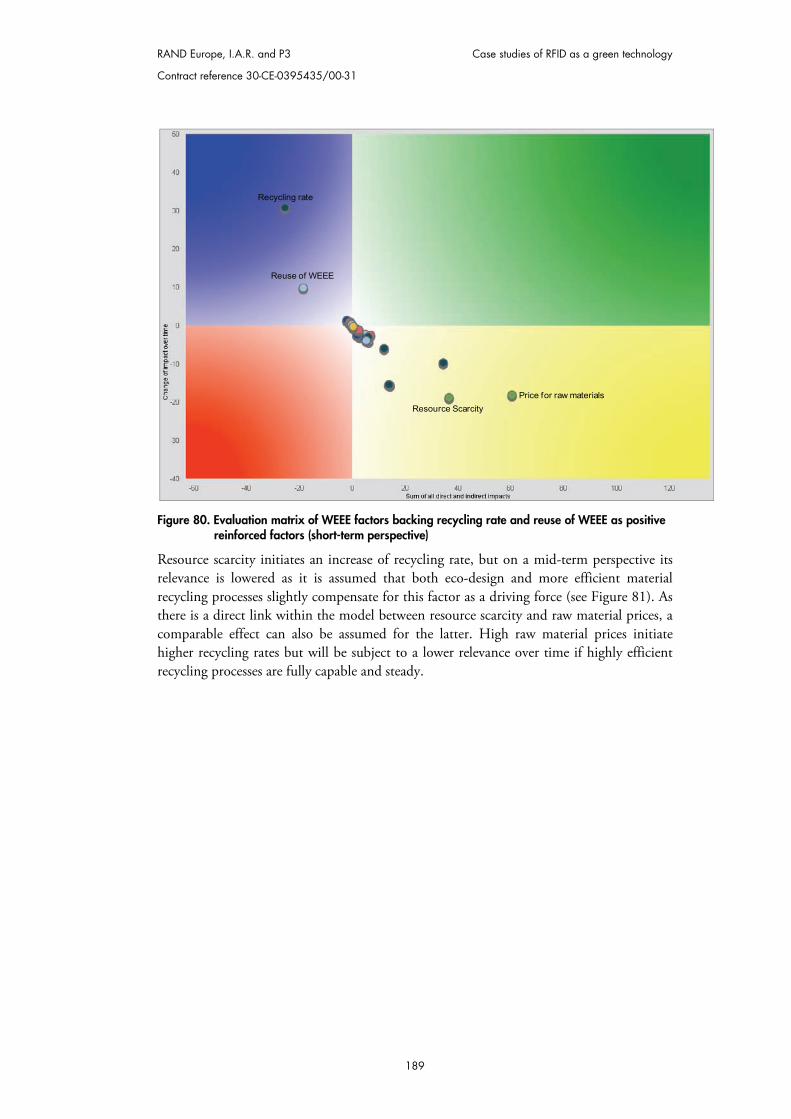
RAND Europe, I.A.R. and P3 Case studies of RFID as a green technology
Contract reference 30-CE-0395435/00-31
189
Figure 80. Evaluation matrix of WEEE factors backing recycling rate and reuse of WEEE as positive
reinforced factors (short-term perspective)
Resource scarcity initiates an increase of recycling rate, but on a mid-term perspective its relevance is lowered as it is assumed that both eco-design and more efficient material recycling processes slightly compensate for this factor as a driving force (see Figure 81). As there is a direct link within the model between resource scarcity and raw material prices, a comparable effect can also be assumed for the latter. High raw material prices initiate higher recycling rates but will be subject to a lower relevance over time if highly efficient recycling processes are fully capable and steady.
Resource ScarcityPrice for raw materials
Reuse of WEEE
Recycling rate
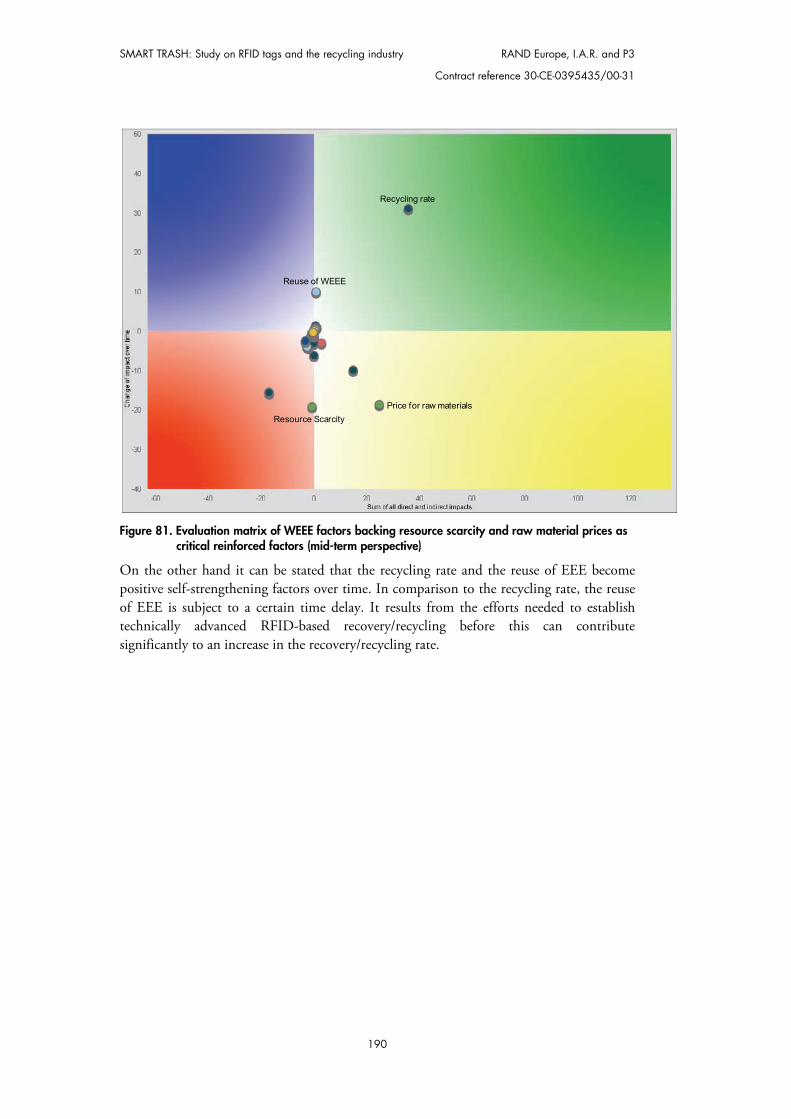
SMART TRASH: Study on RFID tags and the recycling industry RAND Europe, I.A.R. and P3
Contract reference 30-CE-0395435/00-31
190
Figure 81. Evaluation matrix of WEEE factors backing resource scarcity and raw material prices as
critical reinforced factors (mid-term perspective)
On the other hand it can be stated that the recycling rate and the reuse of EEE become positive self-strengthening factors over time. In comparison to the recycling rate, the reuse of EEE is subject to a certain time delay. It results from the efforts needed to establish technically advanced RFID-based recovery/recycling before this can contribute significantly to an increase in the recovery/recycling rate.
Resource ScarcityPrice for raw materials
Reuse of WEEE
Recycling rate
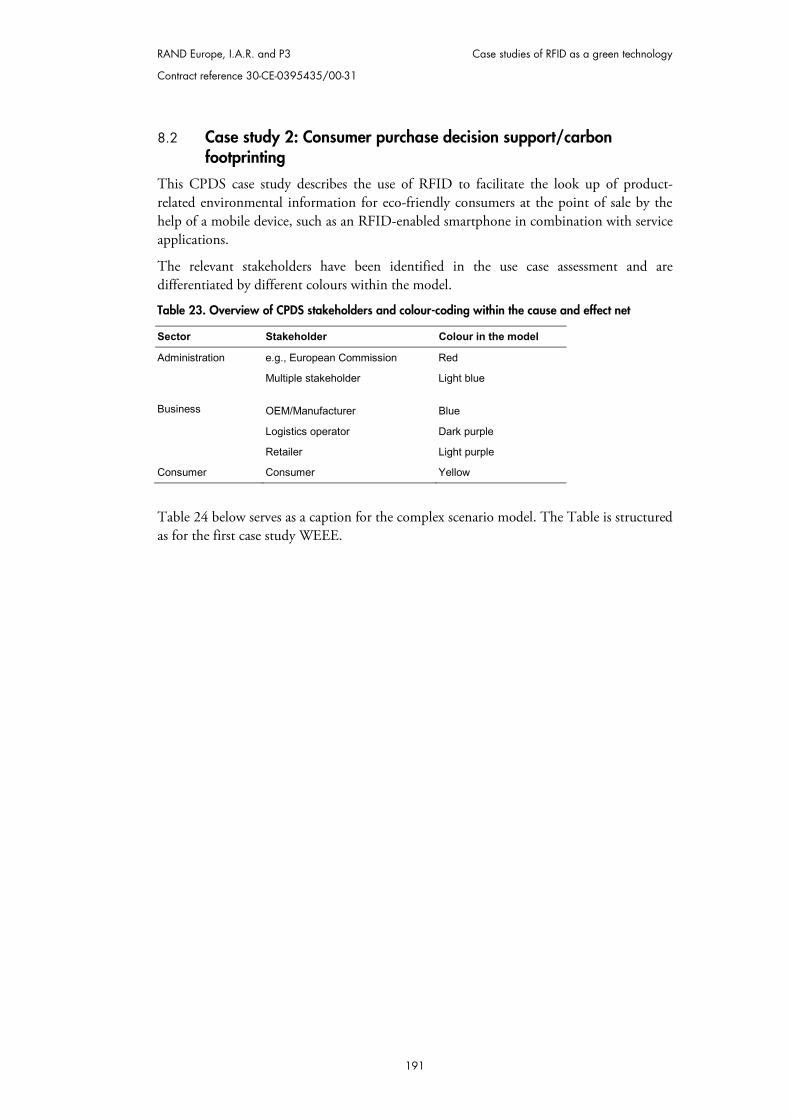
RAND Europe, I.A.R. and P3 Case studies of RFID as a green technology
Contract reference 30-CE-0395435/00-31
191
8.2 Case study 2: Consumer purchase decision support/carbon footprinting
This CPDS case study describes the use of RFID to facilitate the look up of product-related environmental information for eco-friendly consumers at the point of sale by the help of a mobile device, such as an RFID-enabled smartphone in combination with service applications.
The relevant stakeholders have been identified in the use case assessment and are differentiated by different colours within the model.
Table 23. Overview of CPDS stakeholders and colour-coding within the cause and effect net
Sector Stakeholder Colour in the model
Administration e.g., European Commission Red
Business
Multiple stakeholder Light blue
OEM/Manufacturer Blue
Logistics operator Dark purple
Retailer Light purple
Consumer Consumer Yellow
Table 24 below serves as a caption for the complex scenario model. The Table is structured as for the first case study WEEE.
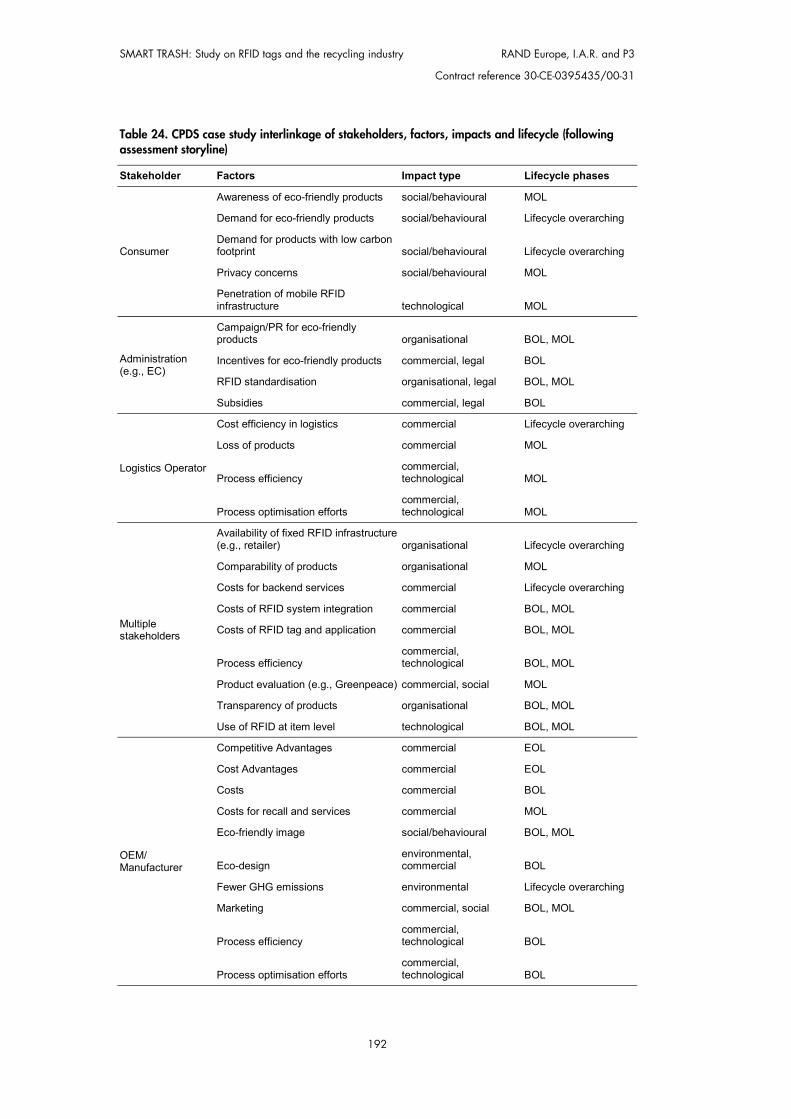
SMART TRASH: Study on RFID tags and the recycling industry RAND Europe, I.A.R. and P3
Contract reference 30-CE-0395435/00-31
192
Table 24. CPDS case study interlinkage of stakeholders, factors, impacts and lifecycle (following assessment storyline)
Stakeholder Factors Impact type Lifecycle phases
Consumer
Awareness of eco-friendly products social/behavioural MOL
Demand for eco-friendly products social/behavioural Lifecycle overarching
Demand for products with low carbon footprint social/behavioural Lifecycle overarching
Privacy concerns social/behavioural MOL
Penetration of mobile RFID infrastructure technological MOL
Administration (e.g., EC)
Campaign/PR for eco-friendly products organisational BOL, MOL
Incentives for eco-friendly products commercial, legal BOL
RFID standardisation organisational, legal BOL, MOL
Subsidies commercial, legal BOL
Logistics Operator
Cost efficiency in logistics commercial Lifecycle overarching
Loss of products commercial MOL
Process efficiency commercial, technological MOL
Process optimisation efforts commercial, technological MOL
Multiple stakeholders
Availability of fixed RFID infrastructure (e.g., retailer) organisational Lifecycle overarching
Comparability of products organisational MOL
Costs for backend services commercial Lifecycle overarching
Costs of RFID system integration commercial BOL, MOL
Costs of RFID tag and application commercial BOL, MOL
Process efficiency commercial, technological BOL, MOL
Product evaluation (e.g., Greenpeace) commercial, social MOL
Transparency of products organisational BOL, MOL
Use of RFID at item level technological BOL, MOL
OEM/ Manufacturer
Competitive Advantages commercial EOL
Cost Advantages commercial EOL
Costs commercial BOL
Costs for recall and services commercial MOL
Eco-friendly image social/behavioural BOL, MOL
Eco-design environmental, commercial BOL
Fewer GHG emissions environmental Lifecycle overarching
Marketing commercial, social BOL, MOL
Process efficiency commercial, technological BOL
Process optimisation efforts commercial, technological BOL
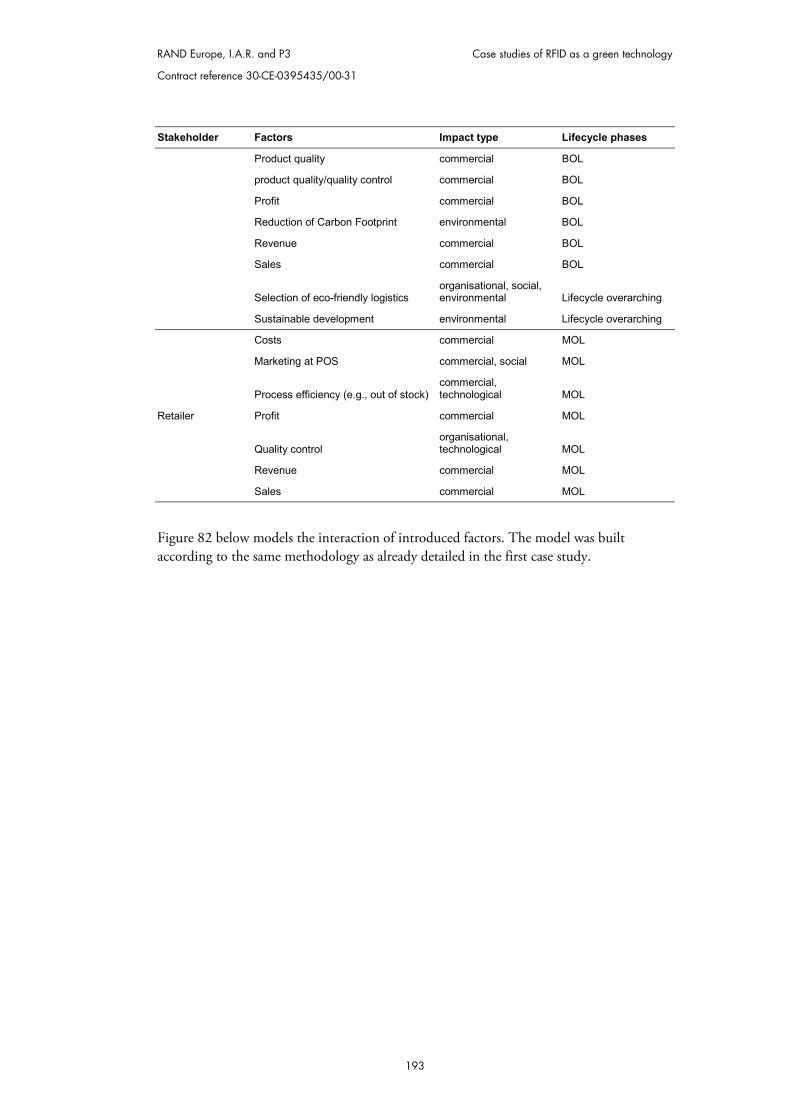
RAND Europe, I.A.R. and P3 Case studies of RFID as a green technology
Contract reference 30-CE-0395435/00-31
193
Stakeholder Factors Impact type Lifecycle phases
Product quality commercial BOL
product quality/quality control commercial BOL
Profit commercial BOL
Reduction of Carbon Footprint environmental BOL
Revenue commercial BOL
Sales commercial BOL
Selection of eco-friendly logistics organisational, social, environmental Lifecycle overarching
Sustainable development environmental Lifecycle overarching
Retailer
Costs commercial MOL
Marketing at POS commercial, social MOL
Process efficiency (e.g., out of stock) commercial, technological MOL
Profit commercial MOL
Quality control organisational, technological MOL
Revenue commercial MOL
Sales commercial MOL
Figure 82 below models the interaction of introduced factors. The model was built according to the same methodology as already detailed in the first case study.
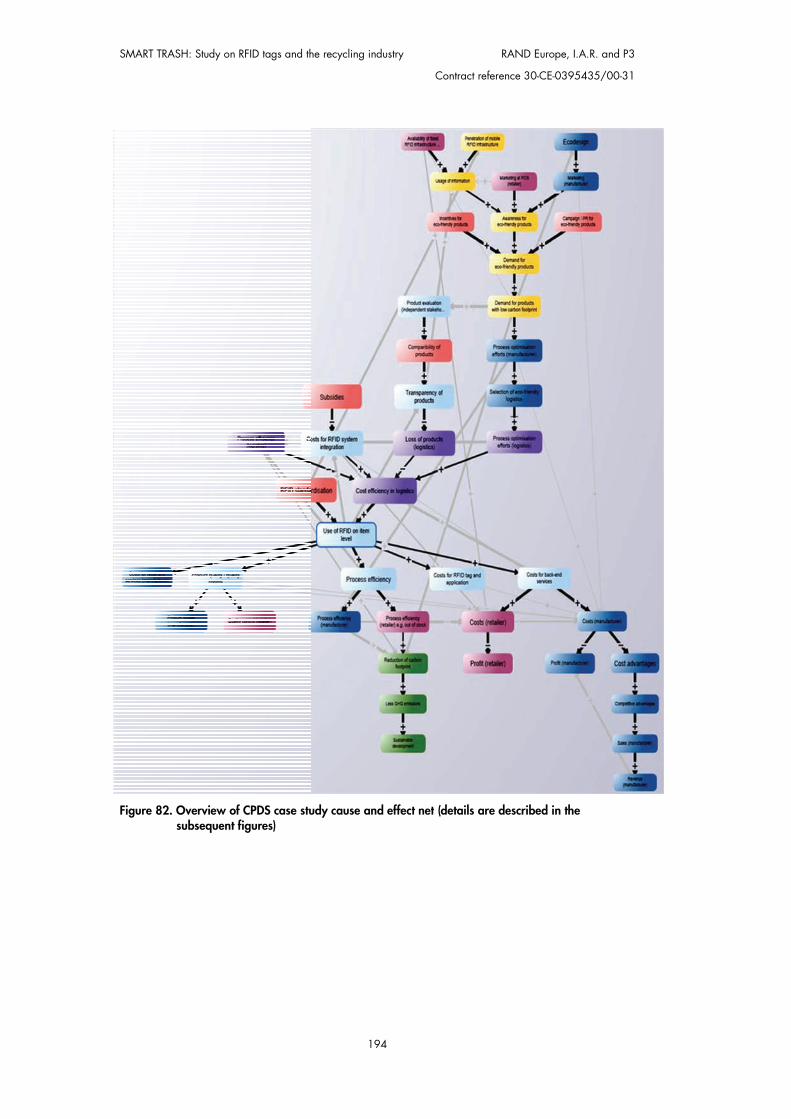
SMART TRASH: Study on RFID tags and th
Figure 82. Overview of CPDS case stusubsequent figures)
he recycling industry RAND Europe, I.A.R. a
Contract reference 30-CE-0395435/
194
udy cause and effect net (details are described in the
and P3
00-31
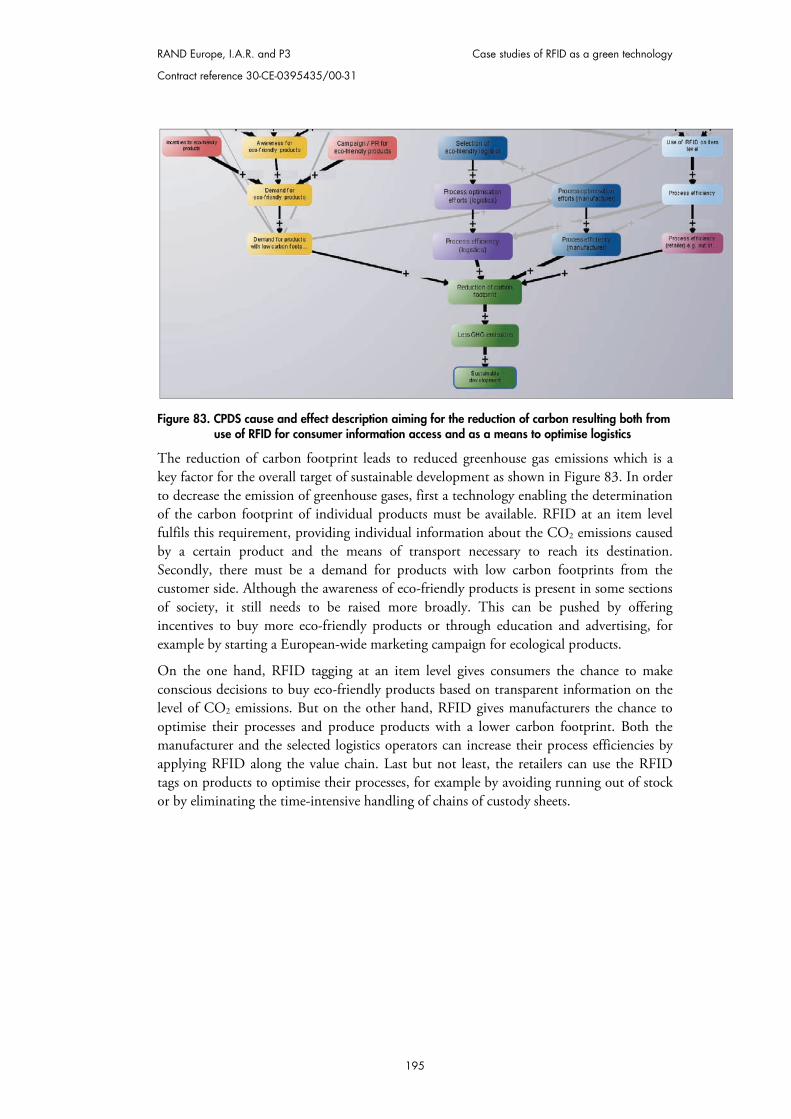
RAND Europe, I.A.R. and P3 Case studies of RFID as a green technology
Contract reference 30-CE-0395435/00-31
195
Figure 83. CPDS cause and effect description aiming for the reduction of carbon resulting both from use of RFID for consumer information access and as a means to optimise logistics
The reduction of carbon footprint leads to reduced greenhouse gas emissions which is a key factor for the overall target of sustainable development as shown in Figure 83. In order to decrease the emission of greenhouse gases, first a technology enabling the determination of the carbon footprint of individual products must be available. RFID at an item level fulfils this requirement, providing individual information about the CO2 emissions caused by a certain product and the means of transport necessary to reach its destination. Secondly, there must be a demand for products with low carbon footprints from the customer side. Although the awareness of eco-friendly products is present in some sections of society, it still needs to be raised more broadly. This can be pushed by offering incentives to buy more eco-friendly products or through education and advertising, for example by starting a European-wide marketing campaign for ecological products.
On the one hand, RFID tagging at an item level gives consumers the chance to make conscious decisions to buy eco-friendly products based on transparent information on the level of CO2 emissions. But on the other hand, RFID gives manufacturers the chance to optimise their processes and produce products with a lower carbon footprint. Both the manufacturer and the selected logistics operators can increase their process efficiencies by applying RFID along the value chain. Last but not least, the retailers can use the RFID tags on products to optimise their processes, for example by avoiding running out of stock or by eliminating the time-intensive handling of chains of custody sheets.
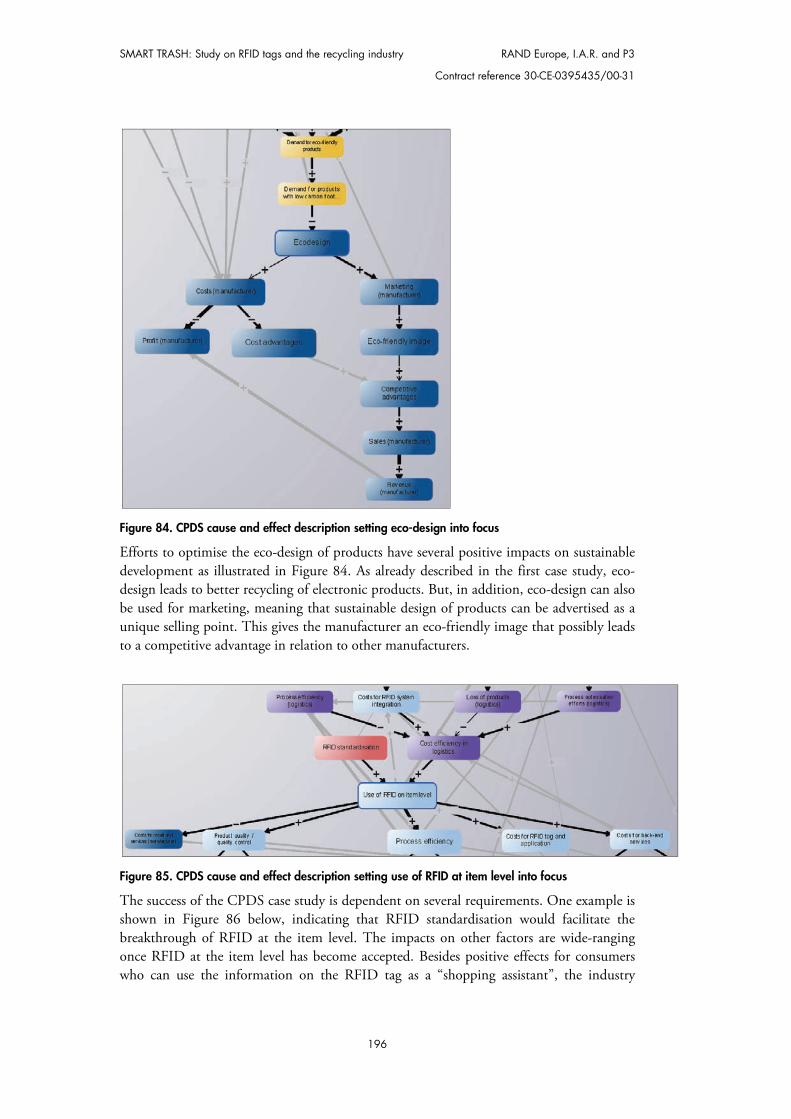
SMART TRASH: Study on RFID tags and the recycling industry RAND Europe, I.A.R. and P3
Contract reference 30-CE-0395435/00-31
196
Figure 84. CPDS cause and effect description setting eco-design into focus
Efforts to optimise the eco-design of products have several positive impacts on sustainable development as illustrated in Figure 84. As already described in the first case study, eco-design leads to better recycling of electronic products. But, in addition, eco-design can also be used for marketing, meaning that sustainable design of products can be advertised as a unique selling point. This gives the manufacturer an eco-friendly image that possibly leads to a competitive advantage in relation to other manufacturers.
Figure 85. CPDS cause and effect description setting use of RFID at item level into focus
The success of the CPDS case study is dependent on several requirements. One example is shown in Figure 86 below, indicating that RFID standardisation would facilitate the breakthrough of RFID at the item level. The impacts on other factors are wide-ranging once RFID at the item level has become accepted. Besides positive effects for consumers who can use the information on the RFID tag as a “shopping assistant”, the industry
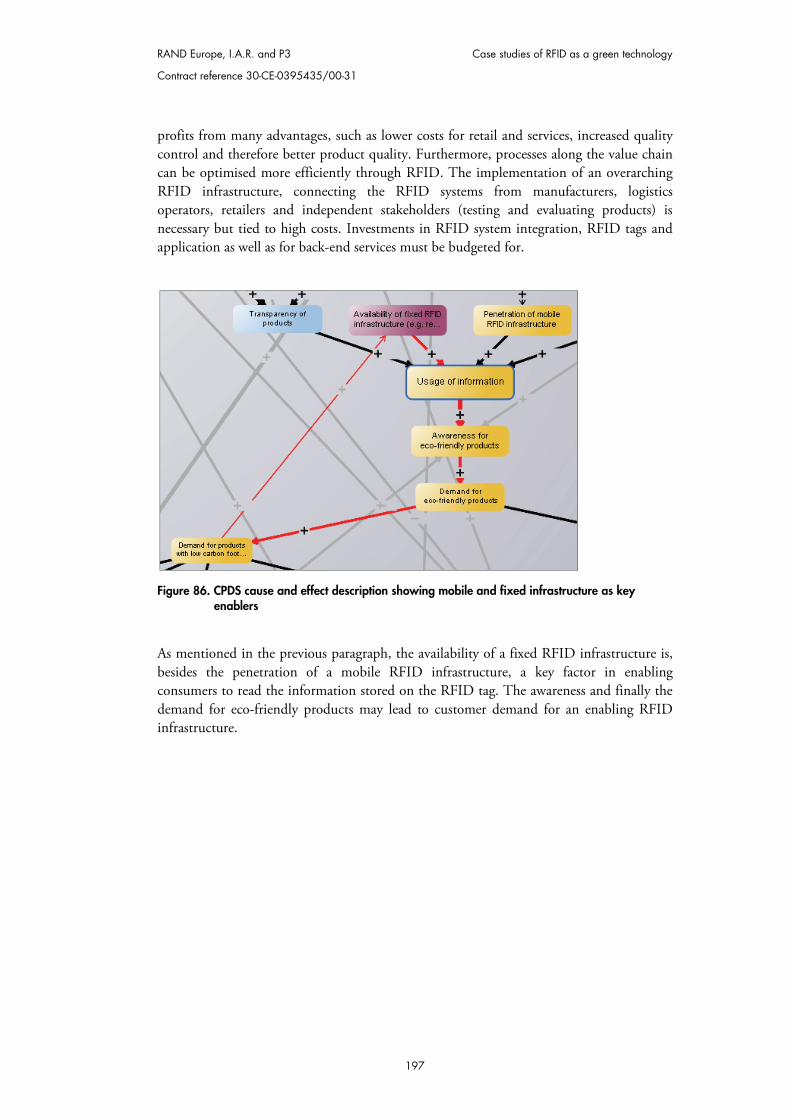
RAND Europe, I.A.R. and P3 Case studies of RFID as a green technology
Contract reference 30-CE-0395435/00-31
197
profits from many advantages, such as lower costs for retail and services, increased quality control and therefore better product quality. Furthermore, processes along the value chain can be optimised more efficiently through RFID. The implementation of an overarching RFID infrastructure, connecting the RFID systems from manufacturers, logistics operators, retailers and independent stakeholders (testing and evaluating products) is necessary but tied to high costs. Investments in RFID system integration, RFID tags and application as well as for back-end services must be budgeted for.
Figure 86. CPDS cause and effect description showing mobile and fixed infrastructure as key enablers
As mentioned in the previous paragraph, the availability of a fixed RFID infrastructure is, besides the penetration of a mobile RFID infrastructure, a key factor in enabling consumers to read the information stored on the RFID tag. The awareness and finally the demand for eco-friendly products may lead to customer demand for an enabling RFID infrastructure.
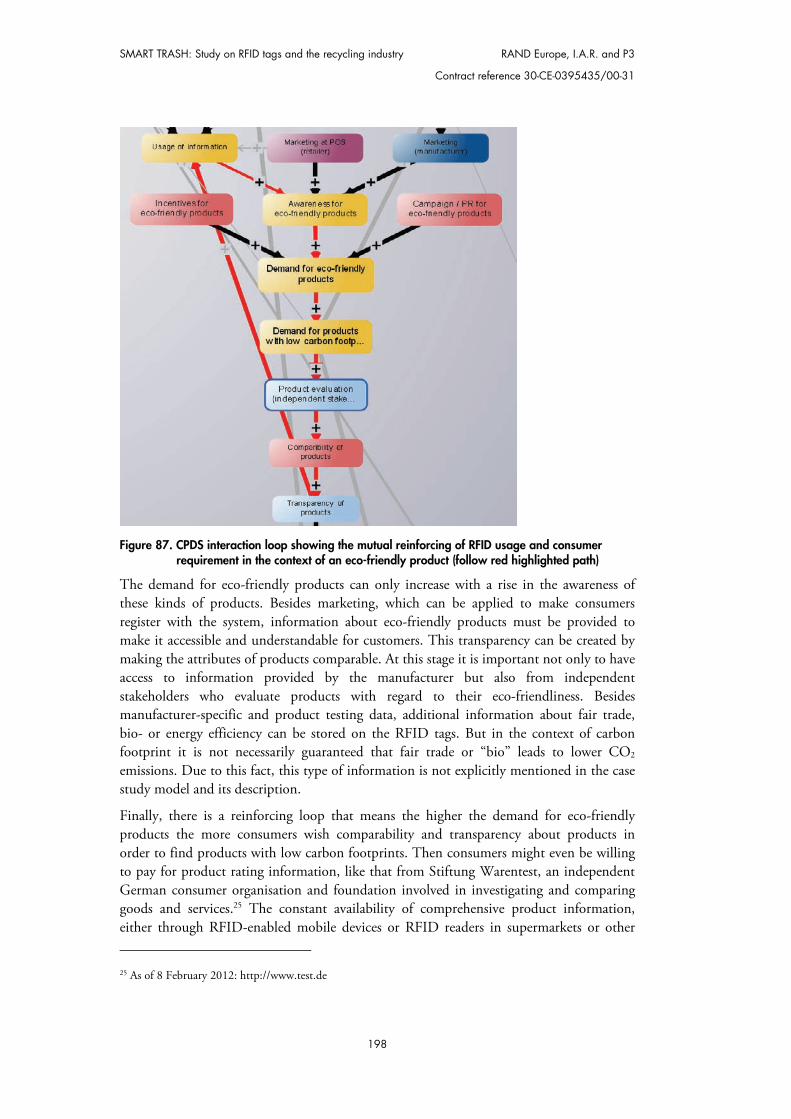
SMART TRASH: Study on RFID tags and the recycling industry RAND Europe, I.A.R. and P3
Contract reference 30-CE-0395435/00-31
198
Figure 87. CPDS interaction loop showing the mutual reinforcing of RFID usage and consumer
requirement in the context of an eco-friendly product (follow red highlighted path)
The demand for eco-friendly products can only increase with a rise in the awareness of these kinds of products. Besides marketing, which can be applied to make consumers register with the system, information about eco-friendly products must be provided to make it accessible and understandable for customers. This transparency can be created by making the attributes of products comparable. At this stage it is important not only to have access to information provided by the manufacturer but also from independent stakeholders who evaluate products with regard to their eco-friendliness. Besides manufacturer-specific and product testing data, additional information about fair trade, bio- or energy efficiency can be stored on the RFID tags. But in the context of carbon footprint it is not necessarily guaranteed that fair trade or “bio” leads to lower CO2 emissions. Due to this fact, this type of information is not explicitly mentioned in the case study model and its description.
Finally, there is a reinforcing loop that means the higher the demand for eco-friendly products the more consumers wish comparability and transparency about products in order to find products with low carbon footprints. Then consumers might even be willing to pay for product rating information, like that from Stiftung Warentest, an independent German consumer organisation and foundation involved in investigating and comparing goods and services.25 The constant availability of comprehensive product information, either through RFID-enabled mobile devices or RFID readers in supermarkets or other 25 As of 8 February 2012: http://www.test.de
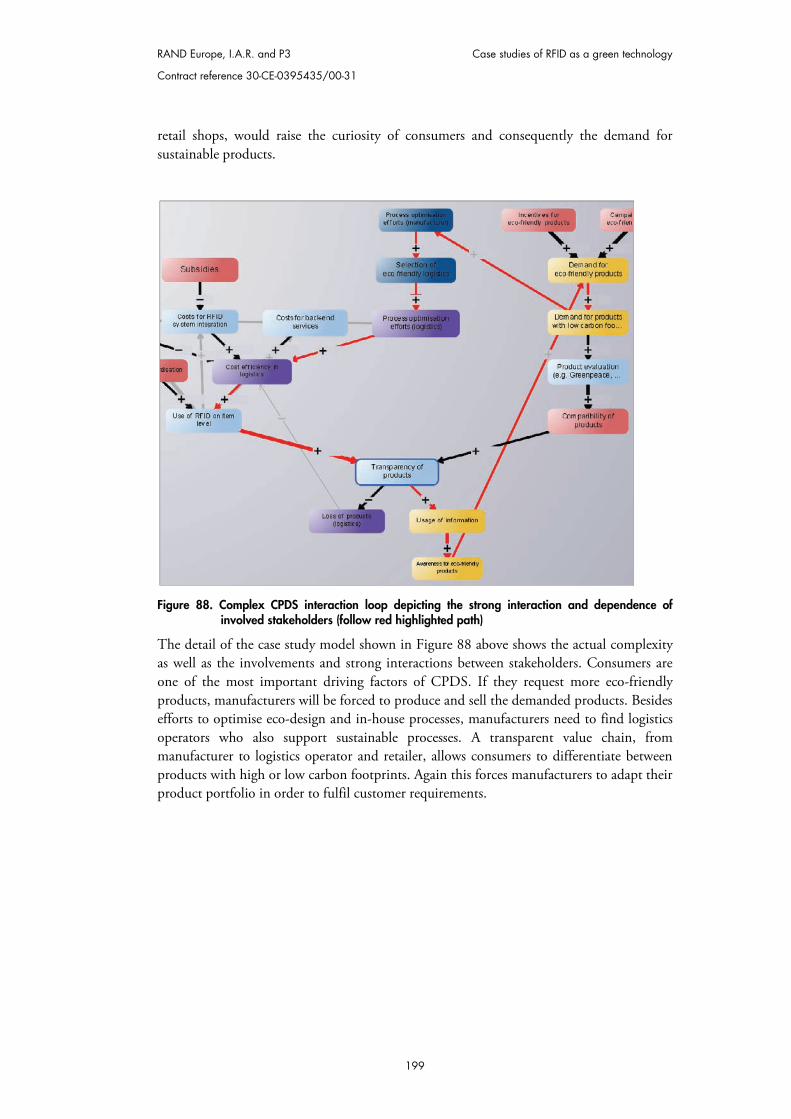
RAND Europe, I.A.R. and P3 Case studies of RFID as a green technology
Contract reference 30-CE-0395435/00-31
199
retail shops, would raise the curiosity of consumers and consequently the demand for sustainable products.
Figure 88. Complex CPDS interaction loop depicting the strong interaction and dependence of involved stakeholders (follow red highlighted path)
The detail of the case study model shown in Figure 88 above shows the actual complexity as well as the involvements and strong interactions between stakeholders. Consumers are one of the most important driving factors of CPDS. If they request more eco-friendly products, manufacturers will be forced to produce and sell the demanded products. Besides efforts to optimise eco-design and in-house processes, manufacturers need to find logistics operators who also support sustainable processes. A transparent value chain, from manufacturer to logistics operator and retailer, allows consumers to differentiate between products with high or low carbon footprints. Again this forces manufacturers to adapt their product portfolio in order to fulfil customer requirements.
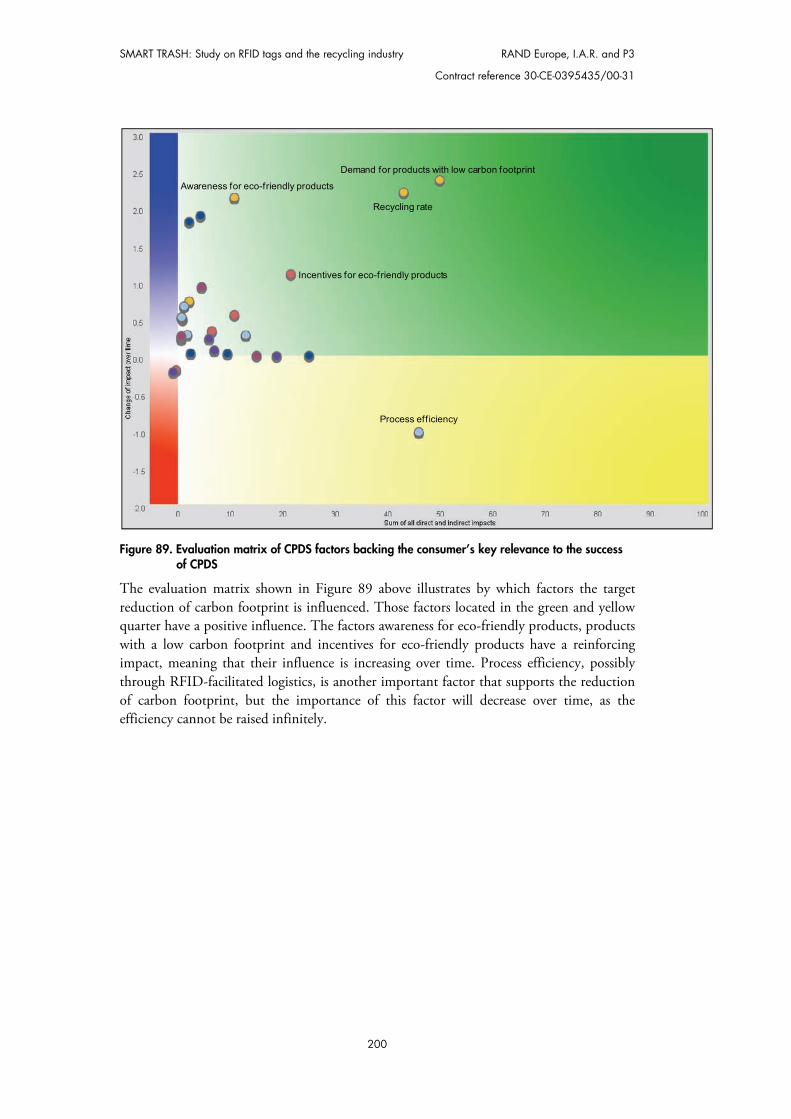
SMART TRASH: Study on RFID tags and the recycling industry RAND Europe, I.A.R. and P3
Contract reference 30-CE-0395435/00-31
200
Figure 89. Evaluation matrix of CPDS factors backing the consumer’s key relevance to the success of CPDS
The evaluation matrix shown in Figure 89 above illustrates by which factors the target reduction of carbon footprint is influenced. Those factors located in the green and yellow quarter have a positive influence. The factors awareness for eco-friendly products, products with a low carbon footprint and incentives for eco-friendly products have a reinforcing impact, meaning that their influence is increasing over time. Process efficiency, possibly through RFID-facilitated logistics, is another important factor that supports the reduction of carbon footprint, but the importance of this factor will decrease over time, as the efficiency cannot be raised infinitely.
Demand for products with low carbon footprint
Recycling rate
Process efficiency
Incentives for eco-friendly products
Awareness for eco-friendly products
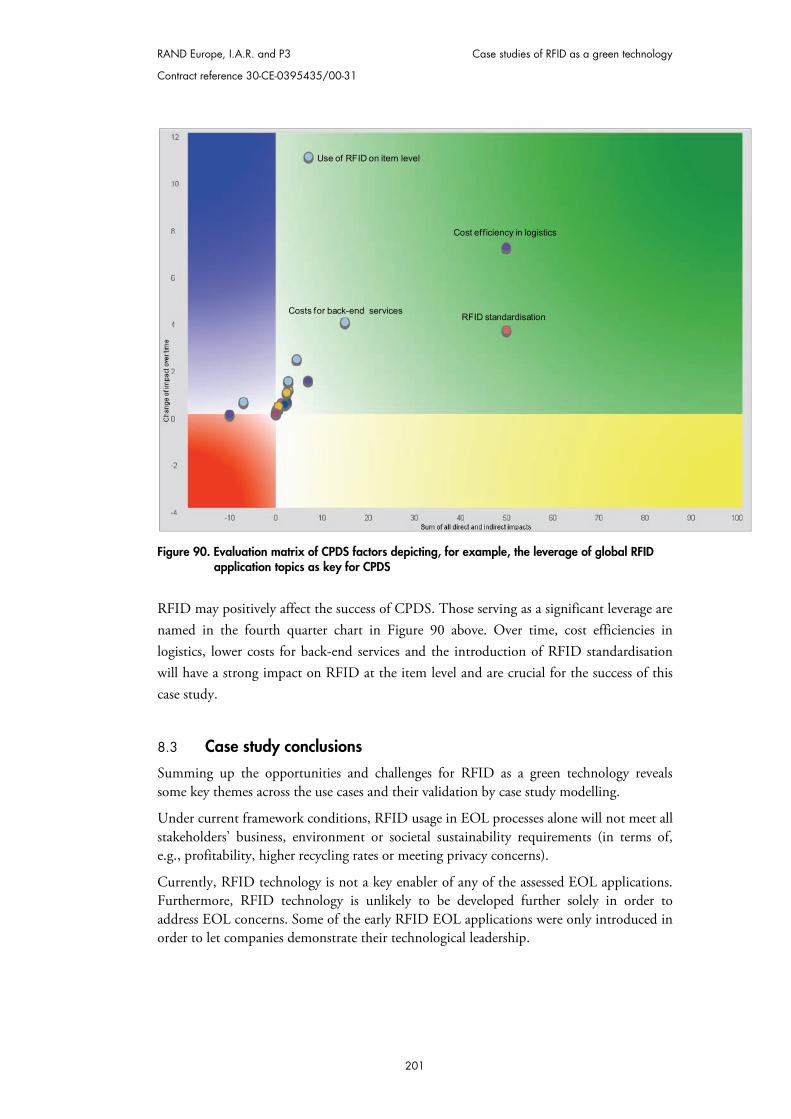
RAND Europe, I.A.R. and P3 Case studies of RFID as a green technology
Contract reference 30-CE-0395435/00-31
201
Figure 90. Evaluation matrix of CPDS factors depicting, for example, the leverage of global RFID application topics as key for CPDS
RFID may positively affect the success of CPDS. Those serving as a significant leverage are named in the fourth quarter chart in Figure 90 above. Over time, cost efficiencies in logistics, lower costs for back-end services and the introduction of RFID standardisation will have a strong impact on RFID at the item level and are crucial for the success of this case study.
8.3 Case study conclusions
Summing up the opportunities and challenges for RFID as a green technology reveals some key themes across the use cases and their validation by case study modelling.
Under current framework conditions, RFID usage in EOL processes alone will not meet all stakeholders’ business, environment or societal sustainability requirements (in terms of, e.g., profitability, higher recycling rates or meeting privacy concerns).
Currently, RFID technology is not a key enabler of any of the assessed EOL applications. Furthermore, RFID technology is unlikely to be developed further solely in order to address EOL concerns. Some of the early RFID EOL applications were only introduced in order to let companies demonstrate their technological leadership.
Use of RFID on item level
Cost efficiency in logistics
Costs for back-end servicesRFID standardisation
SMART TRASH: Study on RFID tags and the recycling industry RAND Europe, I.A.R. and P3
Contract reference 30-CE-0395435/00-31
202
RFID can only become a powerful means of optimising EOL processes if it is seen in the larger context of global information exchange, large-scale value chain integration and broad societal technical and environmental objectives.
A successful RFID implementation needs to be based on defined end-to-end processes with scale economies realised by shared application across industry sectors, coordinated by agreed responsibilities and information exchanges like those used in mature and stable production and logistics processes.
Such RFID implementation will only become self-sustaining if the narrowly commercial drivers of process and business development are amplified by environmental and societal concerns, etc. In particular, the key players must embrace (through market or policy linkage, or via business model or preference internalisation) the entire product lifecycle.
Consumer sensitivity to, for example, the carbon footprints of bought products or the opportunity cost of raw materials are currently not strong enough to push RFID into the EOL end of the value chain. This situation can be reversed by suitable price or regulatory incentives, by providing more relevant, understandable and comparable information to consumers, and/or by catalysing an increase in the societal salience of EOL concerns, carbon footprints and the like – in other words, by turning these aspects of tagged products into “merit goods” in their own right.
Apart from these megatrends, we note that current actual and potential applications cannot demonstrate the scale economies or growth potential needed to secure the funding and support necessary for process re-engineering and complementary investments. To demonstrate (and secure) these scale and dynamic effects requires an alignment of interests and potentially new business models (e.g., to share the costs and benefits of RFID-enhanced recycling). This finding raises the governance question: who would be able to support, moderate, promote and exploit research; validate results and progress; stimulate related programmes; organise awareness raising campaigns; and drive needed standardisation efforts?
Most of the use cases assessed and explicitly the CPDS case study rely on a holistic value-chain crossing scenario using RFID as a transversal data carrier within an open framework. From a top level perspective this parallels on-going initiatives in the Internet of Things.
Both cases emphasise the vital importance of an open network accessible to heterogeneous technologies, cost-free as well as billable micro services, and open standards to permit data recorded and primarily intended for use within specific proprietary manufacturing, logistic, and distribution systems to be read across independent – and also differentiated – waste handling systems. This openness is essential for:
Privacy, security and confidentiality of consumer inputs and information. Ease of participation, collaboration and innovation. Transmission of large-scale standardised product-related data via RFID tags and
linked back-end systems. Optimising the impetus provided by legislation, public procurement, etc. Facilitating adequate billing solutions to assure mid-term sustainability of
commercial drivers.
RAND Europe, I.A.R. and P3 Case studies of RFID as a green technology
Contract reference 30-CE-0395435/00-31
203
Such architectural scenarios for the future Internet of Things, including consumers, companies and public institutions, are currently part of innovative concepts. The requirement for an open, scalable, flexible, secure and sustainable infrastructure is a key factor to enable the creation of new user-centric value-chain businesses. As a part of this infrastructure, adequate information services need to be extended to provide broader support for all kinds of identifiers. Discovery services enabling item-level discovery (e.g., ONS from EPCglobal) are essential to enable a look-up service for carbon footprints at an item level as envisaged within the CPDS case study. At the present time, information service discovery operates at the product class level and not at the item level.

RAND Europe, I.A.R. and P3 Contract reference 30-CE-0395435/00-31
205
CHAPTER 9 Interim conclusions and next-phase issues
The project stands at a midway phase. This report has documented the analytic framework, overarching research questions, policy context and the technical and market analysis underpinning the research. It has also raised a number of specific issues that require further investigation in terms of the relationship between RFID and waste handling and potential market failures or other reasons for intervention or modification to existing policies affecting RFID and/or waste.
The project as a whole considers RFID tags from three perspectives: i) objects whose presence in waste streams has increasingly relevant implications; ii) functional capabilities that can be harnessed to improve the economic and environmental impacts of economic activity involving physical products; and iii) an important part of critical interacting systems (notably waste handling systems and the Internet of Things) central to European competitiveness and sustainability. This chapter takes stock of the significant findings of the project from each perspective and identifies open issues to be explored during the next phase, which will use an interactive and scenario-based workshop to validate the findings and draw out their broader implications.
9.1 Challenges and opportunities arising from RFID tag use
Part A of the project concentrated on the occurrence of RFID tags in a variety of waste streams and the specific environmental challenges resulting from interactions among overlapping (and sometimes conflicting) technological, commercial and policy drivers. In brief, conclusions at this stage are:
RFID tags are used in an increasing range of products and end up in an increasing range of waste streams.
Tags come in a wide variety of forms and serve a number of functions throughout the economy – as a result, their uptake and prevalence in different waste channels are likely to change as the economy develops.
This provides two points of connection between RFID tags and the waste disposal system: i) RFID tags are physical objects with distinctive composition and responses to waste handling processes; and ii) RFID-enhanced logistics and related
SMART TRASH: Study on RFID tags and the recycling industry RAND Europe, I.A.R. and P3
Contract reference 30-CE-0395435/00-31
206
applications directly affect the scale, composition and environmental efficiency of material flows throughout the economy (including waste streams).
To date, the environmental costs and benefits associated with spiralling RFID use do not appear to be adequately reflected in the design of tags, tagged products, and sensor systems that use RFID to improve distribution, sale, purchase, use and disposal.
Measurement of such costs and benefits is complicated by the variety of waste treatment processes and relatively patchy knowledge about the characteristics and response to treatment of tags in different configurations and concentrations; the project has conducted laboratory tests to improve this state of knowledge.
Tags create a potential conflict of regulation for waste treatment processes, because they typically enter waste streams associated with the objects in which they are embedded. These streams may already be regulated (e.g., electronic and electrical waste), but the RFID tags themselves might be subject to completely different regulations due to their components.
In general, the common framework provided by waste-orientated directives confronts Member States approximating them into national legislation with a series of choices or trade-offs reflecting their different legacy rules, waste treatment systems that developed under them, differences in waste stream compositions, organisation of collection, sorting and handling, etc. The prioritisation of specific measures (e.g., regulations for tagged objects vs regulations for tags) may therefore differ across Member States. The burdens of these regulations must be borne by producers, distributors and users; this variation in approach could therefore constitute a barrier to trade and reduce the “leverage” of the Single Market over design and practice improvements.
RFID tag recovery can also pose severe technical waste management challenges that could distort uptake, exploitation and environmental optimisation of the technology. For example, purity of materials is crucial to the integrity of high level recycling and waste processing, so some countries have dedicated collection systems for specific materials (e.g., glass, paper). The presence of “alien” materials such as tags creates a technical hazard for the recycling process. At the same time, budgetary and other pressures are increasing the prevalence of systems in which “recyclables” are collected together and sorted later into single-material streams. This opens the possibility the tags and systems could be redesigned to facilitate tag removal, which would restore the effectiveness of high-level specific processes.
As the RFID tag market expands, current trends (falling prices and rising volume and variety of uses) are expected to continue, raising the complexity and scale of the challenges posed by tags in waste streams.
Active tags incorporate on-board power sources (often batteries); this poses particular technological, regulatory and environmental challenges. These are not
RAND Europe, I.A.R. and P3 Interim conclusions and next-phase issues
Contract reference 30-CE-0395435/00-31
207
necessarily resolved by including active tags in existing regulatory categories of batteries or electrical and electronic waste; those regulations were crafted to deal with larger-scale and more complex devices and may not provide the most efficient way of dealing with active tags.
As tag volumes increase and alternatives such as chipless (printed) RFID become more attractive, the efficient matching of processes to different waste streams should also change (e.g., some currently landfilled wastes may become suitable candidates for recycling or incineration).
Tags are produced and distributed in globalised supply chains, while tagged goods are used in an expanding range of institutional and business model contexts. European and Member State regulations are based on assumptions about the geographic regions and market segments “reached” by the rules, and the responses of users and other stakeholders to changes in tag prices, performance and environmental characteristics and regulatory measures. These may need to be reassessed, especially if tag design takes place beyond the reach of European regulation. Ideally, the challenge of RFID in waste streams should be met through a combined approach involving changes in waste treatment systems to handle increasing volumes and changing varieties of tags and changes in economic and regulatory incentives to encourage improved design, uptake and utilisation of RFID tags and systems in ways that simplify detection, removal, etc. If significant parts of the value chain lie beyond the borders of the EU, intervention could have unintended or even perverse effects. In particular, a regulatory burden intended to encourage design improvements may simply increase compliance costs for European manufacturers of tagged products forced to obtain tags designed for a less-regulated global market.
9.2 RFID tag functionality as green technology
9.2.1 Improved consumer decision-making RFID can provide information that could increase the extent to which waste treatment considerations are taken into account during consumer purchase, use and disposal decisions. Purchase patterns should improve if RFID-borne information about the composition, disposal costs and environmental “footprint” of tagged objects is made easily available at time of purchase. Purchases would also improve if such information could be verified and linked back to consumers at the time of disposal as the basis for charges or rebates. Note that the first mechanism (better information at time of purchase) is not necessarily linked to RFID tags; the same function could be served by label and product fiche information as mandated under the Energy-Related Products Labelling Directive.26 RFID tags are more essential in the second case (waste sorting and charging) because such 26 Perhaps via enhanced information mandated in product-specific “Delegated Acts” giving force to the Directive
SMART TRASH: Study on RFID tags and the recycling industry RAND Europe, I.A.R. and P3
Contract reference 30-CE-0395435/00-31
208
systems should operate automatically and with a relatively high degree of assurance. As a practical matter, consumers might disable tags if their disposal could trigger additional charges; for this reason, rebates would probably be more effective. Other variants are possible, from “deposits” linked to the original purchase to disposal levies on manufacturers, but these need further discussion.
Consumers who know that they will (at time of purchase or disposal) pay for the processing of their waste will have financial incentives to avoid products (and packaging) whose handling is difficult and/or environmentally inefficient. This would in turn create competitive incentives to design and supply products and packaging for which these costs are minimised.
However, this monetisation of disposal externalities may produce rebound effects if e.g. i) prices do not reflect full social marginal costs; ii) decisions are distorted by spillovers from other monetised characteristics (e.g., economies of scale in production, increased energy efficiency leading to lower per-unit energy costs that are more than offset by increases in the number of units, etc.); iii) the characteristics triggering charges do not reflect changing technology, etc. For this reason, monetary incentives may not be the best approach; consumer behaviour may be more effectively influenced by using RFID tags to make environmental aspects (e.g., carbon footprint, waste disposal consequences) of purchase and disposal decisions visible, understandable and easy to compare or assess. This approach can stimulate the inclusion of environmental awareness in consumer preferences rather than prices. In this way, decisions can be further improved by additional information and by the societal reinforcement. The use of non-monetary informational approaches enabled by RFID tagging is entirely consistent with modern behavioural approaches to resolving other regulatory challenges such as energy use, and aligns well with growing general awareness of eco-friendly products.
Finally, as noted above, RFID tagged objects enter much larger waste streams. Instead of charging for, or tracking, the disposal of each such object separately, tagged waste could be counted against consumer “disposal budgets” (these need not be monetary, but could be used to produce “performance ratings”) for aggregate flows of specific types of waste. Where recyclables are collected together, tags would be read in the sorting process and associated to the original purchaser either by collection location or (in the case of complex objects) through serial number information.27
9.2.2 Improved disposal behaviour RFID tags can improve the “automatic” behaviour of consumers as well as conscious decision-making. Tags can be used to trigger “recycle me” notifications at the time of disposal. For this to happen, tags would have to provide general recycling information (identifying the right collection stream) or other relevant reuse/recycling information using common open formats readable by common sensors.28 The issue of tags as part of the waste stream can be addressed by “self-labelled tags” designed to respond to a common waste 27 This could also aid in the fight against “fly-tipping” or illicit disposal of waste, though again further investigation and discussion are needed
28 An alternative would be to have this information only for specific classes of application – for instance, all tagged plastic containers would have to report whether the container was made of PET or not
RAND Europe, I.A.R. and P3 Interim conclusions and next-phase issues
Contract reference 30-CE-0395435/00-31
209
reader with information about their presence, composition, removal, etc., as well as the characteristics of the object to which they are attached. This secondary, common tag response would be independent of the primary use of the tags, which could (continue to) involve proprietary and non-standardised information for logistic and other functions. This would in turn sharpen redesign incentives for greater tag recyclability and material recovery.
Challenges include technological conflicts and user interfaces, standardisation across sectors and countries, and high variability in usage.
9.2.3 Improved reuse, processing, recycling and disposal RFID tags containing recycling information can improve the visibility of EOL considerations throughout the product lifecycle. At the same time, they can improve waste handling efficiency and effectiveness (from sorting through recovery, recycling and disposal). This can even change ultimate destinations – for instance, tags containing composition and disassembly information have the potential to enable better material and value recovery from specific complex goods (e.g., costly electronic goods).
However, this is not automatic: substantial technical, informational, organisational and economic issues must be addressed to implement RFID as a green technology in this way. Technical challenges are connected to central waste treatment operations such as dismantling and particle size reduction. These processes obviously affect the structural integrity of tagged items and the functioning of tags. The utility of RFID tags in “green” applications may be limited if they cannot be reused or recovered as a result of treatment processes applied to tagged objects; at a minimum, the necessary information should be recorded before the tags are destroyed.
Another technical aspect is standardisation of tag characteristics (frequency ranges, information formats, etc.). Tags are initially produced for specific products and applications; these may be proprietary or (e.g., in the case of frequency ranges) nation-specific. The ultimate fate of tags lies in waste disposal systems having neither legal nor economic connections to tag suppliers nor to the logistic systems through which they flow; it would clearly be inefficient to equip waste disposal systems with readers for all the different tags that might arrive in the waste stream. Instead, a common standard must be adopted (perhaps backed by regulation), at least for disposal-related information. This standard should cover both the technical characteristics of tags (how they can be read) and the format and contents of the disposal-related information.
This creates organisational and commercial challenges. The costs of adopting (let alone monitoring and enforcing) these standards are incurred by tag designers and manufacturers and therefore by their clients in the manufacturing and logistics/retailing parts of the value chain. Some mechanism must be found to allocate these costs effectively, fairly and efficiently; when tags or tagged objects originate in different countries from disposal facilities, trade implications must also be factored in.
Standards implementation is neither costless nor simple on the disposal side, either. Waste disposal systems vary among (and even within) countries; so do the costs and benefits of adopting this green technology. Required specific disposal-relevant information may also vary from system to system (since different systems need to track different aspects of tagged
SMART TRASH: Study on RFID tags and the recycling industry RAND Europe, I.A.R. and P3
Contract reference 30-CE-0395435/00-31
210
objects). One solution would be a “universal” standard containing all possible relevant information, but this may be excessively costly and might not be implemented if the underlying regulation simply sets specific material targets.
Finally, tagging complex and costly objects to facilitate the reuse of systems, components or even scarce materials is likely to be resisted by manufacturers, who wish to protect the obsolescence of their products and to minimise competition from their own past sales.
9.2.4 Environmental benefits beyond recycling Supply chains have become increasingly complex in terms of sectors, stakeholders, timing and scheduling and the areas of the world through which they pass. RFID can improve supply chain efficiency, visibility and predictability. Real-time information and tracking of materials (including hazardous waste and valuable raw materials) could greatly improve the efficiency and sustainability of many sectors by minimising waste in the production and use of these goods and rationalising supply chains to minimise transport and storage costs.
9.2.5 Better data = smarter policy and better decisions Finally, as noted throughout this report, precise estimation of costs and benefits is complicated by the inconsistency and other weaknesses of data regarding the operation of the system as a whole, including the flow of materials and its responsiveness to changing environmental, economic, policy and other factors. Even if the use of RFID tags to provide composition and recycling information has only a modest initial impact on behaviour, design, pricing and waste disposal, it will inevitably produce a wealth of objective data that is currently lacking. These data will improve our understanding of how the system functions and allow us to calibrate stakeholder behaviour to the resulting costs and benefits. This reduction in uncertainty should lead to greater exploitation of the green potential of RFID by the market, and thus to a more sophisticated, proportionate, transparent and reliable waste policy framework.
9.3 RFID as part of smart systems
As one of the key enablers of the Internet of Things, RFID technology faces organisational governance issues. As the Internet of Things grows, applications may be interlinked with critical infrastructures, and are likely to be of broader logistical importance such that disruption to broader network architectures could have significant impacts. We need to ensure that the operation of crucial systems is maintained and that access to information is not disrupted (European Commission, 2007). These systemic effects can be seen in relation to the economy as a whole, governance, the environment, and specific smart logistic, disposal, etc., systems.
9.3.1 RFID in the broader economy Market estimates vary, but all agree that the global RFID market is likely to increase significantly in the next ten years. This growth will be strongest in traditionally large markets in North America and Europe (Germany is largest, followed by the UK and France). Emerging markets (particularly the Asia-Pacific region) are also expected to grow. Thus the relevance of RFIDs in waste streams is expected to increase; while the present study concentrates on RFID in European waste streams, there is a strong and obvious linkage to these other areas. In the first place, tags are produced and traded on global
RAND Europe, I.A.R. and P3 Interim conclusions and next-phase issues
Contract reference 30-CE-0395435/00-31
211
markets; Europe’s ability to enforce higher standards in terms of the composition and recyclability of tags will thus depend on its share of the global market and potentially on the importance of tags to suppliers and distributors importing tagged objects into the Single Market. At the same time, compliance with stricter rules will impose costs on European suppliers. But if European firms are able to sink the costs of improved tag designs and uses, they will be able to “tip the balance” in terms of improved tag recycling in the foreign markets into which they sell.29 In much the same way, if foreign suppliers wish to sell into European markets, they will have incentives to sink the costs of implementing better tag designs; having done this, they will be more likely to use the tags in their domestic and other foreign markets. Again, this will have a positive feedback effect on the adoption of improved waste handling techniques. Finally, to the extent that Europe is able to lead in this regard, the European tagged products and European technologies associated with their disposal will become more globally competitive.
The waste-specific economic benefits of improved RFID design and use could therefore be large. On the other hand, they may also be highly sector-specific and might not accrue equally to all stakeholders; for example, lower labour costs may not benefit employers and workers to the same degree. There may be other spillover benefits, such as high information accuracy, better quality and security (e.g., in counterfeiting applications), and real-time visibility by making operations and processes more efficient and less costly. Note that many of these are advantages of RFID adoption per se, rather than specific benefits of better ways of handling RFID-containing waste or using RFID to improve waste handling. What is important, however, is that these waste-specific developments reduce both the specific and the societal opportunity costs of using RFIDs and can therefore trigger further increases in use along with reduced environmental burden. This overall increase will enhance the benefits of RFID use more generally.
However, these benefits have their own challenges. Among the most significant is the infrastructure investment needed to support the RFID system, including hardware, software, IT services, human capital and in-house management of RFID programmes. A demonstration of strong investment returns is needed across all sectors in order to make these challenges worth overcoming – this is particularly true for tags as part of general waste streams, where piecemeal sector-by-sector adoption will produce less than proportionate benefits. In relation to tags as part of waste management, e.g., RFID-based waste sorting, the added benefits of such a system are at best incremental and the commercial arguments for implementing a new system are weak.
As noted above, the commercial benefits of RFID technology include increased efficiency in supply chain and product lifecycle management. By providing information on product use and disposal patterns, firms can understand the intended (and unintended) uses of a product. Such insights into product complexity can allow firms to better respond and adapt their products to consumer needs. The use of RFID in carbon footprinting is a good example; it enables improved real-time decision-making for producers and consumers and
29 In other words, if the use of “better” tags in European goods increases the prevalence of “better” tags in foreign waste streams, the waste handling systems in those countries will be more inclined to adopt technologies that minimise the impact of tags, or even the “green technologies” described in Section 9.2
SMART TRASH: Study on RFID tags and the recycling industry RAND Europe, I.A.R. and P3
Contract reference 30-CE-0395435/00-31
212
also facilitates an increased awareness and valuation of low-carbon products. This decreases environmental and monetary operation costs for firms, the supply chain in which they operate and consumers alike.
Beyond this, there are obvious growth opportunities for the waste collection and handling sectors, which may in turn facilitate other innovations and economies of scale. The industries involved in the design, supply and operation of “smart” waste handling procedures will also benefit; as indicated above, this may provide competitive advantages for Europe if it is able to consolidate its leading position and leverage its existing advantages in waste handling and other advanced technologies. In addition, new market opportunities may develop in reusing/reselling returned products and recycling their components, reclaiming their materials. Note that much of this currently takes place abroad, in labour-intensive and often dangerous conditions (e.g., electronic waste disposal). Such disposal could be repatriated and replaced with cleaner, safer and more efficient RFID-enabled processes and business models.
9.3.2 Governance opportunities and challenges Generally speaking, regulatory intervention must be justified in terms of market failure or specific and necessary linkage to other common policy objectives. Regulatory intervention at the European level must further respect the principle of subsidiarity and should conform as closely as possible to the Better Regulation Principles.30 In particular, proportionality demands that the burdens of regulation be minimised and appropriately allocated. In this area, where current needs for environmental impact minimisation must be balanced with economic development imperatives, commitments to minimise (in particular) public sector expenditure (e.g., on enforcement as well as public waste handling) and the desire to stimulate further innovation (Wager et al., 2005), any intervention should strive for technological and economic neutrality. Overly prescriptive or burdensome regulation may stifle innovation or crowd out superior alternative technologies and organisational/business model innovations. It has been suggested that recycling and waste management regulations should be clear, consistent and emphasise results rather than process (Saar & Thomas 2003). In addition, policies need to be designed with the complex nature of the EOL phase in mind, with its associated “green”, waste management, technological, organisational and economic issues factored in.
Regulatory challenges also apply to technical aspects of RFID tag application. Spectrum harmonisation has been a major factor in limiting the uptake of RFID tags (European Commission, 2010). Radio frequency is a scarce resource, and frequencies need to be established within which RFID devices can operate; as noted above, spectrum allocation can facilitate or impede international trade in tags or tagged objects and may impede the ability of domestic waste systems to handle tagged wastes originating from different spectrum policy jurisdictions. Strongly linked to the challenges of standardisation is the issue of intellectual property rights. RFID-related intellectual property is protected through standard mechanisms such as the European Patent Convention (Kruse et al., 2008). However, issues arise when standardisation is required. If technologies that are patented are set as European standards, this will hinder competition and block new entrants to the
30 Transparency, accountability, proportionality and consistency
RAND Europe, I.A.R. and P3 Interim conclusions and next-phase issues
Contract reference 30-CE-0395435/00-31
213
market, creating economic barriers to growth. In much the same way, unprotected intellectual property (e.g., the informational content of tags) may create barriers to the provision of “open” information to generic public readers.
Finally, as RFID becomes more pervasive in society, issues surrounding privacy and data security legislation become more important. RFID tags can store personal data, but can also be used to track the movement of people or monitor their behaviour. In this sense, privacy is more than just about personal data, but is also about privacy of individual actions. According to surveys, consultations and wider international bodies (OECD, 2008; CapGemini, 2005; European Commission, 2007), public awareness and understanding of RFID is limited, and lack of awareness limits the ability to assert choice with respect to privacy issues. This is particularly relevant here, in the sense that schemes for monitoring and analysing individual waste streams (e.g., as part of PAYT schemes) demonstrate clearly that privacy issues associated with waste disposal are also a matter of substantial public concern.
9.3.3 The social environmental ecosystem The growing importance of the environmental agenda is provides a window of opportunity for RFID technology. New environmental policy strategies like Product Stewardship (EPA, 2010; Adams, 2010) and Extended Producer Responsibility (EPR) (OECD, 2001) are changing the behaviour of governments, corporations and citizens alike. This has led to the development of new management principles, tools and strategies that can provide, respectively, the basis for action, practices to apply and the approaches and systems that can effectively embed sustainability into everyday business practice (Duque Ciceri et al., 2009). Examples include Green Procurement (Salaam, 2011), Green Manufacturing (Barreto et al., 2007), Environmental Management Strategy (IFS, 2010) and the Eco-Management and Audit Scheme (EMAS, 2011). Reduced waste and greater awareness on the part of consumers and a shift to producer responsibility are important to achieving a range of environmental objectives, such as the promotion of carbon footprinting, which could lead to fewer products with high GHG emissions and preferences for more eco-friendly products.
However, item-level tagging could have negative environmental effects if tags cannot be recycled, including adverse environmental impacts of tags that cannot be reclaimed and potentially greater greenhouse gas emissions during the reuse process. Moreover, calculating environmental benefits like true carbon footprints is costly and time-intensive (Dada et al., 2010). Some have also found potentially irreversible environmental harms from RFID. To prevent this, it may be necessary rapidly to implement measures such as: use of closed loop systems where transponders are in the system for a long time; regulations against the use of RFID tags in perishable goods; and application of eco-design principles to RFID tags to replace toxic and valuable materials in smart labels with materials adapted to the recycling and disposal paths of the tagged object. It is not known whether a failure to mitigate these potential adverse environmental impacts outweighs the benefits of “eco-tagging”, but with these measures the aggregate impact is more likely to be positive.
Global social and political attention on environmental sustainability is changing consumer behaviour and, ultimately, supply chain management. The so-called “sustainability imperative” (Lubin & Etsy, 2010) is leading companies to adapt and respond to consumer
SMART TRASH: Study on RFID tags and the recycling industry RAND Europe, I.A.R. and P3
Contract reference 30-CE-0395435/00-31
214
demand. RFID tags could increase consumers’ awareness of the impacts of their behaviour on the environment and the value of products. An improved product review culture could reduce waste and enhance rational consumer choices (OECD, 2007). Of course, these changes in attitudes and behaviour could take a long time and could be undermined by consumer concerns over privacy and security that lead them to remove or destroy RFID tags. Therefore, the use of RFID to drive “behavioural” progress on the environmental front is potentially aligned with progress in addressing security and privacy concerns.
9.3.4 RFID tags as part of integrated smart product systems RFID use can produce enhanced environmental benefits through, for example, its role in smart logistics systems and its contribution to other aspects of the Internet of Things (such as “Smart Cities”). It can also lead to self-organising waste flows, or smart charging schemes that link disposal back to consumers (pay/earn as you throw systems in which people have material disposal “budgets” and/or systems where people earn credits for recycling, etc.).
9.4 Concluding remarks
RFID tags are an inescapable part of the modern economy; they are instrumental in delivering a wide range of benefits and are becoming increasingly embedded in many facets of daily life. Emerging shifts, from globalisation to the Internet of Things, will only increase their centrality. This development raises a range of challenges; unaddressed, they could diminish or even reverse much progress. Many of the challenges are already well known (e.g., in relation to security and privacy). This report has drawn attention to another domain of impacts: environmental efficiency, especially as regards waste disposal. The challenges are sharply defined and supported by a considerable weight of evidence. However, they are far from insurmountable. On the contrary, this report demonstrates that RFID can move from an environmental problem in its own right to a central feature of a “smart” solution to a much wider range of waste-related environmental, technical and economic problems. Moreover, in doing so it can point the way to a more profound re-engineering of governance; by providing a wealth of accurate, credible, understandable and timely information, it can allow the system to move from formal controls that are costly to monitor and enforce and need continual updating to keep pace with technological change, to a form of “light-touch” governance that informs rather than constrains, and which operates much closer to day-to-day decisions and decision-makers. In addition, the proposed development of the waste disposal role of RFID tags is aligned with progress in addressing other areas of concern (e.g., security, IPR) and realizing their holistic potential in an increasing range of applications.
RAND Europe, I.A.R. and P3 Contract reference 30-CE-0395435/00-31
215
REFERENCES

RAND Europe, I.A.R. and P3 Contract reference 30-CE-0395435/00-31
217
Reference list
Adams G. 2010. 10 Principles of Responsible Product Stewardship. As of 6 February 2012: http://www.greenbiz.com/blog/2010/07/30/10-principles-responsible-product-stewardship
Aliaga, C., et al. 2011. Influence of RFID tags on recyclability of plastic packaging. Waste Management 31(6), 1133–38.
Alwast H, Birnstengel B & Häusler A. 2010. European Atlas of Secondary Raw Materials: 2006 Status Quo and Potential: Prognos.
American Iron and Steel Institute. 2006. Radio Frequency Identification (RFID) Tags: Copper Content Detrimental to Recycling. As of 6 February 2012: http://recyclingtech.org/AISI_SRI_RFID_2006.pdf
Angeles, R. 2010). The Significance of RFID in Green Supply Chain Initiatives. Working paper: University of New Brunswick Fredericton. Fredericton, Canada.
Arebey, M., Hannan, M., Basri, H., et al. 2010. RFID and Integrated Technologies for Solid Waste Bin Monitoring System. Proceedings of the World Congress on Engineering 2010, Vol.1.
Austria Glas Recycling GmbH. 2011. Glas recyceln. As of 6 February 2012: http://www.agr.at/fileadmin/redakteure/Grafiken/Glasrecycling_ist_ein_perfekter_Materialkreislauf_Materialflussbild.pdf
Barreto, L., Anderson, H., Anglin A. et al. 2007. Product Lifecycle Management in Support of Green Manufacturing. Society of Manufacturing Engineers, technical paper.
Beckmann, M. & Ncube, S. 2007. Bio- und Sekundärrohstoffverwertung. Witzenhausen: Witzenhausen-Inst. für Abfall Umwelt und Energie. (Fachbuchreihe Abfall-Wirtschaft des Witzenhausen-Instituts für Abfall, Umwelt und Energie).
Behrendt, S. 2004. Produktbegleitende Informationssysteme auf der Basis von Smart Labels. Im Rahmen des BMBF-geförderten Projekts “E-nnovation: E-Business und nachhaltige Produktnutzung durch mobile Multimediadienste”, BMBF-Förderkennzeichen 01RN016.
Betts, K. 2008. Reducing the global impact of e-waste. Environmental Science & Technology 42(5): 1393.
Bilitewski, W. et al. 2004: “Handbook on the implementation of Pay-As-You-Throw.” Eigenverlag des Forum für Abfallwirtschaft und Altlasten e.V. Dresden. 2004.
SMART TRASH: Study on RFID tags and the recycling industry RAND Europe, I.A.R. and P3
Contract reference 30-CE-0395435/00-31
218
Bindel, A., Conway, P., Justham, L., et al. 2010. New lifecycle monitoring system for electronic manufacturing with embedded wireless components: research paper. Circuit World 36(2):33–39.
Binder, C. & Domnitcheva, S. 2003. When Waste Becomes Intelligent: Assessing the Environmental Impact of Microchip Tagging. Proceedings of SETAC/ISIE/Swiss Discussion Forum, Lausanne.
Binder, C., Quirici, C., Domnitcheva, S. & Stäubli, B. 2008. Smart labels for waste and resource management. Journal of Industrial Ecology 12(2):207–28.
Bose, I and Yan, S. 2011. ‘The Green Potential of RFID Projects: A Case-Based Analysis’. IT Pro, January/February 2011: 41-47.
Bowyer, C., et.al. 2010. Supporting the thematic strategy on waste prevention and recycling: final report. European Commission DG ENV, service request five under contract ENV.G.4/FRA/2008/0112.
Brusselaers, J., Mark, F. & Tange, L. 2006. Using metal-rich WEEE Plastics as Feedstock / Fuel Substitute for an Integrated Metals Smelter. Brussels. As of 6 February 2012: www.plasticseurope.org
Bundesumweltministerium (BMU). 2010. Verpackungen gesamt Verbrauch, Verwertung, Quoten 1991 bis 2008 (in Kilotonnen) in der Bundesrepublik Deutschland. As of 6 February 2012: http://www.bmu.de/files/pdfs/allgemein/application/pdf/entw_verbrauch_verwertung_bf.pdf
Busch, G. & Pötzsch, G. 2005. RFID–Revolution im Abfallmanagement und Recycling. Zeitschrift MÜLL und ABFALL 10:518–21.
Cao, H., Folan, P., Mascolo, J., et al. 2009. RFID in product lifecycle management: a case in the automotive industry. International Journal of Computer Integrated Manufacturing 22(7):616–37.
CapGemini. 2005. RFID and Consumers. What European Consumers Think About Radio Frequency Identification and the Implications for Business. CapGemini.
CEN. 2003. Aluminium and aluminium alloys – scrap. EN 13920 1-16.
Cole, P.H. et al. 2010. “The next generation of RFID technology.” In Unique Radio Innovation for the 21st century. (Berlin; Heidelberg: Springer-Verlag)
CONCLORE Project - Final Report. Bremen Institute of Industrial Technology and Applied Work Science (BIBA). 2007
Dada, A., Rau, A., Konkel, M., et al. 2009. The Potential of the EPC Network to Monitor and Manage the Carbon Footprint of Products. Part 1: Carbon Accounting. Auto-ID Labs White Paper WP-BIZAPP-047.
Dada, A., Rau, A., Konkel, M., et al. 2010. The Potential of the EPC Network to Monitor and Manage the Carbon Footprint of Products. Part 2: Dynamic Carbon Footprint Demonstrators. Auto-ID Labs White Paper WP-BIZAPP-054.
Dada, A., von Reischach, F. & Staake, T. 2008. Displaying Dynamic Carbon Footprints
RAND Europe, I.A.R. and P3 Reference list
Contract reference 30-CE-0395435/00-31
219
of Products on Mobile Phones. In R. Mayrhofer et al. (eds.) Advances in Pervasive Computing, Adjunct Proceedings of the 6th International Conference on Pervasive Computing, pp. 119–121. As of 6 February 2012: http://www.pervasive2008.org/Papers/Demo/d5.pdf
Dahlén, L., Lagerkvist, A. 2010: “Pay as you throwStrengths and weaknesses of weight-based billing in household waste collection systems in Sweden” in Waste Management 30 (2010) 23–31 available from http://www.sciencedirect.com/science/article/pii/S0956053X09003766
Das, R. 2011. How Green is RFID? e-FlexoGlobal. As of 6 February 2012: http://www.flexoglobal.com/flexomag/09-July/flexomag-das.htm
Das, R. & Harrop, P. 2011. RFID Forecasts, Players and Opportunities 2011–2021. IDTechEx.
Daschner, F. 2000. Practical Guide for Optimising the Disposal of Hospital Waste: Reduction and Utilisation of Hospital Waste, with the Focus on Hazardous, Toxic and Infectious Waste (LIFE96ENV/D/10). Institute for Environmental Medicine and Hospital Hygiene.
Day, C. 2006. Frequently Asked Questions on Directive 2002/95/EC on the Restriction of the Use of certain Hazardous Substances in Electrical and Electronic Equipment (RoHS) and Directive 2002/96/EC on Waste Electrical and Electronic Equipment (WEEE). As of 6 February 2012: http://ec.europa.eu/environment/waste/pdf/faq_weee.pdf
Deutsches Kupferinstitut. 2011. Recycling von Kupferwerkstoffen. As of 6 February 2012: http://www.kupferinstitut.de/front_frame/pdf/Recycling%20von%20Kupferwerkstoffen%20-%20final.pdf
Dubois, M., Martin Gonzalez, A. & Knadel, M. 2004. Municipal solid waste treatment in the EU. Aarhus: Centre for Environmental Studies.
Duque Ciceri, N., Garetti, M., Terzi, D. 2009. Product Lifecycle Management Approach for Sustainability. Proceedings of CIRP Design Conference at Cranfied University, Cranfield, UK.
Eco-Management and Audit Scheme (EMAS). (2012). 'Key elements of EMAS'. European Commission: EMAS. As of 15 Feb 2012: http://ec.europa.eu/environment/emas/about/summary_en.htm
Edwards, J. 2008. The Green Technology. RFID Journal: April.
Environmental Protection Agency (EPA). 2002. European Waste Catalogue and Hazardous Waste List. EPA Ireland.
U.S. Environmental Protection Agency (EPA). 2010. ‘Wastes – Partnerships – Product Stewardship’. Environmental Protection Agency. As of 8 April 2011: http://www.epa.gov/osw/partnerships/stewardship/.
Erdmann, L. 2010. Zukünftige Risiken des Eintrags von RFID-Tags in den Siedlungsabfall. Munich. As of 6 February 2012: http://www.isis-specials.de/profile_pdf/1i156_ed_rfid0310.pdf
SMART TRASH: Study on RFID tags and the recycling industry RAND Europe, I.A.R. and P3
Contract reference 30-CE-0395435/00-31
220
Erdmann, L., Hilty, L. & Althaus, H.-J. 2009. Einfluss von RFID-Tags auf die Abfallentsorgung: Prognose möglicher Auswirkungen eines massenhaften Einsatzes von RFID-Tags im Konsumgüterbereich auf die Umwelt und die Abfallentsorgung. Dessau-Roßlau: Umweltbundesamt.
ETRMA. 2010. End of life tyres: A valuable resource with growing potential. 2010 edition. Brussels.
European Commission. Council Directive 91/689/EEC of 12 December 1991 on hazardous waste. As of 6 February 2012: http://eur-lex.europa.eu/LexUriServ/LexUriServ.do?uri=CELEX:31991L0689:EN:HTML
European Commission. 1994. Council Directive 94/62/EC of 20 December 1994 on packaging and packaging waste. As of 6 February 2012: http://eur-lex.europa.eu/LexUriServ/LexUriServ.do?uri=CELEX:31994L0062:EN:NOT
European Commission. 1999. Council Directive 1999/31/EC of 26 April 1999 on the landfill of waste. As of 6 February 2012: http://eur-lex.europa.eu/LexUriServ/LexUriServ.do?uri=CELEX:31999L0031:EN:NOT
European Commission. 2000a. Council Directive 2000/53/EC of 18 September 2000 on end-of life vehicles. As of 6 February 2012: http://eur-lex.europa.eu/LexUriServ/LexUriServ.do?uri=CELEX:32000L0053:EN:NOT
European Commission. 2000b. 2000/532/EC: Commission Decision of 3 May 2000 replacing Decision 94/3/EC establishing a list of wastes pursuant to Article 1(a) of Council Directive 75/442/EEC on waste and Council Decision 94/904/EC establishing a list of hazardous waste pursuant to Article 1(4) of Council Directive 91/689/EEC on hazardous waste (notified under document number C(2000) 1147). As of 6 February 2012: http://eur-lex.europa.eu/smartapi/cgi/sga_doc?smartapi!celexplus!prod!CELEXnumdoc&numdoc=32000D0532&lg=en
European Commission. 2000c. Council Directive 2000/76/EC of 4 December 2000 on the incineration of waste. As of 6 February 2012: http://eur-lex.europa.eu/LexUriServ/LexUriServ.do?uri=CELEX:32000L0076:en:HTML
European Commission. 2003a. Council Directive 2002/95/EC of 27 January 2003 on the restriction of the use of certain hazardous substances in electrical and electronic equipment. As of 6 February 2012: http://eur-lex.europa.eu/LexUriServ/LexUriServ.do?uri=CELEX:32002L0095:en:NOT
European Commission. 2003b. Council Directive 2002/96/EC of 27 January 2003 on waste electrical and electronic equipment (WEEE). As of 6 February 2012: http://eur-lex.europa.eu/LexUriServ/LexUriServ.do?uri=CELEX:32002L0096:en:NOT
European Commission. 2005. Commission Decision 2000/532/EC
European Commission. 2006. Council Directive 2006/12/EC of 5 April 2006 on waste. As of 6 February 2012: http://eur-lex.europa.eu/LexUriServ/LexUriServ.do?uri=CELEX:32006L0012:en:NOT
RAND Europe, I.A.R. and P3 Reference list
Contract reference 30-CE-0395435/00-31
221
European Commission. 2006a. The Story behind the Strategy: EU Waste Policy. As of 6 February 2012: http://ec.europa.eu/environment/waste/pdf/story_book.pdf
European Commission. 2006b. Waste incineration: Integrated Pollution Prevention and Control. Reference Document on the Best Available Techniques for Waste Incineration. As of 6 February 2012: http://ec.europa.eu/environment/ippc/brefs/wi_bref_0806.pdf
European Commission. 2007. Communication from the Commission to the European Parliament, the Council, the European Economic and Social Committee and the Committee of the Regions. Radio Frequency Identification (2007) in Europe: steps towards a policy framework. COM(2007) 96 final.
European Commission. 2008. Council Directive 2008/98/EC of 19 November 2008 on waste and repealing certain Directives. As of 6 February 2012: http://eur-lex.europa.eu/LexUriServ/LexUriServ.do?uri=CELEX:32008L0098:en:NOT
European Commission. 2009. Internet of Things – An Action Plan for Europe. As of 6 February 2012: http://ec.europa.eu/information_society/policy/rfid/documents/commiot2009.pdf
European Commission. 2010. Commission Staff Working Document. On Retail Services in the Internal Market. Accompanying document to the Report on Retail Market Monitoring: "Towards more efficient and fairer retail services in the Internal Market for 2020". (SEC(2010)807).
European Commission DG ENV. 2007. Follow-up study on the implementation of Directive 1999/31/EC on the landfill of waste in EU-25. Final Report - Findings of the Study. As of 6 February 2012: http://ec.europa.eu/environment/waste/pdf/study/cowi_report.pdf
European Environment Agency. 2007. The road from landfilling to recycling: Common destination, different routes. Copenhagen.
European Environment Agency. 2009. Diverting waste from landfill: Effectiveness of waste-management policies in the European Union. Copenhagen.
European Integrated Pollution Prevention and Control. 2006. Waste Treatment Industries. BREF Document.
European EPC Competence Center (EECC). 2010. “The UHF Tag Performance Survey.”
European Steel Association. 2005. European Steel Scrap Specification. As of 6 February 2012: http://www.eurofer.org/eurofer/docs/EurSteelScrapSpec.pdf
Eurostat. 2011a. Commercial and industrial waste. As of 6 February 2012: http://epp.eurostat.ec.europa.eu/portal/page/portal/waste/data/sectors/commercialandindustrial
Eurostat. 2011b. Waste Statistics. As of 6 February 2012: http://epp.eurostat.ec.europa.eu/portal/page/portal/waste/data/database

SMART TRASH: Study on RFID tags and the recycling industry RAND Europe, I.A.R. and P3
Contract reference 30-CE-0395435/00-31
222
Eurostat. 2012. Municipal waste generated and treated: Deposit onto or into land. As of 6 February 2012: http://epp.eurostat.ec.europa.eu/portal/page/portal/waste/data/sectors/municipal_waste
Fachverband Getränkekarton e.V. (FKN). 2011a. Getränkekarton: Verbunde sind High-Tech-Werkstoffe. As of 6 February 2012: http://www.getraenkekarton.de/01_seiten/page.php?nid=11
Fachverband Getränkekarton e.V. (FKN). 2011b. Recycling: Trennung mit konventioneller Technik. As of 6 February 2012: http://www.getraenkekarton.de/01_seiten/page.php?nid=17
Finkenzeller, K. 2006. RFID-Handbuch: Grundlagen und praktische Anwendungen induktiver Funkanlagen, Transponder und kontaktloser Chipkarten (4th ed.). München; Wien: Hanser.
Finkenzeller, K. 2010. „RFID Handbook: Fundamentals and Applications in Contactless Smart Cards, Radio Frequency Identification and Near Field Communication.” (3rd ed.) (Chichester: John Wiley & Sons, Ltd.)
Främling, K., Harrison, M. & Brusey, J. 2006. Globally unique product identifiers-requirements and solutions to product lifecycle management. Proceedings of 12th IFAC Symposium on Information Control Problems in Manufacturing (INCOM), 17-19 May 2006, Saint-Etienne, France, pp. 811–16.
Friedlos, D. 2011. South Korean Consortium Launches EPC Gen 2 Reader for Mobile Phones: Developed by a group that includes SK Telecom, an inexpensive RFID interrogator in the form of a USIM card is already being used to verify the authenticity of whiskey. RFID Journal. As of 6 February 2012: http://www.rfidjournal.com/article/view/8155
Friedrich, P., Neidhardt, U. 2005: „Wäge- und Identsysteme in der Entsorgungs-wirtschaft“ in Müll-Handbuch (2005) available from http://www.MUELLHANDBUCHdigital.de
Furuta, T., Tonooka, H. & Kobayashi, M. 2008. Research on Recycling Cardboard with RF Tags/Labels. Tokyo, JAPAN: The Eighth International Conference on EcoBalance.
Gambon, J. 2008. “Printed-Electronics RFID Tags: from Promise to Reality.” RFID Journal. As of 13 February 2012
Gesellschaft für Verpackungsmarktforschung. 2011. Verbrauch von Getränken in Einweg- und Mehrweg-Verpackungen, Berichtsjahr 2009. As of 6 February 2012: http://www.umweltdaten.de/publikationen/fpdf-l/3980.pdf
GHK. 2006. A study to examine the benefits of the End of Life Vehicles Directive and the costs and benefits of a revision of the 2015 targets for recycling, re-use and recovery under the ELV Directive. Final Report to DG Environment. Birmingham: GHK Consulting. As of 6 February 2012: http://ec.europa.eu/environment/waste/pdf/study/final_report.pdf
RAND Europe, I.A.R. and P3 Reference list
Contract reference 30-CE-0395435/00-31
223
Goroyias, G., Elias, R. & Fan, M. 2004. Research into using recycled waste paper residues in construction products: WRAP Project code: PAP009-011. Oxon: The Waste & Resources Action Programme.
Goo, K., Lee, J.-Y. & Kim Y.-J. 2007. A Policy Making Procedure and Economic Feasibility Analysis of the RFID System in the Medical Waste Management.
Greengard, S. 2010. Tracking garbage. Communications of the ACM 53(3):19–20.
Groh, H., Hoss, D., Jandt, S. & Löhle, S. 2010. Smarte Produktkennzeichnung von Mobiltelefonen mittels RFID - Nutzung im Altgeräterecycling und datenschutzkonforme technische Ausgestaltung. Müll und Abfall 7.
Guinard, D., von Reischenbach, F., Michahelles, F. et al. 2008. Mobile Toolkit: Connecting the EPC Network to Mobile Phones. Proceedings of Mobile Interaction with the Real World (MIRW 08 at ACM Mobile HCI 2008).
Hans, C., Hribernik, K. & Thoben, K. 2010. Improving reverse logistics processes using item-level product life cycle management. International Journal of Product Lifecycle Management 4(4):338.
Harrison, M., McFarlane, D., Parlikad, A. et al. 2004. Information management in the product lifecycle - the role of networked RFID. Auto-ID Labs White Paper WP-BIZAPP-014.
Hilty, L. & Althaus, H.-J. 2009. Einfluss von RFID-Tags auf die Abfallentsorgung: Prognose möglicher Auswirkungen eines massenhaften Einsatzes von RFID-Tags im Konsumgüterbereich auf die Umwelt und die Abfallentsorgung. Dessau-Roßlau. As of 6 February 2012: http://www.umweltdaten.de/publikationen/fpdf-l/3845.pdf
Holmquist, L., Redström, J. & Ljungstrand, P. 1999. Token-Based Access to Digital Information. In Gellersen, H. (ed.), Handheld and Ubiquitous Computing, Lecture Notes in Computer Science No. 1707, 234–45. Springer-Verlag.
IFS. 2010. ERP and Environmental Footprint Management for Manufacturers. IFS: Sweden. Accessed on 15 Feb 2012 at: Abdoli, S. 2009. RFID Application in Municipal Solid Waste Management System. Int. J. Environ. Res. 3(3):447–454.
Institute for European Environmental Policy. 2010. Proposed final report structure … supporting the thematic strategy on waste prevention and recycling. Service request five under contract env.g.4/fra/2008/0112.
Ilic, A., Staake, T. & Fleisch, E. 2009. Using Sensor Information to Reduce the Carbon Footprint of Perishable Goods. IEEE Pervasive Computing 8(1):22–29.
Inoue, S., Kanomi, S. & Yasuura, H. 2002. Privacy in the digitally named world with RFID tags. Workshop on Socially-informed Design of Privacy-enhancing Solutions in Ubiquitous Computing. As of 6 February 2012: http://www.c.csce.kyushu-u.ac.jp/lab_db/papers/paper/pdf/2002/sozo02_2.pdf
INTECUS. 2011. Best Practice Municipal Waste Management: Information pool on approaches towards a sustainable design of municipal waste management and supporting technologies and equipment. Dessau-Roßlau. As of 6 February 2012: http://www.umweltbundesamt.de/abfallwirtschaft/best-practice-mwm.php
SMART TRASH: Study on RFID tags and the recycling industry RAND Europe, I.A.R. and P3
Contract reference 30-CE-0395435/00-31
224
IOS. 2008. Information technology – Radio frequency identification for item management – Implementation guidelines – Part 2: Recycling and RFID tags. ISO/IEC TR 24729-2:2008.
ITAD. 2011. Rückstände aus der Hausmüllverbrennung. As of 6 February 2012: http://www.itad.de/itad/reststoffe/index.html
Ivantysynova, L., Klafft, M., Ziekow H. et al. 2009. RFID in manufacturing: the investment decision. Pacific Asia Conference on Information Systems Proceedings. As of 6 February 2012: http://www.pacis-net.org/file/2009/%5B39%5DRFID%20IN%20MANUFACTURING_%20THE%20INVESTMENT%20DECISION.pdf
Jansen, R., Gliesche, M. & Helmigh, M. 2007. Auswirkungen eines RFID Masseneinsatzes auf Entsorgungs- und Recyclingsysteme. Diese Studie wurde im Rahmenprogramm Mikrosysteme 2004-2009 durch das Bundesministerrium für Bildung und Forschung gefördert. Förderkennzeichen: 16SV2280. Universität Dortmund, Fachgebiet Logistik.
Jun, H.-B., Shin, J.-H., Kim Y.-S. et al. 2009. A framework for RFID applications in product lifecycle management. International Journal of Computer Integrated Manufacturing 22(7):595–615.
Khan, O., Scotti, A., Leverano, A. et al. 2006. RFID in automotive: a closed-loop approach. ICE conference proceedings.
Kopsick, D., Bearden, J., Varner, K. et al. 2008. Radio Frequency Identification (RFID) in Tracking Hazardous Waste Across Domestic and International Borders: Supporting GPRA Goal #5: Better Waste Management.
Kranert, M. & Cord-Landwehr, K. 2010. Einführung in die Abfallwirtschaft. 4., vollständig aktualisierte und erweiterte Auflage. Wiesbaden: Vieweg + Teubner. As of 6 February 2012:
Kreck, M. 2007: „Funk auf dem Vormarsch“ in entsorga-Magazin no.6, 18-19.
Kruse, A., Mortera-Martinez, C., Corduant, V. et al. 2008. Final report Work package 5: The Regulatory Framework for RFID. CE RFID. Kuhnhenn, K. & Urban, A. 2006. Individuelle Produktverantwortung für Elektroaltgeräte – Durch RFID zum Ziel?: Achieving individual product liability for WEEE with RFID. Müll und Abfall 12:638–44.
Lee, C. & Chan, T. 2009. Development of RFID-based Reverse Logistics System. Expert Systems with Applications 36:9299–307.
Letcher, T. & Vallero, D. 2011. Waste: A handbook for management. Burlington, MA: Academic Press.
Löhle, S. & Urban, A. 2008. Neue Wege: Potenziale von RFID in der Entsorgungswirtschaft. Müll-Handbuch, no. 0155.
Löhle, S., Urban, A. & Reyes, J. 2009. Mehr Transparenz im Abfall – Experimentelle Untersuchungen zur Erkennung gekennzeichneter Altprodukte in einem RFID-3D-gate zur Unterstützung von Sortierprozessen. Müll und Abfall 5.
RAND Europe, I.A.R. and P3 Reference list
Contract reference 30-CE-0395435/00-31
225
Lubin, D.A. & Etsy, D.C. (2010). The sustainability imperative. Harvard Business Review, 88: 42-50.
Mallett, S., Danta, R., Benson, J. et al. 2007. Handheld medical waste sorting method. US Patent 7,303,081 B2.
Martens, H. 2011. Recyclingtechnik. Heidelberg: Spektrum Akad. Verl.
Mayer, L. & Scholtz, A. 2008. A Dual-Band HF / UHF Antenna for RFID tags. Vienna University of Technology. As of 6 February 2012: http://publik.tuwien.ac.at/files/PubDat_167140.pdf
MetroSense. As of 6 February 2012: http://www.metrosense.com/
Metschke, J., Magel, G. & Spiegel, W. 2005. Wasserstoffbildungspotential in MVA/MPA-Flugstäuben: Endbericht L24. Augsburg: Bayerisches Landesamt für Umweltschutz.
Monier, V. et.al. 2011. Implementing EU Waste Legislation for Green Growth: Final Report prepared for European Commission DG ENV. European Commission DG ENV.
Odin Labs. 2010. “RFID Tag Pricing Guide.” (ODIN technologies Inc.)
Office for Official Publications of the European Communities. 2008. Statistical classification of economic activities in the European Community. Luxembourg.
One Plus Corp. 2011. Monitoring systems for computerized trash, waste, recycling compactors. As of 6 February 2012: http://www.onepluscorp.com/hauler/green_benefits.asp
Organisation for Economic Co-operation and Development. 2001. Extended Producer Responsibility: A Guidance Manual for Governments. Paris: Organisation for Economic Co-operation and Development.
Organisation for Economic Co-operation and Development. 2007. Participative Web and User-Created Content: Web 2.0, Wikis and Social Networking. Paris: Organisation for Economic Co-operation and Development.
Organisation for Economic Co-operation and Development. 2008. RFID Applications, Impacts and Country Initiatives. Paris: Organisation for Economic Co-operation and Development.
Pappu, M., Singhal, R. & Zoghi, B. 2005. RFID in hospitals: issues and solutions. RFID Journal.
Parks Associates. 2010. Mobile preferences show generational divide as younger smartphone users choose apps over Web browsers. As of 6 February 2012: http://www.parksassociates.com/blog/article/mobile-pr-nov2010
Parlikad, A. & McFarlane, D. 2004. Recovering value from End-of-Life Equipment. Technical Report No. CUED/E-MANUF/TR.29. Cambridge University Engineering Department.
Parlikad, A. & McFarlane, D. 2007. RFID-based product information in end-of-life decision making. Control Engineering Practice 15:1348–63.
SMART TRASH: Study on RFID tags and the recycling industry RAND Europe, I.A.R. and P3
Contract reference 30-CE-0395435/00-31
226
Parlikad, A., McFarlane, D., Fleisch, E. et al. 2003. The Role of Product Identity in End-of-Life Decision Making. Auto-ID Labs White Paper.
PlasticsEurope. 2011. Plastics – the Facts 2011: An analysis of European plastics production, demand and recovery for 2010. As of 6 February 2012: http://www.plasticseurope.org/Document/plastics---the-facts-2011.aspx?Page=DOCUMENT&FolID=2
PIAw@tch. 2011. Privacy and data protection Impact Assessment for RFID applications. As of 6 February 2012: http://www.piawatch.eu/pdpia-oia
Prüss, A., Giroult, E. & Rushbrook, P. 1999. Safe management of wastes from health-care activities. World Health Organization.
Rahimifard, S., Abu Bakar, M. & Williams, D. 2009. Recycling process planning for the End-of-Life management of waste from electrical and electronic equipment. CIRP Annals - Manufacturing Technology 58:5–8.
Reichenbach, J. 2008. Status and prospects of pay-as-you-throw in Europe – A review of pilot research and implementation studies. Waste Management 28(12).
Reischach, F. von, Guinard, D., Michahelles, F. et al. 2009a. A mobile product recommendation system interacting with tagged products. IEEE International Conference on Pervasive Computing and Communications, 1–6.
Reischach, F. von, Michahelles, F. & Schmidt, A. 2009b. The design space of ubiquitous product recommendation systems. Proceedings of the 8th ACM SIGMOBILE Conference on Mobile and Ubiquitous Multimedia, 1–10.
Riekki, J., Salminen, T. & Alakarppa, I. 2006. Requesting Pervasive Services by Touching RFID tags. IEEE Pervasive Computing 5(1):40–46.
Roberti, M. 2011: The History of RFID Technology, RFID Journal. Available at http://www.rfidjournal.com/article/view/1338 [Accessed October 2011]
Robinson, B. 2009. E-waste: An assessment of global production and environmental impacts. Science of the Total Environment 408:183–91.
Saar, S. & Thomas, V. 2003. Toward Trash That Thinks: Product Tags for Environmental Management: Product Tags for Environmental Management. Journal of Industrial Ecology 6(2)133–46.
Salaam, M. 2011. Creating Sustainable Supply Chain Through Green Procurement. International Journal of Business Insights Transformation 3(3):83–90.
Schrör, H. 2011. Generation and treatment of waste in Europe 2008: Steady reduction in waste going to landfills. Statistics in focus 44. Eurostat.
Steiner M. 2007. MBT in Europe. Waste Management World. As of 6 February 2012: http://www.waste-management-world.com/index/display/article-display/304397/articles/waste-management-world/volume-8/issue-4/features/mbt-in-europe.html
RAND Europe, I.A.R. and P3 Reference list
Contract reference 30-CE-0395435/00-31
227
StEP. 2010. Annual Report. As of 6 February 2012: http://www.step-initiative.org/pdf/annual-report/Annual_Report_2010.pdf
Sullivan, L. 2004. Japanese Waste-Management Company Tests RFID. Information Week. As of 6 February 2012: http://www.informationweek.com/news/23902097
Sutco. 2010. Sorting Sytems for packaging waste. As of 6 February 2012: http://www.sutco.de/en/plant-engineering/sorting-systems/light-weight-packagings/technical-information/
Tagawa, K. 2011. The Innovation Connection. How NFC is driving new global opportunities. NFC World Congress. As of 6 February 2012: http://www.nfc-forum.org/resources/presentations/Koichi_Tagawa_NFC_World_Congress_Sept_19_final.pdf
Taku, F., Hidetoshi, T. & Masaru, K. 2008. Research on Recycling Cardboard with RF Tags/Labels. Tokyo: The Eighth International Conference on EcoBalance.
Thomas, V. 2003. Product Self-Management: Evolution in Recycling and Reuse. Environ. Sci. Technol. 37:5297–302.
Thomas, V. 2008. Radio-Frequency Identification: Environmental Applications. Foresight in Governance Project. Woodrow Wilson International Center for Scholars.
Thomas, V. 2009. A universal code for environmental management of products. Resources, Conservation and Recycling 53:400–08.
Thoroe, L., Melski, A., Schumann, M. et al. 2009. Item-Level RFID: Curse or Blessing for Recycling and Waste Management? Proceedings of the 42nd Annual Hawaii International Conference on System Sciences: 5–8 January, 2009, Waikoloa, Big Island, Hawaii: abstracts and CD-ROM of full papers. Los Alamitos, Calif: IEEE Computer Society Press.
TKPV. 2009. Klebstoffe im Papierrecycling: TKPV-Merkblatt 5. Düsseldorf: Industrieverband Klebstoffe e.V. (German Adhesives Association). As of 6 February 2012: http://www.klebstoffe.com/07_publikation/pdf/MB_5_Klebstoffe_Papierrecycling.pdf
Tzeng, S.-F., Chen, W.-H. & Pai, F.-Y. 2008. Evaluating the business value of RFID: Evidence from five case studies. International Journal of Production Economics 112(2):601–13.
Uckelmann, D., Harrison, M. & Michahelles, F. 2011. Architecting the Internet of Things. Berlin: Springer.
UNEP. 2011. Basel Convention – On the Control of Transboundary Movements of Hazardous Wastes and their Disposal. Protocol on Liability and Compensation. Geneva.
Urban, A. (ed.). 2006. Stoffströme der Kreislaufwirtschaft (5th ed.). Kassel: Kassel Univ. Press.
Urban, A. et al. 2009: „Mit RFID zur innovativen Kreislaufwirtschaft“ in RFID im Abfallbereich - Behältermanagement und automatische Wägesysteme.
SMART TRASH: Study on RFID tags and the recycling industry RAND Europe, I.A.R. and P3
Contract reference 30-CE-0395435/00-31
228
VDI/VDE Innovation + Technik GmbH. 2007. RFID: Potenziale für Deutschland: Stand und Perspektiven von Anwendungen auf Basis der Radiofrequenz - Identifikation auf den nationalen und internationalen Märkten.
Vicentini, F. & Giusti, A. 2009. Sensorized waste collection container for content estimation and collection optimization. Waste Management 29:1465–72.
Vogel, S. & Strassner. 2004. M. Potenziale der RFID-Technologie zur Umsetzung der Altautoverordnung. M-Lab Report No. 22.
Wager, P.A., Eugster, M., Hilty, L.M., Som, C. 2005. “Smart labels in municipal solid waste - a case for the Precautionary Principle? “ Environmental Impact Assessment Review 25( 5): 567–86.
Wang, S.-W., Chen, W.-H., Ong, C.-S. et al. 2006. RFID applications in hospitals: a case study on a demonstration RFID project in a Taiwan hospital. Proceedings of the 39th Hawaii International Conference on System Sciences.
Williams, E., Kahhat, R., Allenby, B. et al. 2008. Environmental, Social, and Economic Implications of Global Reuse and Recycling of Personal Computers. Environ. Sci. Technol 42(17):6446–54.
WHO. 2005. Management of Solid Health-Care Waste at Primary Health-Care Centres, 1–60.
Wyld, D. 2010. Taking out the Trash (And the Recyclables): RFID and the Handling of Municipal Solid Waste. International Journal Of Software Engineering & Applications 1.
Yadav, M. 2001. Hospital waste – a major problem. JK-Practitioner 8(4):276–82.
Zeiger, E. 2005. Glasrecycling mit Mogensen Sortier- und Siebtechnik: Glass Recycling with Mogensen Sorting and Screening Systems. Aufbereitungstechnik 46(6):1–7.

229
ANNEX

231
Annex: Estimations for the modelling of waste streams in EU Member States
Introduction
RFID tags follow the products and materials they are attached to. Therefore, the distribution of these products and materials to waste streams as well as the distribution of those waste streams over treatments paths are modelled here in order to evaluate the quantity of RFID tags that ends up in the relevant waste treatment. Modelling was done with the Umberto software that has been developed by ifu Hamburg in Germany. It has been designed to enable lifecycle analysis on the basis of material flow models and was utilized for RFID tag allocations in the German study.
The relevance of the different treatment paths with regard to the presence of RFID tags can thus be outlined. Umberto furthermore offers the advantage that the net that has been designed to visualise RFID tag distribution up to the point that they reach the recycling or final disposal process level.
Methodology
In order to complete a conclusive modelling, the most comprehensive data source for the development of the different vectors was used. In the following, the underlying assumptions for the distribution of RFID tags over waste treatments paths are explained in order to offer the readers the chance to follow the approach and use alternative and perhaps more accurate data published in the future to recalculate the model and keep it up to date.
Development of tag quantities
The description of the estimated numbers of RFID tags in different countries and areas of application have been introduced and described in Section 2.5.4. According to the responses from tag producers and the applying industry, the allocations displayed in the
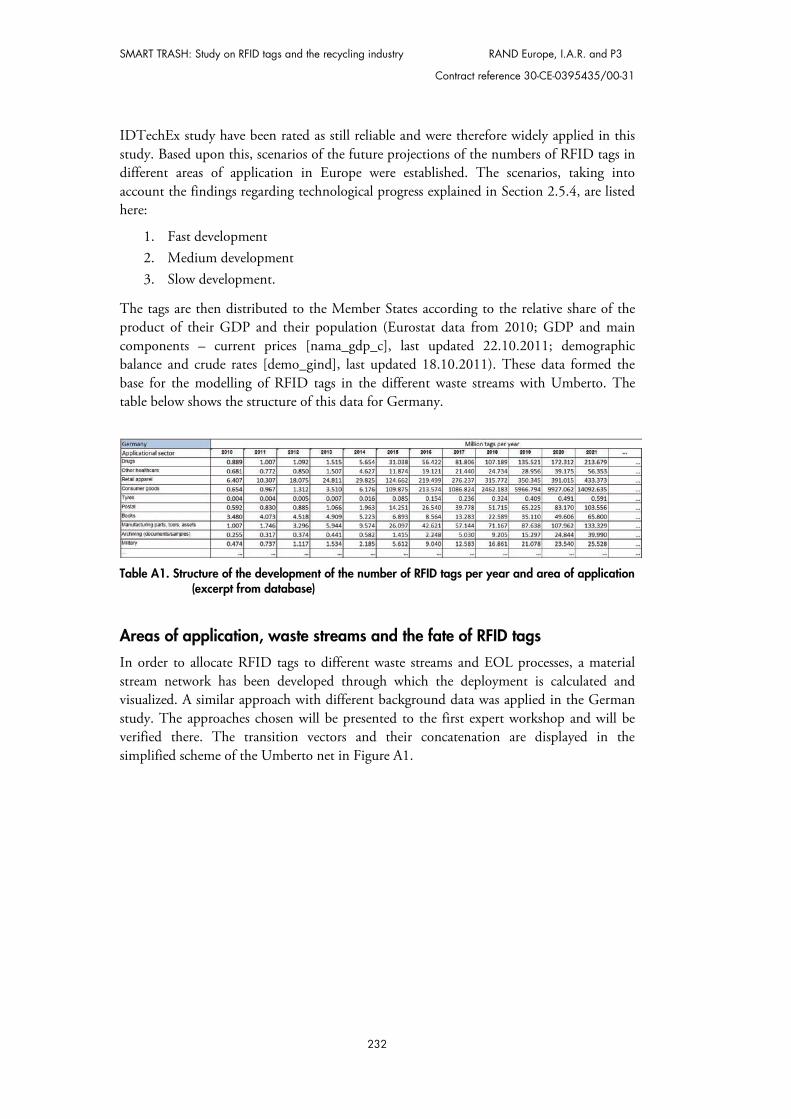
SMART TRASH: Study on RFID tags and the recycling industry RAND Europe, I.A.R. and P3
Contract reference 30-CE-0395435/00-31
232
IDTechEx study have been rated as still reliable and were therefore widely applied in this study. Based upon this, scenarios of the future projections of the numbers of RFID tags in different areas of application in Europe were established. The scenarios, taking into account the findings regarding technological progress explained in Section 2.5.4, are listed here:
1. Fast development 2. Medium development 3. Slow development.
The tags are then distributed to the Member States according to the relative share of the product of their GDP and their population (Eurostat data from 2010; GDP and main components – current prices [nama_gdp_c], last updated 22.10.2011; demographic balance and crude rates [demo_gind], last updated 18.10.2011). These data formed the base for the modelling of RFID tags in the different waste streams with Umberto. The table below shows the structure of this data for Germany.
Table A1. Structure of the development of the number of RFID tags per year and area of application
(excerpt from database)
Areas of application, waste streams and the fate of RFID tags
In order to allocate RFID tags to different waste streams and EOL processes, a material stream network has been developed through which the deployment is calculated and visualized. A similar approach with different background data was applied in the German study. The approaches chosen will be presented to the first expert workshop and will be verified there. The transition vectors and their concatenation are displayed in the simplified scheme of the Umberto net in Figure A1.
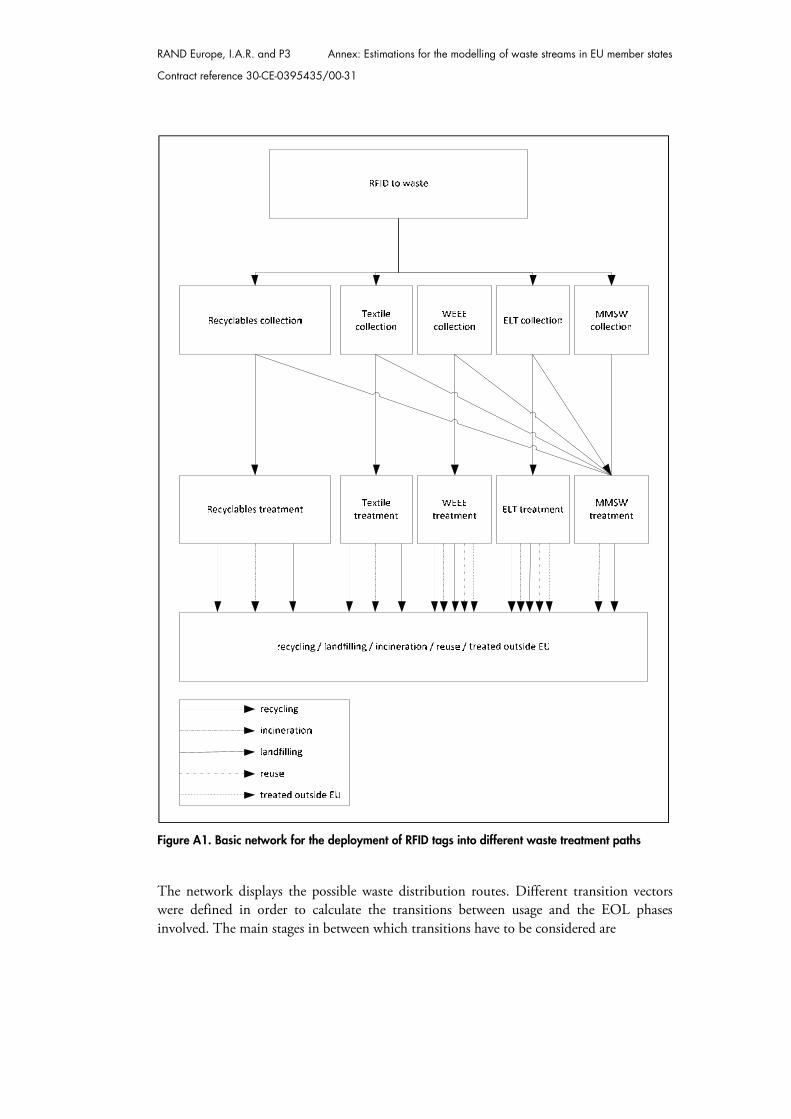
RAND Europe, I.A.R. and P3 Annex: Estimations for the modelling of waste streams in EU member states
Contract reference 30-CE-0395435/00-31
Figure A1. Basic network for the deployment of RFID tags into different waste treatment paths
The network displays the possible waste distribution routes. Different transition vectors were defined in order to calculate the transitions between usage and the EOL phases involved. The main stages in between which transitions have to be considered are
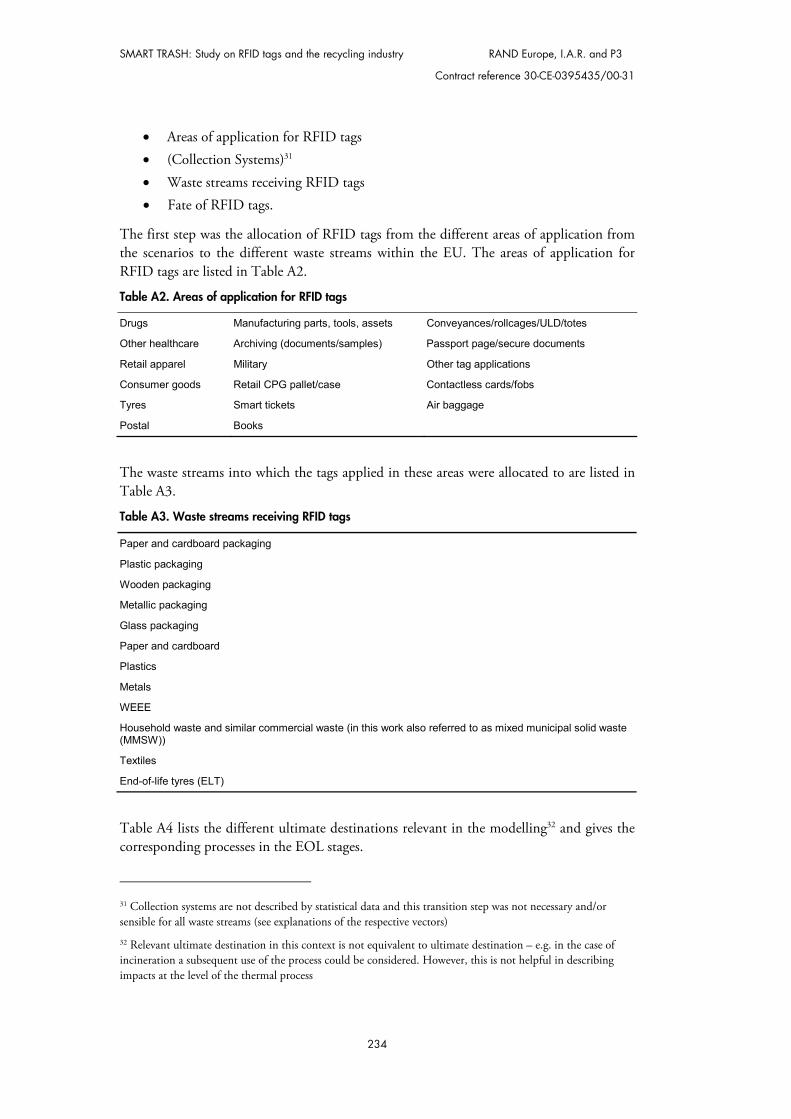
SMART TRASH: Study on RFID tags and the recycling industry RAND Europe, I.A.R. and P3
Contract reference 30-CE-0395435/00-31
234
Areas of application for RFID tags (Collection Systems)31 Waste streams receiving RFID tags Fate of RFID tags.
The first step was the allocation of RFID tags from the different areas of application from the scenarios to the different waste streams within the EU. The areas of application for RFID tags are listed in Table A2.
Table A2. Areas of application for RFID tags
Drugs Manufacturing parts, tools, assets Conveyances/rollcages/ULD/totes
Other healthcare Archiving (documents/samples) Passport page/secure documents
Retail apparel Military Other tag applications
Consumer goods Retail CPG pallet/case Contactless cards/fobs
Tyres Smart tickets Air baggage
Postal Books
The waste streams into which the tags applied in these areas were allocated to are listed in Table A3.
Table A3. Waste streams receiving RFID tags
Paper and cardboard packaging
Plastic packaging
Wooden packaging
Metallic packaging
Glass packaging
Paper and cardboard
Plastics
Metals
WEEE
Household waste and similar commercial waste (in this work also referred to as mixed municipal solid waste (MMSW))
Textiles
End-of-life tyres (ELT)
Table A4 lists the different ultimate destinations relevant in the modelling32 and gives the corresponding processes in the EOL stages.
31 Collection systems are not described by statistical data and this transition step was not necessary and/or sensible for all waste streams (see explanations of the respective vectors)
32 Relevant ultimate destination in this context is not equivalent to ultimate destination – e.g. in the case of incineration a subsequent use of the process could be considered. However, this is not helpful in describing impacts at the level of the thermal process
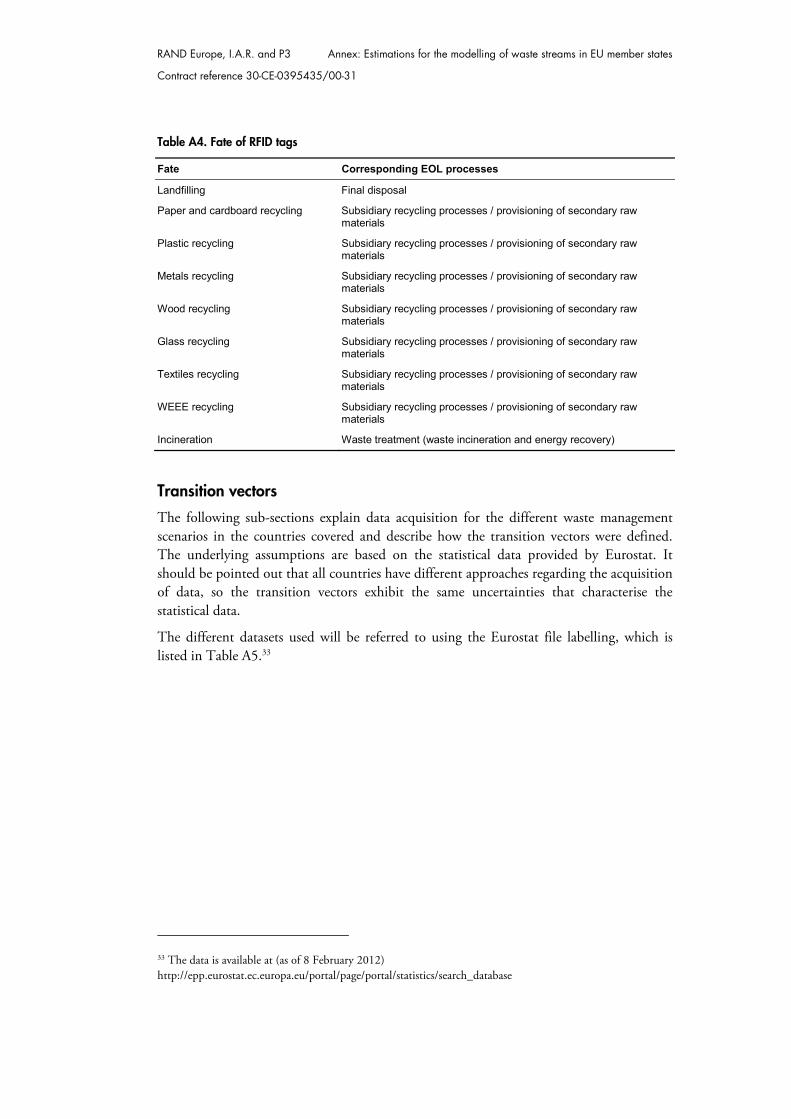
RAND Europe, I.A.R. and P3 Annex: Estimations for the modelling of waste streams in EU member states
Contract reference 30-CE-0395435/00-31
Table A4. Fate of RFID tags
Fate Corresponding EOL processes
Landfilling Final disposal
Paper and cardboard recycling Subsidiary recycling processes / provisioning of secondary raw materials
Plastic recycling Subsidiary recycling processes / provisioning of secondary raw materials
Metals recycling Subsidiary recycling processes / provisioning of secondary raw materials
Wood recycling Subsidiary recycling processes / provisioning of secondary raw materials
Glass recycling Subsidiary recycling processes / provisioning of secondary raw materials
Textiles recycling Subsidiary recycling processes / provisioning of secondary raw materials
WEEE recycling Subsidiary recycling processes / provisioning of secondary raw materials
Incineration Waste treatment (waste incineration and energy recovery)
Transition vectors
The following sub-sections explain data acquisition for the different waste management scenarios in the countries covered and describe how the transition vectors were defined. The underlying assumptions are based on the statistical data provided by Eurostat. It should be pointed out that all countries have different approaches regarding the acquisition of data, so the transition vectors exhibit the same uncertainties that characterise the statistical data.
The different datasets used will be referred to using the Eurostat file labelling, which is listed in Table A5.33
33 The data is available at (as of 8 February 2012) http://epp.eurostat.ec.europa.eu/portal/page/portal/statistics/search_database
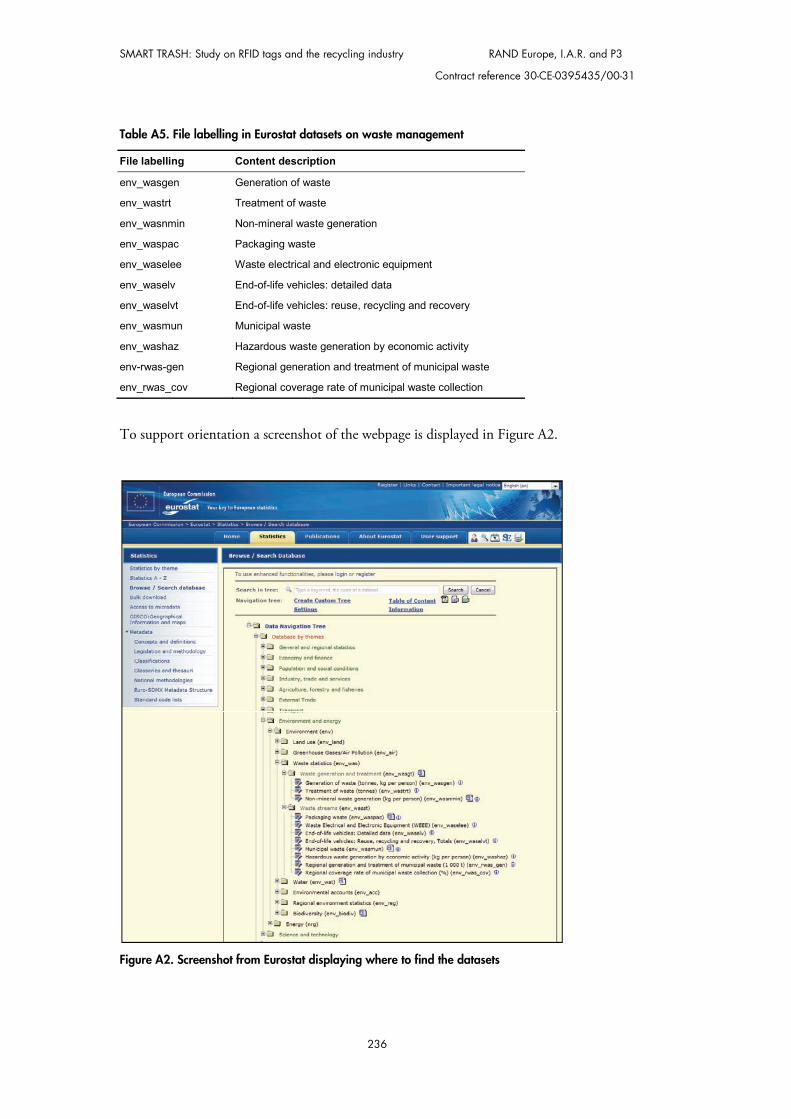
SMART TRASH: Study on RFID tags and th
Table A5. File labelling in Eurostat da
File labelling Content descrip
env_wasgen Generation of wa
env_wastrt Treatment of wa
env_wasnmin Non-mineral was
env_waspac Packaging waste
env_waselee Waste electrical
env_waselv End-of-life vehic
env_waselvt End-of-life vehic
env_wasmun Municipal waste
env_washaz Hazardous wast
env-rwas-gen Regional genera
env_rwas_cov Regional covera
To support orientation a screensho
Figure A2. Screenshot from Eurostat d
he recycling industry RAND Europe, I.A.R. and
Contract reference 30-CE-0395435/
236
atasets on waste management
ption
aste
aste
ste generation
e
and electronic equipment
les: detailed data
les: reuse, recycling and recovery
e generation by economic activity
ation and treatment of municipal waste
age rate of municipal waste collection
ot of the webpage is displayed in Figure A2.
displaying where to find the datasets
P3
00-31
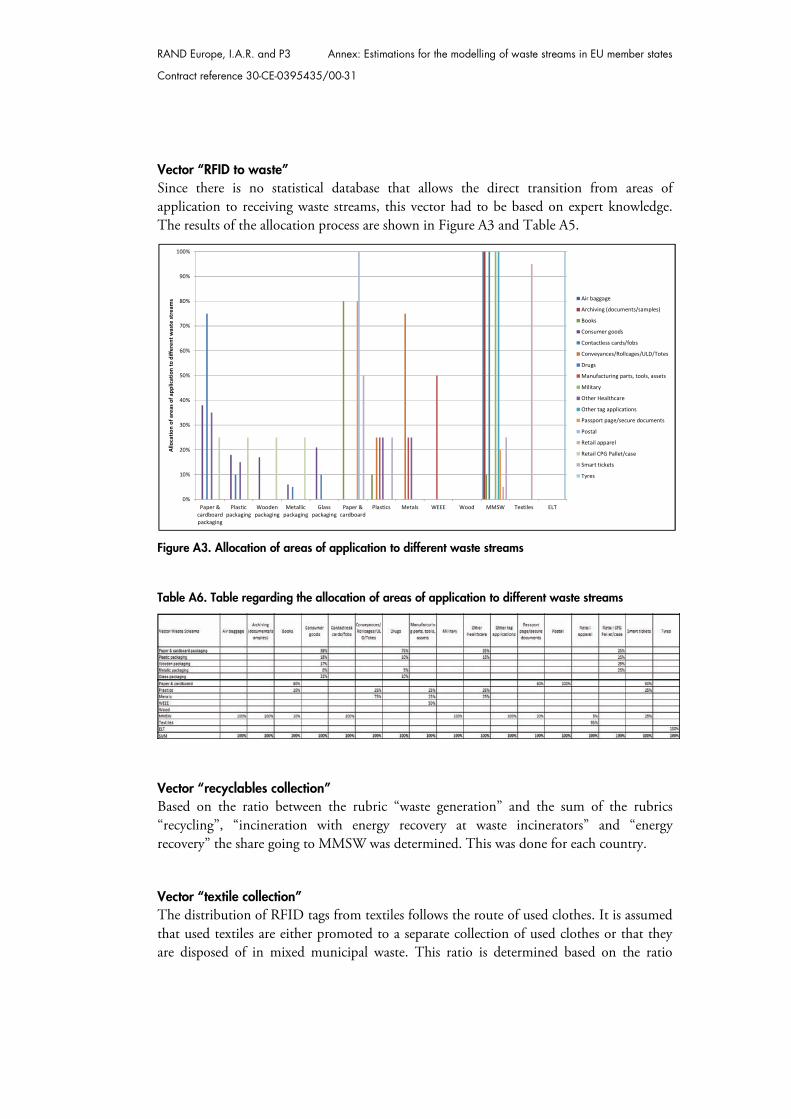
RAND Europe, I.A.R. and P3 Annex: Estimations for the modelling of waste streams in EU member states
Contract reference 30-CE-0395435/00-31
Vector “RFID to waste” Since there is no statistical database that allows the direct transition from areas of application to receiving waste streams, this vector had to be based on expert knowledge. The results of the allocation process are shown in Figure A3 and Table A5.
Figure A3. Allocation of areas of application to different waste streams
Table A6. Table regarding the allocation of areas of application to different waste streams
Vector “recyclables collection” Based on the ratio between the rubric “waste generation” and the sum of the rubrics “recycling”, “incineration with energy recovery at waste incinerators” and “energy recovery” the share going to MMSW was determined. This was done for each country.
Vector “textile collection” The distribution of RFID tags from textiles follows the route of used clothes. It is assumed that used textiles are either promoted to a separate collection of used clothes or that they are disposed of in mixed municipal waste. This ratio is determined based on the ratio
0%
10%
20%
30%
40%
50%
60%
70%
80%
90%
100%
Paper &cardboardpackaging
Plasticpackaging
Woodenpackaging
Metallicpackaging
Glasspackaging
Paper &cardboard
Plastics Metals WEEE Wood MMSW Textiles ELT
Allo
catio
n of
are
as o
f app
licat
ion
to d
iffer
ent w
aste
stre
ams Air baggage
Archiving (documents/samples)
Books
Consumer goods
Contactless cards/fobs
Conveyances/Rollcages/ULD/Totes
Drugs
Manufacturing parts, tools, assets
Military
Other Healthcare
Other tag applications
Passport page/secure documents
Postal
Retail apparel
Retail CPG Pallet/case
Smart tickets
Tyres
SMART TRASH: Study on RFID tags and the recycling industry RAND Europe, I.A.R. and P3
Contract reference 30-CE-0395435/00-31
238
between textiles placed on the market (env_wasgen) and textiles that were treated (env_wastrt).
Vector “WEEE collection” Data according to env_waselee (2009) was split according to ratio between:
WEEE treatment (model) = “Treated in the Member State” + “Treated in another Member State of the EU”
Treated outside EU (model) = “Treated outside EU”
Reuse (model) = “Reuse”
MMSW (model) = “Products put on the market” – (“Treated in the Member State” + “Treated in another Member State of the EU” + “Treated outside the EU” + “Reuse”)
Vector “ELT collection” The data is based on Annex I of ETRMA (2010). The waste stream is split into ELT treatment, reuse and treatment outside the EU according to the ratio of:
“Reuse (A1)” + “Retreating (A3)” = Reuse (model)
“ELT (A4)” = ELT treatment (model)
“Export (A3)” = treatment outside the EU (model)
Vector “MMSW collection” Since this waste stream is exclusively promoted to disposal operations such as landfilling and incineration, at this stage a division of the tags contained in this waste stream does not take place. This is consistent with the data from env_wastrt (data from 2008).
Vector “recyclables treatment” Based on env_waspac (data from 2008) the subsequent treatment paths after collection are identified. Landfilling of these fractions does not take place. The ratio between the amounts going to incineration and the amounts going to material recycling were determined as follows:
The rubric “recycling” was interpreted as material recycling and the sum of the rubrics “incineration with energy recovery at waste incinerators” and “energy recovery” were interpreted as incineration in the modelling.
Vector “textiles treatment” Based on env_wastrt in the category “Textile wastes” the distribution was done according to the ratio between:
Textile recycling (model) = “Recovery other than energy recovery”
Incineration (model) = “Energy recovery” + “Incineration without energy recovery”
RAND Europe, I.A.R. and P3 Annex: Estimations for the modelling of waste streams in EU member states
Contract reference 30-CE-0395435/00-31
Landfill (model) = “Deposit onto or into land”
Vector “WEEE treatment” Data according to env_waselee (2009) was split according to the ratio of:
WEEE recycling (model) = “Total recycling and reuse” – “Reuse”
Incineration (model) = “Treated in the Member State” + “Treated in another Member State of the EU” – “Recycling”
Vector “ELT treatment” Is split into material recycling (or ELT recycling respectively), incineration and landfilling, whereas:
ELT recycling (model) = “ELT Recovery” – “Material (B1)”
Incineration (model) = “ELT Recovery” – “Energy (B2)”
Landfill (model) = “Landfill & Unknown (C)”
Vector “MMSW treatment” Based on env_wastrt in the category “household and similar waste”, the distribution was done according to the ratio between:
Incineration (model) = “Energy recovery” + “Incineration without energy recovery”
Landfill (model) = “Deposit onto or into land”

SMART TRASH: Study on RFID tags and the recycling industry RAND Europe, I.A.R. and P3
Contract reference 30-CE-0395435/00-31
240
Figure A4. Forecast Germany 2010
T1
T6: incineration
P11:tags Germany
P16:wastewater
P17:exhaustgas
P18:bottom ashfor recycling
P33: landfillmaterial
T5: landfilling
P22: residuesincineration
P24: plasticfor recycling
P25:paperfor recycling
P26: glassfor recycling
P27: metalsfor recycling
P28: woodfor recycling
P29: WEEEfor recycling
P31: textilesfor recycling
P6: ELTfor recycling
P8:glasspackagingwaste
P9:paperpackagingwaste
P10:plasticpackagingwaste
P15:MMSWcollection
P34:woodpackagingwaste
P35:metalpackagingwaste
P37:ELT
P38:textileswaste
P39:paperwaste
P40:plasticwaste
P41:metalwaste
P43:WEEE
T3: papertreatment
T4: plastictreatment
T2: metaltreatment
T8: woodtreatment T9: ELT
treatment
T10: glasstreatment T12: textile
treatmentT13: WEEEteatment
T14: MMSWtreatment
P2: directedto landfilling P3: directed
to incineration
P7:paper
P12:paperpackaging
P13:plastic
P14:plasticpackaging
P20:metal
P21:metalpackaging
P30:woodpackaging
P32:glasspackaging
P44:textiles
P45:EEE
P46:tires
P47:remainder
T15:papercollection
T16:plasticcollection
T17:metalcollection
T18:woodcollection
T19:glasscollection
T21:textilecollection
T22:WEEEcollection
T23:ELTcollection
T24:remaindercollection
P49:reused
P4:treatedoutside EU
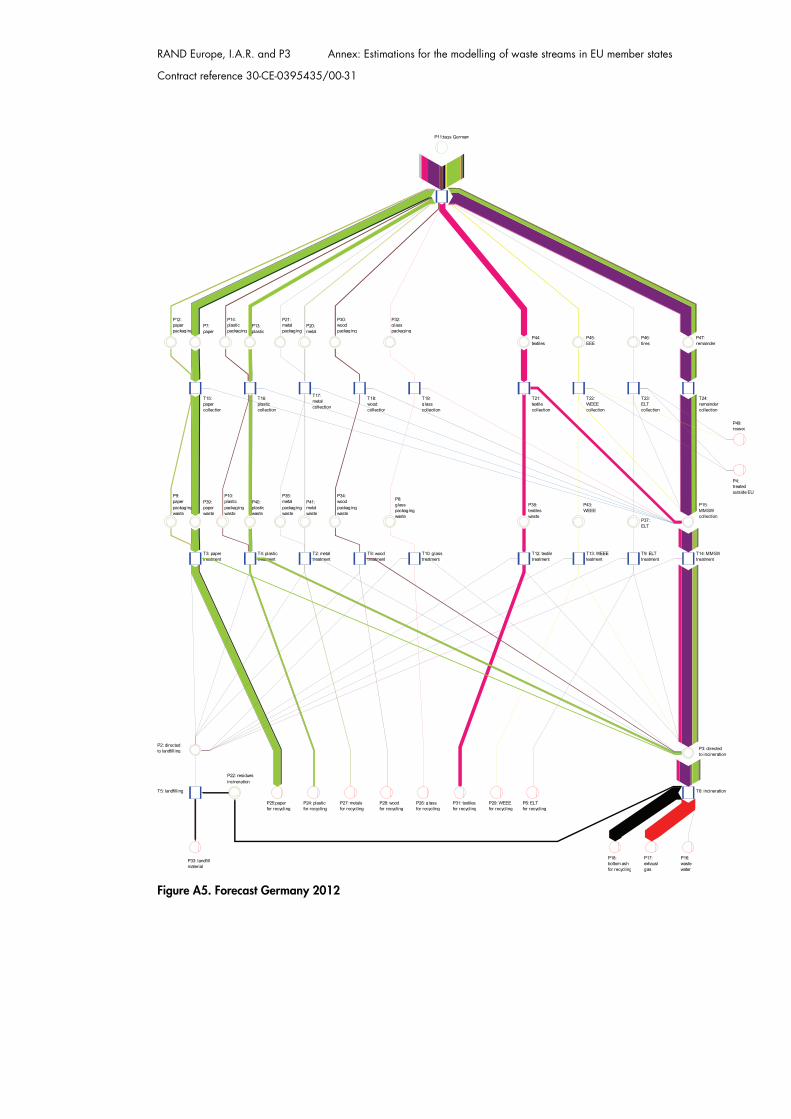
RAND Europe, I.A.R. and P3 Annex: Estimations for the modelling of waste streams in EU member states
Contract reference 30-CE-0395435/00-31
Figure A5. Forecast Germany 2012
T1
T6: incineration
P11:tags Germany
P16:wastewater
P17:exhaustgas
P18:bottom ashfor recycling
P33: landfillmaterial
T5: landfilling
P22: residuesincineration
P24: plasticfor recycling
P25:paperfor recycling
P26: glassfor recycling
P27: metalsfor recycling
P28: woodfor recycling
P29: WEEEfor recycling
P31: textilesfor recycling
P6: ELTfor recycling
P8:glasspackagingwaste
P9:paperpackagingwaste
P10:plasticpackagingwaste
P15:MMSWcollection
P34:woodpackagingwaste
P35:metalpackagingwaste
P37:ELT
P38:textileswaste
P39:paperwaste
P40:plasticwaste
P41:metalwaste
P43:WEEE
T3: papertreatment
T4: plastictreatment
T2: metaltreatment
T8: woodtreatment
T9: ELTtreatment
T10: glasstreatment
T12: textiletreatment
T13: WEEEteatment
T14: MMSWtreatment
P2: directedto landfilling P3: directed
to incineration
P7:paper
P12:paperpackaging
P13:plastic
P14:plasticpackaging
P20:metal
P21:metalpackaging
P30:woodpackaging
P32:glasspackaging
P44:textiles
P45:EEE
P46:tires
P47:remainder
T15:papercollection
T16:plasticcollection
T17:metalcollection
T18:woodcollection
T19:glasscollection
T21:textilecollection
T22:WEEEcollection
T23:ELTcollection
T24:remaindercollection
P49:reused
P4:treatedoutside EU
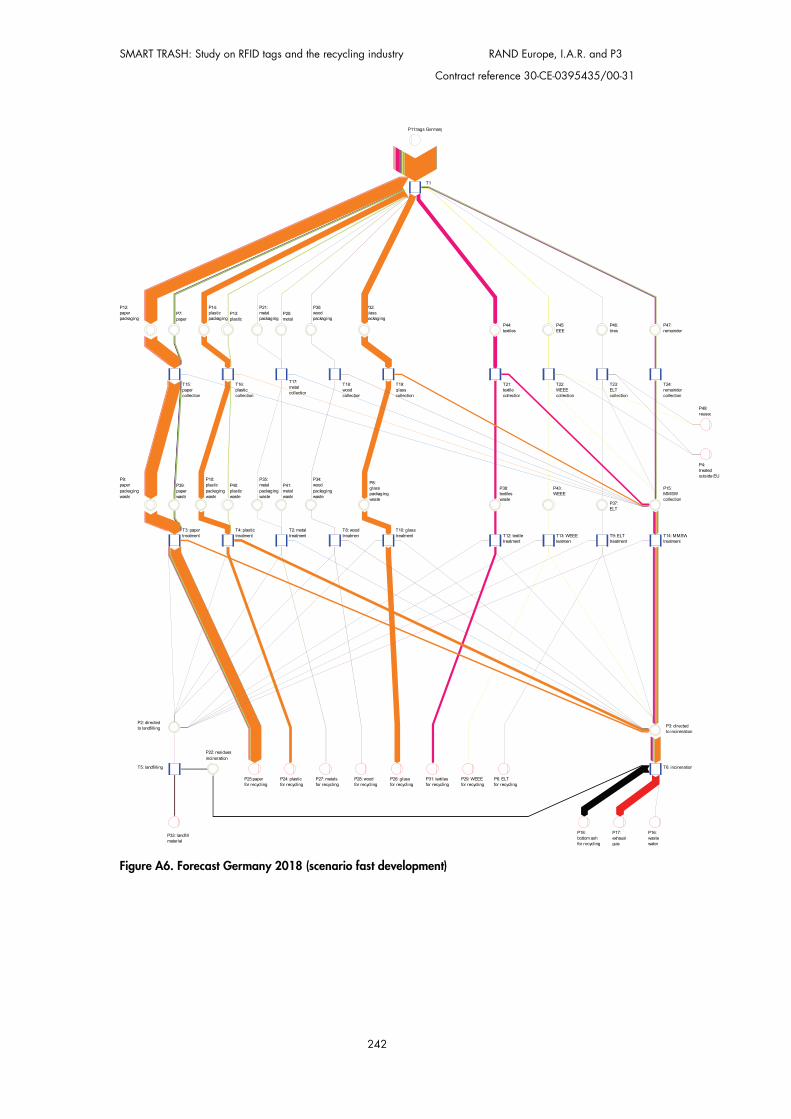
SMART TRASH: Study on RFID tags and the recycling industry RAND Europe, I.A.R. and P3
Contract reference 30-CE-0395435/00-31
242
Figure A6. Forecast Germany 2018 (scenario fast development)
T1
T6: incineration
P11:tags Germany
P16:wastewater
P17:exhaustgas
P18:bottom ashfor recycling
P33: landfillmaterial
T5: landfilling
P22: residuesincineration
P24: plasticfor recycling
P25:paperfor recycling
P26: glassfor recycling
P27: metalsfor recycling
P28: woodfor recycling
P29: WEEEfor recycling
P31: textilesfor recycling
P6: ELTfor recycling
P8:glasspackagingwaste
P9:paperpackagingwaste
P10:plasticpackagingwaste
P15:MMSWcollection
P34:woodpackagingwaste
P35:metalpackagingwaste
P37:ELT
P38:textileswaste
P39:paperwaste
P40:plasticwaste
P41:metalwaste
P43:WEEE
T3: papertreatment
T4: plastictreatment
T2: metaltreatment
T8: woodtreatment T9: ELT
treatment
T10: glasstreatment T12: textile
treatmentT13: WEEEteatment
T14: MMSWtreatment
P2: directedto landfilling P3: directed
to incineration
P7:paper
P12:paperpackaging
P13:plastic
P14:plasticpackaging
P20:metal
P21:metalpackaging
P30:woodpackaging
P32:glasspackaging
P44:textiles
P45:EEE
P46:tires
P47:remainder
T15:papercollection
T16:plasticcollection
T17:metalcollection
T18:woodcollection
T19:glasscollection
T21:textilecollection
T22:WEEEcollection
T23:ELTcollection
T24:remaindercollection
P49:reused
P4:treatedoutside EU
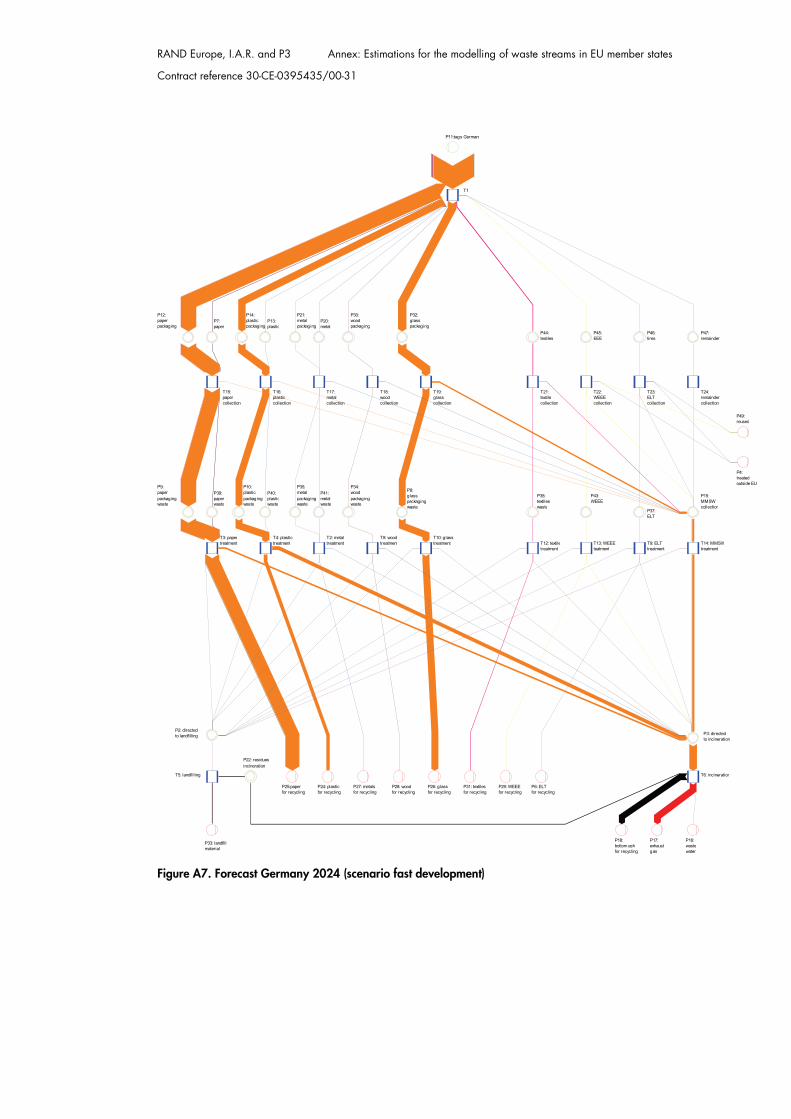
RAND Europe, I.A.R. and P3 Annex: Estimations for the modelling of waste streams in EU member states
Contract reference 30-CE-0395435/00-31
Figure A7. Forecast Germany 2024 (scenario fast development)
T1
T6: incineration
P11:tags Germany
P16:wastewater
P17:exhaustgas
P18:bottom ashfor recycling
P33: landfillmaterial
T5: landfilling
P22: residuesincineration
P24: plasticfor recycling
P25:paperfor recycling
P26: glassfor recycling
P27: metalsfor recycling
P28: woodfor recycling
P29: WEEEfor recycling
P31: textilesfor recycling
P6: ELTfor recycling
P8:glasspackagingwaste
P9:paperpackagingwaste
P10:plasticpackagingwaste
P15:MMSWcollection
P34:woodpackagingwaste
P35:metalpackagingwaste
P37:ELT
P38:textileswaste
P39:paperwaste
P40:plasticwaste
P41:metalwaste
P43:WEEE
T3: papertreatment
T4: plastictreatment
T2: metaltreatment
T8: woodtreatment T9: ELT
treatment
T10: glasstreatment T12: textile
treatmentT13: WEEEteatment
T14: MMSWtreatment
P2: directedto landfilling P3: directed
to incineration
P7:paper
P12:paperpackaging
P13:plastic
P14:plasticpackaging
P20:metal
P21:metalpackaging
P30:woodpackaging
P32:glasspackaging
P44:textiles
P45:EEE
P46:tires
P47:remainder
T15:papercollection
T16:plasticcollection
T17:metalcollection
T18:woodcollection
T19:glasscollection
T21:textilecollection
T22:WEEEcollection
T23:ELTcollection
T24:remaindercollection
P49:reused
P4:treatedoutside EU
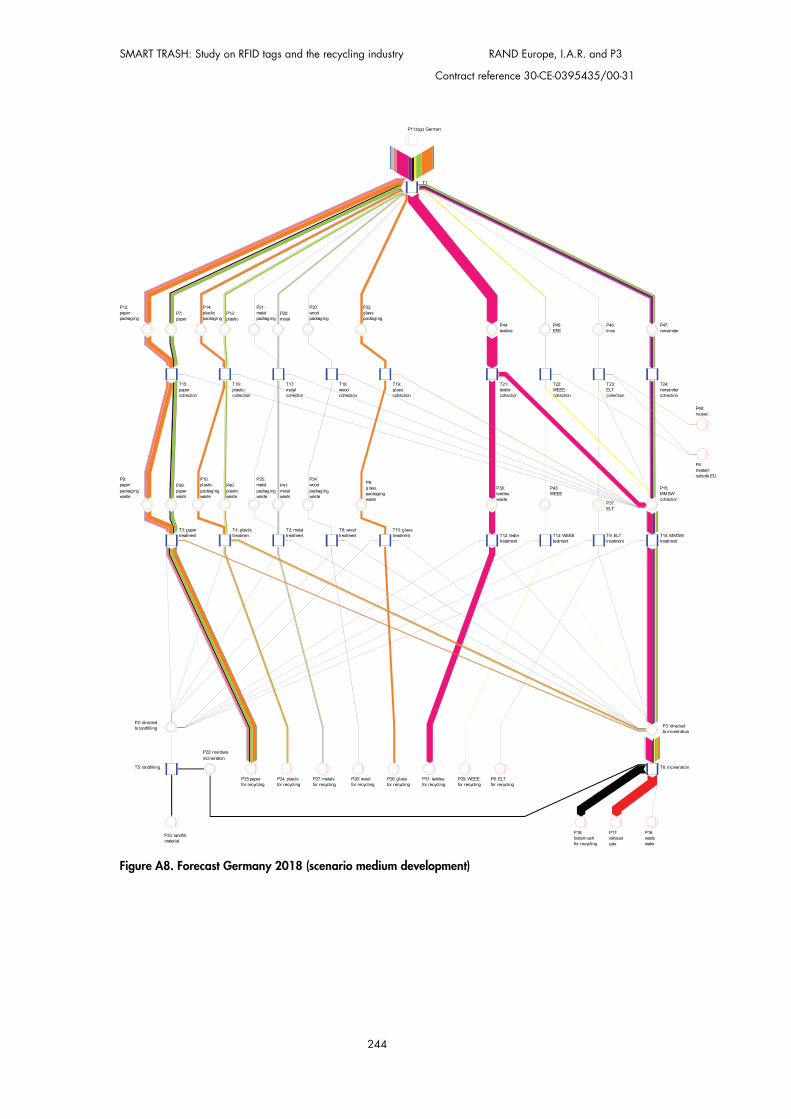
SMART TRASH: Study on RFID tags and the recycling industry RAND Europe, I.A.R. and P3
Contract reference 30-CE-0395435/00-31
244
Figure A8. Forecast Germany 2018 (scenario medium development)
T1
T6: incineration
P11:tags Germany
P16:wastewater
P17:exhaustgas
P18:bottom ashfor recycling
P33: landfillmaterial
T5: landfilling
P22: residuesincineration
P24: plasticfor recycling
P25:paperfor recycling
P26: glassfor recycling
P27: metalsfor recycling
P28: woodfor recycling
P29: WEEEfor recycling
P31: textilesfor recycling
P6: ELTfor recycling
P8:glasspackagingwaste
P9:paperpackagingwaste
P10:plasticpackagingwaste
P15:MMSWcollection
P34:woodpackagingwaste
P35:metalpackagingwaste
P37:ELT
P38:textileswaste
P39:paperwaste
P40:plasticwaste
P41:metalwaste
P43:WEEE
T3: papertreatment
T4: plastictreatment
T2: metaltreatment
T8: woodtreatment T9: ELT
treatment
T10: glasstreatment T12: textile
treatmentT13: WEEEteatment
T14: MMSWtreatment
P2: directedto landfilling P3: directed
to incineration
P7:paper
P12:paperpackaging
P13:plastic
P14:plasticpackaging
P20:metal
P21:metalpackaging
P30:woodpackaging
P32:glasspackaging
P44:textiles
P45:EEE
P46:tires
P47:remainder
T15:papercollection
T16:plasticcollection
T17:metalcollection
T18:woodcollection
T19:glasscollection
T21:textilecollection
T22:WEEEcollection
T23:ELTcollection
T24:remaindercollection
P49:reused
P4:treatedoutside EU

RAND Europe, I.A.R. and P3 Annex: Estimations for the modelling of waste streams in EU member states
Contract reference 30-CE-0395435/00-31
Figure A9. Forecast Germany 2024 (scenario medium development)
T1
T6: incineration
P11:tags Germany
P16:wastewater
P17:exhaustgas
P18:bottom ashfor recycling
P33: landfillmaterial
T5: landfilling
P22: residuesincineration
P24: plasticfor recycling
P25:paperfor recycling
P26: glassfor recycling
P27: metalsfor recycling
P28: woodfor recycling
P29: WEEEfor recycling
P31: textilesfor recycling
P6: ELTfor recycling
P8:glasspackagingwaste
P9:paperpackagingwaste
P10:plasticpackagingwaste
P15:MMSWcollection
P34:woodpackagingwaste
P35:metalpackagingwaste
P37:ELT
P38:textileswaste
P39:paperwaste
P40:plasticwaste
P41:metalwaste
P43:WEEE
T3: papertreatment
T4: plastictreatment
T2: metaltreatment
T8: woodtreatment T9: ELT
treatment
T10: glasstreatment T12: textile
treatmentT13: WEEEteatment
T14: MMSWtreatment
P2: directedto landfilling P3: directed
to incineration
P7:paper
P12:paperpackaging
P13:plastic
P14:plasticpackaging
P20:metal
P21:metalpackaging
P30:woodpackaging
P32:glasspackaging
P44:textiles
P45:EEE
P46:tires
P47:remainder
T15:papercollection
T16:plasticcollection
T17:metalcollection
T18:woodcollection
T19:glasscollection
T21:textilecollection
T22:WEEEcollection
T23:ELTcollection
T24:remaindercollection
P49:reused
P4:treatedoutside EU
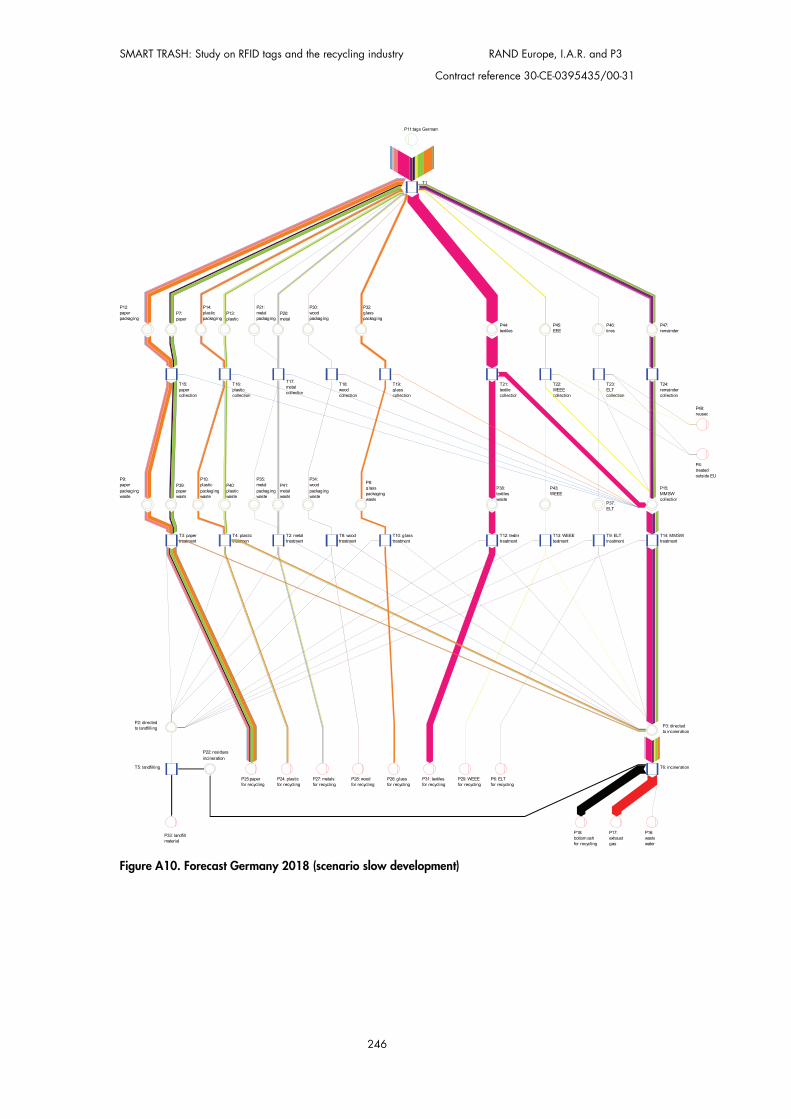
SMART TRASH: Study on RFID tags and the recycling industry RAND Europe, I.A.R. and P3
Contract reference 30-CE-0395435/00-31
246
Figure A10. Forecast Germany 2018 (scenario slow development)
T1
T6: incineration
P11:tags Germany
P16:wastewater
P17:exhaustgas
P18:bottom ashfor recycling
P33: landfillmaterial
T5: landfilling
P22: residuesincineration
P24: plasticfor recycling
P25:paperfor recycling
P26: glassfor recycling
P27: metalsfor recycling
P28: woodfor recycling
P29: WEEEfor recycling
P31: textilesfor recycling
P6: ELTfor recycling
P8:glasspackagingwaste
P9:paperpackagingwaste
P10:plasticpackagingwaste
P15:MMSWcollection
P34:woodpackagingwaste
P35:metalpackagingwaste
P37:ELT
P38:textileswaste
P39:paperwaste
P40:plasticwaste
P41:metalwaste
P43:WEEE
T3: papertreatment
T4: plastictreatment
T2: metaltreatment
T8: woodtreatment
T9: ELTtreatment
T10: glasstreatment
T12: textiletreatment
T13: WEEEteatment
T14: MMSWtreatment
P2: directedto landfilling P3: directed
to incineration
P7:paper
P12:paperpackaging
P13:plastic
P14:plasticpackaging
P20:metal
P21:metalpackaging
P30:woodpackaging
P32:glasspackaging
P44:textiles
P45:EEE
P46:tires
P47:remainder
T15:papercollection
T16:plasticcollection
T17:metalcollection
T18:woodcollection
T19:glasscollection
T21:textilecollection
T22:WEEEcollection
T23:ELTcollection
T24:remaindercollection
P49:reused
P4:treatedoutside EU

RAND Europe, I.A.R. and P3 Annex: Estimations for the modelling of waste streams in EU member states
Contract reference 30-CE-0395435/00-31
Figure A11. Forecast Germany 2024 (scenario slow development)
T1
T6: incineration
P11:tags Germany
P16:wastewater
P17:exhaustgas
P18:bottom ashfor recycling
P33: landfillmaterial
T5: landfilling
P22: residuesincineration
P24: plasticfor recycling
P25:paperfor recycling
P26: glassfor recycling
P27: metalsfor recycling
P28: woodfor recycling
P29: WEEEfor recycling
P31: textilesfor recycling
P6: ELTfor recycling
P8:glasspackagingwaste
P9:paperpackagingwaste
P10:plasticpackagingwaste
P15:MMSWcollection
P34:woodpackagingwaste
P35:metalpackagingwaste
P37:ELT
P38:textileswaste
P39:paperwaste
P40:plasticwaste
P41:metalwaste
P43:WEEE
T3: papertreatment
T4: plastictreatment
T2: metaltreatment
T8: woodtreatment T9: ELT
treatment
T10: glasstreatment T12: textile
treatmentT13: WEEEteatment
T14: MMSWtreatment
P2: directedto landfilling P3: directed
to incineration
P7:paper
P12:paperpackaging
P13:plastic
P14:plasticpackaging
P20:metal
P21:metalpackaging
P30:woodpackaging
P32:glasspackaging
P44:textiles
P45:EEE
P46:tires
P47:remainder
T15:papercollection
T16:plasticcollection
T17:metalcollection
T18:woodcollection
T19:glasscollection
T21:textilecollection
T22:WEEEcollection
T23:ELTcollection
T24:remaindercollection
P49:reused
P4:treatedoutside EU
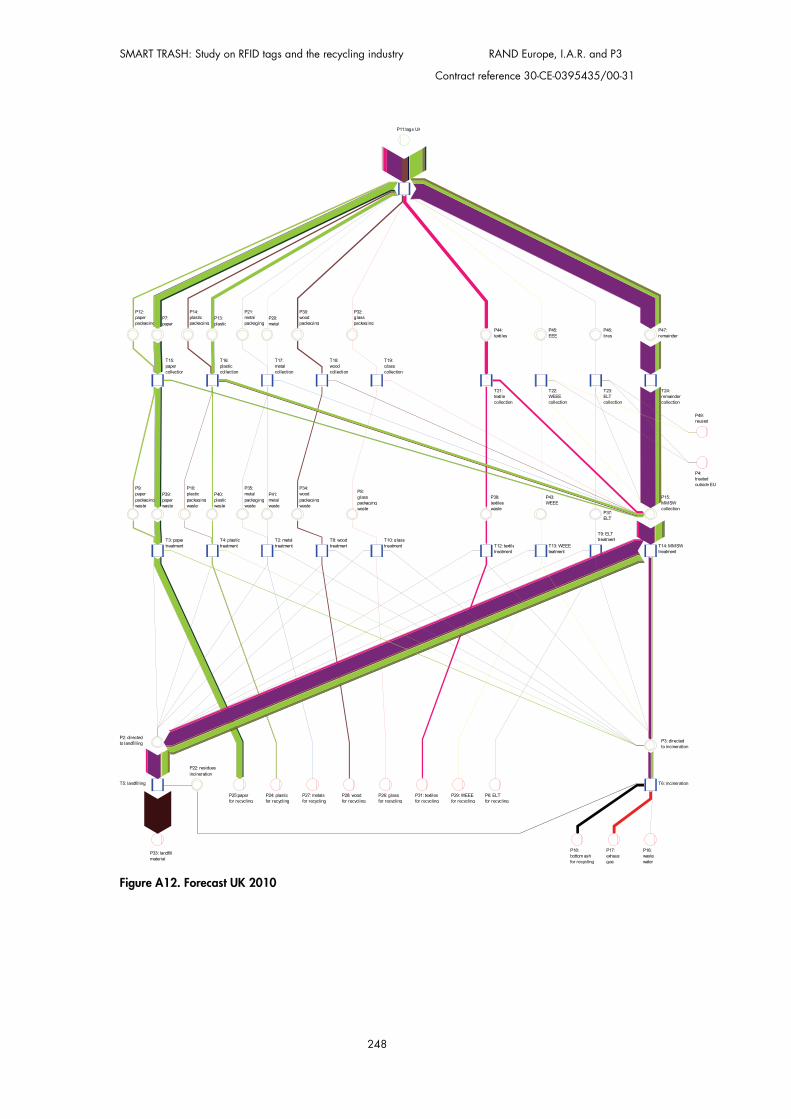
SMART TRASH: Study on RFID tags and the recycling industry RAND Europe, I.A.R. and P3
Contract reference 30-CE-0395435/00-31
248
Figure A12. Forecast UK 2010
T1
T6: incineration
P11:tags UK
P16:wastewater
P17:exhaustgas
P18:bottom ashfor recycling
P33: landfillmaterial
T5: landfilling
P22: residuesincineration
P24: plasticfor recycling
P25:paperfor recycling
P26: glassfor recycling
P27: metalsfor recycling
P28: woodfor recycling
P29: WEEEfor recycling
P31: textilesfor recycling
P6: ELTfor recycling
P8:glasspackagingwaste
P9:paperpackagingwaste
P10:plasticpackagingwaste
P15:MMSWcollection
P34:woodpackagingwaste
P35:metalpackagingwaste
P37:ELT
P38:textileswaste
P39:paperwaste
P40:plasticwaste
P41:metalwaste
P43:WEEE
T3: papertreatment
T4: plastictreatment
T2: metaltreatment
T8: woodtreatment
T9: ELTtreatmentT10: glass
treatment T12: textiletreatment
T13: WEEEteatment
T14: MMSWtreatment
P2: directedto landfilling P3: directed
to incineration
P7:paper
P12:paperpackaging
P13:plastic
P14:plasticpackaging
P20:metal
P21:metalpackaging
P30:woodpackaging
P32:glasspackaging
P44:textiles
P45:EEE
P46:tires
P47:remainder
T15:papercollection
T16:plasticcollection
T17:metalcollection
T18:woodcollection
T19:glasscollection
T21:textilecollection
T22:WEEEcollection
T23:ELTcollection
T24:remaindercollection
P49:reused
P4:treatedoutside EU
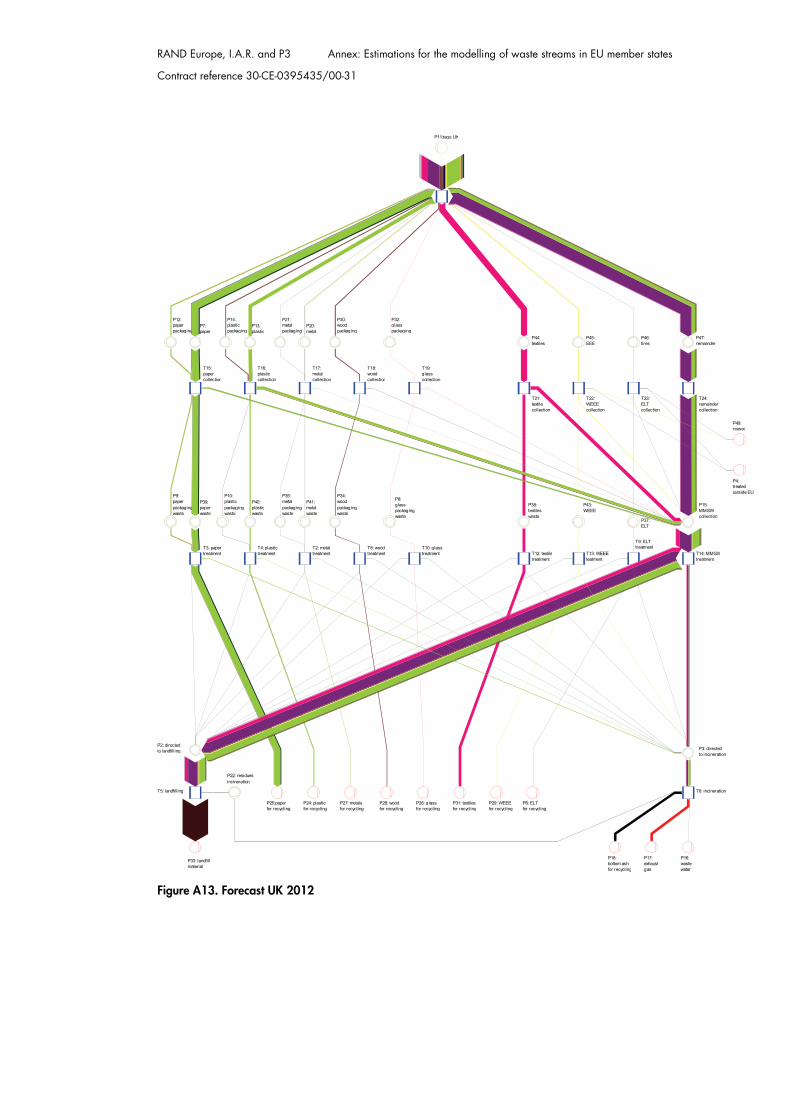
RAND Europe, I.A.R. and P3 Annex: Estimations for the modelling of waste streams in EU member states
Contract reference 30-CE-0395435/00-31
Figure A13. Forecast UK 2012
T1
T6: incineration
P11:tags UK
P16:wastewater
P17:exhaustgas
P18:bottom ashfor recycling
P33: landfillmaterial
T5: landfilling
P22: residuesincineration
P24: plasticfor recycling
P25:paperfor recycling
P26: glassfor recycling
P27: metalsfor recycling
P28: woodfor recycling
P29: WEEEfor recycling
P31: textilesfor recycling
P6: ELTfor recycling
P8:glasspackagingwaste
P9:paperpackagingwaste
P10:plasticpackagingwaste
P15:MMSWcollection
P34:woodpackagingwaste
P35:metalpackagingwaste
P37:ELT
P38:textileswaste
P39:paperwaste
P40:plasticwaste
P41:metalwaste
P43:WEEE
T3: papertreatment
T4: plastictreatment
T2: metaltreatment
T8: woodtreatment
T9: ELTtreatmentT10: glass
treatment T12: textiletreatment
T13: WEEEteatment
T14: MMSWtreatment
P2: directedto landfilling P3: directed
to incineration
P7:paper
P12:paperpackaging
P13:plastic
P14:plasticpackaging
P20:metal
P21:metalpackaging
P30:woodpackaging
P32:glasspackaging
P44:textiles
P45:EEE
P46:tires
P47:remainder
T15:papercollection
T16:plasticcollection
T17:metalcollection
T18:woodcollection
T19:glasscollection
T21:textilecollection
T22:WEEEcollection
T23:ELTcollection
T24:remaindercollection
P49:reused
P4:treatedoutside EU
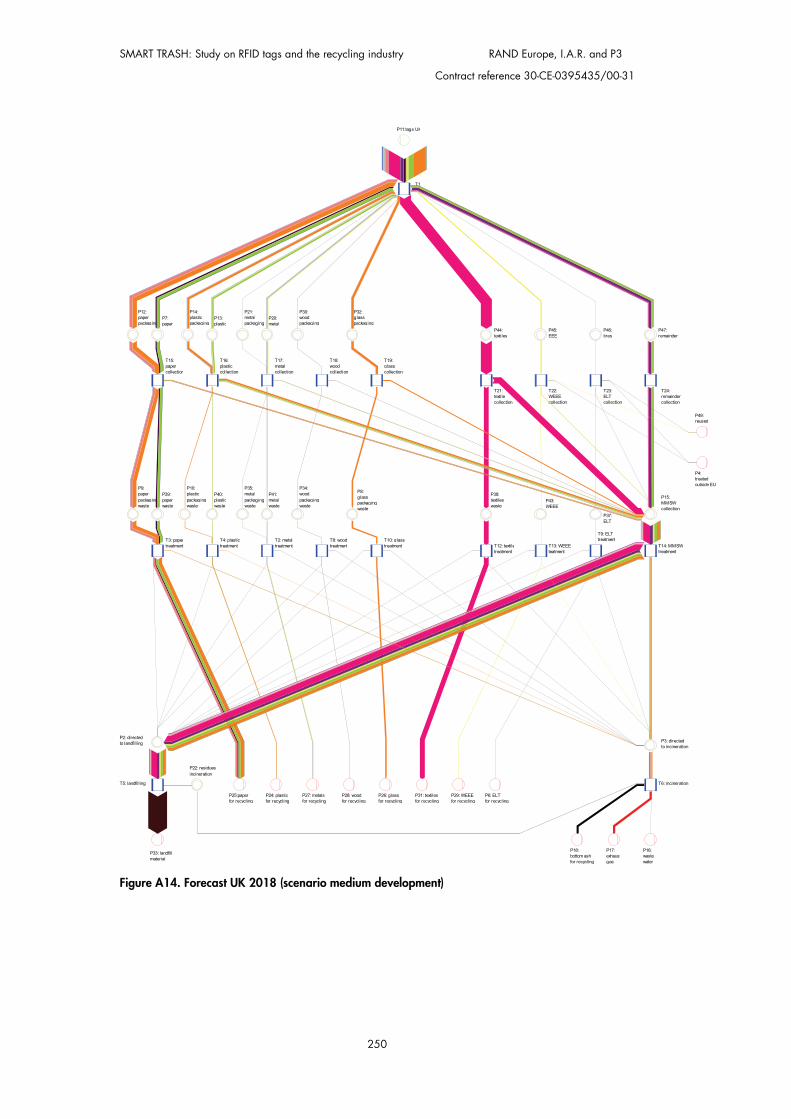
SMART TRASH: Study on RFID tags and the recycling industry RAND Europe, I.A.R. and P3
Contract reference 30-CE-0395435/00-31
250
Figure A14. Forecast UK 2018 (scenario medium development)
T1
T6: incineration
P11:tags UK
P16:wastewater
P17:exhaustgas
P18:bottom ashfor recycling
P33: landfillmaterial
T5: landfilling
P22: residuesincineration
P24: plasticfor recycling
P25:paperfor recycling
P26: glassfor recycling
P27: metalsfor recycling
P28: woodfor recycling
P29: WEEEfor recycling
P31: textilesfor recycling
P6: ELTfor recycling
P8:glasspackagingwaste
P9:paperpackagingwaste
P10:plasticpackagingwaste
P15:MMSWcollection
P34:woodpackagingwaste
P35:metalpackagingwaste
P37:ELT
P38:textileswaste
P39:paperwaste
P40:plasticwaste
P41:metalwaste
P43:WEEE
T3: papertreatment
T4: plastictreatment
T2: metaltreatment
T8: woodtreatment
T9: ELTtreatmentT10: glass
treatment T12: textiletreatment
T13: WEEEteatment
T14: MMSWtreatment
P2: directedto landfilling P3: directed
to incineration
P7:paper
P12:paperpackaging
P13:plastic
P14:plasticpackaging
P20:metal
P21:metalpackaging
P30:woodpackaging
P32:glasspackaging
P44:textiles
P45:EEE
P46:tires
P47:remainder
T15:papercollection
T16:plasticcollection
T17:metalcollection
T18:woodcollection
T19:glasscollection
T21:textilecollection
T22:WEEEcollection
T23:ELTcollection
T24:remaindercollection
P49:reused
P4:treatedoutside EU
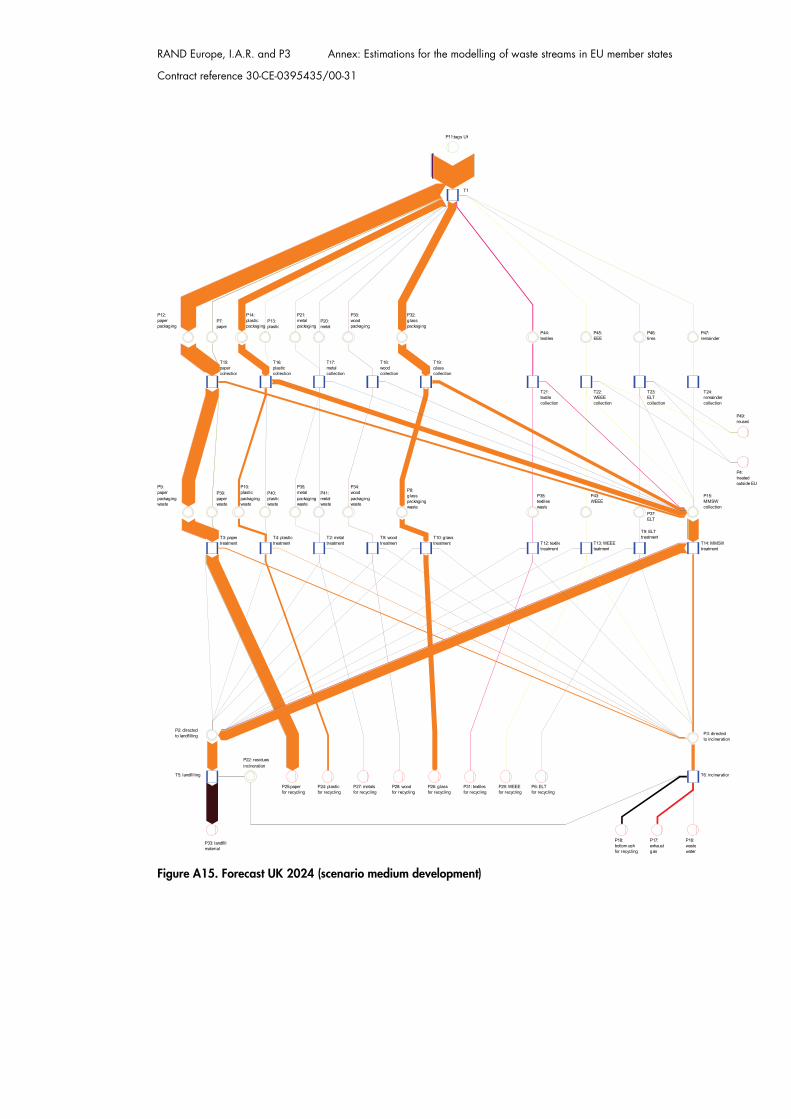
RAND Europe, I.A.R. and P3 Annex: Estimations for the modelling of waste streams in EU member states
Contract reference 30-CE-0395435/00-31
Figure A15. Forecast UK 2024 (scenario medium development)
T1
T6: incineration
P11:tags UK
P16:wastewater
P17:exhaustgas
P18:bottom ashfor recycling
P33: landfillmaterial
T5: landfilling
P22: residuesincineration
P24: plasticfor recycling
P25:paperfor recycling
P26: glassfor recycling
P27: metalsfor recycling
P28: woodfor recycling
P29: WEEEfor recycling
P31: textilesfor recycling
P6: ELTfor recycling
P8:glasspackagingwaste
P9:paperpackagingwaste
P10:plasticpackagingwaste
P15:MMSWcollection
P34:woodpackagingwaste
P35:metalpackagingwaste
P37:ELT
P38:textileswaste
P39:paperwaste
P40:plasticwaste
P41:metalwaste
P43:WEEE
T3: papertreatment
T4: plastictreatment
T2: metaltreatment
T8: woodtreatment
T9: ELTtreatmentT10: glass
treatment T12: textiletreatment
T13: WEEEteatment
T14: MMSWtreatment
P2: directedto landfilling P3: directed
to incineration
P7:paper
P12:paperpackaging
P13:plastic
P14:plasticpackaging
P20:metal
P21:metalpackaging
P30:woodpackaging
P32:glasspackaging
P44:textiles
P45:EEE
P46:tires
P47:remainder
T15:papercollection
T16:plasticcollection
T17:metalcollection
T18:woodcollection
T19:glasscollection
T21:textilecollection
T22:WEEEcollection
T23:ELTcollection
T24:remaindercollection
P49:reused
P4:treatedoutside EU
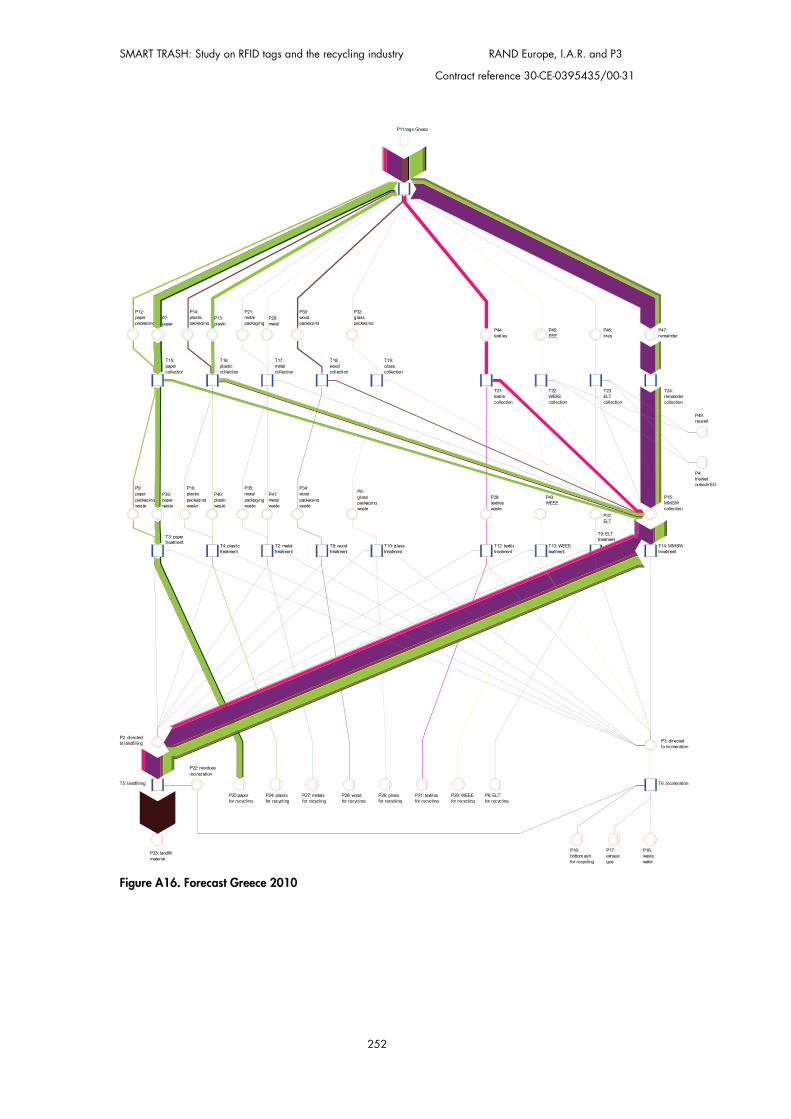
SMART TRASH: Study on RFID tags and the recycling industry RAND Europe, I.A.R. and P3
Contract reference 30-CE-0395435/00-31
252
Figure A16. Forecast Greece 2010
T1
T6: incineration
P11:tags Greece
P16:wastewater
P17:exhaustgas
P18:bottom ashfor recycling
P33: landfillmaterial
T5: landfilling
P22: residuesincineration
P24: plasticfor recycling
P25:paperfor recycling
P26: glassfor recycling
P27: metalsfor recycling
P28: woodfor recycling
P29: WEEEfor recycling
P31: textilesfor recycling
P6: ELTfor recycling
P8:glasspackagingwaste
P9:paperpackagingwaste
P10:plasticpackagingwaste
P15:MMSWcollection
P34:woodpackagingwaste
P35:metalpackagingwaste
P37:ELT
P38:textileswaste
P39:paperwaste
P40:plasticwaste
P41:metalwaste
P43:WEEE
T3: papertreatment
T4: plastictreatment
T2: metaltreatment
T8: woodtreatment
T9: ELTtreatment
T10: glasstreatment
T12: textiletreatment
T13: WEEEteatment
T14: MMSWtreatment
P2: directedto landfilling P3: directed
to incineration
P7:paper
P12:paperpackaging
P13:plastic
P14:plasticpackaging
P20:metal
P21:metalpackaging
P30:woodpackaging
P32:glasspackaging
P44:textiles
P45:EEE
P46:tires
P47:remainder
T15:papercollection
T16:plasticcollection
T17:metalcollection
T18:woodcollection
T19:glasscollection
T21:textilecollection
T22:WEEEcollection
T23:ELTcollection
T24:remaindercollection
P49:reused
P4:treatedoutside EU
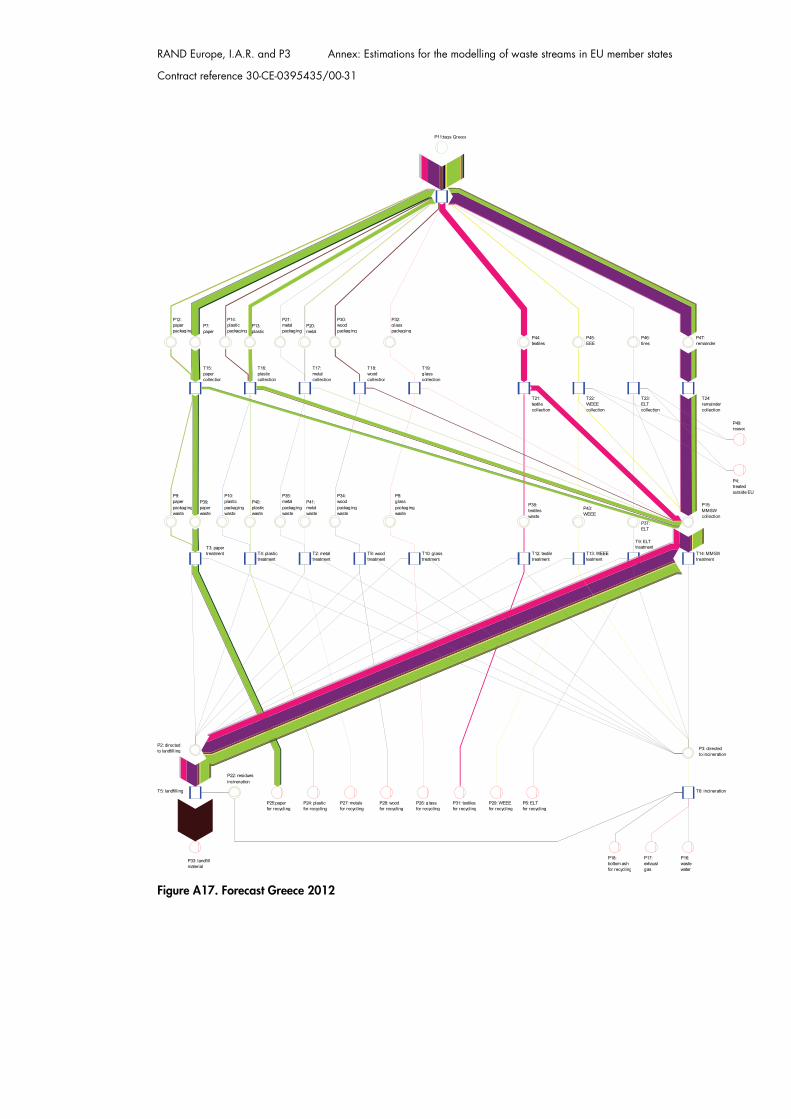
RAND Europe, I.A.R. and P3 Annex: Estimations for the modelling of waste streams in EU member states
Contract reference 30-CE-0395435/00-31
Figure A17. Forecast Greece 2012
T1
T6: incineration
P11:tags Greece
P16:wastewater
P17:exhaustgas
P18:bottom ashfor recycling
P33: landfillmaterial
T5: landfilling
P22: residuesincineration
P24: plasticfor recycling
P25:paperfor recycling
P26: glassfor recycling
P27: metalsfor recycling
P28: woodfor recycling
P29: WEEEfor recycling
P31: textilesfor recycling
P6: ELTfor recycling
P8:glasspackagingwaste
P9:paperpackagingwaste
P10:plasticpackagingwaste
P15:MMSWcollection
P34:woodpackagingwaste
P35:metalpackagingwaste
P37:ELT
P38:textileswaste
P39:paperwaste
P40:plasticwaste
P41:metalwaste
P43:WEEE
T3: papertreatment T4: plastic
treatmentT2: metaltreatment
T8: woodtreatment
T9: ELTtreatment
T10: glasstreatment
T12: textiletreatment
T13: WEEEteatment
T14: MMSWtreatment
P2: directedto landfilling P3: directed
to incineration
P7:paper
P12:paperpackaging
P13:plastic
P14:plasticpackaging
P20:metal
P21:metalpackaging
P30:woodpackaging
P32:glasspackaging
P44:textiles
P45:EEE
P46:tires
P47:remainder
T15:papercollection
T16:plasticcollection
T17:metalcollection
T18:woodcollection
T19:glasscollection
T21:textilecollection
T22:WEEEcollection
T23:ELTcollection
T24:remaindercollection
P49:reused
P4:treatedoutside EU
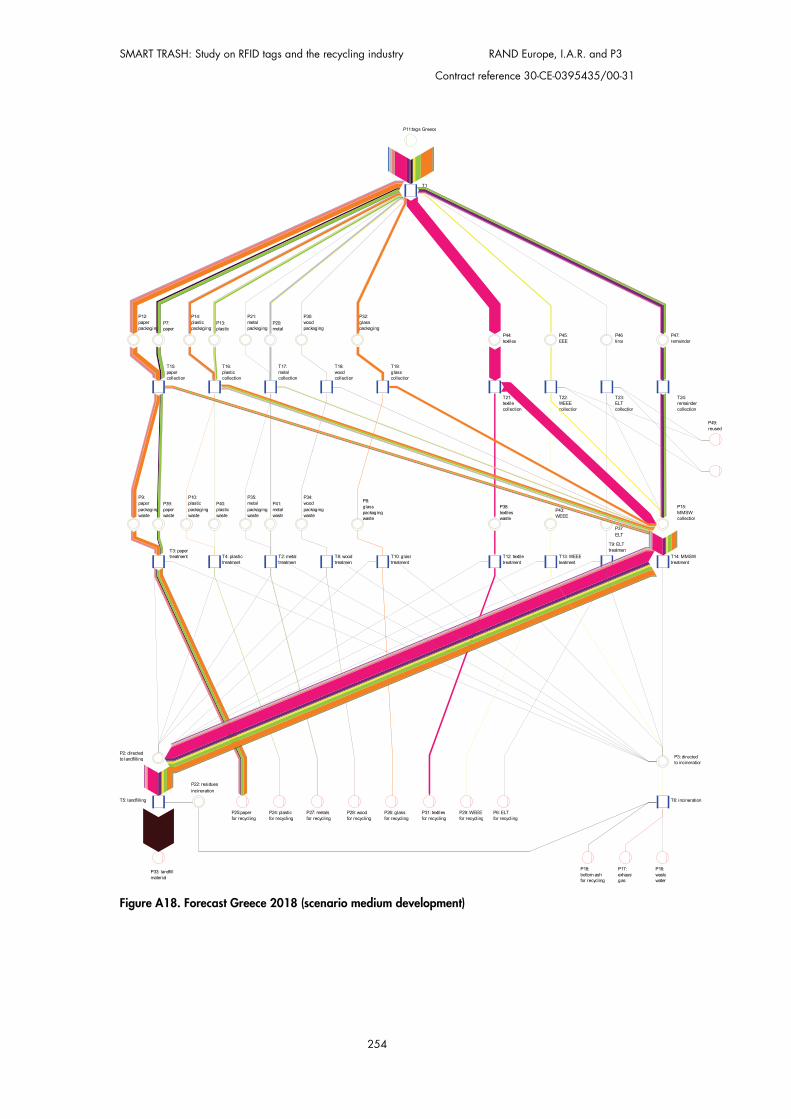
SMART TRASH: Study on RFID tags and the recycling industry RAND Europe, I.A.R. and P3
Contract reference 30-CE-0395435/00-31
254
Figure A18. Forecast Greece 2018 (scenario medium development)
T1
T6: incineration
P11:tags Greece
P16:wastewater
P17:exhaustgas
P18:bottom ashfor recycling
P33: landfillmaterial
T5: landfilling
P22: residuesincineration
P24: plasticfor recycling
P25:paperfor recycling
P26: glassfor recycling
P27: metalsfor recycling
P28: woodfor recycling
P29: WEEEfor recycling
P31: textilesfor recycling
P6: ELTfor recycling
P8:glasspackagingwaste
P9:paperpackagingwaste
P10:plasticpackagingwaste
P15:MMSWcollection
P34:woodpackagingwaste
P35:metalpackagingwaste
P37:ELT
P38:textileswaste
P39:paperwaste
P40:plasticwaste
P41:metalwaste
P43:WEEE
T3: papertreatment T4: plastic
treatmentT2: metaltreatment
T8: woodtreatment
T9: ELTtreatment
T10: glasstreatment
T12: textiletreatment
T13: WEEEteatment
T14: MMSWtreatment
P2: directedto landfilling P3: directed
to incineration
P7:paper
P12:paperpackaging
P13:plastic
P14:plasticpackaging
P20:metal
P21:metalpackaging
P30:woodpackaging
P32:glasspackaging
P44:textiles
P45:EEE
P46:tires
P47:remainder
T15:papercollection
T16:plasticcollection
T17:metalcollection
T18:woodcollection
T19:glasscollection
T21:textilecollection
T22:WEEEcollection
T23:ELTcollection
T24:remaindercollection
P49:reused
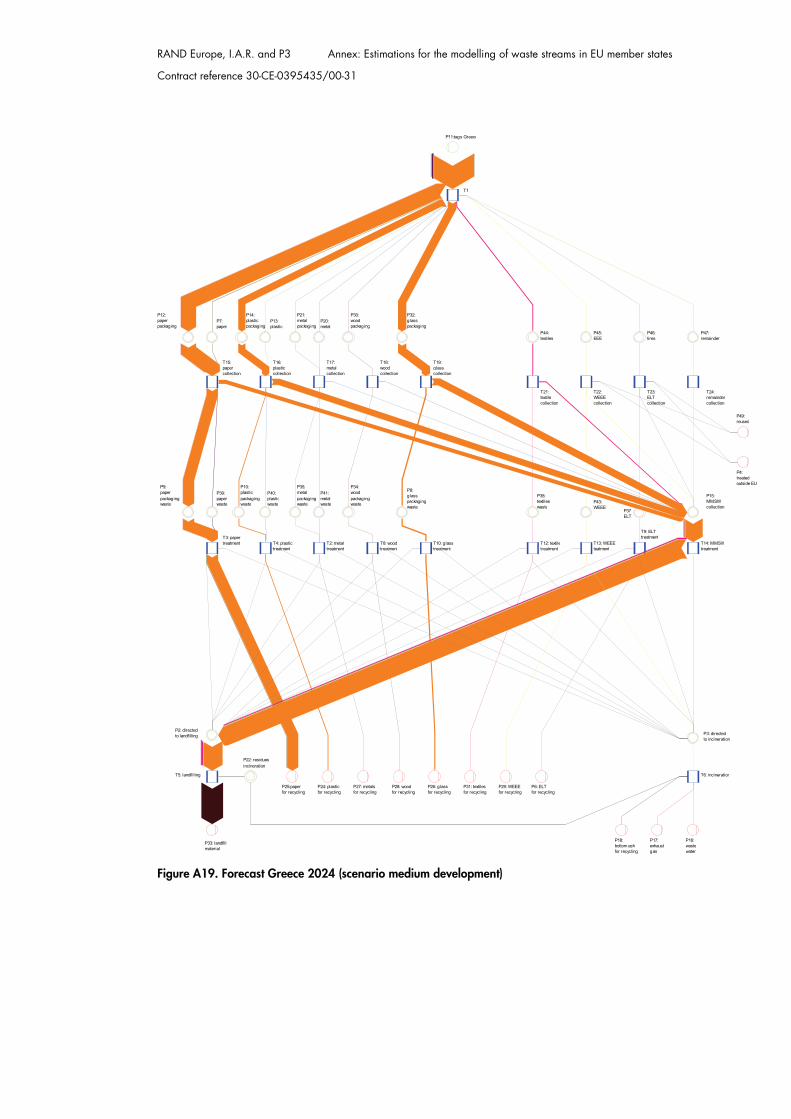
RAND Europe, I.A.R. and P3 Annex: Estimations for the modelling of waste streams in EU member states
Contract reference 30-CE-0395435/00-31
Figure A19. Forecast Greece 2024 (scenario medium development)
T1
T6: incineration
P11:tags Greece
P16:wastewater
P17:exhaustgas
P18:bottom ashfor recycling
P33: landfillmaterial
T5: landfilling
P22: residuesincineration
P24: plasticfor recycling
P25:paperfor recycling
P26: glassfor recycling
P27: metalsfor recycling
P28: woodfor recycling
P29: WEEEfor recycling
P31: textilesfor recycling
P6: ELTfor recycling
P8:glasspackagingwaste
P9:paperpackagingwaste
P10:plasticpackagingwaste
P15:MMSWcollection
P34:woodpackagingwaste
P35:metalpackagingwaste
P37:ELT
P38:textileswaste
P39:paperwaste
P40:plasticwaste
P41:metalwaste P43:
WEEE
T3: papertreatment T4: plastic
treatmentT2: metaltreatment
T8: woodtreatment
T9: ELTtreatment
T10: glasstreatment
T12: textiletreatment
T13: WEEEteatment
T14: MMSWtreatment
P2: directedto landfilling P3: directed
to incineration
P7:paper
P12:paperpackaging
P13:plastic
P14:plasticpackaging
P20:metal
P21:metalpackaging
P30:woodpackaging
P32:glasspackaging
P44:textiles
P45:EEE
P46:tires
P47:remainder
T15:papercollection
T16:plasticcollection
T17:metalcollection
T18:woodcollection
T19:glasscollection
T21:textilecollection
T22:WEEEcollection
T23:ELTcollection
T24:remaindercollection
P49:reused
P4:treatedoutside EU
3 0lagerdelar d3 0l9 8 d3 0l11 8 d3 0l13 8 d3 0l15 8 d3 0l17 8 d3 0l19 8 d3 0l21 8 d3 0l23 8 d3 0l25
3 0bearing parts d3 0l9 8 d3 0l11 8 d3 0l13 8 d3 0l15 8 d3 0l17 8 d3 0l19 8 d3 0l21 8 d3 0l23 8 d3 0