interim report, 4th quarter 2012/13 1 march 2013 – 31...
TRANSCRIPT

Bang & Olufsen a/s grOupCompany announcement no. 13.02 – 16 august 2013
InTerIM repOrT, 4Th quarTer 2012/13
1 March 2013 – 31 May 2013
Bang & Olufsen a/s
Peter Bangs Vej 15
DK-7600 Struer
Tel. +45 9684 1122
www.bang-olufsen.com
comreg: 41257911
Bang & Olufsen a/s inTeriM rePOrT 4Th quarTer 2012/13 · 2
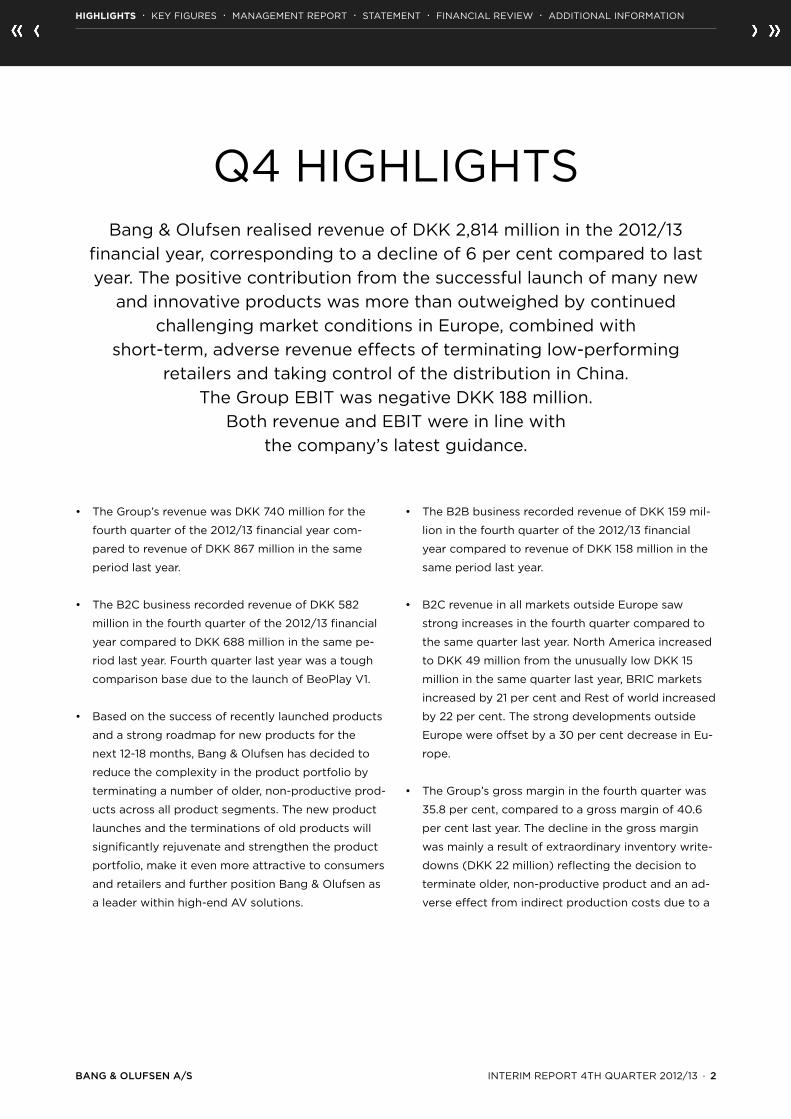
• TheGroup’srevenuewasDKK740millionforthe
fourthquarterofthe2012/13financialyearcom-
paredtorevenueofDKK867millioninthesame
periodlastyear.
• TheB2CbusinessrecordedrevenueofDKK582
millioninthefourthquarterofthe2012/13financial
yearcomparedtoDKK688millioninthesamepe-
riodlastyear.Fourthquarterlastyearwasatough
comparisonbaseduetothelaunchofBeoPlayV1.
• Basedonthesuccessofrecentlylaunchedproducts
andastrongroadmapfornewproductsforthe
next12-18months,Bang&Olufsenhasdecidedto
reducethecomplexityintheproductportfolioby
terminatinganumberofolder,non-productiveprod-
uctsacrossallproductsegments.Thenewproduct
launchesandtheterminationsofoldproductswill
significantlyrejuvenateandstrengthentheproduct
portfolio,makeitevenmoreattractivetoconsumers
andretailersandfurtherpositionBang&Olufsenas
aleaderwithinhigh-endAVsolutions.
• TheB2BbusinessrecordedrevenueofDKK159mil-
lioninthefourthquarterofthe2012/13financial
yearcomparedtorevenueofDKK158millioninthe
sameperiodlastyear.
• B2CrevenueinallmarketsoutsideEuropesaw
strongincreasesinthefourthquartercomparedto
thesamequarterlastyear.NorthAmericaincreased
toDKK49millionfromtheunusuallylowDKK15
millioninthesamequarterlastyear,BRICmarkets
increasedby21percentandRestofworldincreased
by22percent.Thestrongdevelopmentsoutside
Europewereoffsetbya30percentdecreaseinEu-
rope.
• TheGroup’sgrossmargininthefourthquarterwas
35.8percent,comparedtoagrossmarginof40.6
percentlastyear.Thedeclineinthegrossmargin
wasmainlyaresultofextraordinaryinventorywrite-
downs(DKK22million)reflectingthedecisionto
terminateolder,non-productiveproductandanad-
verseeffectfromindirectproductioncostsduetoa
Q4HIGHlIGHTsBang&OlufsenrealisedrevenueofDKK2,814millioninthe2012/13
financialyear,correspondingtoadeclineof6percentcomparedtolastyear.Thepositivecontributionfromthesuccessfullaunchofmanynew
andinnovativeproductswasmorethanoutweighedbycontinuedchallengingmarketconditionsinEurope,combinedwith
short-term,adverserevenueeffectsofterminatinglow-performing retailersandtakingcontrolofthedistributioninChina.
TheGroupEBITwasnegativeDKK188million. BothrevenueandEBITwereinlinewith
thecompany’slatestguidance.
hIGhLIGhTS · KEyFIGuREs · mANAGEmENTREPORT · STaTeMenT · FINANCIAlREVIEw · ADDITIONAlINFORmATIONHighlights#1-R

Bang & Olufsen a/s inTeriM rePOrT 4Th quarTer 2012/13 · 3
significantinventoryreductioninthequarter.These
effectswereonlypartiallyoffsetbyadecreasein
warrantyprovisions(DKK23million)reflectinga
continuedpositivedevelopmentinthequalitylevel
oftheproductportfolio.
• CapacitycostswereDKK304millioninthefourth
quarter,comparedtoDKK271millioninthefourth
quarterlastyear.Thequarterwasimpactedby
higheramortisationandlowercapitalisationonde-
velopmentprojectsofDKK25millioncomparedto
thesamequarterlastyear.Additionalcostincreases
relatetoanincreasedlevelofownretailandthees-
tablishmentofaB&OPlAyorganisation.Thecapac-
itycostsincludednetnon-recurringitemsofDKK15
million,mainlyrelatedtonetworkrestructuringand
organisationalchanges.
• Earningsbeforetaxforthefourthquarterofthe
2012/13financialyearwerenegativeDKK45million
againstpositiveDKK77millioninthesamequarter
lastyear.
• Freecashflowinthefourthquarterwaspositiveat
DKK59millioncomparedtonegativeDKK51mil-
lioninthesameperiodlastyear.TheGroup’snet
workingcapitalwasreducedtoDKK557millionat
theendofthefourthquarterofthe2012/13financial
yearcomparedtoDKK613attheendofthe2011/12
financialyear.
• The2013/14financialyearisthethirdyearofthe
transitionphaseinthe“leaner,Faster,stronger”
strategy.Thekeyfocusfortheyearwillbetocon-
tinuetobuildastrongfoundationthatwillprepare
Bang&Olufsenforfuturegrowth,whileensuringa
significantimprovementinthefinancialresults.
• AftertheendofthereportingperiodBang&Oluf-
senhastakenover20shopsfromtheprevious
masterdealerRichcominChina(includingBeijing
andshanghai).ThismeansthatBang&Olufsennow
ownsandoperates31outofthe36storesinChina
andHongKong.Thefinalpurchasepricehasnot
beenfinalisedyet,butisexpectedtobeinthelevel
ofDKK35million.
Anyenquiriesaboutthisannouncementcanbead-
dressedto:
CEO,Tuemantoni,tel.:+4596845000
Presscontact,mortenJuhlmadsen,tel.:+4540308986
Investors,ClausHøjmarkJensen,tel:+4523251067
Awebcastwillbehostedon16August2013at10.00.
Accesstothewebcastisobtainedthroughourweb
pagewww.bang-olufsen.com/investor.
hIGhLIGhTS · KEyFIGuREs · mANAGEmENTREPORT · STaTeMenT · FINANCIAlREVIEw · ADDITIONAlINFORmATION

Bang & Olufsen a/s inTeriM rePOrT 4Th quarTer 2012/13 · 4
Bang & Olufsen a/s–Group 4th quarter YTD
(DKKmillion) 2012/13 2011/12 2012/13 2011/12
Income statement: Revenue 740 867 2,814 3,008Grossmargin,% 35.8 40.6 38.9 40.4Earningsbeforeinterest,taxes,depreciation,amortisationand capitalisation(EBITDAC) (27) 69 (107) 99Earningsbeforeinterest,taxes,depreciationand amortisation(EBITDA) 50 156 144 379Earningsbeforeinterestandtax(EBIT) (39) 81 (188) 122Financialitems,net (6) (4) (25) (16)Earningsbeforetax(EBT) (45) 77 (212) 104Earningsaftertax (37) 55 (160) 73 financial position: Totalassets 2,757 2,892 2,757 2,892sharecapital 393 362 393 362Equity 1,641 1,626 1,641 1,626Netinterest-bearingdebt 273 248 273 248Networkingcapital 557 613 557 613 Cash flow: –fromoperatingactivities 168 87 127 225–frominvestingactivities (109) (137) (328) (380)–freecashflow 59 (51) (202) (155)–fromfinancingactivities (22) 94 171 134Cashflowfortheperiod 37 43 (30) (21) Key figures: EBITDA-margin,% 6.7 18.0 5.1 12.3EBIT-margin,% (5.2) 9.4 (6.7) 4.1NIBD/EBITDAratio*) 1.9 0.7 1.9 0.7Returnonassets,% (1.6) 3.5 (7.7) 5.2Returnoninvestedcapital,excl.goodwill,% 1.3 7.9 2.3 17.4Returnonequity,% (2.3) 3.4 (9.8) 4.6Fulltimeemployeesattheendoftheperiod 2,036 2,106 2,036 2,106 stock related key figures: Earningspershare(EPs),DKK (1) 2 (4) 2Earningspersharediluted(EPs-D),DKK (1) 2 (4) 2Price/Earnings (59) 41 (13) 30
*) Calculated based on rolling 12m EBITDA
KEyFIGuREs
HIGHlIGHTs · key fIGureS · mANAGEmENTREPORT · STaTeMenT · FINANCIAlREVIEw · ADDITIONAlINFORmATIONKeyfigures#2-R

Bang & Olufsen a/s inTeriM rePOrT 4Th quarTer 2012/13 · 5
revenue
TheGroup’srevenueforthefourthquarterofthe
2012/13financialyearwasDKK740million,comparedto
DKK867millionlastyear,oradeclineof15percent.
TheB2Cbusiness,whichconsistsoftheAVandthe
B&OPlAysegments,recordedrevenueofDKK582mil-
lioninthefourthquarterofthe2012/13financialyear
comparedtorevenueofDKK688millioninthesame
periodlastyear.TheB2Cbusinesswasthereforethe
mainexplanationforthedeclineingrouprevenue.
TheAVsegmentrecordedrevenueofDKK470mil-
lioninthefourthquarterofthe2012/13financialyear
comparedtoDKK505millioninthesameperiodlast
year,correspondingtoadeclineof7percent.Newly
launchedproductscontinuetoperformwell.Basedon
thesuccessofrecentlylaunchedproductsandastrong
roadmapfornewproductsforthenext12-18months,
Bang&Olufsenhasdecidedtoreducethecomplexityin
theproductportfoliobyterminatinganumberofolder,
non-productiveproductsacrossallproductsegments.
Thenewproductlaunchesandtheterminationsofold
productswillsignificantlyrejuvenateandstrengthenthe
productportfolio,makeitevenmoreattractivetocon-
sumersandretailersandfurtherpositionBang&Olufsen
asaleaderwithinhigh-endAVsolutions.
revenue q4 2012/13 (Q42011/12inbrackets)
mANAGEmENTREPORTstrongB2CgrowthoutsideEuropeandagrowthof17percentintheAutomotivesegmentinthefourthquarterofthe2012/13financialyear
wereoutweighedbyadeclineinEurope,whichmainlyrelatestoa lowerlevelofnewproductlaunches,storeterminationsaswellas
continuedchallengingmarketconditionsinEurope.
B2c DKK 582m
(DKK688m)
B2B DKK 159m
(DKK158m)
aVDKK 470m
(DKK505m)
B&O PlAyDKK 113m
(DKK183m)
AutomotiveDKK 140m
(DKK120m)
icepowerDKK 19m
(DKK38m)
Developmentinthefourthquarter
HIGHlIGHTs · KEyFIGuREs · manaGemenT reporT · STaTeMenT · FINANCIAlREVIEw · ADDITIONAlINFORmATION
DeLevopmenT In 4Th quarTer · DIsTRIBuTIONDEVElOPmENTIN4THQuARTER · DEVElOPmENTINNumBEROFsHOPs ExPECTATIONsTOTHE2012/13FINANCIAlyEAR · SuBSequenT eVenTS
managementReport#3-R
Development#1-u

Bang & Olufsen a/s inTeriM rePOrT 4Th quarTer 2012/13 · 6
revenue and growth by segment q4 – B2C (DKK million)
0
100
200
300
400
500
600
700
AV
Q4 11/12
B&O PLAY Total B2C
Q4 12/13
-7%
-38%
-15%
revenue and growth by segment q4 – B2B (DKK million)
0
20
40
60
80
100
120
140
160
ICEpower
Q4 11/12
Automotive Total B2B
Q4 12/13
+17%
-50%
+1%
B&OPlAyrecordedrevenueofDKK113millioninthe
fourthquarterofthe2012/13financialyearcompared
toDKK183millioninthefourthquarterlastyear,which
waspositivelyaffectedbythelaunchoftheBeoPlay
V1,BeoPlayA8andtheBeoPlayA3whichintermsof
impactexceededthepositiveeffectfromthelaunchof
theBeoPlayH3andH6headphonesinthefourthquar-
terthisyear.TheBeoPlayH3andH6headphoneshave
beenwellreceivedbyconsumers,dealersandthepress
inthemarketswheretheyhavebeenlaunched.Afull
marketroll-outwilloccurduring2013/14.
B2CrevenueinEuropedecreasedby30percentinthe
quarterdrivenbybroaddeclineacrossallEuropean
markets.
BRICmarketsgrewby21percentmainlydrivenby
stronggrowthinBang & Olufsen’sownstoresinHong
KongandsouthChina,newlyopenedB1storesand
dedicatedB&OPlAyshop-in-shopsinChina.Thetakeo-
verofthemasterdealerinmid-Chinacontinuedtohave
anadverseimpactontherevenuefromChinaduringthe
quarter.Thetotaleffectonturnoverfortheyearwasas
expectedapproximatelyDKK100million.
RevenueinNorthAmericaincreasedtoDKK49million,
fromtheunusuallylowDKK15millioninthesamequar-
terlastyear.B2CrevenueintheRestofworldincreased
by22percent.
TheB2Bbusiness,whichconsistsoftheAutomotiveand
ICEpowersegments,recordedrevenueofDKK159mil-
lioninthefourthquarterofthe2012/13financialyear
whichisonthesamelevelaslastyear.
TheAutomotivesegmentrecordedrevenueofDKK140
millioninthefourthquarterofthe2012/13financialyear,
comparedtoDKK120millioninthefourthquarterlast
yearandhencecontinuedtoshowstronggrowth.The
growthwasdrivenbythelaunchofanumberofnewcar
models.
TheICEpowersegmentrecordedrevenueofDKK19mil-
lioninthefourthquarterofthe2012/13financialyear
comparedtoDKK38millioninthesameperiodlastyear
whichisareductionof50percentandisduetolower
demandfromexternalcustomersaswellasfromthe
Bang & OlufsenGroup.
HIGHlIGHTs · KEyFIGuREs · manaGemenT reporT · STaTeMenT · FINANCIAlREVIEw · ADDITIONAlINFORmATION
DeLevopmenT In 4Th quarTer · DIsTRIBuTIONDEVElOPmENTIN4THQuARTER · DEVElOPmENTINNumBEROFsHOPs ExPECTATIONsTOTHE2012/13FINANCIAlyEAR · SuBSequenT eVenTS

Bang & Olufsen a/s inTeriM rePOrT 4Th quarTer 2012/13 · 7
gross margin
TheGroupgrossmargindecreasedto35.8percentin
thefourthquarterfromagrossmarginof40.6percent
inthefourthquarterofthe2011/12financialyear.
ThegrossmargininAVwas35.5percentinthefourth
quarterofthefinancialyear,comparedto44.7percent
inthesamequarterlastyear.Thegrossmargininthe
fourthquarterwasaffectedbythefollowingitems:
• Torejuvenateandstrengthentheproductportfolio,
inparallelwithlaunchinganumberofstrongnew
products,Bang&Olufsendecidedtoreducethe
complexityintheproductportfoliobyterminatinga
numberofoldernon-productiveproductsacrossall
productsegments.Thewritedownofinventoryre-
latedtothisnegativelyaffectedthegrossmarginby
DKK22millioninthefourthquarterofthe2012/13
financialyear.
• Inadditionthedecreaseingrossmarginwasaresult
oflowrevenueleadingtorelativelyhighersemi-var-
iablecosts,andasignificantreductionininventory
whichresultedinareductionofindirectproduction
costscapitalisedaspartofinventory.
• Bang&Olufsen’scontinuousfocusonimproving
productquality.Thishasresultedinareducedneed
forwarrantyprovisionsandasaresultDKK23mil-
lionwasreleasedinthefourthquarterofthe2012/13
financialyear.
ThegrossmarginforB&OPlAyinthefourthquarter
ofthe2012/13financialyearwas31.4percentagainsta
grossmarginof25.5percentforthesameperiodlast
year.Theincreasecomparedtothesamequarterlast
yearismainlyduetoachangeinproductmix,asprod-
uctslaunchedduring2012/13haveahighergrossmar-
ginthaninparticulartheBeoPlayV1.
ThegrossmarginwithintheAutomotivesegmentinthe
fourthquarterofthe2012/13financialyearwas36.9
percentagainstagrossmarginof32.4percentforthe
sameperiodlastyear.
ThegrossmarginwithintheICEpowersegmentwas
56.2percentinthefourthquarterofthe2012/13finan-
cialyearagainstagrossmarginof49.9percentforthe
sameperiodlastyear.
gross margin by segment q4 – B2B (%)
0
10
20
30
40
50
60
ICEpower
Q4 11/12
Automotive Total B2B
Q4 12/13
gross margin by segment q4 – B2C (%)
0
10
20
30
40
50
60
AV
Q4 11/12
B&O PLAY Total B2C
Q4 12/13
HIGHlIGHTs · KEyFIGuREs · manaGemenT reporT · STaTeMenT · FINANCIAlREVIEw · ADDITIONAlINFORmATION
DeLevopmenT In 4Th quarTer · DIsTRIBuTIONDEVElOPmENTIN4THQuARTER · DEVElOPmENTINNumBEROFsHOPs ExPECTATIONsTOTHE2012/13FINANCIAlyEAR · SuBSequenT eVenTS

Bang & Olufsen a/s inTeriM rePOrT 4Th quarTer 2012/13 · 8
Capacity costs
Duringthefourthquarterofthe2012/13financialyear,
thecapacitycostsincreasedtoDKK304millionfrom
DKK271millioninthesameperiodlastyear.Thein-
creasemainlyrelatestohigherdevelopmentcosts,and
higherdistributionandmarketingcosts.
Thecapacitycostincludenetnon-recurringcostsof
DKK15millionforthefourthquarterofthefinancial
year,whichmainlyrelatetoorganisationalchanges,net-
workrestructuringandrestructuringoftheEuropean
salessetup.Themajorityofthesecostsaffectedthedis-
tributionandmarketingcosts.
DistributionandmarketingcostswereDKK188million
inthefourthquarterofthe2012/13financialyearcom-
paredtoDKK168millioninthesameperiodlastyear.
ThiscorrespondstoanincreaseofDKK19millionwhich
mainlyisduetotheincreasedlevelofownstores.
AdministrationcoststotalledDKK22millioninthe
fourthquarterofthe2012/13financialyearcomparedto
DKK30millioninthefourthquarterofthe2011/12finan-
cialyear.
TheGroupincurreddevelopmentcostsofDKK111mil-
lionforthefourthquarterofthe2012/13financialyear
(ofwhichDKK77millionwerecapitalised)againstDKK
120millionforthesameperiodlastyear(ofwhichDKK
87millionwerecapitalised).Theactivitylevelinproduct
developmentremainshigh.
Expenseddevelopmentcosts(incl.amortisationand
impairmentlosses)wereDKK94millionforthefourth
quarterofthe2012/13financialyear,comparedtoDKK
73millionforthesameperiodlastyear.Totalamortisa-
tionchargesandimpairmentlossesondevelopment
projectswereDKK60millioncomparedtoDKK40
millionlastyear.Theincreaseinamortisationcharges
mainlyrelatestoamortisationonthevideoengine,
whichwaslaunchedinthefourthquarter2011/12(in
BeoPlayV1)andtoamortisationonnewlylaunched
Capitalised development costs and carrying amount (DKKmillion)–Q4
2012/13
B2C B2B Total
Capitalised,net 51 26 77
Carryingamount,net 431 232 663
Capitalised development costs and carrying amount (DKKmillion)–Q4
2011/12
B2C B2B Total
Capitalised,net 61 26 87
Carryingamount,net 442 194 636
automotivemodels.Theneteffectofcapitalisationwas
positiveDKK17millioncomparedtoapositiveeffect
ofDKK47millionlastyear–anadverseimpactfrom
capitalisationofDKK30millioncomparedtothesame
periodlastyear.
Inthefourthquarterofthe2012/13financialyearthe
capitaliseddevelopmentcostswereDKK77million,of
whichDKK23millionrelatetoAutomotiveprojects.
DuringthefourthquarterreimbursementsofDKK3
millionwerereceivedfromAutomotivepartnerswhich
wasinlinewiththesameperiodlastyear.Thereim-
bursementsreceivedhavebeenoffsetdirectlyinintan-
gibleassets.
Earningsbeforetaxforthefourthquarterofthe2012/13
financialyearwerenegativeDKK45millionagainst
positiveDKK77millioninthesameperiodlastyear.
HIGHlIGHTs · KEyFIGuREs · manaGemenT reporT · STaTeMenT · FINANCIAlREVIEw · ADDITIONAlINFORmATION
DeLevopmenT In 4Th quarTer · DIsTRIBuTIONDEVElOPmENTIN4THQuARTER · DEVElOPmENTINNumBEROFsHOPs ExPECTATIONsTOTHE2012/13FINANCIAlyEAR · SuBSequenT eVenTS

Bang & Olufsen a/s inTeriM rePOrT 4Th quarTer 2012/13 · 9
Forcommentsontheincomestatementmovements
yeartodaterefertotheAnnualReport2012/13.
Development in balance sheet items and cash flow
AttheendofthefourthquartertheGroup’snetwork-
ingcapitalwasreducedtoDKK557millioncompared
toDKK613millionattheendofthefourthquarterof
the2011/12financialyear,andDKK708millionatthe
endofthethirdquarter2012/13.Thedecreasecom-
paredtothepreviousfinancialyearmainlyrelatestoa
reductionininventoryandtradereceivablesoffsettoa
certainextentbyadecreaseinpayables.
Freecashflowinthefourthquarterwaspositiveat
DKK59millioncomparedtonegativeDKK51million
inthesameperiodlastyear.Forthefullfinancialyear
Bang & Olufsengeneratedafreecashflowofnegative
DKK202millioncomparedtonegativeDKK155million
inthesameperiodlastyear.
ThenetinterestbearingdebtincreasedtoDKK273mil-
lionfromDKK248millionbytheendofthe2011/12fi-
nancialyear,andDKK331millionattheendofthethird
quarter2012/13.Theincreasecomparedtolastyearin
thenetinterestbearingdebtwasprimarilycausedby
thenegativenetearnings.
TheGroup’sequityhasincreasedfromDKK1,626mil-
liontoDKK1,641milliondespitethenegativeearnings
aftertax.Thiswasprimarilyduetothecapitalincrease
followingthestrategicpartnershipenteredintowith
sparkleRollandACAPITAl.
TheGroupequityratiowas60percentattheendof
the2012/13financialyearagainst56percentatthe
endofthe2011/12financialyear.
HIGHlIGHTs · KEyFIGuREs · manaGemenT reporT · STaTeMenT · FINANCIAlREVIEw · ADDITIONAlINFORmATION
DeLevopmenT In 4Th quarTer · DIsTRIBuTIONDEVElOPmENTIN4THQuARTER · DEVElOPmENTINNumBEROFsHOPs ExPECTATIONsTOTHE2012/13FINANCIAlyEAR · SuBSequenT eVenTS

Bang & Olufsen a/s inTeriM rePOrT 4Th quarTer 2012/13 · 10
1)EuropecoversDenmark,Norway,sweden,unitedKingdom,Netherlands,Belgium,Germany,switzerland,Austria,spain,ItalyandFrance.
2)NorthAmericacoversusA,Canadaandmexico.3)BRICcoversBrazil,Russia,India,China,Taiwan,HongKongand
Korea.
Distributiondevelopmentin thefourthquarter
revenue development by region
Inthefourthquarterofthe2012/13financialyearrev-
enueinEuropedecreasedbyDKK159million–cor-
respondingto30percent–toDKK379million.The
declinewasseenacrossmostEuropeanmarkets.The
revenueinEuropewasnegativelyaffectedbychal-
lengingmarketconditionsaffectingconsumerde-
mandandthedecisiontoterminatelowperforming
storesaswellasthefactthatthestrongB&OPlAy
revenueinthefourthquarterlastyearwasdrivenpri-
marilybytheEuropeanmarket.
NorthAmericarecordedrevenueofDKK49million
comparedtotheunusuallylowDKK15millioninrev-
enueinthesamequarterlastyear.
BRICmarketsgrewby21percentmainlydrivenby
stronggrowthinBang & Olufsen’sownstoresinHong
KongandsouthChinaaswellassalesrelatedtothe
openingofnewB1anddedicatedB&OPlAyshop-in-
shopsinChina.Thetakeoverofthemasterdealerin
mid-Chinacontinuedtohaveanadverseimpacton
therevenuefromChina.
RevenueinRestofworldincreasedfromDKK52mil-
lionforthesameperiodlastyeartoDKK64million.
RevenuethroughthirdpartychannelswasDKK15mil-
lioncomparedtoDKK20millionforthesameperiod
lastyear.Thefourthquarterlastyearwaspositively
impactedbymultipleB&OPlAyproductlaunches
andtheopeningofalargenumberofoutlets.
revenue growth by region (q4 and YTD)
-50
0
50
100
150
200
250
Q4YTD
%
Europe1) North America2) BRIC3) Rest of World Total
HIGHlIGHTs · KEyFIGuREs · manaGemenT reporT · STaTeMenT · FINANCIAlREVIEw · ADDITIONAlINFORmATION
DElEVOPmENTIN4THQuARTER · DISTrIbuTIon DeveLopmenT In 4Th quarTer · DEVElOPmENTINNumBEROFsHOPs ExPECTATIONsTOTHE2012/13FINANCIAlyEAR · SuBSequenT eVenTS
Distribution#2-u

Bang & Olufsen a/s inTeriM rePOrT 4Th quarTer 2012/13 · 11
Development in the number of shops
Inordertocreateahealthierretailnetwork,withfewer,
moreproductivestores,Bang & Olufsenannounced
duringthe2012/13financialyear,thatinitiativeswould
betakentocloseupto125storesprimarilyinEurope.
80ofthesestoreshavebeenterminatedwithinthe
2012/13financialyear,andwillclosewithinthesix
monthterminationperiod.16oftheterminatedstores
closedalreadyinthe2012/13financialyear.Theremain-
ingstoreswillbeterminatedduringthe2013/14finan-
cialyear.Focusingthedistributiononfewer,morepro-
ductivestoreswillenableBang&Olufsenandtheretail
networktoinvestinservice,events,marketing,store
designandothercustomerfocusedactivities,which
willfurtherstrengthenthecustomerexperienceand
ensureastrongerlong-termgrowthforBang & Olufsen
andthenetwork.Theadverserevenueimpactrelated
tothisinitiativeisestimatedtohavebeenapproximate-
lyDKK130millionin2012/13.
InApril2013thefirststorewiththenewstorede-
signopenedonstrøgetinCopenhagen.Thenew
storedesignhasastrongfocusonemphasizing
Bang & Olufsen’suniquecapabilitieswithinacoustics,
designandcraftsmanshipandisdesignedtocreatea
trulymagicalshoppingexperienceforBang & Olufsen’s
customers.
Bytheendofthefourthquarter,therewere611B1
storesacrosstheworldagainst628attheendofthe
thirdquarterofthe2012/13financialyear.Thus,thenet
movementforthefourthquarterwasanetreductionof
17stores,withthreeopeningsand20closures.
Bytheendofmay2013,therewere402B1storesinEu-
ropeagainst419attheendofthethirdquarter2012/13.
ThenetmovementinEuropeforthefourthquarter
thereforeamountstoareductionof17stores,withtwo
openingsand19closures.
InNorthAmerica,therewere51B1storesagainst50
attheendofthethirdquarterofthefinancialyear
2012/13.ThemovementinNorthAmericaforthefourth
quarterwasoneopening.
IntheBRICmarketstherewere73B1storeswhichis
unchangedfromtheendofthethirdquarterofthefi-
nancialyear2012/13.
number of B1 shops and shop-in-shops B1 shops by region
0
100
200
300
400
500
600
700
800
B1 shops Shop-in-shops
31.05.1231.05.13
0
50
100
150
200
250
300
350
400
450
500
Europe North America BRIC Rest of World
31.05.1231.05.13
HIGHlIGHTs · KEyFIGuREs · manaGemenT reporT · STaTeMenT · FINANCIAlREVIEw · ADDITIONAlINFORmATION
DElEVOPmENTIN4THQuARTER · DIsTRIBuTIONDEVElOPmENTIN4THQuARTER · DeveLopmenT In number of ShopS ExPECTATIONsTOTHE2012/13FINANCIAlyEAR · SuBSequenT eVenTS
shops#4-u

Bang & Olufsen a/s inTeriM rePOrT 4Th quarTer 2012/13 · 12
InRestofworldtherewere85B1storesagainst86
attheendofthethirdquarterofthefinancialyear
2012/13.Thenetmovementforthefourthquarter
amounts to one closure.
Thenumberofshop-in-shopswas205against212
attheendofthethirdquarterofthefinancialyear
2012/13.
Attheendofthe2012/13financialyear,sparkleRoll
hadopened16dedicatedB&OPlAystoresacross
China.Thestoreswillbeincludedinthestorecount
from q1 2013/14.
TheshareofrevenueforB1shopswas86percent
comparedto89percentinfourthquarterofthe
2011/12financialyear.
Forthefourthquarterofthe2012/13financialyearthe
revenuetoBang & Olufsenshopswithmorethan24
monthsofoperationsdecreasedby23percentforB1
shopsand34percentforshop-in-shops.
HIGHlIGHTs · KEyFIGuREs · manaGemenT reporT · STaTeMenT · FINANCIAlREVIEw · ADDITIONAlINFORmATION
DElEVOPmENTIN4THQuARTER · DIsTRIBuTIONDEVElOPmENTIN4THQuARTER · DeveLopmenT In number of ShopS ExPECTATIONsTOTHE2012/13FINANCIAlyEAR · SuBSequenT eVenTS

Bang & Olufsen a/s inTeriM rePOrT 4Th quarTer 2012/13 · 13
TheGroup’sexpectationstothe2013/14financialyear
The2013/14financialyearisthethirdyearofthetransi-
tionphaseinthe“leaner,Faster,stronger”strategy.
Thekeyfocusfortheyearwillbetocontinuetobuild
astrongfoundationthatwillprepareBang&Olufsen
forfuturegrowth,whileensuringasignificantimprove-
mentinthefinancialresults.
ContinuedchallengingmarketconditionsinEuropeis
likelytohaveanegativeimpactonconsumerconfi-
denceandcontinuetocreateheadwindfortheoverall
AVmarketinthe2013/14financialyear,andhencehave
anadverseeffectonthegeneraldemandforproducts
acrossallofBang&Olufsen’ssegments.
Themostimportantfocusareasinthe2013/14finan-
cialyeararetherejuvenationandstrengtheningofthe
Bang&Olufsenproductportfolioandthetransforma-
tionoftheretailnetwork,whilecontinuingtogrow
AutomotiveandB&OPlAy,albeitatareducedrate.It
isexpectedthatthiswillleadtorevenuemoderately
abovethelevelofthe2012/13financialyear.
Acontinuedfocusonoperationalandsourcingeffi-
cienciesandanincreasedshareofsalesofhighmargin
productsareexpectedtoincreasethegrossmarginto
alevelslightlyabovethelevelinthe2012/13financial
year.
Capacitycostsexcludingtheincreasedcostsofown
retailareexpectedtobereduced.Thecostsrelatedto
ownretailwillincreasecomparedtothe2012/13finan-
cialyearinparticularduetothetakeoveroftheretail
operationsinChina.
TheEBITmarginisexpectedtoshowsignificantim-
provementcomparedtothe2012/13financialyeartoa
levelaroundbreak-even.However,theEBITmarginis
highlysensitivetothedevelopmentintherevenue.
subsequentevents
AspreviouslycommunicatedBang & Olufsentookover
20shopsfromthepreviousmasterdealerRichcomin
mid-China(includingBeijingandshanghai)on1June
2013.Bang & Olufsennowownsandoperates31outof
the36storesintotalinChinaandHongKong.Thefinal
purchasepricehasnotbeenfinalisedyet,butisexpect-
edtobeinthelevelofDKK35million.
HIGHlIGHTs · KEyFIGuREs · manaGemenT reporT · STaTeMenT · FINANCIAlREVIEw · ADDITIONAlINFORmATION
DElEVOPmENTIN4THQuARTER · DIsTRIBuTIONDEVElOPmENTIN4THQuARTER · DEVElOPmENTINNumBEROFsHOPs expecTaTIonS To The 2012/13 fInancIaL year · SubSequenT evenTS
Expectations#3-u
Events#5-u

Bang & Olufsen a/s inTeriM rePOrT 4Th quarTer 2012/13 · 14
struer,16August2013
executive Management:
Tuemantoni HenningBejerBeck
President&CEO ExecutiveVicePresident&CFO
Board of Directors:
OleAndersen JimHagemannsnabe
Chairman DeputyChairman
JesperJarlbæk Andréloesekrug-Pietri
RolfEriksen AlbertoTorres
KnudOlesen JesperOlesen
PerØstergaardFrederiksen
wehavetodayconsideredandapprovedtheinterim
reportfortheperiod1June2012–31may2013for
Bang & Olufsen a/s.
TheinterimreportispresentedinaccordancewithIAs
34,InterimFinancialReporting,asendorsedbytheEu
andfurtherDanishdisclosurerequirementsforinterim
reportsforlistedcompanies.
Itisouropinionthattheinterimreportprovidesatrue
andfairviewoftheGroup’sassets,liabilitiesandfinan-
cialpositionasat31may2013andtheresultsofthe
Group’soperationsandcashflowsfortheperiod1June
2012–31may2013.
Itisalsoouropinionthatthemanagementreportgives
atrueandfairviewofdevelopmentsintheGroup’s
activitiesandfinancialsituation,theearningsforthe
periodandtheGroup’sfinancialpositioningeneralas
wellasadescriptionofthemostsignificantrisksand
uncertaintiestowhichtheGroupisexposed.
mANAGEmENT’s STaTeMenT
HIGHlIGHTs · KEyFIGuREs · mANAGEmENTREPORT · STaTemenT · FINANCIAlREVIEw · ADDITIONAlINFORmATIONstatement#4-R

Bang & Olufsen a/s inTeriM rePOrT 4Th quarTer 2012/13 · 15
CONsOlIDATEDINCOmEsTATEmENT
4th quarter YTD
(DKK million) Note 2012/13 2011/12 2012/13 2011/12
revenue 739.9 867.4 2,813.9 3,007.7Production costs (475.1) (515.0) (1,718.0) (1,792.0)gross profit 264.8 352.4 1,095.9 1,215.7Gross margin, % 35.8 40.6 38.9 40.4 Development costs 3 (94.3) (72.7) (442.4) (337.4)Distribution and marketing costs (187.6) (168.2) (755.9) (654.3)Administration costs (21.8) (30.1) (85.9) (101.6)earnings before interest and tax (eBIT) (38.8) 81.4 (188.2) 122.4 share of result after tax in associated companies 0.1 (0.1) 1.3 (2.1) Financial income 2.3 4.9 8.6 9.4Financial expenses (8.6) (9.0) (33.2) (25.5)Financial items, net (6.3) (4.1) (24.7) (16.1) earnings before tax (eBT) (45.0) 77.2 (211.6) 104.2 Income tax for the period 7.7 (22.7) 51.8 (30.9)earnings for the period (37.3) 54.5 (159.8) 73.3 Earnings attributable to: shareholders in the parent company (37.3) 54.5 (159.8) 73.3 earnings per share Earnings per share (EPs) and earnings per share fromcontinuing operations, DKK (1.0) 1.5 (4.3) 2.0Diluted earnings per share (EPs-D) and earnings per share from continuing operations, DKK (1.0) 1.5 (4.3) 2.0
HIGHlIGHTs · KEyFIGuREs · mANAGEmENTREPORT · STaTeMenT · fInancIaL revIew · ADDITIONAlINFORmATION
Income STaTemenT · sTATEmENTOFCOmPREHENsIVEINCOmE · BAlANCEsHEETs · CAsHFlOwsTATEmENT sTATEmENTOFCHANGEsINEQuITy · nOTeS · aPPenDix
Incomestatement#5-R

Bang & Olufsen a/s inTeriM rePOrT 4Th quarTer 2012/13 · 16
CONsOlIDATEDsTATEmENTOFcOMPrehenSiVe incOMe
4th quarter YTD
(DKK million) 2012/13 2011/12 2012/13 2011/12
earnings for the period (37.3) 54.5 (159.8) 73.3Exchange rate adjustment of investments in foreign subsidiaries (4.2) 0.5 (3.0) 0.0Change in fair value of derivative financial instruments used as cash flow hedges 0.9 11.4 (4.7) 25.7Transfer to the income statement of fair value adjustments of derivative financial instruments used as cash flow hedges, realised cash flows: Transfer to revenue 0.6 (2.4) (5.8) (10.8) Transfer to production costs 1.4 1.9 6.2 4.3Tax on other comprehensive income (0.7) (2.7) 1.1 (4.8)Other comprehensive income, net of tax (2.1) 8.7 (6.3) 14.4
Total comprehensive income for the period (39.4) 63.2 (166.1) 87.7 Total comprehensive income attributable to: shareholders in the parent company (39.4) 63.2 (166.1) 87.7
HIGHlIGHTs · KEyFIGuREs · mANAGEmENTREPORT · STaTeMenT · fInancIaL revIew · ADDITIONAlINFORmATION
incOMe STaTeMenT · STaTemenT of comprehenSIve Income · BAlANCEsHEETs · CAsHFlOwsTATEmENT sTATEmENTOFCHANGEsINEQuITy · nOTeS · aPPenDix
ComprehensiveIncome#7-u

Bang & Olufsen a/s inTeriM rePOrT 4Th quarTer 2012/13 · 17
CONsOlIDATEDBAlANCEsHEET
(DKK million) 31/5/13 31/5/12
Goodwill 51.9 47.8Acquired rights 20.7 27.8Completed development projects 484.7 296.8Development projects in progress 178.2 338.9Intangible assets 735.4 711.3 land and buildings 198.2 210.3Plant and machinery 155.6 145.6Other equipment 24.4 29.3leasehold improvements 30.2 17.5Tangible assets in course of construction and prepayments of tangible assets 67.5 96.8 Tangible assets 475.9 499.5 Investment property 40.0 41.3 Investments in associates 7.0 5.6Other financial receivables 43.3 46.6financial assets 50.3 52.2 Deferred tax assets 183.1 139.9
Total non-current assets 1,484.7 1,444.2 Inventories 572.1 665.0 Trade receivables 443.9 539.9Receivables from associates 1.8 2.4Corporation tax receivable 23.8 12.4Other receivables 41.7 50.4Prepayments 43.2 18.8receivables 554.4 623.9 Cash 145.9 159.1 Total current assets 1,272.4 1,448.0 Total assets 2,757.1 2,892.2
HIGHlIGHTs · KEyFIGuREs · mANAGEmENTREPORT · STaTeMenT · fInancIaL revIew · ADDITIONAlINFORmATION
incOMe STaTeMenT · sTATEmENTOFCOmPREHENsIVEINCOmE · baLance SheeTS · CAsHFlOwsTATEmENT sTATEmENTOFCHANGEsINEQuITy · nOTeS · aPPenDix
Balance#8-u

Bang & Olufsen a/s inTeriM rePOrT 4Th quarTer 2012/13 · 18
CONsOlIDATEDBAlANCEsHEET
(DKK million) 31/5/13 31/5/12
share capital 392.7 362.4Translation reserve 22.1 25.1Reserve for cash flow hedges 4.0 8.3Retained earnings 1,221.8 1,230.2Total equity 1,640.6 1,626.0 Pensions 12.4 9.8Deferred tax 13.8 15.4Provisions 57.9 86.2mortgage loans 206.1 212.9Other non-current liabilities 3.1 0.9Total non-current liabilities 293.3 325.2 mortgage loans 6.8 6.6loans from banks 150.0 150.0Overdraft facilities 56.2 37.8Provisions 39.4 54.8Trade payables 295.3 384.8Corporation tax payable 25.5 27.8Other liabilities 226.9 259.9Deferred income 23.1 19.2Total current liabilities 823.2 941.0 Total liabilities 1,116.5 1,266.2 Total equity and liabilities 2,757.1 2,892.2
HIGHlIGHTs · KEyFIGuREs · mANAGEmENTREPORT · STaTeMenT · fInancIaL revIew · ADDITIONAlINFORmATION
incOMe STaTeMenT · sTATEmENTOFCOmPREHENsIVEINCOmE · baLance SheeTS · CAsHFlOwsTATEmENT sTATEmENTOFCHANGEsINEQuITy · nOTeS · aPPenDix

Bang & Olufsen a/s inTeriM rePOrT 4Th quarTer 2012/13 · 19
CONsOlIDATEDCAsHFlOwSTaTeMenT
4th quarter YTD
(DKK million) Notes 2012/13 2011/12 2012/13 2011/12
Earnings for the period (37.3) 54.5 (159.8) 73.3Amortisation, depreciation and impairment losses 88.6 74.4 331.9 256.2Adjustments for non-cash items 4 (20.0) 53.3 (66.6) 81.6Change in receivables (4.2) (154.3) 80.5 (204.7)Change in inventories 132.5 (46.3) 92.8 (94.8)Change in trade payables etc. 20.0 119.5 (117.9) 144.5Cash flows from operations 179.6 101.1 160.9 256.1 Interest received and paid, net (6.2) (4.1) (24.7) (16.1)Income tax paid (5.1) (10.3) (9.7) (14.7)Cash flow from operating activities 168.4 86.7 126.5 225.3 Purchase of intangible non-current assets (83.9) (87.2) (263.2) (280.1)Purchase of tangible non-current assets (28.8) (48.6) (83.8) (136.8)Acquisition of activity - (12.9) - (12.9)sale of tangible non-current assets 4.0 9.6 4.8 45.6Received reimbursements, intangible non-current assets 3.2 2.6 10.9 12.1Capital increase, Bang & Olufsen medicom a/s - - - (1.7)Change in financial receivables (3.7) (0.9) 3.3 (6.5)Cash flow from investing activities (109.3) (137.4) (328.1) (380.3) free cash flow 59.1 (50.7) (201.5) (155.0) Repayment of long-term loans (2.0) (1.8) (6.6) (6.4)Proceeds from short-term borrowings (20.0) 100.0 - 150.0Capital increase - - 178.7 -Payment of debt regarding purchase of minority interest and dividend - - - (5.7)Purchase of own shares - (4.3) (1.3) (4.3)sale of own shares - - 0.5 -Cash flow from financing activities (22.0) 93.9 171.2 133.6 Change in cash and cash equivalents 37.1 43.2 (30.3) (21.4) Cash and cash equivalents, opening balance 53.8 77.4 121.3 141.4Exchange rate adjustment, cash and cash equivalents (1.3) 0.7 (1.4) 1.3Cash and cash equivalents, closing balance 89.7 121.3 89.7 121.3 Cash and cash equivalents: Cash 145.9 159.1 145.9 159.1Current overdraft facilities (56.2) (37.8) (56.2) (37.8)Cash and cash equivalents, closing balance 89.7 121.3 89.7 121.3
HIGHlIGHTs · KEyFIGuREs · mANAGEmENTREPORT · STaTeMenT · fInancIaL revIew · ADDITIONAlINFORmATION
incOMe STaTeMenT · sTATEmENTOFCOmPREHENsIVEINCOmE · BAlANCEsHEETs · caSh fLow STaTemenT sTATEmENTOFCHANGEsINEQuITy · nOTeS · aPPenDix
Cashflow#9-u

Bang & Olufsen a/s inTeriM rePOrT 4Th quarTer 2012/13 · 20
CONsOlIDATEDsTATEmENTOF CHANGEsINEQuITy
31/05 31/05 (DKK million) 2013 2012
equity, opening balance 1,626.0 1,538.3Earnings for the period (159.8) 73.3Other comprehensive income, net of tax (6.3) 14.4Comprehensive income for the period (166.1) 87.7 Capital increase *) 178.7 -Employee shares - 1.2Purchase of minority interest and distributed dividend - (2.9)Grant of share options 2.8 6.0Purchase of own shares (1.3) (4.3)sale of own shares 0.5 -equity, closing balance 1,640.6 1,626.0
*)AllnewshareshavebeensubscribedforbysparkleRollHoldingslimitedandACapitalBravoHoldings.à.r.l.atamarketpriceofDKK60.22pershareofDKK10.
HIGHlIGHTs · KEyFIGuREs · mANAGEmENTREPORT · STaTeMenT · fInancIaL revIew · ADDITIONAlINFORmATION
incOMe STaTeMenT · sTATEmENTOFCOmPREHENsIVEINCOmE · BAlANCEsHEETs · CAsHFlOwsTATEmENT STaTemenT of chanGeS In equITy · nOTeS · aPPenDix
Changesinequity#10-u

Bang & Olufsen a/s inTeriM rePOrT 4Th quarTer 2012/13 · 21
nOTeS
1 ACCOuNTINGPRINCIPlEs
The interim report for Bang & Olufsen a/s is prepared as a condensed set of financial statements in accordance with IAs 34 ‘Interim Financial Reporting’, as endorsed by the European union and further Danish disclosure requirements for in-terim reports for listed companies. The interim report has not been audited or reviewed by the company’s external audi-tors. An interim report for the parent company has not been prepared. The interim report is stated in Danish krone (DKK) which is the functional currency of the parent company.
The Annual Report 2012/13 contains a full description of applied accounting principles.
2 sIGNIFICANTEsTImATEsANDAssEssmENTsBymANAGEmENT
The preparation of interim reports requires that management makes estimates and assessments which affect the applica-tion of accounting principles and recognised assets, liabilities, income and expenses. Actual results may deviate from these estimates.
The material estimates that management makes when applying the accounting principles of the group, and the mate-rial uncertainty connected with these estimates and assessments are unchanged in the preparation of the interim report compared to the preparation of the Annual Report as at 31 may 2013.
3 DEVElOPmENTCOsTs
4th quarter YTD
(DKK million) 2012/13 2011/12 2012/13 2011/12
Incurred development costs before capitalisation 111.2 120.2 475.8 471.5Hereof capitalised (76.6) (87.0) (250.8) (279.9)Incurred development costs after capitalisation 34.6 33.2 225.0 191.6 Capitalisation (%) 68.9 72.4 52.7 59.4Total amortisation charges and impairment losses on development projects 59.6 39.5 217.4 145.8Development costs recognised in the consolidated income statement 94.3 72.7 442.4 337.4
HIGHlIGHTs · KEyFIGuREs · mANAGEmENTREPORT · STaTeMenT · fInancIaL revIew · ADDITIONAlINFORmATION
incOMe STaTeMenT · sTATEmENTOFCOmPREHENsIVEINCOmE · BAlANCEsHEETs · CAsHFlOwsTATEmENT sTATEmENTOFCHANGEsINEQuITy · noTeS · aPPenDix
Notes#11-u

Bang & Olufsen a/s inTeriM rePOrT 4Th quarTer 2012/13 · 22
nOTeS
4 ADJusTmENTsFORNON-CAsHITEmsIN THECAsHFlOwsTATEmENT
4th quarter YTD
(DKK million) 2012/13 2011/12 2012/13 2011/12
Change in other liabilities (21.6) 2.2 (39.0) 3.9Financial items, net 6.3 4.1 24.7 16.1share of result after tax in associated companies (1.4) (1.9) (2.6) 0.1Gain/loss on sale of non-current assets (1.0) (1.2) (1.2) (8.2)Tax on earnings for the period (7.6) 22.7 (51.8) 30.9Various adjustments 5.3 27.4 3.2 38.8adjustment for non-cash items (20.0) 53.3 (66.6) 81.6
5 sEGmENTINFORmATION
4th quarter YTD Change, %
(DKK million) 2012/13 2011/12 2012/13 2011/12 yTD
revenue by segment and business area
Consumer business (B2C): AV 469.7 504.9 1,648.9 2,043.1 (19)B&O PlAy 112.5 182.6 532.3 377.6 41Total consumer business (B2C) 582.2 687.5 2,181.2 2,420.7 (10) Business to business (B2B): Automotive 140.3 120.0 545.7 454.0 20ICEpower 19.1 38.4 86.8 115.4 (25)Total business to business (B2B) 159.4 158.4 632.5 569.4 11 Elimination of internal revenue (2.8) (10.2) (11.4) (22.1) -Exchange rate adjustments 1,1 31.7 11.6 39.7 -revenue, group 739.9 867.4 2,813.9 3,007.7 (6)
gross margin by business area, %
Consumer business (B2C): AV 35.5 44.7 41.7 43.1B&O PlAy 31.4 25.5 29.6 27.7 Business to business (B2B): Automotive 36.9 32.4 36.4 36.6ICEpower 56.2 49.9 53.9 48.3gross margin %, group 35.8 40.6 38.9 40.4
HIGHlIGHTs · KEyFIGuREs · mANAGEmENTREPORT · STaTeMenT · fInancIaL revIew · ADDITIONAlINFORmATION
incOMe STaTeMenT · sTATEmENTOFCOmPREHENsIVEINCOmE · BAlANCEsHEETs · CAsHFlOwsTATEmENT sTATEmENTOFCHANGEsINEQuITy · noTeS · aPPenDix

Bang & Olufsen a/s inTeriM rePOrT 4Th quarTer 2012/13 · 23
nOTeS
5 sEGmENTINFORmATION(CONTINuED)
4th quarter YTD Change, %
(DKK million) 2012/13 2011/12 2012/13 2011/12 yTD
revenue by region
Consumer business (B2C)Bang & Olufsen distribution: Europe 379.2 538.3 1,404.7 1,738.6 (19)North America 49.3 14.8 180.4 140.1 29BRIC 74.7 61.6 296.5 255.3 16Rest of world 64.0 52.4 240.6 239.0 1Total Bang & Olufsen distribution 567.2 667.1 2,122.2 2,373.0 (11) 3rd party distribution and e-commerce: B&O PlAy 15.0 20.4 59.0 47.7 24Total 3rd party distribution and e-commerce 15.0 20.4 59.0 47.7 24
Total consumer business (B2C) 582.2 687.5 2,181.2 2,420.7 (10)
Business to business (B2B) Automotive 140.3 120.0 545.7 454.0 20ICEpower 19.1 38.4 86.8 115.4 (25)Total business to business (B2B) 159.4 158.4 632.5 569.4 11 Elimination of internal revenue (2.8) (10.2) (11.4) (22.1) -Exchange rate adjustments 1.1 31.7 11.6 39.7 -revenue, group 739.9 867.4 2,813.9 3,007.7 (6)
HIGHlIGHTs · KEyFIGuREs · mANAGEmENTREPORT · STaTeMenT · fInancIaL revIew · ADDITIONAlINFORmATION
incOMe STaTeMenT · sTATEmENTOFCOmPREHENsIVEINCOmE · BAlANCEsHEETs · CAsHFlOwsTATEmENT sTATEmENTOFCHANGEsINEQuITy · noTeS · aPPenDix

Bang & Olufsen a/s inTeriM rePOrT 4Th quarTer 2012/13 · 24
6 sHOPsByREGION–BANG & OluFsENDIsTRIBuTION (B1ANDsHOP-IN-sHOP)
Number (units) share of revenue (%)
31.05.2013 28.02.2013 30.11.2012 31.08.2012 31.05.2012 yTD 2012/13 yTD 2011/12 Europe1 601 627 644 651 680 66.2% 73.2%North America2 55 52 52 50 53 8.5% 5.9%Bric3 74 74 75 78 80 14.0% 10.8%Rest of world4 86 87 88 91 105 11.3% 10.1% 816 840 859 870 918 100% 100%
1 Shop-in-shop; 199 (28.02.2013; 208)
2 Shop-in-shop; 4 (28.02.2013; 2)
3 Shop-in-shop; 1 (28.02.2013; 1)
4 Shop-in-shop; 1 (28.02.2013; 1)
nOTeS
HIGHlIGHTs · KEyFIGuREs · mANAGEmENTREPORT · STaTeMenT · fInancIaL revIew · ADDITIONAlINFORmATION
incOMe STaTeMenT · sTATEmENTOFCOmPREHENsIVEINCOmE · BAlANCEsHEETs · CAsHFlOwsTATEmENT sTATEmENTOFCHANGEsINEQuITy · noTeS · aPPenDix

Bang & Olufsen a/s inTeriM rePOrT 4Th quarTer 2012/13 · 25
aPPenDix 1
earnings by quarter 2012/13:
2012/13
(DKK million) Q1 Q2 Q3 Q4 revenue 600.4 819.0 654.6 739.9 gross profit 245.0 357.8 228.3 264.8 earnings before interest and tax (eBIT) (61.3) 26.2 (114.3) (38.8)share of result after tax in associated companies - 0.6 0.6 0.1Financial items, net (2.9) (3.9) (11.6) (6.2)earnings before tax (eBT) (64.2) 22.9 (125.3) (45.0)Income tax for the period 17.0 (7.5) 34.6 7.7earnings after tax for the period (47.2) 15.4 (90.7) (37.3)
accumulated earnings by quarter 2012/13:
2012/13
(DKK million) Q1 Q2 Q3 Q4 revenue 600.4 1,419.4 2,074.0 2,813.9 gross profit 245.0 602.8 831.1 1,095.9 earnings before interest and tax (eBIT) (61.3) (35.1) (149.4) (188.2)share of result after tax in associated companies - 0.6 1.2 1.3Financial items, net (2.9) (6.8) (18.4) (24.7)earnings before tax (eBT) (64.2) (41.3) (166.6) (211.6)Income tax for the period 17.0 9.5 44.1 51.8earnings after tax for the period (47.2) (31.8) (122.5) (159.8)
HIGHlIGHTs · KEyFIGuREs · mANAGEmENTREPORT · STaTeMenT · fInancIaL revIew · ADDITIONAlINFORmATION
incOMe STaTeMenT · sTATEmENTOFCOmPREHENsIVEINCOmE · BAlANCEsHEETs · CAsHFlOwsTATEmENT sTATEmENTOFCHANGEsINEQuITy · nOTeS · appenDIx
Appendix#12-u

Bang & Olufsen a/s inTeriM rePOrT 4Th quarTer 2012/13 · 26
aPPenDix 1
earnings by quarter 2011/12:
2011/12
(DKK million) Q1 Q2 Q3 Q4 revenue 598.6 775.5 766.3 867.4 gross profit 231.0 339.3 293.3 352.4 earnings before interest and tax (eBIT) (28.5) 46.8 22.7 81.4share of result after tax in associated companies (0.9) (0.9) (0.2) (0.1)Financial items, net (3.2) (5.1) (3.7) (4.1)earnings before tax (eBT) (32.6) 40.8 18.8 77.2Income tax for the period 5.6 (12.0) (1.8) (22.7)earnings after tax for the period (27.0) 28.8 17.0 54.5
accumulated earnings by quarter 2011/12:
2011/12
(DKK million) Q1 Q2 Q3 Q4 revenue 598.6 1,374.1 2,140.3 3,007.7 gross profit 231.0 570.3 863.3 1,215.7 earnings before interest and tax (eBIT) (28.5) 18.3 41.0 122.4share of result after tax in associated companies (0.9) (1.8) (2.0) (2.1)Financial items, net (3.2) (8.3) (12.0) (16.1)earnings before tax (eBT) (32.6) 8.2 27.0 104.2Income tax for the period 5.6 (6.4) (8.2) (30.9)earnings after tax for the period (27.0) 1.8 18.8 73.3
HIGHlIGHTs · KEyFIGuREs · mANAGEmENTREPORT · STaTeMenT · fInancIaL revIew · ADDITIONAlINFORmATION
incOMe STaTeMenT · sTATEmENTOFCOmPREHENsIVEINCOmE · BAlANCEsHEETs · CAsHFlOwsTATEmENT sTATEmENTOFCHANGEsINEQuITy · nOTeS · appenDIx

Bang & Olufsen a/s inTeriM rePOrT 4Th quarTer 2012/13 · 27
ADDITIONAlINFORmATION
for further information please contact:
CEO,Tuemantoni,tel.:+4596845000
Presscontact,mortenJuhlmadsen,tel.:+4540308986
Investors,ClausHøjmarkJensen,tel.:+4523251067
financial calendar
Thursday19september2013 AnnualGeneralmeeting2012/13
wednesday2October2013 Interimreport(1stquarter2013/14)
wednesday16January2014 Interimreport(2ndquarter2013/14)
wednesday11April2014 Interimreport(3rdquarter2013/14)
wednesday13August2014 AnnualReport2013/14
Thursday11september2014 AnnualGeneralmeeting2013/14
wednesday2October2014 Interimreport(1stquarter2014/15)
safe harbour statement
Thereportcontainsstatementsrelatingtoexpectationsforfuturedevelopments,includingfuturerevenueand
earnings,aswellasexpectedbusiness-relatedevents.suchstatementsareuncertainandcarryanelementofrisk
sincemanyfactors,ofwhichsomearebeyondBang & Olufsen’scontrol,canmeanthatactualdevelopmentswill
deviatesignificantlyfromtheexpectationsexpressedinthereport.withoutbeingexhaustive,suchfactorsinclude
amongothersgeneraleconomicandcommercialfactors,includingmarketandcompetitivematters,supplieris-
suesandfinancialissuesintheformofforeignexchange,interestrates,creditandliquidityrisks.
applicable version
TheinterimreporthasbeentranslatedfromDanish.IncaseofdoubttheDanishversionshallapplyatalltimes.
about Bang & Olufsen
Bang & Olufsenwasfoundedinstruer,Denmark,in1925byPeterBangandsvendOlufsen,twoinnovative,young
engineersdevotedtohighqualityaudioreproduction.sincethen,thebrandhasbecomeaniconofperformance
anddesignexcellencethroughitslong-standingcraftsmanshiptraditionandthestrongestpossiblecommitment
tohigh-techresearchanddevelopment.stillattheforefrontofdomestictechnology,Bang & Olufsenhasextended
itscomprehensiveexperiencewithintegratedaudioandvideosolutionsforthehometootherareassuchasthe
hospitalityandautomotiveindustriesinrecentyears.Consequently,itscurrentproductrangeepitomisesseamless
mediaexperiencesinthehomeaswellasinthecarandonthemove.
for additional information refer to www.bang-olufsen.com.
HIGHlIGHTs · KEyFIGuREs · mANAGEmENTREPORT · STaTeMenT · FINANCIAlREVIEw · aDDITIonaL InformaTIonInformation#6-R