interim management statement january march 2019 · the assignment of future rights linked to a...
TRANSCRIPT

INTERIM MANAGEMENT STATEMENT JANUARY – MARCH 2019

4
RESULTS JANUARY | MARCH 2019
TABLE OF CONTENTS
TELEFÓNICA
Consolidated Results 5
Digitalisation and Monetisation 9
Telxius 11
RESULTS BY BUSINESS UNITS
Telefónica España 19
Telefónica Deutschland 23
Telefónica UK 25
Telefónica Brasil 27
Telefónica Hispam Sur 29
Argentina, Chile, Perú
Telefónica Hispam Norte 37
Colombia, México
ADDENDA
Key Holdings of the Telefónica Group 43
Changes to the Perimeter 44
Alternative performance measures 45
The financial information related to January-March 2019 contained in this document has been prepared under International Financial
Reporting Standards (IFRS), as adopted by the European Union, which do not differ for the purposes of the Telefónica Group, from
IFRS as issued by the International Accounting Standards Board (IASB). Telefonica Group applies hyper-inflation accounting to its
companies whose functional currency is the Argentine peso for financial information of periods ended after July 1, 2018. The
information presented in prior results to July 1, 2018 have not been restated.
Telefónica’s management model, regional and integrated, means that the legal structure of the companies is not relevant for the
release of Group financial information, and therefore, the operating results of each of these business units are presented
independently, regardless of their legal structure. For the purpose of presenting information on a business unit basis, revenue and
expenses arising from invoicing among companies within Telefónica’s perimeter of consolidation for the use of the brand and
management contracts have been excluded from the operating results for each business unit. This breakdown of the results does not
affect Telefónica’s consolidated earnings.
The English language translation of the consolidated financial statements originally issued in Spanish has been prepared solely for the
convenience of English speaking readers. Despite all the efforts devoted to this translation, certain omissions or approximations may
subsist. Telefónica, its representatives and employees decline all responsibility in this regard. In the event of a discrepancy, the
Spanish-language version prevails.

5
RESULTS JANUARY | MARCH 2019
01
CONSOLIDATED RESULTS
First quarter results were affected by the exit of T. Guatemala from the perimeter of consolidation since 1 January 2019,
followed by Antares, since 1 February 2019, detracting 0.4 p.p. from the y-o-y growth in revenues and 0.3 p.p. in OIBDA,
and reducing total accesses by 2.8m (2.4m mobile prepay).
Telefónica Group's access base stood at 352.4m at March 2019, stable y-o-y excluding changes in the perimeter. The
average revenue per customer accelerated in the quarter to +4.2% y-o-y in organic terms (+3.8% in the previous quarter)
while churn remained stable thanks to the strategic focus on high-value customers, which continued posting solid
growth.
Commercial highlights included: i) LTE accesses, totalling 121.5m (+18% y-o-y), with net additions in the quarter of 4.1m
and a penetration of 49% (+9 p.p. y-o-y); ii) mobile contract accesses (124.8m; +6% y-o-y), with net additions in the
quarter of 1.1m, already accounting for 47% of the total (+3 p.p. y-o-y); iii) smartphones (+3% y-o-y; 166.2m), reached
a penetration of 68% (+4 p.p. y-o-y); iv) FTTx/Cable (13.6m; +18% y-o-y) reported quarterly net additions of 368k,
accounting for 63% of total fixed broadband (+9 p.p. y-o-y) with a coverage of 51.8m premises passed with proprietary
network (+13% y-o-y); and v) Pay TV (8.8m; +3% y-o-y).
Reported variations of the consolidated financial statements for the first quarter 2019 reflected the adoption of IFRS 16
since 1 January 2019 (the statements for January-March 2018 were reported according to IAS 17). The organic variation
excluded the impact of the accounting change to IFRS 16 in the first quarter 2019 (+€414m in OIBDA, -€384 in
depreciation and amortisation, -€53m in net financial expenses and -€17m in profit attributable to ordinary equity
holders of the parent company). The Consolidated Statement of Financial Position at 31 March 2019 included lease
liabilities, including those held for sale, of €7,439m.
On the other hand, exchange rate evolution negatively affected the Company's reported results mainly due to the
depreciation of the Brazilian real and the Argentine peso against the euro. Foreign currencies reduced y-o-y revenues
by 4.9 p.p. and OIBDA by 4.7 p.p. in the first quarter. However, the negative impact of the depreciation of currencies at
the OIBDA level (-€180m in January-March) decreased significantly in terms of cash flow generation (-€74m).
Additionally, the Group has applied hyperinflation accounting to its companies whose functional currency is the
Argentine peso for periods ending 1 July 2018. The inflation adjustment negatively impacted the consolidated results of
the Telefónica Group in January-March (-€34m in revenues, -€22m in OIBDA, -€68m in OI and -€6m in CapEx).
Revenues (€11,979m in January-March) decreased 1.7% y-o-y in the quarter due to the currency depreciation effect
aforementioned. In organic terms, however, revenues accelerated their y-o-y growth trend by 0.8 p.p. vs. the previous
quarter to +3.8%, on the back of a significant improvement in service revenues (+2.6%; +1.3 p.p. vs. the previous
quarter). Handset sales continued posting a strong growth (+15.6%; +18.5% in Q4 18).
Excluding the negative impact from regulation (-0.8 p.p. in the quarter) organic revenue growth would have accelerated
to +4.6% y-o-y (+3.9% in the previous quarter).
The Company further advanced in the transformation process of its revenues, focused on data monetization and digital
services, with revenues from broadband connectivity together with services beyond connectivity achieving 56% over
total revenues in the first quarter (+3 p.p. y-o-y). The weight of handset sales increased to 11% (+1 p.p. y-o-y) while
voice and access decreased by 4 p.p. to represent below a third of total revenues.
Operating expenses (€8,114m in January-March) decreased in the quarter by 4.9% y-o-y, affected by the application of
the new standard IFRS 16 and FX evolution.

6
RESULTS JANUARY | MARCH 2019
In the first quarter, provisions for restructuring costs amounted to €47m (€23m in T. España, €23m in T. Deutschland
and €1m in Other Companies), which affected personnel expenses (€1m) and other net income/expense by (€46m). In
January-March 2018 this item amounted to €18m.
In organic terms, operating expenses increased by 5.4% y-o-y in the first quarter, accelerating their growth by 1.1 p.p.
vs. the previous quarter, mainly because of increased personnel expenses and higher network and system costs.
Supplies grew by 7.3% y-o-y due to strong high-value handset consumption, higher content costs and more expenses
associated with increased IT business, despite interconnection savings. Other operating expenses increased (+3.7%
compared with January-March 2018) after recording higher network and system costs as well as customer management.
Personnel expenses increased by 5.4% y-o-y in the quarter, mainly affected by salary updates in Argentina, despite the
savings generated in Spain, Germany and Brazil from headcount restructuring programmes.
The average staff at January-March 2019 stood at 119,111 employees (-3.0% y-o-y).
Other net income (expense) totalled €72m in the quarter (€5m in January-March 2018), affected by capital gains from
the assignment of future rights linked to a portfolio of claims in Spain (+€103m) and the aforementioned restructuring
expenses (-€46m). In organic terms, this income declined by 22.2% y-o-y in the quarter.
Gains on sale of fixed assets in the first quarter amounted to €118m (€12m in the same period of 2018), highlighting
the impact on OIBDA of net capital gains from the sale of companies (€86m, mainly Antares) and assets in T. Colombia
(€12m).
Operating income before depreciation and amortisation (OIBDA) (€4,264m in January-March) increased by 10.3% y-o-
y in the quarter, positively affected by the impact of the new international IFRS 16, despite the negative impact of FX.
In organic terms, OIBDA increased by 1.0% y-o-y in the quarter, despite higher operating expenses, thanks to revenue
growth acceleration and savings from digitalisation and simplification, among other cost containment efforts. Excluding
the impact from regulation (-0.6 p.p. in the quarter), OIBDA would have increased by 1.7% y-o-y in organic terms.
Underlying OIBDA stood at €3,730m in the quarter (-3.9% y-o-y) and excluded the impact from IFRS 16 adoption
(+€414m), capital gains from the assignment of future rights linked to a portfolio of claims in Spain (+€103m), net capital
gains from the sale of companies (€86m), restructuring costs (-€47m) and the hyperinflation adjustment in Argentina
(-€22m).
OIBDA margin stood at 35.6% in the quarter, expanding 3.9 p.p. y-o-y (-0.9 p.p. in organic terms).
Depreciation and amortisation stood at €2,614m in the quarter, increasing by 17.4% y-o-y, affected by the impact from
IFRS 16 adoption aforementioned. In organic terms, it increased 1.9% y-o-y, primarily due to higher amortisation in
T. Brasil (increase of assets associated with the acceleration of the fibre project) and in T. Deutschland (mobile network
consolidation).
Operating income (OI) thus reached €1,650m in the quarter and increased by 0.7% y-o-y. In organic terms, it remained
virtually stable (-0.1% y-o-y).
Net financial expenses in the quarter (€411m) increased by 7.7% vs. the same period of the previous year, affected by
the adoption of IFRS 16 (-6.3% excluding this effect).
Corporate income tax in the first quarter amounted to €234m, -34.8% vs. January-March 2018 mainly due to higher
interest on own capital (“juros sobre capital propio”) in Brazil and other effects.
Profit attributable to non-controlling interests in the quarter (€83m) increased by 30.8% y-o-y, mainly due to higher
results attributed to minority interests in T.Brasil, T. Centroamérica and Telxius.
Thus, the profit attributable to ordinary equity holders of the parent company in the first quarter reached €926m, with
a 10.6% y-o-y increase.
7
RESULTS JANUARY | MARCH 2019
In underlying terms, net income amounted to €971m in January-March (+1.1% y-o-y), after excluding impacts for a net
amount of -€46m:
- in negative: i) depreciation and amortisation charges arising from purchase price allocation processes (-€100m), ii)
impact of the hyperinflation adjustment in Argentina (-€60m), iii) adoption of IFRS 16 (-€17m) and iv) restructuring
costs (-€34m).
- in positive: i) net capital gains from the sale of companies (+€88m) and ii) capital gains from the assignment of
future rights linked to a portfolio of claims in Spain (+€77m)
Basic earnings per share amounted to €0.16 in the quarter and increased by 33.8% y-o-y reflecting lower expenses
associated with hybrid bonds repurchase offers and coupon savings. Underlying EPS totalled €0.18 in January-March
(+2.6% y-o-y).
CapEx reached €1,554m in January-March (+4.3% y-o-y) and included €18m from the spectrum in T. Centroamérica. In
organic terms, CapEx increased by 11.2%, affected by different calendar of execution, and continued to focus on
accelerating excellent connectivity (deployment of UBB networks, increased network capacity and virtualisation) and
improving quality and customer experience (implementation of AI in the Company's technology platforms).
Operating cash flow (OIBDA-CapEx) totalled €2,710m in January-March, increasing by 14.2% y-o-y (-5.3% organic,
affected by a different calendar of CapEx execution).
Interest payments in the quarter (€673m) decreased by 3.6% y-o-y. Excluding the impact from IFRS 16 adoption, interest
payments would have fallen by 9.0%, mainly due to debt reduction, placing the effective cost of interest payments over
the last 12 months at 3.39% as of March 2019 (3.57% as of March 2018).
As a result of the extraordinary €702m tax refund in Spain, tax payments amounted to a positive €676m. Excluding this
effect, tax payments would be aligned with the reported figure for the same period of 2018.
Working capital consumed €711m in January-March 2019, mainly affected by CapEx seasonality and tax and content
prepayments, though partially offset by the application of Brazilian court rulings, with a noteworthy execution of
factoring measures on accounts receivable and the extension of payment terms with suppliers or the factoring firm
where those had been discounted. This resulted in an improvement of €229m vs. January-March 2018, mainly due to
the aforementioned Brazilian court rulings and the impact from IFRS 16 adoption.
Operations with minority shareholders totalled €0m in the first quarter of 2019 vs. the €168m reported in the same
period of 2018, which reflected the payment of an extraordinary dividend to Telxius shareholders (€166m).
Thus, free cash flow excluding the principal payments of lease liabilities reached €1,908m in January-March 2019.
However, when including these payments (-€500m), free cash flow totalled €1,408m in January-March 2019, increasing
by 2.6x y-o-y.
Net financial debt at March 2019 (€40,381m) decreased by €693m vs. December 2018 thanks to free cash flow
generation (€1,408m) and net financial divestments mainly from the sale of Antares and T. Guatemala (€139m). In
contrast, the factors that increased debt were: i) shareholder remuneration (€46m, including the replacement of capital
instruments and coupon payments), and ii) labour-related commitments (€239m) and other factors for a net amount of
€570m (extension of payment terms with suppliers or the factoring firm, higher value in euros of net debt in foreign
currencies and partial compensations from favourable Brazilian court rulings in 2018).
Including post-closing events, subject to the closing of the sale of the transactions, net financial debt would decrease
further by approximately €1.7bn.
On the other hand, following the adoption of IFRS 16, lease liabilities, including those held for sale, amounted to
7,439M€. Net financial debt including lease liabilities amounted to €47,820m.

8
RESULTS JANUARY | MARCH 2019
In January-March 2019, the financing activity of Telefónica amounted to approximately €4,437m equivalent (without
considering the refinancing of commercial paper and short-term bank loans) and focused on maintaining a solid liquidity
position and refinancing and extending debt maturities (in an environment of low interest rates). Therefore, as of the
end of March, the Group hedged the debt maturity for the next two years. The average debt life stood at 10.2 years (vs.
9.0 years in December 2018).
The main financing operations of the quarter included:
- In January, Telefónica Emisiones, S.A.U. concluded its first green bond issuance, the first of the global
telecommunications sector, obtained an amount of €1,000m maturing in February 2024 and with an annual coupon
of 1.069%.
- In March, Telefónica Emisiones, S.A.U., closed a USD bond issue for 1,250m USD at 30 years with a coupon of
5.520%.
- In March, Telefónica Europe, B.V. launched two transactions simultaneously. The first, the issue of deeply
subordinated fixed rate reset securities guaranteed on a subordinated basis by Telefónica S.A. for a total amount
of €1,300m and callable after 6 years from the issue date. The second, a tender offer for the purchase of existing
hybrid references in euros, with a repurchase of €935m nominal amount, which, along the liability management
exercise of March 2018, has led to extending the average years to call from 3.2 to 4.9, and reducing the average
coupon paid by 102 basis points, from 5.16% to 4.14%.
- In March, Telefónica Emisiones, S.A.U., closed a senior debt issuance of €1,000m (maturing in March 2029 with an
annual coupon of 1.788%).
After closing, Telefónica del Perú closed an issuance on the international market for 1,700m Peruvian soles with a
maturity in April 2017 and annual coupon of 7.375%.
On the other hand, Telefónica Deutschland Holding issued debt instruments in the local market maturing up to 10 years
and a volume of €360m.
Throughout the quarter, Telefónica Group obtained funding by means of extending payment terms with suppliers or
the factoring firm where those had been discounted, for a total of €207m equivalent (€120m equivalent in January-
March 2018).
Additionally, Telefónica, S.A. and its holding companies continued their issuance activity under the Promissory Notes
and Commercial Paper Programmes (Domestic and European), maintaining an outstanding notional balance of
approximately €1,707m at the end of March.
At the end of March, Telefónica maintained undrawn, committed credit lines with different credit institutions for an
approximate amount of €12,651m (€12,193m with maturity at over twelve months) which, combined with the cash
equivalents position and current financial assets, placed liquidity at €23,980m.
Definitions:
Organic growth: Assumes average constant foreign exchange rates of 2018, except for Venezuela (2018 and 2019 results converted at the closing synthetic
exchange rate for each period) and excludes the hyperinflation adjustment in Argentina. Considers a constant perimeter of consolidation. Excludes the effect
of the accounting change to IFRS 16, write-downs, capital gains/losses from the sale of companies, restructuring costs and material non-recurring impacts.
CapEx excludes spectrum investments.
Underlying growth: Reported figures excluding the effect of the accounting change to IFRS 16, write-downs, capital gains/losses from the sale of companies,
restructuring costs, material non-recurring impacts and depreciation and amortisation charges from purchase price allocation processes. Excludes the
hyperinflation adjustment in Argentina.

9
RESULTS JANUARY | MARCH 2019
Digitalisation and Monetisation
(y-o-y changes in organic terms)
The key to being relevant entails excellent connectivity based on network transformation, simplification and the
application of Artificial Intelligence to the Company's technology platforms.
→ The industrialisation of the fibre deployment and connection process is a clear competitive advantage in both
Spain and Latin America (Brazil, Chile, Argentina, Peru and Ecuador) due to the shorter installation times (-41%
for customer equipment in Spain), deployment cost (-50% in the past five years in Spain) and maintenance cost
(50% lower failures rate than copper in Spain and Brazil).
The exponential technology evolution that fibre supports during its long lifetime has already begun. Thus, the
proprietary development of the new generation of fibre (“XGS-PON”), which will boost speed by up to 10 Gbps
(symmetrical) and the interoperability of customer equipment and fibre equipment will enable the initiation of
smaller-scale commercial deployments throughout Spain and Brazil in 2019.
Meanwhile, the new fibre access network architecture (“Open Access”) brings higher control and flexibility to
introduce and manage virtual network services and functions.
On the other hand, the migration from copper accesses to VoIP is making progress, reaching 35% of voice lines
and 59% in broadband lines which allows for a reduction in network equipment and operational savings (space,
energy and maintenance).
The Group's FTTx/cable coverage reached 84.9m premises passed (51.8m in own network; +13% y-o-y; 21.8m
FTTH in Spain, 20.0m in Brazil and 10.0m FTTx/cable in Hispam (+34% y-o-y)); and connected retail fibre accesses
grew to 13.6m (+18% y-o-y). These ultrafast broadband accesses account for 63% of fixed broadband base (+9
p.p. y-o-y). In Spain, there are also 1.7m wholesale fibre accesses (x2 y-o-y) fostered by agreements with the
main market operators.
→ In LTE coverage reached 78% (+5 p.p. y-o-y; 95% in Europe and 72% in Latin America) and traffic accounted for
71% of the total. This deployment is increasingly more efficient due to greater spectral efficiency in 4G (x2.4 vs.
3G) and to the spectrum released in 2G and dedicated to 4G (56% in 2019 vs. 40% in 2016). This effect will
increase as the use of VoLTE increases (7% of the total voice traffic) and 3G traffic slows its growth.
5G technology, which will provide new network capabilities, applicable primarily in the corporate segment is
already being tested, mainly:
- In Spain, where the Technological Cities 5G Project is validating equipment technology in a real working
environment (Talavera and Segovia).
- In Germany, with a pilot with Samsung on wireless technology (26 GHz) and in the United Kingdom with
4.9G pilot at the “O2 Arena”.
- With progresses in 4.5G and “Massive MIMO”, use of “OpenRAN” for greater control over the value chain
(HW and SW), and capacity testing for “Open Source MANO” in the orchestration of “Network Slices”
(different service characteristics) on a single infrastructure.
→ The transformation of the core data network (IP network), combining its architecture and bringing network
intelligence close to customers, reached 35% and entails a lower need for investment to sustain the same traffic
level (-40% compared to older IP technology). The transformation of fibre-optic networks for transporting IP traffic
is now approximately at 25%.
→ Unified customer premise fixed equipment stood at 32m (5.2m HGUs, fibre terminal and router).

10
RESULTS JANUARY | MARCH 2019
→ The UNICA virtualisation programme which brings infrastructure closer to customers for increased functionality
and automation, is being implemented in 10 countries and under development in new operations.
At the end of March 66% of the processes have been already digitalised and managed in real time (+4 p.p. y-o-y) and
30% of the total customer base has migrated to "Full Stack" systems (+ 6 p.p. y-o-y).
The E2E Digital Transformation Programme which pursues a growing number of digital customers with improved
experience and stickiness to Telefónica, resulted in the quarter in the achievement of approximately 20% of the 2019
target for savings (>€340m. additional to >€300m captured in 2018). The main cornerstones are:
→ Digital experience improvement in sales process
- Boosting proprietary channels, Digital Marketing and automation, personalisation, contextualisation of the
offer through Advanced Analytics.
- Boosting digital top-ups and self-management.
- This resulted in a 12% increase in commercial operations carried out in digital channels vs. Dec-18.
→ Digitalisation of customer service channels
- Deployment of Cognitive platforms at Contact Centres, already in Brazil and Peru with significant traffic and
elevated levels of understanding and resolution of queries, and processes optimisation with Advanced Analytics
and digital service channels (“chatbots”). This translated in a 11% reduction of the number of calls handled at
the call centres vs Q1 18.
- Boosting digital channels and their use for bills and payments.
- Transformation of the supply chain with “Blockchain” to ensure E2E visibility of customer equipment.
→ Process automation
- For all commercial and technical support processes through robotisation with a positive impact on quality and
cost efficiency.
- Robot development centres (“Robot Factories”) launched in Brazil, Spain, Germany and most of
Hispanoamerica's operators.
This digital transformation programme is backed by the Agile Mindset methodology to accelerate transformation by
prioritising and continuously evaluating projects.
Regarding the offering for the consumer segment, focused on developing customer value the following actions were to
note in the quarter: enhancement in mobile contract in Germany and Mexico, integration of roaming and data transfer
option in Argentina, Chile and Colombia, the new convergent offer in Peru and the launch of “Movistar Play” in Mexico
and Argentina, concluding the integration of this exclusive video service in all the Spanish-speaking countries.
In Spain, the ”Movistar Cloud” and “Smart Wifi” apps launched at the end of 2018 within the “More for More” strategy
in “Fusión” portfolio fostered customer digital relationships, the activation of digital services, additional mobile lines
and the connection of new household devices.
The integrated offer with handset is focused on high value customers, with subsidy reduction, financing offers, higher
focus on medium-high range devices as well as on handset’s renewal for these customers, sustaining a continuous
revenue growth and ARPU and churn improvement.
In the business segment, global capacities (growing virtualised networks, 25 data centres, 12 security centres, 14k
agents) set the basis of a “Core Digital” offer (communications, cloud, security) configurable with the integration of a
large ecosystem of proprietary and third-party digital solutions. Business revenues (€2,368m) grew by 5.9% vs. Q1 18

11
RESULTS JANUARY | MARCH 2019
driven by higher revenues from Corporate (€1,338m; +9.6%) and SMEs (€1,030m, +1.7%) and particularly by revenues
from digital services (€495m; +34% y-o-y), mainly Cloud, IoT and Security. By regions, the main countries in Europe
(€1,282m, +2,8%) and Latin America (€1,086m, +9.3%) increased their revenues.
Digital Services Revenues amounted to €1,875m in January-March (+21.2% y-o-y):
i) Video revenues (40% of digital service revenues) reached €745m and accelerated its growth (+4.3% y-o-y), mainly
due to wholesale revenues in Spain. Following the cited launch of “Movistar Play” in Argentina and Mexico, the
Video access base rose to 9.8m (8.8m in Pay TV, +16% y-o-y in IPTV, and 0.9m active accesses of the OTT service
“Movistar Play” in Latin America).
ii) Advanced Digital Services, mainly oriented to the corporate segment, reported strong growth (+39.5% y-o-y) and
reached €397m, being noteworthy in the quarter:
- Cloud (€166m; +30.4% y-o-y), with the development of a marketplace with “Cloud Blue” (leader in cloud
solution platforms) for IT solutions such as Office 365 (737k licences).
- IoT (€118m; +62.0% y-o-y), which accelerated with increased services in multiple sectors, 20.4m connected
IoT accesses (905k in the quarter) and a new programme which give Wayra’s start-ups access to the global
managed IoT connectivity platform.
- Security (€109m; +34.6% y-o-y), with the inauguration of a security centre in the United Kingdom and the
conclusion of relevant contracts in the corporate segment.
iii) Contents (30% of digital revenues; €569m in the quarter) grew 41.9% y-o-y due to the positive performance in
Brazil.
iv) Other Digital Services (9% of digital revenues; €165m in January-March) increased 6.9% y-o-y, mainly due to
advertising.
Lastly, the fourth platform push the Company's transformation, leveraging on the normalisation of management
capabilities for the rest of the platforms and on the customer-generated data, allowing to develop new services, improve
customer experience and data-based business decision-making.
A single source of harmonised data-management capabilities (data model, API, technology) that is transparent and in
line with the GDPR is available to all Group operations and is the foundation of AI services such as Aura.
Enabling customers to manage their services simply, transparently and securely, Aura is already available in 6 countries.
At the MWC19, Movistar Home was presented, a home assistant equipped with Aura which supports video calls, in
addition to several alliances with companies operating in different sectors (e-commerce, airlines…) that open the
Telefónica home ecosystem.
On the other hand, among the AI-based new cases with an impact on revenues and efficiency are noteworthy the mobile
network deployment optimisation solution and powerful marketing tools (portfolio creation, handset recommendation
and personalised commercial actions).
Telxius
(y-o-y changes in organic terms)
Telxius continue to confirm the consistent business’ performance during the first quarter. Both revenues and OIBDA
improved their y-o-y evolution sequentially (even excluding the exceptional sale of capacity in the submarine cable

12
RESULTS JANUARY | MARCH 2019
MAREA, which connects Spain and the United States) thanks to the improvement in commercial activity and efficient
cost management.
January-March revenues amounted to €219m and grew by 18.7% y-o-y, positively impacted by the aforementioned
exceptional sale of capacity (excluding this impact, revenues would have increased by 6.0%). Revenues from Towers
(€84m) increased by 8.0% y-o-y and from Cable (€135m) by 27.4%, although excluding the sale of capacity at MAREA,
they would have grown by 4.5%.
OIBDA, positively affected by the new IFRS 16 (€24m), totalled €129m and increased by 18.2% y-o-y in organic terms
(+9.1% excluding the aforementioned exceptional sale of capacity that affects both revenues and expenses; vs +6.3% in
the previous quarter).
At the operational level in the Towers business, the tenancy ratio improved to 1.37x (+0.03x y-o-y and +0.01x vs. the
fourth quarter of 2018) on a base of 16,754 towers (75 new built towers in January-March mainly in Spain, Brazil and
Peru vs 24 in the first quarter of 2018); and in the Cable business, after the commissioning of new submarine
infrastructures in 2018 (BRUSA and MAREA), it is worth highlighting the exceptional sale of capacity in the latter.
CapEx (€9m) declined by 83.6% compared to January-March 2018 due to the completion of the mentioned submarine
cables. This y-o-y change cannot be extrapolated for the whole of the year given the different investment execution
schedule.
All the above is reflected in an Operating Cash Flow (OIBDA-CapEx) amounting to €120m in the first quarter (3.1 times
higher than that of the first quarter of 2018, 2.9 times excluding the exceptional sale of capacity already mentioned).

13
RESULTS JANUARY | MARCH 2019
TELEFÓNICA
ACCESSES
Unaudited figures (thousands)
March June September December March % Chg
Final Clients Accesses 338,190.8 338,830.1 337,396.8 337,051.5 331,995.4 (1.8)
Fixed telephony accesses (1) 36,674.0 36,281.6 35,733.5 35,273.6 34,262.8 (6.6)
Internet and data accesses 21,827.0 21,911.5 22,087.7 22,087.5 21,956.2 0.6
Broadband 21,385.9 21,460.2 21,638.0 21,645.2 21,586.5 0.9
FTTx/Cable 11,491.8 12,216.0 12,766.4 13,213.1 13,580.5 18.2
Mobile accesses 271,084.9 271,901.0 270,730.3 270,814.9 266,948.5 (1.5)
Prepay 153,623.2 152,234.0 149,131.7 147,062.0 142,125.6 (7.5)
Contract 117,461.7 119,667.0 121,598.5 123,752.9 124,822.9 6.3
M2M 16,778.1 17,623.4 18,397.9 19,483.0 20,388.6 21.5
Pay TV 8,604.9 8,736.1 8,845.3 8,875.4 8,828.0 2.6
Wholesale Accesses 19,021.1 18,966.5 19,207.0 19,520.0 20,419.6 7.4
Fixed wholesale accesses 4,222.2 4,082.6 3,987.7 3,951.5 3,895.1 (7.7)
Mobile wholesale accesses 14,798.9 14,883.9 15,219.3 15,568.5 16,524.5 11.7
Total Accesses 357,211.9 357,796.6 356,603.8 356,571.5 352,415.0 (1.3)
- T. Guatemala accesses are excluded from 1 January of 2019
TELEFÓNICA
MOBILE ACCESSES
Unaudited figures
March June September December March % Chg
Contract percentage (%) 43.3% 44.0% 44.9% 45.7% 46.8% 3.4 p.p.
Smartphones ('000) 161,572.5 163,886.0 166,794.1 167,693.5 166,241.7 2.9
Smartphone penetration (%) 64.4% 65.3% 66.9% 67.5% 68.2% 3.8 p.p.
LTE ('000) 102,910.4 106,617.8 111,529.1 117,369.5 121,494.0 18.1
LTE penetration (%) 40.5% 41.9% 44.2% 46.7% 49.3% 8.8 p.p.
2018
2018
2019
2019
(1) Includes fixed wireless and VoIP accesses. In Spain, since Q1 18 business accesses were restated.
14
RESULTS JANUARY | MARCH 2019
TELEFÓNICA
CONSOLIDATED INCOME STATEMENT
Unaudited figures (Euros in millions)
2019 2018 Reported Organic
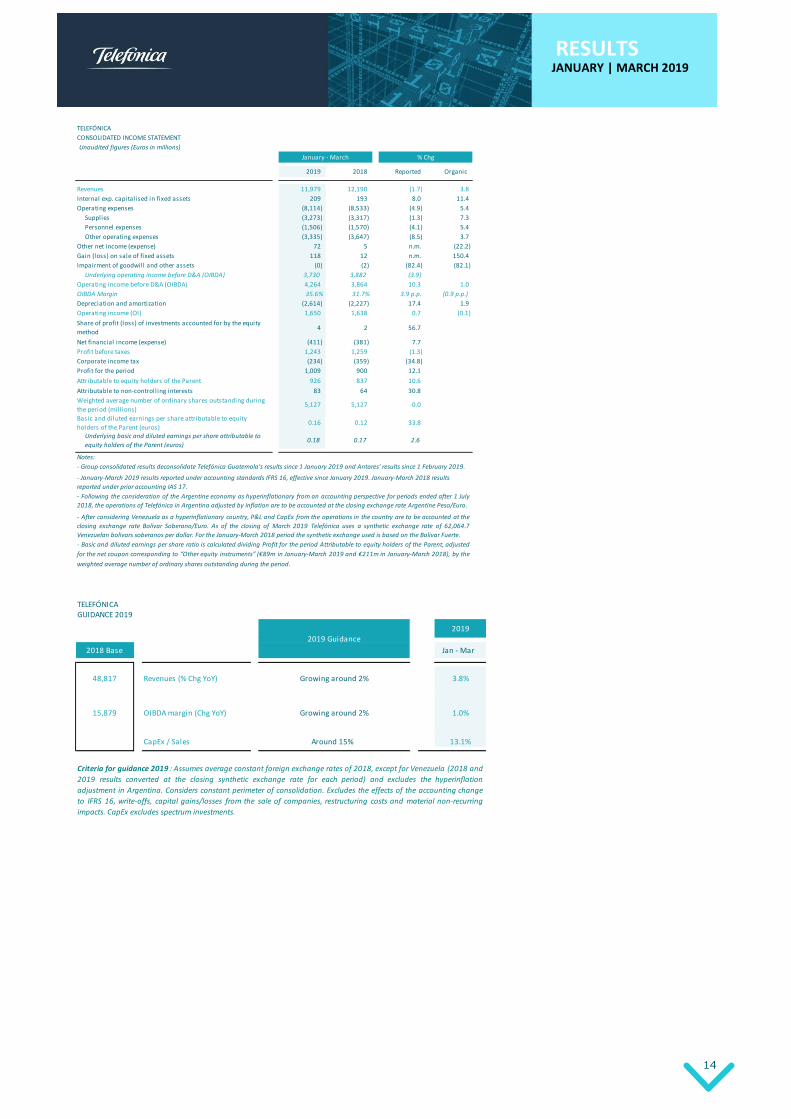
Revenues 11,979 12,190 (1.7) 3.8
Internal exp. capitalised in fixed assets 209 193 8.0 11.4
Operating expenses (8,114) (8,533) (4.9) 5.4
Supplies (3,273) (3,317) (1.3) 7.3
Personnel expenses (1,506) (1,570) (4.1) 5.4
Other operating expenses (3,335) (3,647) (8.5) 3.7
Other net income (expense) 72 5 n.m. (22.2)
Gain (loss) on sale of fixed assets 118 12 n.m. 150.4
Impairment of goodwill and other assets (0) (2) (82.4) (82.1)
Underlying operating income before D&A (OIBDA) 3,730 3,882 (3.9)
Operating income before D&A (OIBDA) 4,264 3,864 10.3 1.0
OIBDA Margin 35.6% 31.7% 3.9 p.p. (0.9 p.p.)
Depreciation and amortization (2,614) (2,227) 17.4 1.9
Operating income (OI) 1,650 1,638 0.7 (0.1)
Share of profit (loss) of investments accounted for by the equity
method4 2 56.7
Net financial income (expense) (411) (381) 7.7
Profit before taxes 1,243 1,259 (1.3)
Corporate income tax (234) (359) (34.8)
Profit for the period 1,009 900 12.1
Attributable to equity holders of the Parent 926 837 10.6
Attributable to non-controlling interests 83 64 30.8
Weighted average number of ordinary shares outstanding during
the period (mill ions)5,127 5,127 0.0
Basic and diluted earnings per share attributable to equity
holders of the Parent (euros)0.16 0.12 33.8
Underlying basic and diluted earnings per share attributable to
equity holders of the Parent (euros)0.18 0.17 2.6
Notes:
- Basic and diluted earnings per share ratio is calculated dividing Profit for the period Attributable to equity holders of the Parent, adjusted
for the net coupon corresponding to “Other equity instruments” (€89m in January-March 2019 and €211m in January-March 2018), by the
weighted average number of ordinary shares outstanding during the period.
% Chg
- After considering Venezuela as a hyperinflationary country, P&L and CapEx from the operations in the country are to be accounted at the
closing exchange rate Bolivar Soberano/Euro. As of the closing of March 2019 Telefónica uses a synthetic exchange rate of 62,064.7
Venezuelan bolivars soberanos per dollar. For the January-March 2018 period the synthetic exchange used is based on the Bolivar Fuerte.
January - March
- Following the consideration of the Argentine economy as hyperinflationary from an accounting perspective for periods ended after 1 July
2018, the operations of Telefónica in Argentina adjusted by inflation are to be accounted at the closing exchange rate Argentine Peso/Euro.
- January-March 2019 results reported under accounting standards IFRS 16, effective since January 2019. January-March 2018 results
reported under prior accounting IAS 17.
- Group consolidated results deconsolidate Telefónica Guatemala's results since 1 January 2019 and Antares' results since 1 February 2019.
TELEFÓNICAGUIDANCE 2019
2019
2018 Base Jan - Mar
48,817 Revenues (% Chg YoY) Growing around 2% 3.8%
15,879 OIBDA margin (Chg YoY) Growing around 2% 1.0%
CapEx / Sales Around 15% 13.1%
2019 Guidance
Criteria for guidance 2019 : Assumes average constant foreign exchange rates of 2018, except for Venezuela (2018 and
2019 results converted at the closing synthetic exchange rate for each period) and excludes the hyperinflation
adjustment in Argentina. Considers constant perimeter of consolidation. Excludes the effects of the accounting change
to IFRS 16, write-offs, capital gains/losses from the sale of companies, restructuring costs and material non-recurring
impacts. CapEx excludes spectrum investments.

15
RESULTS JANUARY | MARCH 2019
TELEFÓNICA
CONSOLIDATED STATEMENT OF FINANCIAL POSITION
Unaudited figures (Euros in millions)
March 2019 December 2018 % Chg
Non-current assets 97,197 90,707 7.2
Intangible assets 26,000 16,856 1.0
Goodwill 33,085 25,748 (0.6)
Property, plant and equipment 16,404 33,295 (2.7)
Rights of Use 7,382 n.a.
Investments accounted for by the equity method 64 68 (6.2)
Financial assets and other non-current assets 7,350 7,109 3.4
Deferred tax assets 6,912 7,631 (9.4)
Current assets 26,591 23,340 13.9
Inventories 1,588 1,692 (6.2)
Receivables and other current assets 10,567 10,579 (0.1)
Tax receivables 1,626 1,676 (3.0)
Other current financial assets 2,977 2,209 34.8
Cash and cash equivalents 8,356 5,692 46.8
Non-current assets classified as held for sale 1,477 1,492 (1.0)
Total Assets = Total Equity and Liabilities 123,788 114,047 8.5
Equity 28,517 26,980 5.7
Equity attributable to equity holders of the parent and other holders of
equity instruments19,479 17,947 8.5
Equity attributable to non-controlling interests 9,038 9,033 0.1
Non-current l iabilities 64,394 57,418 12.1
Non-current financial l iabil ities 5,616 45,334 2.7
Non-current Lease liabilities 46,571 n.a.
Payables and other non-current l iabilities 1,986 1,890 5.1
Deferred tax l iabilities 2,669 2,674 (0.2)
Non-current provisions 7,551 7,520 0.4
Current l iabilities 30,877 29,649 4.1
Current financial l iabil ities 1,529 9,368 13.7
Current Lease liabilities 10,655 n.a.
Payables and other current l iabilities 14,244 15,485 (8.0)
Current tax payables 1,962 2,047 (4.2)
Current provisions 1,828 1,912 (4.4)
Liabilities associated with non-current assets held for sale 659 837 (21.2)
Financial Data
Net Financial debt 40,381 41,074 (1.7)
Net Financial Debt plus Lease Liabilities 47,820 n.a.
- Following the consideration of the Argentine economy as hyperinflationary from an accounting perspective for periods ended after 1 July 2018,
the operations of Telefónica in Argentina are adjusted by inflation.
(1) Net financial debt calculation has been redefined in the first quarter of 2019 excluding the mark to market adjustment of the unmatured cash
flow hedges associated to debt instruments. This change seeks to eliminate the asymmetry generated by the accounting valuation method of both
financial instruments; the debt instrument valued at amortized cost and the derivative at market value. The change has been applied to all
comparative periods. Also, following the entry into force of IFRS 16 since 1 January 2019, for comparison purposes, the net financial debt figure of
December 2018 has been modified to exclude the lease liability of finance leases.
TELEFÓNICA
NET FINANCIAL DEBT PLUS COMMITMENTS
Unaudited figures (Euros in millions)
March 2019
Non-current financial l iabilities 46,571
10,655
Gross Financial Debt 57,226
Cash and cash equivalents (8,356)
Other assets included in "Other current financial assets" (2,973)
Cash and other current financial assets included in "Non-current Assets Held for Sale" (23)
Positive mark-to-market value of long-term derivative instruments (3,196)
Other l iabilities included in "Payables and other non-current l iabilities" 780
Other l iabilities included in "Payables and other current l iabilities" 101
Other assets included in "Financial assets and other non-current assets" (1,374)
Other assets included in "Receivables and other current assets" (762)
Other assests included in “Tax receivables" (636)
Financial l iabilities included in "Liabilities associated with non-current assets held for sale" 112
Finance Leases under IAS 17 (1) 0
Mark-to-market adjustment by cash flow hedging activities related to debt (1) (519)
Net Financial Debt* (1) 40,381
Lease Liabilities 7,439
Net Financial Debt including Lease liabilities 47,820
Gross commitments related to employee benefits 5,250
Value of associated Long-term assets (127)
Tax benefits (1,361)
Net commitments related to employee benefits 3,762
Net financial debt plus commitments* 44,143
Net Financial Debt / OIBDA 2.61x
Notes:
Net financial debt includes a positive value of the derivatives portfolio for a net amount of €1,470m, €2,750m
included as financial liabilities and €4,220m included as financial assets
* Includes assets and liabilities defined as net financial debt plus commitments for Nicaragua, El Salvador, Panama
and Costa Rica, that are classified as non-current assets held for sale and liabilities associated with non-current assets
held for sale.
(1) Net financial debt calculation has been redefined in the first quarter of 2019 excluding the mark to market
adjustment of the unmatured cash flow hedges associated to debt instruments. This change seeks to eliminate the
asymmetry generated by the accounting valuation method of both financial instruments; the debt instrument valued
at amortized cost and the derivative at market value. The change has been applied to all comparative periods. Also,
following the entry into force of IFRS 16 since 1 January 2019, for comparison purposes, the net financial debt figure
of December 2018 has been modified to exclude the lease liability of finance leases.
Current financial l iabilities

16
RESULTS JANUARY | MARCH 2019
TELEFÓNICA
CONSOLIDATED CASH FLOW STATEMENT
Unaudited figures (Euros in millions)
2019 2018 % Var
Cash received from operations 14,737 15,069
Cash paid from operations (11,081) (11,729)
Net payments of interest and other financial expenses net of dividens received (673) (698) Net interest and other financia l expenses pa id (681) (709) Dividends received 9 11
Taxes paid 676 (21)
Net cash flow provided by operating activities 3,659 2,621 39.6
(Payments)/proceeds on investments in property, plant and equipment and intangible assets (1,990) (2,104)
Proceeds from the sa le in property, plant and equipment and intangible assets 38 10
Payments on investments in property, plant and equipment and intangible assets (2,028) (2,114)
Proceeds on disposals of companies, net of cash and cash equivalents disposed 418 5
Payments on investments in companies, net of cash and cash equivalents acquired (2) (53)
Proceeds on financial investments not included under cash equivalents 305 83
Payments on financial investments not included under cash equivalents (230) (389)
(640) (986)
Government grants received - -
Net cash flow used in investing activities (2,139) (3,444) (37.9)
Dividends paid (170) (335)
Proceeds from issue of share capital increase - -
(112) -
Operations with other equity holders (1) 241 170
Proceeds on issue of debentures and bonds, and other debts 3,098 2,612
Proceeds on loans, borrowings and promissory notes 573 1,675
Cancellation of debentures and bonds, and other debts (212) (2,410)
Repayments of loans, borrowings and promissory notes (1,693) (1,070)
(161) (126)
Lease Principal Payments (500) -
Net cash used in financing activities 1,064 516 106.2
Effect of changes in exchange rates 93 (64)
Cash reclassified to assets held for sale (13) -
Effect of changes in consolidation methods and others - 1
Net increase (decrease) in cash and cash equivalents during the year 2,664 (370) c.s.
Cash and cash equivalents at the beginning of the period 5,692 5,192
Cash and cash equivalents at the end of the period 8,356 4,822
January - March
Notes:
(1) Includes issuance and coupons of undated deeply subordinated securities.
Financed operating payments and investments in property, plant and equipment and
intangible assets payments
(Payments)/proceeds on placements of cash surpluses not included under cash equivalents, net
Proceeds/(payments) of treasury shares and other operations with shareholders and with
minority interests
- Following the consideration of the Argentine economy as hyperinflationary from an accounting perspective for periods ended after 1 July 2018, the
operations of Telefónica in Argentina adjusted by inflation are to be accounted at the closing exchange rate Argentine Peso/Euro.

17
RESULTS JANUARY | MARCH 2019
TELEFÓNICA
FREE CASH FLOW AND CHANGE IN DEBT
Unaudited figures (Euros in millions)
2019 2018 % Chg
I Cash flow from operations 3,656 3,340 9.5
II Net interest payment (1) (673) (698)
III Payment for income tax 676 (21)
A=I+II+III Net cash provided by operating activities (2) 3,659 2,621 39.6
B Net payment for investment in fixed and intangible assets (3) (1,990) (2,104)
Spectrum (4) (21) (29)
C=A+B Net free cash flow after CapEx 1,669 518 n.m.
D Net payment for financial investment 491 (353)
E (41) (166)
F=C+D+E Free cash flow after dividends 2,119 (1) c.s.
G Effects of exchange rate changes on net financial debt 303 58
H Effects on net financial debt of changes in consolid. and others (6) 1,123 (524)
I Net financial debt at beginning of period (7) 41,074 43,301
J=I-F+G+H Net financial debt at end of period (7) 40,381 42,837 (5.7)
K Lease Liabilities (8) 7,439 n.a.
L=J+K Net Financial Debt plus Lease Liabilities at end of period (8) 47,820 n.a.
TELEFÓNICA
RECONCILIATIONS OF CASH FLOW AND OIBDA MINUS CAPEX
Unaudited figures (Euros in millions)
2019 2018 % Chg
OIBDA 4,264 3,864 10.3
- CapEx accrued during the period (1,554) (1,490)
- Payments related to cancellation of commitments (239) (201)
- Net interest payment (673) (698)
- Payment for tax 676 (21)
- Gain (loss) on sale of fixed assets and impairment of goodwill and other assets (95) 2
- Investment In working capital and other deferred income and expenses and Others (3) (711) (939)
= Net Free Cash Flow after CapEx 1,669 518 n.m.
239 201
(0) (168)
1,908 n.a.
- Lease Principal Payments (8) (500) n.a.
1,408 550 155.9
Weighted average number of ordinary shares outstanding during the period (mill ions) 5,127 5,127
0.37 n.a.
0.27 0.11 155.8
(1) Includes cash received from dividends paid by subsidiaries that are not fully consolidated.
(2) Includes government grants received.
(4) Figures in €m. 2019 includes mainly: 2 in Spain, 18 in El Salvador and 1 in Colombia. In 2018 mainly: 1 in UK, 7 in Argentina, 20 in Costa Rica and 1 in
Colombia.
(6) Includes Lease Principal Payments following IFRS 16 adoption.
(3) Includes Net Cash received from sale of Real Estate.
January - March
January - March
+ Payments related to cancellation of commitments
- Dividends paid to minority shareholders
Net payment for operations with minority shareholders and treasury stock (5)
= Free Cash Flow per share (euros)
= Free Cash Flow including Lease Principal Payments
(5) Dividends paid by Telefónica S.A., operations with treasury stock, issuance of shares, issuance and coupons of undated deeply subordinated securities,
issuance of mandatorily convertible bonds into Telefónica S.A. shares and operations with minority shareholders from subsidiaries that are consolidated
through the equity method.
= Free Cash Flow excluding Lease Principal Payments (8)
= Free Cash Flow per share excluding Lease Principal Payments (8)
Notes:
(7) Net financial debt calculation has been redefined in the first quarter of 2019 excluding the mark to market adjustment of the unmatured cash flow
hedges associated to debt instruments. This change seeks to eliminate the asymmetry generated by the accounting valuation method of both financial
instruments; the debt instrument valued at amortized cost and the derivative at market value. The change has been applied to all comparative periods. Also,
following the entry into force of IFRS 16 since 1 January 2019, for comparison purposes, the net financial debt figure of December 2018 has been modified to
exclude the lease liability of finance leases.
- Following the consideration of the Argentine economy as hyperinflationary from an accounting perspective for periods ended after 1 July 2018, the
operations of Telefónica in Argentina adjusted by inflation are to be accounted at the closing exchange rate Argentine Peso/Euro.
(8) Considered since 1 January 2019. No data available in 2018.

18
RESULTS JANUARY | MARCH 2019
TELEFÓNICA
EXCHANGES RATES APPLIED
P&L and CapEx (1) Statement of Financial Position (2)
Currency units per Euro Jan - Mar 2019 Jan - Mar 2018 March 2019 December 2018
USA (US Dollar) 1.136 1.229 1.123 1.145
United Kingdom (Sterling) 0.873 0.883 0.858 0.895
Argentina (Argentine Peso) (3) 48.697 24.165 48.697 43.303
Brazil (Brazil ian Real) 4.282 3.988 4.377 4.438
Chile (Chilean Peso) 757.983 739.733 762.160 795.754
Colombia (Colombian Peso) 3,561.812 3,509.967 3,566.079 3,722.094
Costa Rica (Colon) 692.521 702.741 678.426 700.771
Guatemala (Quetzal) 8.767 9.049 8.628 8.861
Mexico (Mexican Peso) 21.819 23.013 21.766 22.507
Nicaragua (Cordoba) 36.943 38.057 36.745 37.030
Peru (Peruvian Nuevo Sol) 3.776 3.978 3.728 3.864
Uruguay (Uruguayan Peso) 37.268 35.025 37.611 37.116
Venezuela (4) 69,714.172 316,069.669 69,714.172 8,714.287
(1) Average exchange rate for the period.
(4) After considering Venezuela as a hyperinflationary country, P&L and CapEx from the operations in the country are to be
accounted at the closing exchange rate Bolivar Soberano/Euro. As of the closing of March 2019 and December 2018,
Telefónica uses a synthetic exchange rate of 62,064.7 and 7,608.4 Venezuelan bolivars soberanos per dollar respectively. For
the January-March 2018 period the synthetic exchange used is based on the Bolivar Fuerte.
(2) Exchange rates as of 31/03/19 and 31/12/18.
(3) Following the consideration of the Argentine economy as hyperinflationary from an accounting perspective for periods
ended after 1 July 2018, the operations of Telefónica in Argentina adjusted by inflation are to be accounted at the closing
exchange rate Argentine Peso/Euro.
NET FINANCIAL DEBT STRUCTURE BY CURRENCY
Unaudited figures
EUR LATAM GBP USD
76% 12% 9% 3%
TOTAL FINANCIAL LIABILITIES BREAKDOWN
Unaudited figures
Bonds and
commercial
paper
Debt with
financial
institutions
87% 13%
CREDIT RATINGS
Long-Term Short-Term Perspective
Moody's1 Baa3 P-3 Stable
Fitch1 BBB F-3 Stable
S&P1 BBB A-2 Stable
March 2019
March 2019
Other financial debt
(including governments) and
net derivatives
0%
Net financial debt structure by currency
Total financial liabilities (1)
(1) Includes positive value of derivatives and other financial debt.
07/11/2016
05/09/2016
17/05/2016
Date of last rating change
(1) The rating is issued by a credit rating agency established in the EU and registered under Regulation (EC) 1060/2009.

19
RESULTS JANUARY | MARCH 2019
02
TELEFÓNICA ESPAÑA
(y-o-y changes in organic terms)
Telefónica España 2019 first quarter results show improved y-o-y performance versus the previous quarter in both
service revenues (+0.8% y-o-y; +0.3 p.p. q-o-q) and OIBDA (+3.0 p.p. q-o-q), reflecting the differentiated value-oriented
service proposition as well as efficient cost management. Service revenues grew for the seventh straight quarter, most
noteworthy being wholesale and other revenues return to growth (+0.2%, +7.3 p.p. q-o-q) after a significant reduction
of the dragging impacts seen during 2018.
The Company's focus on value is reflected in an improved customer mix: net additions in convergence (13k), mobile
contract (163k) and fibre (85k). This improvement has been achieved in a quarter with tariff upgrades around the
Company’s “more-for-more” strategy (applied in January and February), that affected commercial activity, which
nevertheless improved month by month throughout the quarter. Retail fibre customers surpassed 4 million and
wholesale fibre accesses continued growing substantially (x2 y-o-y), exceeding 1.7 million, thus increasing the network
investment profitability.
Convergent customers (4.6m) grew 4% y-o-y (13k net additions), now accounting for 92% of the TV base (+3 p.p. y-o-y),
89% of broadband (+3 p.p.) and 84% of mobile contract (+3 p.p.) in the consumer market.
Convergent ARPU (€88.2) grew 0.6% y-o-y, below the previous quarter (+2.5%). The deceleration is due to the smaller
positive impact from the tariff upgrade versus the same period last year (that affected 100% of the convergent base in
the in February and March 2018, and only two-thirds of the base in February 2019), and the growing contribution from
“O2”. Notwithstanding its lower ARPU, “O2” contributed to the growth of convergent revenues (+4.3% y-o-y). Churn
ticked up to 1.7% (+0.2 p.p. q-o-q) because of the mentioned tariff upgrade.
Total convergent accesses (22.5m) continued to post a solid advance (+7% y-o-y) with an average of 2.0 mobile lines per
customer (vs. 1.9 in the previous year), and again showed an improved customer quality mix with 30% of customers in
high-value bundles (+3 p.p. y-o-y), 81% with TV (+3 p.p.) and 41% with 600 Mbps fibre (+2 p.p. y-o-y).
As mentioned above, the tariff upgrade affected commercial trading in the quarter, though virtually all accesses grew
y-o-y and improved their performance throughout the period. Mobile accesses (+4% y-o-y) showed net additions of 64k
in the quarter (60k in March), driven by contract (+7% y-o-y), which tallied 163k lines (95k in March). Fixed broadband
accesses (+1% y-o-y) decreased by 45k in the quarter (-6k in March, mainly due to the loss of non-convergent lower
value accesses), though the balance nonetheless remained positive in fibre accesses. Pay TV customers grew by 4%
y-o-y adding 3k accesses (12k in March). Fixed telephony accesses (-2% y-o-y) fell by 141k (-27k in March).
Retail fibre accesses continued to post strong growth (+13% y-o-y, +85k in the quarter), surpassing 4 million,
representing over 66% of the consumer broadband accesses (+7 p.p. y-o-y).
Wholesale accesses amounted to 3.9 million (-6% y-o-y), with strong growth in wholesale fibre accesses, which now
stand at 1.7 million and represent 45% of total wholesale accesses (+20 p.p. y-o-y). Over the last few months, Telefónica
has been increasing its total market share in fibre by adding both, retail and wholesale accesses, to its network.
Premises passed with fibre amounted to 21.8m (+450k in the quarter) and the connected customer uptake increased to
26% (8% via wholesale accesses), meaning 1.2m more customers connected to T. España fibre network in the past
twelve months, including wholesale accesses.
Revenues in the quarter stood at €3,108m, +0.3% y-o-y, in line with the previous quarter, thanks to the accelerated
growth of service revenues (€3,033m; +0.8%; +0.3 p.p. q-o-q) and despite lower handset sales (-17.1% y-o-y).

20
RESULTS JANUARY | MARCH 2019
Consumer revenues (€1,666m in the quarter) remained stable y-o-y driven by convergent revenues (40% of service
revenues) which increased 4.3% y-o-y, albeit at a slower pace than in the previous quarter, mainly because of the above-
mentioned lower impact from the tariff upgrade.
Business revenues (€860m) increased by 3.0% y-o-y underpinned by the solid performance of IT revenues (+18.5%
y-o-y) which more than offset the reduction in communications (-1.4% y-o-y).
Wholesale and other revenues (€507m) returned to y-o-y growth (+0.2%), improving the trend vs. previous quarter by
7.3 p.p. with most of the dragging 2018 effects having less of an impact (MVNO migration and regulated MTR cuts). It is
worth highlighting the positive evolution of TV revenues as well as the fibre access base more than offsetting the shift
towards the self-provision model in fibre connections. Self-provisioning contributed to improve system efficiencies (by
reducing investment more than revenues).
Operating expenses in January-March (€1,929m) increased by 2.7% y-o-y due to higher football content costs, though
growth slowed down by 0.9 p.p. versus the previous quarter, mainly due to a better y-o-y performance in motor content
costs as anticipated (once calendar one-off effects in the fourth quarter of 2018 disappear and of Moto GP is not
renewed).
Supplies (€913m in January-March) increased by 7.2% y-o-y due to the above-mentioned effects in content costs (+21%
y-o-y in net terms). Personnel expenses (€488m) fell by 2.2% y-o-y, due to the savings from the employment suspension
plan (€29m) with headcount at 25,383 employees at the end of March (-6% y-o-y). Other operating expenses (€527m)
increased slightly (+0.5%) despite lower commercial costs.
OIBDA in January-March stood at €1,350m (+10.3% reported), though it is affected by some factors eliminated from the
organic variation: i) capital gains from the assignment of future rights linked to a portfolio of claims (+€103m); ii)
provision for the restructuring of channels (-€23m) and iii) changes related to the adoption of IFRS 16 (+€64m).
In organic terms, OIBDA decreased 1.4% y-o-y, with a sequential improvement of 3.0 p.p., explained by the significant
reduction of the dragging impacts on wholesale revenues and motor content cost.
CapEx in the quarter (€377m) rose 9.2% y-o-y due to seasonal effects, setting operating cash flow at €973m.

21
RESULTS JANUARY | MARCH 2019
TELEFÓNICA ESPAÑA
CONSOLIDATED INCOME STATEMENT
Unaudited figures (Euros in millions)
2019 2018 Reported Organic
Revenues 3,108 3,098 0.3 0.3
Mobile handset revenues 76 91 (17.1) (17.1)
Revenues ex-mobile handset revenues 3,033 3,007 0.8 0.8
Consumer (1) 1,666 1,666 (0.0) (0.0)
Convergent 1,222 1,171 4.3 4.3
Non convergent 444 495 (10.3) (10.3)
Business 860 835 3.0 3.0
Communications 641 650 (1.4) (1.4)
IT 219 185 18.6 18.5
Wholesale and Other (2) 507 506 0.1 0.2
Internal expenditure capitalised in fixed assets 76 69 9.9 9.9
Operating expenses (1,929) (1,939) (0.6) 2.7
Supplies (913) (852) 7.2 7.2
Personnel expenses (488) (503) (3.0) (2.2)
Other operating expenses (527) (584) (9.7) 0.5
Other net income (expense) 88 (3) c.s. c.s.
Gain (loss) on sale of fixed assets 6 3 110.2 110.2
Impairment of goodwill and other assets (0) (5) (93.6) (93.6)
Operating income before D&A (OIBDA) 1,350 1,224 10.3 (1.4)
OIBDA Margin 43.4% 39.5% 3.9 p.p. (0.7 p.p.)
CapEx 377 346 9.0 9.2
Spectrum - - - -
OpCF (OIBDA-CapEx) 973 878 10.8 (5.6)
Notes:
- OIBDA before management and brand fees.
(1) Consumer revenues include residential and SOHO revenues.
(2) Wholesale and other revenues include subsidiaries and other revenues.
% ChgJanuary - March
- January-March 2019 results reported under accounting standards IFRS 16, effective since January 2019. January-March 2018
results reported under prior accounting IAS 17.
TELEFÓNICA ESPAÑA
ACCESSES
Unaudited figures (Thousands)
March June September December March % Chg
Final Clients Accesses 37,154.0 37,278.6 37,760.8 37,966.5 37,847.8 1.9
Fixed telephony accesses (1) 9,450.6 9,397.5 9,405.2 9,361.3 9,220.7 (2.4)
Internet and data accesses 6,032.8 6,050.1 6,129.4 6,129.6 6,083.7 0.8
Broadband 6,014.7 6,032.0 6,110.5 6,113.5 6,068.0 0.9
FTTH 3,550.5 3,667.5 3,822.2 3,940.6 4,025.5 13.4
Mobile accesses 17,743.3 17,896.1 18,189.8 18,384.4 18,448.6 4.0
Prepay 1,683.9 1,603.6 1,527.3 1,440.1 1,341.2 (20.4)
Contract 16,059.3 16,292.5 16,662.5 16,944.3 17,107.4 6.5
M2M 2,083.7 2,149.2 2,227.4 2,333.2 2,353.9 13.0
Pay TV 3,927.3 3,934.9 4,036.4 4,091.3 4,094.8 4.3
Wholesale Accesses 4,119.0 4,035.1 3,948.0 3,912.9 3,858.4 (6.3)
Fibre 995.8 1,158.9 1,309.8 1,522.2 1,719.2 72.7
Total Accesses 41,273.0 41,313.7 41,708.8 41,879.4 41,706.2 1.0
2018 2019
(1) Includes fixed wireless and VoIP accesses. Since Q1 18 business accesses were restated.

22
RESULTS JANUARY | MARCH 2019
CONSUMER ACCESSES (Convergent + Non convergent)
Unaudited figures (thousands)
March June September December March % Chg
Fixed telephony accesses 6,799.9 6,721.7 6,716.6 6,657.7 6,520.7 (4.1)
Internet and data accesses 5,187.7 5,198.6 5,274.0 5,272.9 5,224.9 0.7
Mobile accesses 12,141.4 12,236.6 12,450.2 12,530.5 12,540.7 3.3
Prepay 1,683.9 1,603.6 1,527.3 1,440.1 1,341.2 (20.4)
Contract 10,457.5 10,633.0 10,922.8 11,090.4 11,199.5 7.1
Pay TV 3,927.3 3,934.9 4,036.4 4,091.3 4,094.8 4.3
Total Consumer Accesses 28,056.3 28,091.8 28,477.1 28,552.4 28,381.0 1.2
TOTAL MOBILE ACCESSES
Unaudited figures
March June September December March % Chg
Contract percentage (%) 90.5% 91.0% 91.6% 92.2% 92.7% 2.2 p.p.
Smartphones ('000) 12,264.6 12,356.6 12,731.9 12,889.7 13,001.6 6.0
Smartphone penetration (%) 78.5% 78.7% 79.9% 80.5% 80.9% 2.4 p.p.
LTE ('000) 8,002.5 8,270.0 8,596.5 8,843.2 9,006.7 12.5
LTE penetration (%) 51.1% 52.5% 53.9% 55.1% 56.0% 4.9 p.p.
CONSUMER CONVERGENT
Unaudited figures (thousands)
March June September December March % Chg
Convergent Customers 4,460.0 4,482.1 4,562.6 4,613.8 4,626.5 3.7
High speed Fibre 1,708.5 1,696.9 1,773.6 1,823.4 1,885.6 10.4
IPTV/Satellite 3,470.6 3,508.6 3,625.6 3,711.0 3,755.5 8.2
Mobile add-ons 4,036.7 4,248.0 4,482.3 4,687.7 4,818.0 19.4
Convergent Accesses 20,887.3 21,203.0 21,795.7 22,240.0 22,453.1 7.5
CONSUMER CONVERGENT
Unaudited figures
Q1 Q2 Q3 Q4 Q1 % Chg org.
Convergent ARPU (EUR) 87.8 89.5 89.2 88.2 88.2 0.6
Convergent churn 1.5% 1.5% 1.5% 1.5% 1.7% 0.2 p.p.
Jan - Mar Jan - Jun Jan - Sep Jan - Dec Jan - Mar % Chg org.
Convergent ARPU (EUR) 87.8 88.6 88.8 88.7 88.2 0.6
Convergent churn 1.5% 1.5% 1.5% 1.5% 1.7% 0.2 p.p.
SELECTED OPERATIONAL DATA
Unaudited figures
Jan - Mar Jan - Jun Jan - Sep Jan - Dec Jan - Mar % Chg
Total data traffic (TB) 2,113,454 4,296,235 6,598,644 9,176,392 2,733,020 29.3
Fixed data traffic 1,978,154 4,010,990 6,120,345 8,507,409 2,538,715 28.3
Mobile data traffic 135,300 285,245 478,299 668,984 194,305 43.6
TELEFÓNICA ESPAÑA
- Data traffic is defined as Terabytes used by the company customers, both upload and download (1TByte = 10^12 bytes).
Promotional traffic is included. Traffic not associated to the Company's mobile customers (roaming-in, MVNOs, interconnection of
third parties and other business lines) is also included. Traffic volume non-rounded.
2018 2019
2018 2019
20192018
- Convergent: Fusión and Multibrand included from Q4 2018.
2018 2019
20192018
Notes:

23
RESULTS JANUARY | MARCH 2019
03
TELEFÓNICA DEUTSCHLAND
(y-o-y changes in organic terms)
Telefónica Deutschland posted a strong commercial quarter. The Company has launched further value-added initiatives
to enhance its ARPU-up and churn-down strategy. This includes O2 TV (from 2 May), O2 Cloud (from 8 April) and O2 VDSL
(from 7 March). The O2 Free portfolio continues to drive usage and ARPU growth leveraging the improved network of
the Company. Telefónica Deutschland also recently announced a significant enhancement of its infrastructure portfolio
with the addition of cable wholesale access through a long term agreement with Vodafone (subject to completion of
Vodafone’s acquisition of Unitymedia).
Contract mobile customers (22.6m; +5% y-o-y) posted robust net additions of 306k in the quarter (+94% y-o-y) with
sustained traction from O2 Free customers and continued strong contribution from partners (60% of gross additions in
Q1; 62% in Q4; again driven by 4G offers). Prepay customers (20.3m; -5% y-o-y) were still impacted by regulatory
changes (legitimation check) and registered 211k net disconnections in Q1. Contract churn in the O2 consumer brand
improved by 0.2 p.p. y-o-y, as the company maintained its retention focused strategy. Smartphone penetration further
increased to 67% (+5 p.p. y-o-y). LTE accesses stood at 19.3m and accelerated by 20% y-o-y, penetration reaching 46%
(+8 p.p. y-o-y). The average data usage for O2 contract LTE customers continued to grow and reached 4.2 GB per month
(+52% y-o-y). Retail broadband customer base registered 2.1m accesses (+3% y-o-y) with 44k net additions in Q1 (+73%
q-o-q), whereby the demand for VDSL remained solid (+65k net additions in Q1; +25% q-o-q) and VDSL customers grew
by 21% y-o-y to 1.5m.
Revenues came in at €1,779m in Q1 19, +0.7% y-o-y supported by another quarter of strong consumer demand for
handsets, while below last quarter’s growth of +2.6% y-o-y. Excluding negative regulatory effects mainly from MTR cuts
(to €0.95 cent per minute from €1.07 from 1 Dec 2018) and remaining RLAH impact, revenues grew 1.3% y-o-y in Q1 19.
Mobile service revenues (MSR) decreased slightly (-0.5% y-o-y) and reached €1,281m, mainly due to the before
mentioned regulatory effects. MSR ex-regulation grew +0.3% y-o-y (-0.4% in Q4 18). The ARPU-accretive effects from
the new O2 portfolio were partially offset by legacy base rotation including the ongoing effects from renewal cycles of
customers. Handset revenues rose +12.6% reaching €315m, reducing its pace of growth from the previous quarter
(+24.2%). Fixed revenues (€182m in Q1) declined -8.6% y-o-y, following ongoing trends and mainly reflecting the
planned dismantling of legacy infrastructure, while improving by 4.1 p.p. vs Q4.
Operating expenses decreased 0.4% y-o-y to €1,261m, a better sequential trend (+3.2% in Q4) mainly due to lower
supply costs. Supplies (€568m) decreased 1.6% y-o-y on lower connectivity related cost of sales which compensated for
the demand-driven higher hardware cost of sales. Personnel expenses (€150m) were 0.3% lower y-o-y supported by
integration savings from the employee restructuring programme that more than offset the inflation-related salary
adjustments in 2018. Other operating expenses increased 0.7% y-o-y to €543m. Restructuring costs amounted to €23m
(€14m in Q1 18).
OIBDA reached €522m in Q1 19, having a positive impact of €129m after the implementation of IFRS16 accounting
change. OIBDA is down 0.2% y-o-y mainly due to regulatory headwinds, some upfront investments into the digital
transformation programme and some commercial investments. The OIBDA trend improved by 3.8 p.p. vs Q4 18 mainly
due to a combined contribution from improved efficiencies as well as tougher comps last quarter. At the same time, the
Company crystallised part of the remaining integration synergies (c.€20m in Q1 19). OIBDA ex-regulation grew +0.8%
y-o-y. OIBDA margin decreased in Q1 19 by 0.2 p.p. y-o-y.
CapEx saw a strong increase (+28.3% y-o-y) and reached €252m in Q1 19, mainly due to front-loaded LTE roll-out, a
trend expected to normalise over the full year. As such, operating cash flow (OIBDA-CapEx) stood at €270m in the
period January to March 2019.
24
RESULTS JANUARY | MARCH 2019
TELEFÓNICA DEUTSCHLAND
CONSOLIDATED INCOME STATEMENT
Unaudited figures (Euros in millions)
2019 2018 Reported Organic
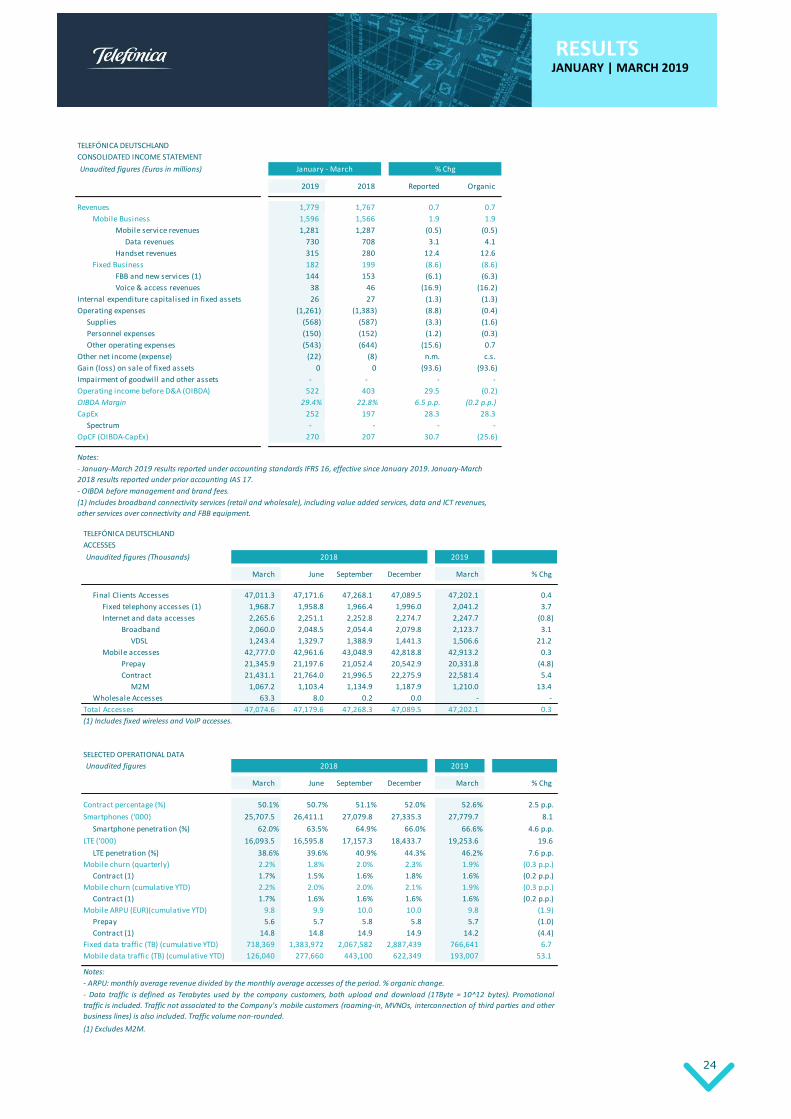
Revenues 1,779 1,767 0.7 0.7
Mobile Business 1,596 1,566 1.9 1.9
Mobile service revenues 1,281 1,287 (0.5) (0.5)
Data revenues 730 708 3.1 4.1
Handset revenues 315 280 12.4 12.6
Fixed Business 182 199 (8.6) (8.6)
FBB and new services (1) 144 153 (6.1) (6.3)
Voice & access revenues 38 46 (16.9) (16.2)
Internal expenditure capitalised in fixed assets 26 27 (1.3) (1.3)
Operating expenses (1,261) (1,383) (8.8) (0.4)
Supplies (568) (587) (3.3) (1.6)
Personnel expenses (150) (152) (1.2) (0.3)
Other operating expenses (543) (644) (15.6) 0.7
Other net income (expense) (22) (8) n.m. c.s.
Gain (loss) on sale of fixed assets 0 0 (93.6) (93.6)
Impairment of goodwill and other assets - - - -
Operating income before D&A (OIBDA) 522 403 29.5 (0.2)
OIBDA Margin 29.4% 22.8% 6.5 p.p. (0.2 p.p.)
CapEx 252 197 28.3 28.3
Spectrum - - - -
OpCF (OIBDA-CapEx) 270 207 30.7 (25.6)
Notes:
(1) Includes broadband connectivity services (retail and wholesale), including value added services, data and ICT revenues,
other services over connectivity and FBB equipment.
- OIBDA before management and brand fees.
% ChgJanuary - March
- January-March 2019 results reported under accounting standards IFRS 16, effective since January 2019. January-March
2018 results reported under prior accounting IAS 17.
TELEFÓNICA DEUTSCHLAND
ACCESSES
Unaudited figures (Thousands)
March June September December March % Chg
Final Clients Accesses 47,011.3 47,171.6 47,268.1 47,089.5 47,202.1 0.4
Fixed telephony accesses (1) 1,968.7 1,958.8 1,966.4 1,996.0 2,041.2 3.7
Internet and data accesses 2,265.6 2,251.1 2,252.8 2,274.7 2,247.7 (0.8)
Broadband 2,060.0 2,048.5 2,054.4 2,079.8 2,123.7 3.1
VDSL 1,243.4 1,329.7 1,388.9 1,441.3 1,506.6 21.2
Mobile accesses 42,777.0 42,961.6 43,048.9 42,818.8 42,913.2 0.3
Prepay 21,345.9 21,197.6 21,052.4 20,542.9 20,331.8 (4.8)
Contract 21,431.1 21,764.0 21,996.5 22,275.9 22,581.4 5.4
M2M 1,067.2 1,103.4 1,134.9 1,187.9 1,210.0 13.4
Wholesale Accesses 63.3 8.0 0.2 0.0 - -
Total Accesses 47,074.6 47,179.6 47,268.3 47,089.5 47,202.1 0.3
SELECTED OPERATIONAL DATA
Unaudited figures
March June September December March % Chg
Contract percentage (%) 50.1% 50.7% 51.1% 52.0% 52.6% 2.5 p.p.
Smartphones ('000) 25,707.5 26,411.1 27,079.8 27,335.3 27,779.7 8.1
Smartphone penetration (%) 62.0% 63.5% 64.9% 66.0% 66.6% 4.6 p.p.
LTE ('000) 16,093.5 16,595.8 17,157.3 18,433.7 19,253.6 19.6
LTE penetration (%) 38.6% 39.6% 40.9% 44.3% 46.2% 7.6 p.p.
Mobile churn (quarterly) 2.2% 1.8% 2.0% 2.3% 1.9% (0.3 p.p.)
Contract (1) 1.7% 1.5% 1.6% 1.8% 1.6% (0.2 p.p.)
Mobile churn (cumulative YTD) 2.2% 2.0% 2.0% 2.1% 1.9% (0.3 p.p.)
Contract (1) 1.7% 1.6% 1.6% 1.6% 1.6% (0.2 p.p.)
Mobile ARPU (EUR)(cumulative YTD) 9.8 9.9 10.0 10.0 9.8 (1.9)
Prepay 5.6 5.7 5.8 5.8 5.7 (1.0)
Contract (1) 14.8 14.8 14.9 14.9 14.2 (4.4)
Fixed data traffic (TB) (cumulative YTD) 718,369 1,383,972 2,067,582 2,887,439 766,641 6.7
Mobile data traffic (TB) (cumulative YTD) 126,040 277,660 443,100 622,349 193,007 53.1
2018
2018
2019
Notes:
2019
(1) Includes fixed wireless and VoIP accesses.
(1) Excludes M2M.
- ARPU: monthly average revenue divided by the monthly average accesses of the period. % organic change.
- Data traffic is defined as Terabytes used by the company customers, both upload and download (1TByte = 10^12 bytes). Promotional
traffic is included. Traffic not associated to the Company's mobile customers (roaming-in, MVNOs, interconnection of third parties and other
business lines) is also included. Traffic volume non-rounded.

25
RESULTS JANUARY | MARCH 2019
04
TELEFÓNICA UK
(y-o-y changes in organic terms)
Telefónica UK posted another good set of results in the first quarter, delivering growth in its main financials and overall
customer base supported by the continued popularity of propositions such as “Custom Plans”. In addition, the Company
continued to be the UK’s favourite mobile network with sector leading postpay churn at 0.9% and being recognised as
“Best Network Performance” at Mobile News Awards and “Best Sponsorship of the last 25 years” for “The O2” at the
UK Sponsorship Awards in March.
Mobile accesses totalled 32.7m customers (including MVNO partners), growing by 2% y-o-y whilst remaining the largest
network carrier in the market. Own brand contract net additions grew to 220k in the quarter vs. 16k in Q1 18 (ex-M2M
13k; 5k in Q1 18), driving growth of 4% y-o-y to 16.5m contract customers (66% penetration, +2p.p. y-o-y). MVNO
partners posted positive net adds of 91k in the quarter (+6% y-o-y). LTE accesses improved by 7% y-o-y to 13.7m with a
penetration of 65% (+5 p.p. y-o-y). In prepay, net quarterly additions registered -208k in Q1 (+37k y-o-y), in line with the
continuing market trend of migration to postpay, despite the positive contribution of giffgaff.
Revenues maintained a strong level of growth of 5.3% y-o-y to €1,691m mainly driven by the continued success of
flexible tariff offerings such as “Custom Plans”, higher value handset sales, as well as ongoing growth in Smart Metering
Implementation Programme (SMIP), MVNO and Business ICT.
Mobile service revenues totalled €1,182m and grew by 0.5% y-o-y, mainly driven by an increase in subscription
revenues and continuing MVNO growth, which were among others partially offset by the progressive implementation
of out of bundle spend cap regulation introduced to the UK market in October 2018.
Handset & other revenues amounted to €508m, up 18.7% y-o-y, accelerating vs Q4 18 (+11.9% y-o-y), supported by
smartphone sales and continuing revenue growth from SMIP and Business ICT.
Operating expenses totalled €1,201m and grew 5.0% y-o-y driven by higher value handset sales, non-mobile business
growth and higher Annual License Fee payments (ALFs) in the quarter. Supplies (€586m) grew by 9.0% y-o-y mainly
because of cost increases in higher value hardware and other services. Personnel expenses amounted to €119m in Q1
and increased by 9.5% y-o-y (non-comparable variation vs. Q4 18). Other expenses (€496m) were broadly stable at 0.2%
y-o-y with higher ALFs mitigating the declining trend last quarter.
OIBDA totalled €504m in the quarter with the IFRS 16 accounting change having a positive impact of €55m. OIBDA
growth of 3.4% y-o-y was mainly driven by ongoing healthy top-line performance which more than offset higher
operating expenses. OIBDA margin decreased by -0.5 p.p. y-o-y.
CapEx in the quarter amounted to €185m, broadly stable y-o-y and reflects continuing investment in network capacity
and customer experience. Operating cash flow (OIBDA-CapEx) reached €319m in the first quarter and improved by 5.8%
y-o-y.

26
RESULTS JANUARY | MARCH 2019
TELEFÓNICA UK
CONSOLIDATED INCOME STATEMENT
Unaudited figures (Euros in millions)
2019 2018 Reported Organic
Revenues 1,691 1,586 6.6 5.3
Mobile service revenues 1,182 1,163 1.7 0.5
Data revenues 679 669 1.6 0.4
Handset revenues and other 508 423 20.1 18.7
Internal expenditure capitalised in fixed assets 37 29 29.4 27.8
Operating expenses (1,201) (1,181) 1.7 5.0
Supplies (586) (534) 9.9 9.0
Personnel expenses (119) (107) 10.8 9.5
Other operating expenses (496) (540) (8.2) 0.2
Other net income (expense) (23) (4) n.m. n.m.
Gain (loss) on sale of fixed assets - - - -
Impairment of goodwill and other assets - - - -
Operating income before D&A (OIBDA) 504 430 17.3 3.4
OIBDA Margin 29.8% 27.1% 2.7 p.p. (0.5 p.p.)
CapEx 185 183 1.4 0.2
Spectrum - - - -
OpCF (OIBDA-CapEx) 319 247 29.0 5.8
- OIBDA before management and brand fees.
% Chg
Notes:
January - March
- January-March 2019 results reported under accounting standards IFRS 16, effective since January 2019. January-March
2018 results reported under prior accounting IAS 17.
TELEFÓNICA UK
ACCESSES
Unaudited figures (Thousands)
March June September December March % Chg
Fixed telephony accesses (1) 285.8 296.1 301.3 306.9 309.3 8.2
Internet and data accesses 25.7 26.6 27.7 28.1 28.4 10.5
Broadband 25.7 26.6 27.7 28.1 28.4 10.5
Mobile accesses 24,775.3 24,758.7 24,821.4 25,044.1 25,056.2 1.1
Prepay 8,959.1 8,858.3 8,804.0 8,742.6 8,534.6 (4.7)
Contract 15,816.2 15,900.3 16,017.4 16,301.4 16,521.6 4.5
M2M 3,370.1 3,411.7 3,408.3 3,578.0 3,785.2 12.3
Wholesale accesses 7,247.1 7,340.0 7,457.2 7,599.2 7,690.1 6.1
Mobile wholesale accesses 7,247.1 7,340.0 7,457.2 7,599.2 7,690.1 6.1
Total accesses 32,334.0 32,421.4 32,607.6 32,978.3 33,084.0 2.3
MOBILE ACCESSES
Unaudited figures (Thousands)
March June September December March % Chg
Retail mobile accesses 24,775.3 24,758.7 24,821.4 25,044.1 25,056.2 1.1
Wholesale mobile accesses 7,247.1 7,340.0 7,457.2 7,599.2 7,690.1 6.1
Total mobile accesses 32,022.4 32,098.6 32,278.6 32,643.2 32,746.3 2.3
SELECTED OPERATIONAL DATA
Unaudited figures
March June September December March % Chg
Contract percentage (%) 63.8% 64.2% 64.5% 65.1% 65.9% 2.1 p.p.
Smartphones ('000) 15,917.8 15,979.7 15,824.1 16,302.8 16,325.0 2.6
Smartphone penetration (%) 77.2% 77.8% 76.8% 79.0% 79.8% 2.6 p.p.
LTE ('000) 12,773.3 12,500.3 13,362.6 13,502.1 13,728.1 7.5
LTE penetration (%) 59.7% 58.6% 62.4% 62.9% 64.5% 4.9 p.p.
Mobile churn (quarterly) 1.9% 1.9% 2.1% 1.9% 1.9% (0.0 p.p.)
Contract (1) 1.0% 1.0% 1.0% 1.0% 0.9% (0.1 p.p.)
Mobile churn (cumulative YTD) 1.9% 1.9% 2.0% 1.9% 1.9% (0.0 p.p.)
Contract (1) 1.0% 1.0% 1.0% 1.0% 0.9% (0.1 p.p.)
Mobile ARPU (EUR)(cumulative YTD) 14.7 15.0 15.1 15.1 14.6 (1.5)
Prepay 6.8 6.9 7.1 7.1 7.2 4.4
Contract (1) 24.2 24.7 24.8 24.6 23.7 (3.1)
Mobile data traffic (TB) (cumulative YTD) 126,797 274,846 442,731 613,219 177,868 40.3
(1) Excludes M2M.
2018 2019
(1) Includes fixed wireless and VoIP accesses.
2018 2019
2018 2019
Notes:
- Data traffic is defined as Terabytes used by the company customers, both upload and download (1TByte = 10^12 bytes). Promotional
traffic is included. Traffic not associated to the Company's mobile customers (roaming-in, MVNOs, interconnection of third parties and
other business lines) is also included. Traffic volume non-rounded.
- ARPU: monthly average revenue divided by the monthly average accesses of the period. % organic change.
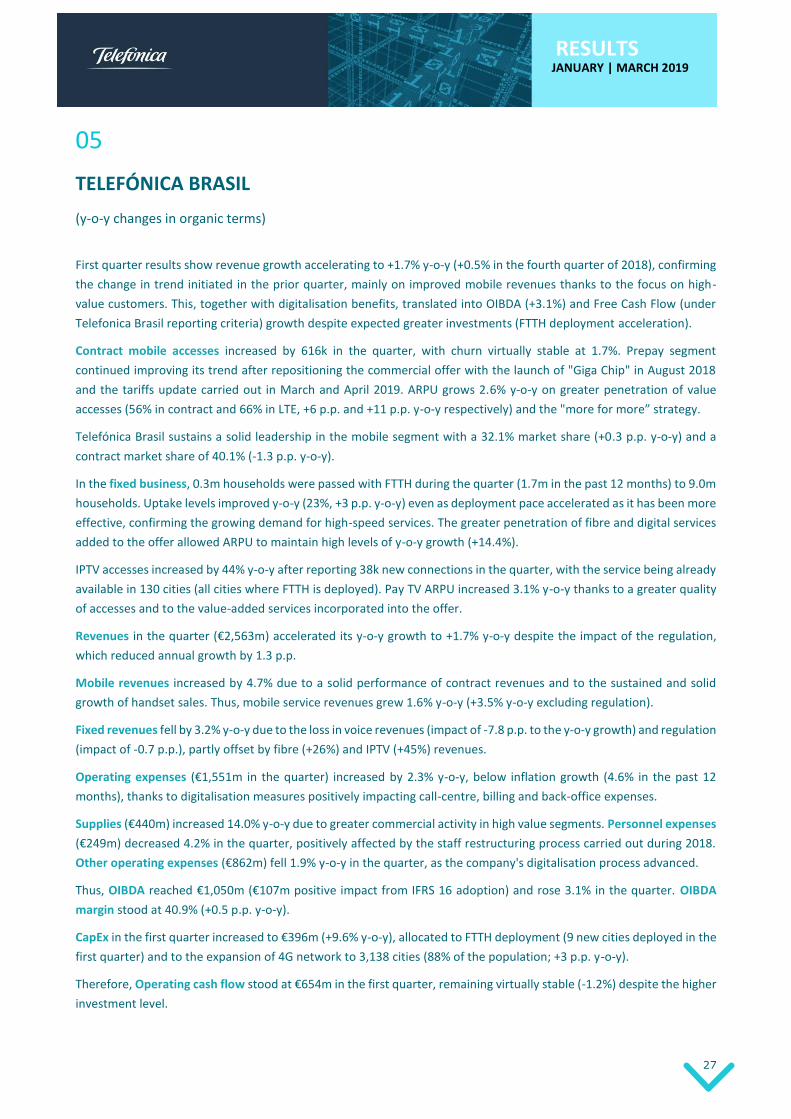
27
RESULTS JANUARY | MARCH 2019
05
TELEFÓNICA BRASIL
(y-o-y changes in organic terms)
First quarter results show revenue growth accelerating to +1.7% y-o-y (+0.5% in the fourth quarter of 2018), confirming
the change in trend initiated in the prior quarter, mainly on improved mobile revenues thanks to the focus on high-
value customers. This, together with digitalisation benefits, translated into OIBDA (+3.1%) and Free Cash Flow (under
Telefonica Brasil reporting criteria) growth despite expected greater investments (FTTH deployment acceleration).
Contract mobile accesses increased by 616k in the quarter, with churn virtually stable at 1.7%. Prepay segment
continued improving its trend after repositioning the commercial offer with the launch of "Giga Chip" in August 2018
and the tariffs update carried out in March and April 2019. ARPU grows 2.6% y-o-y on greater penetration of value
accesses (56% in contract and 66% in LTE, +6 p.p. and +11 p.p. y-o-y respectively) and the "more for more” strategy.
Telefónica Brasil sustains a solid leadership in the mobile segment with a 32.1% market share (+0.3 p.p. y-o-y) and a
contract market share of 40.1% (-1.3 p.p. y-o-y).
In the fixed business, 0.3m households were passed with FTTH during the quarter (1.7m in the past 12 months) to 9.0m
households. Uptake levels improved y-o-y (23%, +3 p.p. y-o-y) even as deployment pace accelerated as it has been more
effective, confirming the growing demand for high-speed services. The greater penetration of fibre and digital services
added to the offer allowed ARPU to maintain high levels of y-o-y growth (+14.4%).
IPTV accesses increased by 44% y-o-y after reporting 38k new connections in the quarter, with the service being already
available in 130 cities (all cities where FTTH is deployed). Pay TV ARPU increased 3.1% y-o-y thanks to a greater quality
of accesses and to the value-added services incorporated into the offer.
Revenues in the quarter (€2,563m) accelerated its y-o-y growth to +1.7% y-o-y despite the impact of the regulation,
which reduced annual growth by 1.3 p.p.
Mobile revenues increased by 4.7% due to a solid performance of contract revenues and to the sustained and solid
growth of handset sales. Thus, mobile service revenues grew 1.6% y-o-y (+3.5% y-o-y excluding regulation).
Fixed revenues fell by 3.2% y-o-y due to the loss in voice revenues (impact of -7.8 p.p. to the y-o-y growth) and regulation
(impact of -0.7 p.p.), partly offset by fibre (+26%) and IPTV (+45%) revenues.
Operating expenses (€1,551m in the quarter) increased by 2.3% y-o-y, below inflation growth (4.6% in the past 12
months), thanks to digitalisation measures positively impacting call-centre, billing and back-office expenses.
Supplies (€440m) increased 14.0% y-o-y due to greater commercial activity in high value segments. Personnel expenses
(€249m) decreased 4.2% in the quarter, positively affected by the staff restructuring process carried out during 2018.
Other operating expenses (€862m) fell 1.9% y-o-y in the quarter, as the company's digitalisation process advanced.
Thus, OIBDA reached €1,050m (€107m positive impact from IFRS 16 adoption) and rose 3.1% in the quarter. OIBDA
margin stood at 40.9% (+0.5 p.p. y-o-y).
CapEx in the first quarter increased to €396m (+9.6% y-o-y), allocated to FTTH deployment (9 new cities deployed in the
first quarter) and to the expansion of 4G network to 3,138 cities (88% of the population; +3 p.p. y-o-y).
Therefore, Operating cash flow stood at €654m in the first quarter, remaining virtually stable (-1.2%) despite the higher
investment level.

28
RESULTS JANUARY | MARCH 2019
TELEFÓNICA BRASIL
CONSOLIDATED INCOME STATEMENT
Unaudited figures (Euros in millions)
2019 2018 Reported Organic
Revenues 2,563 2,705 (5.2) 1.7
Mobile Business 1,654 1,696 (2.5) 4.7
Mobile service revenues 1,514 1,599 (5.3) 1.6
Data revenues 1,248 1,239 0.7 8.0
Handset revenues 140 97 44.5 55.1
Fixed Business 909 1,009 (9.9) (3.2)
FBB and new services (1) 470 458 2.4 10.0
Pay TV 110 118 (6.8) 0.0
Voice & access revenues 330 432 (23.7) (18.1)
Internal expenditure capitalised in fixed assets 33 30 8.5 16.5
Operating expenses (1,551) (1,740) (10.8) 2.3
Supplies (440) (504) (12.6) 14.0
Personnel expenses (249) (279) (10.7) (4.2)
Other operating expenses (862) (957) (9.9) (1.9)
Other net income (expense) (4) (15) (71.3) (69.2)
Gain (loss) on sale of fixed assets 10 (0) c.s. c.s.
Impairment of goodwill and other assets (0) 2 c.s. c.s.
Operating income before D&A (OIBDA) 1,050 982 6.9 3.1
OIBDA Margin 40.9% 36.3% 4.6 p.p. 0.5 p.p.
CapEx 396 388 2.1 9.6
Spectrum - - - -
OpCF (OIBDA-CapEx) 654 594 10.0 (1.2)
Notes:
January - March % Chg
(1) Includes broadband connectivity services (retail and wholesale), including value added services, ICT revenues, other
services over connectivity and FBB equipment.
- OIBDA before management and brand fees.
- January-March 2019 results reported under accounting standards IFRS 16, effective since January 2019. January-March
2018 results reported under prior accounting IAS 17.
TELEFÓNICA BRASIL
ACCESSES
Unaudited figures (thousands)
March June September December March % Chg
Final Clients Accesses 97,905.1 97,897.8 96,817.2 95,287.2 95,091.7 (2.9)
Fixed telephony accesses (1) 13,679.5 13,459.7 13,209.6 13,004.6 12,557.9 (8.2)
Internet and data accesses 7,544.9 7,569.9 7,583.4 7,564.7 7,493.2 (0.7)
Broadband 7,476.6 7,489.9 7,502.6 7,485.2 7,414.4 (0.8)
FTTx/Cable 4,643.2 4,791.7 4,917.3 4,991.1 5,031.5 8.4
Mobile accesses 75,089.3 75,253.9 74,423.6 73,151.3 73,519.1 (2.1)
Prepay 37,599.0 36,827.1 35,017.0 32,754.4 32,506.2 (13.5)
Contract 37,490.3 38,426.8 39,406.7 40,396.9 41,012.8 9.4
M2M 6,664.9 7,105.5 7,628.7 8,203.3 8,674.5 30.2
Pay TV 1,591.5 1,614.3 1,600.5 1,566.6 1,521.5 (4.4)
Total Accesses T. Brasil 97,919.1 97,912.7 96,832.0 95,302.0 95,106.4 (2.9)
2018 2019
(1) Includes fixed wireless and VoIP accesses.
SELECTED OPERATIONAL DATA
Unaudited figures
March June September December March % Chg
Contract percentage (%) 49.9% 51.1% 52.9% 55.2% 55.8% 5.9 p.p.
Smartphones ('000) 56,291.8 57,636.1 58,725.5 57,834.5 56,282.3 (0.0)
Smartphone penetration (%) 83.8% 86.0% 89.3% 90.4% 88.1% 4.3 p.p.
LTE ('000) 37,566.4 39,404.1 40,325.9 41,103.8 42,956.1 14.3
LTE penetration (%) 54.9% 57.8% 60.4% 63.3% 66.2% 11.3 p.p.
Mobile churn (quarterly) 3.1% 3.0% 3.7% 4.1% 3.2% 0.1 p.p.
Contract (1) 1.6% 1.8% 1.9% 1.7% 1.7% 0.1 p.p.
Mobile churn (cumulative YTD) 3.1% 3.0% 3.3% 3.5% 3.2% 0.1 p.p.
Contract (1) 1.6% 1.7% 1.8% 1.7% 1.7% 0.1 p.p.
Mobile ARPU (EUR)(cumulative YTD) 7.0 6.6 6.4 6.4 6.7 2.6
Prepay 3.2 3.0 2.8 2.8 2.8 (6.1)
Contract (1) 13.0 12.4 11.9 11.9 12.2 0.6
Mobile data traffic (TB) (cumulative YTD) 228,836 477,228 777,616 1,110,125 381,864 66.9
Fixed telephony ARPU (EUR) (cumulative YTD) 10.3 9.8 9.3 9.1 8.4 (12.5)
Pay TV ARPU (EUR) (cumulative YTD) 24.7 23.9 23.3 23.5 23.8 3.1
Broadband ARPU (EUR) (cumulative YTD) 13.2 12.7 12.6 13.0 14.0 14.4
Fixed data traffic (TB) (cumulative YTD) 4,838,067 10,190,227 15,949,403 21,954,704 6,201,789 28.2
- ARPU: monthly average revenue divided by the monthly average accesses of the period. % organic change.
- Data traffic is defined as Terabytes used by the company customers, both upload and download (1TByte = 10^12 bytes). Promotional traffic is
included. Traffic not associated to the Company's mobile customers (roaming-in, MVNOs, interconnection of third parties and other business
lines) is also included. Traffic volume non-rounded.
(1) Excludes M2M.
2018 2019
Notes:
29
RESULTS JANUARY | MARCH 2019
06
TELEFÓNICA HISPAM SUR
(y-o-y changes in organic terms)
Hispam Sur's first quarter results continued showing solid OIBDA growth (+7.0% y-o-y) leveraged on the good
performance of service revenues (+6 p.p. vs. the previous quarter on growing value accesses: contract, FTTx/cable and
pay TV) and despite inflationary pressures over operating expenses in Argentina.
Mobile accesses fell by 4% y-o-y, even though their quality increased resulting in a growth of contract penetration (40%,
+3 p.p. y-o-y) and LTE penetration (40%, +8 p.p. y-o-y). Net contract additions were positive for the sixth straight quarter
(45k new accesses, excluding the disconnection of 273k inactive accesses in Peru, with no revenue impact), being
noteworthy the positive net adds in Peru and Chile.
In the fixed business, the strategy remained focused on service bundling and FTTx and cable network deployment. Thus,
the region had already 8.8m passed premises as of March with an up-take of 30% after connecting 179k accesses in the
quarter (total connections: 2.7m). Pay TV accesses rose to 2.2m (+8% y-o-y) as a result of a solid performance in Peru
and the service launch in October in Argentina. 90 days-active users of “Movistar Play”, Telefonica’s OTT differential
service, rose to 511k after the service was launched in Argentina in March, with the service becoming now available in
all countries of the region.
Revenues in Q1 increased to €1,612m, +15.2% y-o-y, accelerating from +11.1% in Q4 18, despite a stronger regulatory
impact. Operating expenses increased 19.1% (+13.2% in Q4 18), affected by inflation in Argentina and partly offset by
lower subsidy costs and the positive impact of regulation over interconnection expenses in Chile and Peru.
OIBDA grew 7.0% y-o-y in the quarter (+7.4% in Q4) to €441m (€40m positive impact on IFRS 16 adoption). Argentina
decelerated its growth due to salary updates in the quarter, while Peru improved its y-o-y trend resulting from higher
service revenues and lower subsidies. OIBDA margin stood at 27.4% y-o-y (-2.0 p.p.).
CapEx was €243m in the first quarter (+33.8% y-o-y, as execution calendar was anticipated vs. the previous year in
Argentina in a context of favourable exchange rates), mainly allocated for 4G and FTTx and cable network deployment.
Telefónica Argentina reported growth in revenues and OIBDA in the first quarter (+40.0% and +17.4% respectively)
thanks to gains in value accesses, progressive tariffs updates and despite the impact of inflation over operating expenses
and the greater competitive intensity in the market. In October, Pay TV service (that boost the value of the fibre
network) was launched, whilst in March, the OTT service Movistar Play was also launched, aiming to improve customer
loyalty by providing added value to the service provided.
Reported results for January-March 2019 were affected by the accounting treatment of Argentina as a hyperinflationary
economy, resulting in €35m lower revenues, €21m lower OIBDA and €6m lower CapEx in reported terms in the first
quarter.
Mobile accesses (18.4m) fell by 2% y-o-y, mainly due to the decrease in prepay (-5%), partly affected by net migrations
of higher value customers to contract and the regulatory impact that requires the identification of prepay users since
March 2018 (no impact in revenues). In contract, accesses increased by 1%, despite reporting a net loss of 72k in the
quarter (+37k in Q1 18). LTE accesses grew by 16% y-o-y and penetration reached 44% (+7 p.p. y-o-y), while 4G coverage
stood at 85%.

30
RESULTS JANUARY | MARCH 2019
Retail broadband accesses (1.5m) decreased by 9%, affected by the loss of copper accesses due to the focus on fibre
deployment. Accesses connected to FTTx networks increased by 1.7 times y-o-y to 495k in March (26k connected in the
quarter), of which 421k connected with FTTH after increasing the number of premises passed to 2.3m (1.8m passed
with FTTH).
Revenues amounted to €543m in January-March (+40.0% y-o-y; +11.8 p.p. sequentially). Mobile service revenues
(€292m in the quarter) increased by 33.1% y-o-y, driven by the increase in ARPU (+35.3% y-o-y) and contract and LTE
accesses. Handset revenues rose by 28.1% y-o-y. Fixed revenues (€202m) increased by 54.1% y-o-y due to the growth
in fibre, tariff updates and the USD appreciation, which mainly affected B2B business.
Operating expenses (€408m in the quarter) increased by 51.9% y-o-y (+29.8% in Q4 18), affected by the impact of
inflation on personnel expenses (18% salary update in January), partly offset by the benefits from digitalisation.
OIBDA in the quarter totalled €145m (positively impacted by €9m following IFRS 16 adoption) and decelerated its
growth vs. the previous quarter (+17.4% y-o-y vs. +29.5% in Q4 18) as a consequence of the salary update in the quarter
above mentioned and the positive impact of the Universal Service adjustment in Q1 18 (excluding this impact, OIBDA
growth would have been similar to that seen in the previous quarter). OIBDA margin stood at 26.6% (-5.2 p.p. y-o-y).
CapEx in January-March amounted to €89m and increased by 49.0% y-o-y, mainly allocated to expanding the fibre and
4G network, and to the launch of IPTV service. It should be noted that the y-o-y change for the quarter cannot be
extrapolated to the full year, given the different execution levels of investment in both years. Operating cash flow
(OIBDA-CapEx) stood at €56m in the first quarter (-11.4% y-o-y).
In the first quarter Telefónica Chile maintained its value-focused strategy, presenting growth in contract (+11%) and
FTTx (+47%) accesses, which results in an improved service revenue trend, despite the tough competitive environment
and the regulatory impact (mobile termination rates are reduced by 80% since 26 January 2019).
Mobile accesses (8.2m) decreased by 8% y-o-y on prepay (-20%) due to the greater commercial intensity in the market
and migrations to contract. The latter reached 11% growth with +46k net additions in the quarter and positive balance
in portability. LTE accesses stood at 3.2m (+20% y-o-y) with a penetration of 42% (+10 p.p.).
Retail broadband accesses (1.1m) decreased by 1% y-o-y affected by the loss of copper accesses. Accesses connected
to FTTx amounted to 556k in March (+47% y-o-y; 412k FTTH connections, +121% y-o-y) on the back of the focus on
deployment (2.0m premises passed). Pay TV accesses (622k; -8% y-o-y) continued to be affected by the reduction in
DTH (-13%) and were partially offset by the good performance of IPTV accesses (+44%).
Revenues in the quarter (€498m) decreased by 2.9% y-o-y (-2.1% in Q4 18) affected by regulation; excluding this impact
the y-o-y trend improved by 0.9 p.p. Mobile service revenues (€212m) improved in y-o-y terms in comparison to the
previous quarter once excluding the regulatory impact (-1.7% ex-regulation vs. -2.7% in Q4 18), leveraged on ARPU
growth (+2.6%) on contract outgoing revenues evolution (+4.7%; +4.9 p.p. vs. previous quarter). Handset revenues
(€79m) growth decelerated to 2.1% y-o-y (+13.2% in Q4 18) on lower commercial activity. Fixed revenues (€208m,
-2.0% vs. -5.7% in Q4 18) were impacted by the decline in voice which was partially offset by the acceleration in FTTx
revenues (+45.0%; +1.5 p.p. vs. Q4 18).
Operating expenses (€338m) decreased by 3.9% y-o-y (-6.7% in Q4 18) thanks to lower commercial expenses,
implemented efficiency measures (mainly in network) and the positive impact of regulation on termination expenses.
OIBDA (€169m; positively impacted by €19m following IFRS 16 adoption) remained virtually stable y-o-y in the quarter
(-0.1%) slowing down its growth versus the previous quarter (+11.2%; impacted by a more favourable comparative base
in expenses). OIBDA margin stood at 33.8% in January-March (+0.8 p.p. y-o-y).

31
RESULTS JANUARY | MARCH 2019
CapEx amounted to €88m (+18.0% y-o-y) and was mainly allocated to the expansion of high-speed networks. It should
be noted that the y-o-y change for the quarter cannot be extrapolated to the full year, given the different execution
levels of investment in both years. Operating cash flow (OIBDA-CapEx) totalled €80m in Q1 and decreased by 18.0%
y-o-y.
Telefónica Perú's first quarter results showed a sequential improvement in revenues and OIBDA (+1.1 p.p. and +29.2
p.p. respectively). All this was leveraged on improved contract revenues and handset sales, and despite the intense
competitive environment and the regulatory changes (57% cut in mobile termination rate from 1 January).
Furthermore, it was also noteworthy the presentation of "Internet para Todos" (Internet for Everyone), a wholesale
rural mobile infrastructure operator, through which Telefónica, along with other partners such as Facebook, aims to
bring mobile broadband to remote populations under an economically sustainable business model based on open access
principles and new technologies.
Mobile accesses (13.3m) decreased by 2% y-o-y (excluding the disconnection of 273k inactive contract accesses with no
impact on revenues) affected by prepay accesses which fell by 5% due to intense competition in the market and to
migrations towards contract. However, contract accesses increased by 6% (excluding the aforementioned
disconnection), registering 66k new accesses in the quarter thanks to Telefónica's differential offer (strengthened since
the launch of Movistar Play and Movistar Total). Thus, the value mix continued improving as contract penetration
increased to 35% (+1 p.p. y-o-y) and LTE to 34% (+7 p.p.; 74% coverage).
Retail broadband accesses (2.0m) grew by 12% y-o-y with 69k quarterly net additions, highlighting growth in FTTx and
cable accesses (+40%; 1.6m connected; 1.4m connected with FTTH and cable). Premises passed with FTTx and cable
rose to 4.5m. Pay TV accesses (1.6m) increased by 11% y-o-y with 36k net additions in the quarter.
In the month of January, Movistar Total was launched as the only convergent offer in the market that integrates fixed
voice, broadband, mobile and pay TV services in a single product with a discount of around 20%.
Likewise, the impulse of the Movistar Play OTT service remained as a differential element in the fixed and mobile offer,
with 633k registered accesses as of March (378k active accesses in the last 90 days).
Revenues in the quarter totalled €518m (-1.7% y-o-y vs. -2.8% in Q4 18) and would have grown by 2.5% excluding the
regulatory impact, as a consequence of handset sales and fixed revenues that offset the decrease in prepay (accesses
and ARPU decrease due to the strong competitive environment). Mobile service revenues (€179m) decreased by 11.8%
y-o-y, although they improve their y-o-y trend (-17.3% in Q4 18) due to the improvement in contract revenues (+6.5 p.p.
vs. Q4 18 y-o-y change). Handset revenues (€81m) increased by 19.7% y-o-y in January-March as a consequence the
financed sales and the gradual removal of subsidies. Fixed business revenues in the quarter (€258) grew by 0.5% y-o-y
(+1.6% in Q4 18) due to the increase in broadband and new service revenues (+5.7% y-o-y), driven by new projects in
the B2B segment, which more than offset the effect of the change in the commercialisation of fixed equipment and the
decrease in voice revenues.
Operating expenses (€422m in the quarter) also improved the y-o-y trend (+0.6% vs. +8.4% in Q4) because of the subsidy
reduction and network savings and efficiencies.
Thus, OIBDA in the quarter amounted to €107m (€12m positive impact on IFRS 16 adoption), improving the trend of
previous quarters (-7.9% y-o-y; -37.1% in Q4 18). OIBDA margin stood at 20.7% (-1.2 p.p. y-o-y).
CapEx in January-March (€61m; +21.9% y-o-y) focused on deploying 4G mobile network, fibre and cable networks as
well as on improving service quality. Operating cash flow (OIBDA- CapEx) stood at €46m (-35.7% y-o-y).

32
RESULTS JANUARY | MARCH 2019
TELEFÓNICA HISPAM SUR
SELECTED FINANCIAL DATA
Unaudited figures (Euros in millions)
2019 2018 Reported Organic
Revenues 1,612 1,833 (12.1) 15.2
Telefónica Argentina 543 755 (28.0) 40.0
Telefónica Chile 498 526 (5.2) (2.9)
Telefónica Perú 518 501 3.5 (1.7)
Telefónica Uruguay 56 56 0.3 6.7
Others & eliminations (4) (4) (3.2) 64.5
Service revenues 1,399 1,611 (13.2) 15.2
Telefónica Argentina 495 682 (27.4) 41.2
Telefónica Chile 420 447 (6.1) (3.8)
Telefónica Perú 437 436 0.2 (4.9)
Telefónica Uruguay 51 50 1.3 7.8
Others & eliminations (4) (4) (3.4) 64.2
OIBDA 441 517 (14.6) 7.0
Telefónica Argentina 145 245 (40.8) 17.4
Telefónica Chile 169 153 9.8 (0.1)
Telefónica Perú 107 98 9.0 (7.9)
Telefónica Uruguay 21 21 1.9 6.9
Others & eliminations - - - -
CapEx 243 251 (3.4) 33.8
Telefónica Argentina 89 124 (28.0) 49.0
Telefónica Chile 88 76 15.2 18.0
Telefónica Perú 61 48 28.4 21.9
Telefónica Uruguay 5 4 26.7 34.8
Others & eliminations - - - -
Spectrum - 7 - -
Telefónica Argentina - 7 - -
Telefónica Chile - - - -
Telefónica Perú - - - -
Telefónica Uruguay - - - -
Others & eliminations - - - -
OpCF (OIBDA-CapEx) 199 266 (25.2) (17.1)
Telefónica Argentina 56 121 (53.9) (11.4)
Telefónica Chile 80 77 4.4 (18.0)
Telefónica Perú 46 51 (9.2) (35.7)
Telefónica Uruguay 16 17 (3.4) 0.8
Others & eliminations - - - -
Notes:
- OIBDA before management and brand fees.
- Following the consideration of the Argentine economy as hyperinflationary from an accounting perspective for
periods ended after 1 July 2018, the operations of Telefónica in Argentina adjusted by inflation are to be
accounted at the closing exchange rate Argentine Peso/Euro.
January - March % Chg
- January-March 2019 results reported under accounting standards IFRS 16, effective since January 2019. January-
March 2018 results reported under prior accounting IAS 17.

33
RESULTS JANUARY | MARCH 2019
TELEFÓNICA HISPAM SUR
CONSOLIDATED INCOME STATEMENT
Unaudited figures (Euros in millions)
2019 2018 Reported Organic
Revenues 1,612 1,833 (12.1) 15.2
Mobile Business 945 1,120 (15.6) 12.9
Mobile service revenues 732 898 (18.5) 12.2
Data revenues 486 535 (9.2) 35.6
Handset revenues 213 222 (3.9) 15.6
Fixed Business 666 713 (6.6) 18.6
FBB and new services revenues (1) 368 380 (3.3) 27.8
Pay TV revenues 133 133 0.4 (0.1)
Voice & access revenues 165 200 (17.6) 13.5
Internal expenditure capitalised in fixed assets 17 18 (6.8) 15.5
Operating expenses (1,201) (1,342) (10.5) 19.1
Supplies (452) (513) (11.8) 11.3
Personnel expenses (235) (271) (13.3) 30.6
Other operating expenses (514) (558) (8.0) 20.7
Other net income (expense) 13 8 54.9 120.1
Gain (loss) on sale of fixed assets 1 (0) c.s. c.s.
Impairment of goodwill and other assets - - - -
Operating income before D&A (OIBDA) 441 517 (14.6) 7.0
OIBDA Margin 27.4% 28.2% (0.8 p.p.) (2.0 p.p.)
CapEx 243 251 (3.4) 33.8
Spectrum - 7 - -
OpCF (OIBDA-CapEx) 199 266 (25.2) (17.1)
Notes:
- OIBDA before management and brand fees.
- January-March 2019 results reported under accounting standards IFRS 16, effective since January 2019. January-
March 2018 results reported under prior accounting IAS 17.
(1) Includes broadband connectivity services (retail and wholesale), including value added services, data and ICT
revenues, other services over connectivity and FBB equipment.
- Following the consideration of the Argentine economy as hyperinflationary from an accounting perspective for
periods ended after 1 July 2018, the operations of Telefónica in Argentina adjusted by inflation are to be
accounted at the closing exchange rate Argentine Peso/Euro.
January - March % Chg
TELEFÓNICA HISPAM SUR
ACCESSES
Unaudited figures (thousands)
March June September December March % Chg
Final Clients Accesses 57,783.3 57,531.8 56,723.6 56,889.9 55,788.5 (3.5)
Fixed telephony accesses (1) 7,811.1 7,684.6 7,549.9 7,435.2 7,301.3 (6.5)
Internet and data accesses 4,611.4 4,648.1 4,675.4 4,669.7 4,677.4 1.4
Broadband 4,492.4 4,528.3 4,554.9 4,549.5 4,553.7 1.4
FTTx/Cable 1,829.2 2,089.2 2,285.8 2,490.8 2,669.8 46.0
Mobile accesses 43,276.3 43,042.8 42,324.7 42,575.1 41,564.8 (4.0)
Prepay 26,973.7 26,386.8 25,504.3 25,571.6 24,788.4 (8.1)
Contract (2) 16,302.6 16,655.9 16,820.4 17,003.5 16,776.4 2.9
M2M 1,240.2 1,339.4 1,396.2 1,457.7 1,504.1 21.3
Pay TV 2,084.6 2,156.4 2,173.5 2,209.9 2,244.9 7.7
Total Acceses Hispam Sur 57,808.9 57,556.0 56,747.9 56,913.1 55,810.5 (3.5)
SELECTED OPERATIONAL DATA
Unaudited figures
March June September December March % Chg
Contract percentage (%) 37.7% 38.7% 39.7% 39.9% 40.4% 2.7 p.p.
Smartphones ('000) 21,331.4 21,507.3 21,056.7 21,370.3 21,208.8 (0.6)
Smartphone penetration (%) 51.4% 52.2% 52.1% 52.6% 53.6% 2.2 p.p.
LTE ('000) 13,713.1 13,777.7 14,694.1 15,980.2 16,175.7 18.0
LTE penetration (%) 32.6% 33.0% 36.0% 38.9% 40.4% 7.8 p.p.
2018 2019
(1) Includes fixed wireless and VoIP accesses.
2018 2019
(2) Includes the disconnection of 273 thousand inactive contract accesses in Perú in the first quarter 2019.
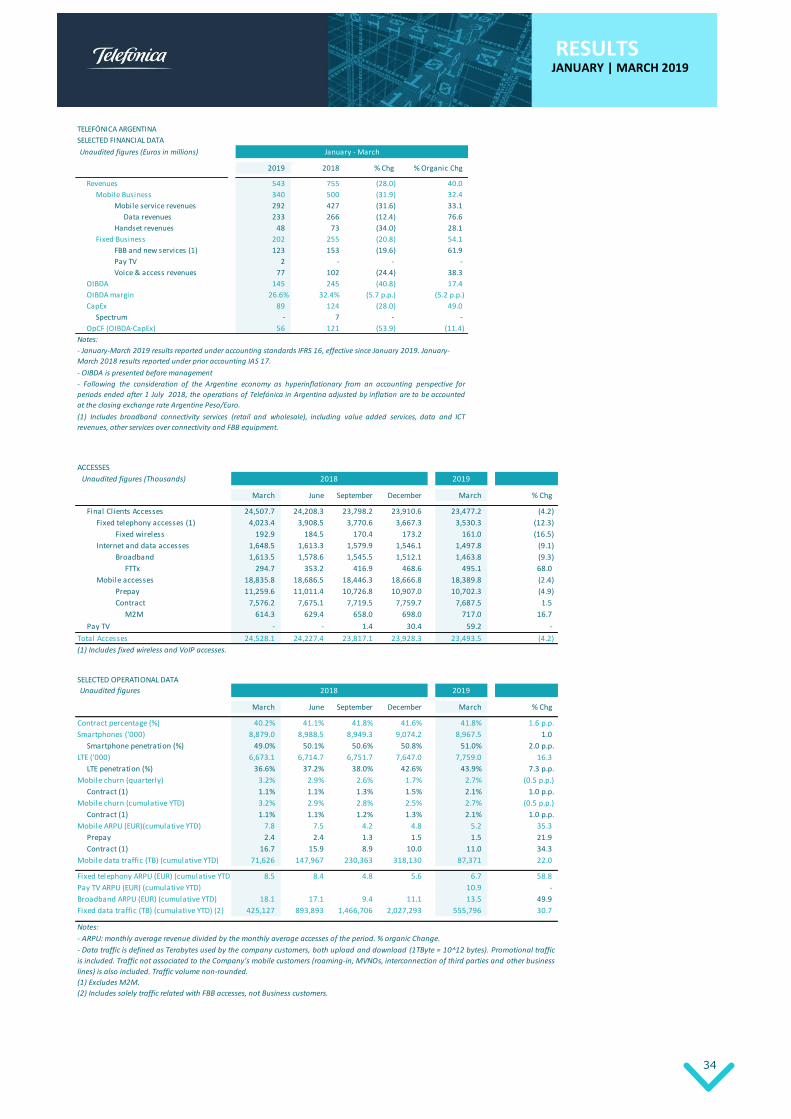
34
RESULTS JANUARY | MARCH 2019
TELEFÓNICA ARGENTINA
SELECTED FINANCIAL DATA
Unaudited figures (Euros in millions)
2019 2018 % Chg % Organic Chg
Revenues 543 755 (28.0) 40.0
Mobile Business 340 500 (31.9) 32.4
Mobile service revenues 292 427 (31.6) 33.1
Data revenues 233 266 (12.4) 76.6
Handset revenues 48 73 (34.0) 28.1
Fixed Business 202 255 (20.8) 54.1
FBB and new services (1) 123 153 (19.6) 61.9
Pay TV 2 - - -
Voice & access revenues 77 102 (24.4) 38.3
OIBDA 145 245 (40.8) 17.4
OIBDA margin 26.6% 32.4% (5.7 p.p.) (5.2 p.p.)
CapEx 89 124 (28.0) 49.0
Spectrum - 7 - -
OpCF (OIBDA-CapEx) 56 121 (53.9) (11.4)
Notes:
January - March
- OIBDA is presented before management
(1) Includes broadband connectivity services (retail and wholesale), including value added services, data and ICT
revenues, other services over connectivity and FBB equipment.
- January-March 2019 results reported under accounting standards IFRS 16, effective since January 2019. January-
March 2018 results reported under prior accounting IAS 17.
- Following the consideration of the Argentine economy as hyperinflationary from an accounting perspective for
periods ended after 1 July 2018, the operations of Telefónica in Argentina adjusted by inflation are to be accounted
at the closing exchange rate Argentine Peso/Euro.
ACCESSES
Unaudited figures (Thousands)
March June September December March % Chg
Final Clients Accesses 24,507.7 24,208.3 23,798.2 23,910.6 23,477.2 (4.2)
Fixed telephony accesses (1) 4,023.4 3,908.5 3,770.6 3,667.3 3,530.3 (12.3)
Fixed wireless 192.9 184.5 170.4 173.2 161.0 (16.5)
Internet and data accesses 1,648.5 1,613.3 1,579.9 1,546.1 1,497.8 (9.1)
Broadband 1,613.5 1,578.6 1,545.5 1,512.1 1,463.8 (9.3)
FTTx 294.7 353.2 416.9 468.6 495.1 68.0
Mobile accesses 18,835.8 18,686.5 18,446.3 18,666.8 18,389.8 (2.4)
Prepay 11,259.6 11,011.4 10,726.8 10,907.0 10,702.3 (4.9)
Contract 7,576.2 7,675.1 7,719.5 7,759.7 7,687.5 1.5
M2M 614.3 629.4 658.0 698.0 717.0 16.7
Pay TV - - 1.4 30.4 59.2 -
Total Accesses 24,528.1 24,227.4 23,817.1 23,928.3 23,493.5 (4.2)
SELECTED OPERATIONAL DATA
Unaudited figures
March June September December March % Chg
Contract percentage (%) 40.2% 41.1% 41.8% 41.6% 41.8% 1.6 p.p.
Smartphones ('000) 8,879.0 8,988.5 8,949.3 9,074.2 8,967.5 1.0
Smartphone penetration (%) 49.0% 50.1% 50.6% 50.8% 51.0% 2.0 p.p.
LTE ('000) 6,673.1 6,714.7 6,751.7 7,647.0 7,759.0 16.3
LTE penetration (%) 36.6% 37.2% 38.0% 42.6% 43.9% 7.3 p.p.
Mobile churn (quarterly) 3.2% 2.9% 2.6% 1.7% 2.7% (0.5 p.p.)
Contract (1) 1.1% 1.1% 1.3% 1.5% 2.1% 1.0 p.p.
Mobile churn (cumulative YTD) 3.2% 2.9% 2.8% 2.5% 2.7% (0.5 p.p.)
Contract (1) 1.1% 1.1% 1.2% 1.3% 2.1% 1.0 p.p.
Mobile ARPU (EUR)(cumulative YTD) 7.8 7.5 4.2 4.8 5.2 35.3
Prepay 2.4 2.4 1.3 1.5 1.5 21.9
Contract (1) 16.7 15.9 8.9 10.0 11.0 34.3
Mobile data traffic (TB) (cumulative YTD) 71,626 147,967 230,363 318,130 87,371 22.0
Fixed telephony ARPU (EUR) (cumulative YTD) 8.5 8.4 4.8 5.6 6.7 58.8
Pay TV ARPU (EUR) (cumulative YTD) 10.9 -
Broadband ARPU (EUR) (cumulative YTD) 18.1 17.1 9.4 11.1 13.5 49.9
Fixed data traffic (TB) (cumulative YTD) (2) 425,127 893,893 1,466,706 2,027,293 555,796 30.7
- ARPU: monthly average revenue divided by the monthly average accesses of the period. % organic Change.
(2) Includes solely traffic related with FBB accesses, not Business customers.
- Data traffic is defined as Terabytes used by the company customers, both upload and download (1TByte = 10^12 bytes). Promotional traffic
is included. Traffic not associated to the Company's mobile customers (roaming-in, MVNOs, interconnection of third parties and other business
lines) is also included. Traffic volume non-rounded.
Notes:
(1) Excludes M2M.
2018 2019
(1) Includes fixed wireless and VoIP accesses.
2018 2019

35
RESULTS JANUARY | MARCH 2019
TELEFÓNICA CHILE
SELECTED FINANCIAL DATA
Unaudited figures (Euros in millions)
2019 2018 % Chg % Organic Chg
Revenues 498 526 (5.2) (2.9)
Mobile Business 290 308 (5.8) (3.5)
Mobile service revenues 212 230 (7.7) (5.5)
Data revenues 116 119 (3.2) 1.6
Handset revenues 79 79 (0.4) 2.1
Fixed Business 208 217 (4.3) (2.0)
FBB and new services (1) 113 110 3.2 5.8
Pay TV 52 58 (10.3) (8.1)
Voice & access revenues 43 50 (14.1) (12.0)
OIBDA 169 153 9.8 (0.1)
OIBDA margin 33.8% 29.2% 4.6 p.p. 0.8 p.p.
CapEx 88 76 15.2 18.0
Spectrum - - - -
OpCF (OIBDA-CapEx) 80 77 4.4 (18.0)
Notes:
- OIBDA is presented before management and brand fees.
January - March
(1) Includes broadband connectivity services (retail and wholesale), including value added services, data and ICT
revenues, other services over connectivity and FBB equipment.
- January-March 2019 results reported under accounting standards IFRS 16, effective since January 2019. January-
March 2018 results reported under prior accounting IAS 17.
ACCESSES
Unaudited figures (Thousands)
March June September December March % Chg
Final Clients Accesses 12,061.9 11,887.5 11,836.3 11,591.5 11,133.4 (7.7)
Fixed telephony accesses (1) 1,289.1 1,273.5 1,251.9 1,222.4 1,176.4 (8.7)
Internet and data accesses 1,141.9 1,151.0 1,156.1 1,150.2 1,133.8 (0.7)
Broadband 1,089.2 1,097.8 1,102.0 1,095.8 1,078.9 (0.9)
FTTx 379.0 421.5 475.1 522.9 556.0 46.7
Mobile accesses 8,957.4 8,783.8 8,758.8 8,567.5 8,201.1 (8.4)
Prepay 5,658.8 5,391.6 5,245.6 4,957.7 4,545.1 (19.7)
Contract 3,298.5 3,392.2 3,513.2 3,609.8 3,656.0 10.8
M2M 422.1 426.8 440.8 441.0 463.7 9.9
Pay TV 673.6 679.2 669.5 651.3 622.0 (7.6)
Total Accesses 12,067.0 11,892.6 11,841.7 11,597.0 11,139.0 (7.7)
SELECTED OPERATIONAL DATA
Unaudited figures
March June September December March % Chg
Contract percentage (%) 36.8% 38.6% 40.1% 42.1% 44.6% 7.8 p.p.
Smartphones ('000) 3,344.5 3,411.8 3,437.9 3,531.6 3,490.5 4.4
Smartphone penetration (%) 40.5% 42.2% 42.7% 44.9% 46.6% 6.1 p.p.
LTE ('000) 2,700.0 2,823.9 3,035.2 3,207.0 3,237.8 19.9
LTE penetration (%) 31.6% 33.8% 36.5% 39.5% 41.8% 10.2 p.p.
Mobile churn (quarterly) 3.4% 3.5% 2.9% 3.9% 4.2% 0.8 p.p.
Contract (1) 2.2% 2.3% 2.3% 2.8% 2.8% 0.6 p.p.
Mobile churn (cumulative YTD) 3.4% 3.5% 3.3% 3.4% 4.2% 0.8 p.p.
Contract (1) 2.2% 2.3% 2.3% 2.5% 2.8% 0.6 p.p.
Mobile ARPU (EUR)(cumulative YTD) 8.5 7.9 7.9 7.9 7.8 2.6
Prepay 2.3 2.2 2.2 2.1 1.8 (20.4)
Contract (1) 22.1 20.0 19.6 19.3 17.7 (9.3)
Mobile data traffic (TB) (cumulative YTD) 74,641 162,246 260,842 365,241 107,858 44.5
Fixed telephony ARPU (EUR) (cumulative YTD) 11.8 11.7 11.4 11.4 10.9 (5.4)
Pay TV ARPU (EUR) (cumulative YTD) 22.8 23.1 22.5 22.2 22.2 (0.2)
Broadband ARPU (EUR) (cumulative YTD) 17.1 17.1 16.7 16.5 16.6 (0.5)
Fixed data traffic (TB) (cumulative YTD) (2) 524,361 1,133,870 1,794,715 2,480,494 752,143 43.4
(2) Includes solely traffic related with FBB accesses, not Business customers.
- ARPU: monthly average revenue divided by the monthly average accesses of the period. % organic Change .
- Data traffic is defined as Terabytes used by the company customers, both upload and download (1TByte = 10^12 bytes). Promotional traffic
is included. Traffic not associated to the Company's mobile customers (roaming-in, MVNOs, interconnection of third parties and other
business lines) is also included. Traffic volume non-rounded.
(1) Excludes M2M.
2018 2019
(1) Includes fixed wireless and VoIP accesses.
2018 2019
Notes:

36
RESULTS JANUARY | MARCH 2019
TELEFÓNICA PERÚ
SELECTED FINANCIAL DATA
Unaudited figures (Euros in millions) 2019 2018 % Chg % Organic Chg
Revenues 518 501 3.5 (1.7)
Mobile Business 260 257 1.3 (3.8)
Mobile service revenues 179 192 (7.0) (11.8)
Data revenues 110 122 (10.5) (15.0)
Handset revenues 81 65 26.1 19.7
Fixed Business 258 244 5.9 0.5
FBB and new services (1) 134 120 11.3 5.7
Pay TV 79 74 5.9 0.5
Voice & access revenues 46 49 (7.1) (11.9)
OIBDA 107 98 9.0 (7.9)
OIBDA margin 20.7% 19.6% 1.0 p.p. (1.2 p.p.)
CapEx 61 48 28.4 21.9
Spectrum - - - -
OpCF (OIBDA-CapEx) 46 51 (9.2) (35.7)
Notes:
(1) Includes broadband connectivity services (retail and wholesale), including value added services, data and ICT revenues,
other services over connectivity and FBB equipment.
January - March
- January-March 2019 results reported under accounting standards IFRS 16, effective since January 2019. January-March
2018 results reported under prior accounting IAS 17.
- OIBDA is presented before management and brand fees.
ACCESSES
Unaudited figures (Thousands)
March June September December March % Chg
Fixed telephony accesses (1) 2,498.6 2,502.6 2,527.5 2,545.4 2,594.6 3.8
Fixed wireless 84.6 84.7 85.2 85.4 85.4 1.0
Internet and data accesses 1,821.0 1,883.8 1,939.5 1,973.3 2,045.8 12.3
Broadband 1,789.7 1,852.0 1,907.4 1,941.5 2,010.9 12.4
FTTx/Cable 1,155.5 1,314.6 1,393.8 1,499.2 1,618.7 40.1
Mobile accesses 13,816.4 13,915.5 13,474.9 13,664.8 13,308.9 (3.7)
Prepay 9,093.0 9,038.0 8,597.2 8,744.0 8,594.4 (5.5)
Contract (2) 4,723.5 4,877.5 4,877.7 4,920.8 4,714.5 (0.2)
M2M 112.4 187.1 199.5 217.7 217.3 93.4
Pay TV 1,411.0 1,477.1 1,502.6 1,528.1 1,563.7 10.8
Total Accesses 19,547.1 19,779.1 19,444.4 19,711.7 19,513.0 (0.2)
SELECTED OPERATIONAL DATA
Unaudited figures
March June September December March % Chg
Contract percentage (%) 34.2% 35.1% 36.2% 36.0% 35.4% 1.2 p.p.
Smartphones ('000) 8,230.3 8,231.3 7,803.0 7,873.5 7,858.5 (4.5)
Smartphone penetration (%) 60.4% 60.3% 59.1% 58.9% 60.4% (0.0 p.p.)
LTE ('000) 3,725.1 3,586.3 4,217.9 4,391.3 4,437.6 19.1
LTE penetration (%) 27.2% 26.1% 31.9% 32.7% 33.9% 6.7 p.p.
Mobile churn (quarterly) 5.8% 6.2% 7.1% 6.8% 6.8% 1.0 p.p.
Contract (1)(2) 3.0% 3.2% 3.5% 3.3% 3.0% (0.1 p.p.)
Mobile churn (cumulative YTD) 5.8% 6.2% 6.5% 6.6% 6.8% 1.0 p.p.
Contract (1)(2) 3.0% 3.2% 3.3% 3.3% 3.0% (0.1 p.p.)
Mobile ARPU (EUR)(cumulative YTD) 5.2 4.4 4.4 4.4 4.2 (11.6)
Prepay 1.8 1.7 1.7 1.8 1.7 (11.5)
Contract (1)(2) 12.0 9.6 9.5 9.5 9.1 (12.1)
Mobile data traffic (TB) (cumulative YTD) 62,196 133,741 224,923 326,110 114,944 84.8
Fixed telephony ARPU (EUR) (cumulative YTD) 5.8 5.8 5.8 5.8 5.0 (18.4)
Pay TV ARPU (EUR) (cumulative YTD) 17.5 17.6 17.5 17.4 16.9 (8.4)
Broadband ARPU (EUR) (cumulative YTD) 12.6 12.7 12.7 12.7 12.5 (5.8)
Fixed data traffic (TB) (cumulative YTD) (3) 752,346 1,559,607 2,463,278 3,499,664 1,263,115 67.9
Notes:
(2) Includes the disconnection of 273 thousand inactive contract accesses in the first quarter 2019.
(2) Excludes the disconnection of 273 thousand inactive contract accesses in the first quarter 2019.
(3) Includes solely traffic related with FBB accesses, not Business customers.
- ARPU: monthly average revenue divided by the monthly average accesses of the period. % organic change.
- Data traffic is defined as Terabytes used by the company customers, both upload and download (1TByte = 10^12 bytes). Promotional traffic
is included. Traffic not associated to the Company's mobile customers (roaming-in, MVNOs, interconnection of third parties and other business
lines) is also included. Traffic volume non-rounded.
(1) Excludes M2M.
2018 2019
(1) Includes fixed wireless and VoIP accesses.
2018 2019

37
RESULTS JANUARY | MARCH 2019
07
TELEFÓNICA HISPAM NORTE
(y-o-y changes in organic terms)
Hispam Norte, revenues in the first quarter of 2019 returned to positive y-o-y growth (+1.2%; -2.4% in Q4 18), driven
by Colombia and Central America’s growth, and the improvement seen in Mexico even despite the highly competitive
intensity remained in the entire region. Likewise, commercial results (excluding Guatemala’s accesses in 2018 that, after
the closing of its sale in January 2019, are no longer included in the consolidation perimeter) continued to present a
solid growth in value accesses (contract, LTE and FTTx).
Total accesses (excluding Guatemala) remained virtually stable (69.7m) and mobile accesses rose 1% to 64.5m, worth
highlighting the performance in Colombia with positive net additions for the 8th consecutive quarter. Contract accesses
(excluding Guatemala) increased 3% y-o-y, with +39k net additions in the quarter, LTE accesses grew 43% (33%
penetration; +10 p.p. y-o-y) and LTE population coverage increased by +7 p.p. y-o-y to 54%.
Retail broadband accesses rose 8% as the fibre deployment accelerated (1.2m premises passed with FTTx as of March,
of which 51% with FTTH), boosting FTTx (+82% y-o-y) and FTTH connections (representing 39% of FTTx accesses; +21
p.p. y-o-y). Pay TV accesses decreased 3% y-o-y, affected by the worse service performance in Venezuela.
Revenues (€971m) increased 1.2% y-o-y in the quarter, mainly led by Colombia and Central America’s growth
acceleration together with Mexico's return to positive growth (for the first time in 5 quarters). Additionally, service
revenue also improved its y-o-y trend compared to Q4 (-0.9% vs. -5.0%) highlighting the solid growth in Colombia.
Operating expenses (€737m) grew 8.1% y-o-y and were affected by the negative impact of 2.5 GHz and 1,900 MHz
spectrum commitments in Mexico recorded as OpEx (€25m, first quarter with full impact).
OIBDA (€263m, €45m positive impact as a consequence of changes following IFRS 16 adoption) decreased 14.9% y-o-y
in the quarter and OIBDA margin stood at 27.1% (-4.3 p.p. y-o-y), mainly affected by the spectrum commitments
mentioned before and by the significant price drop in the Mexican market, partially offset by Colombia and Central
America’s growth.
CapEx (€78m; +16.6% y-o-y) was primarily allocated to LTE and fibre networks coverage. It should be noted that the
y-o-y change for the quarter cannot be extrapolated to the full year, given the different execution levels of investment
in both years. In the quarter €18m were registered for 30 MHz spectrum renewal in the 1,900 MHz band in El Salvador.
The operating cash flow (OIBDA-CapEx) decreased 22.8% when compared to the first quarter of 2018.
Telefónica Colombia continued presenting a solid commercial performance, which lead to positive net additions in the
high value segments (mainly FTTx and contract), which was in turn translated into both revenues and OIBDA growth
(+3.8% and +3.2% respectively).
Mobile accesses amounted to 15.9m (+8% y-o-y) after posting +168k net additions in the quarter. Contract accesses
increased 4% with 34k positive net additions and positive net portability for the fifth consecutive quarter. Prepay
accesses grew 9% with 134k positive net additions in Q1 despite the competitive environment. LTE accesses rose 43%
(42% penetration; +10 p.p. y-o-y) after LTE population coverage increased by +4 p.p. y-o-y to 63%, while smartphones
reached a 46% penetration (+3 p.p. y-o-y).
FTTx accesses rose 82% y-o-y after reaching 1.2m premises passed (51% passed with FTTH). Therefore, FTTx represented
26% of retail broadband accesses, which remained affected by the loss in ADSL accesses (net loss of 13k broadband

38
RESULTS JANUARY | MARCH 2019
accesses in the quarter; -15k of ADSL). Likewise, Pay TV accesses decreased 1% y-o-y, worth highlighting the IPTV service
launch in the quarter, still as a pilot program.
Revenues (€359m) increased 3.8% y-o-y, driven by higher handset sales (+11.8%), by mobile service revenues (€185m;
+3.1% y-o-y) driven by a growth in accesses that offset the ARPU deterioration resulted from a stronger competitive
intensity seen since Q4 18, and by the fixed business revenues (€138m; +2.1%), which were pushed by broadband and
new services (+9.6% y-o-y).
Operating expenses (€248m) grew 7.4% y-o-y, mainly due to interconnection expenses (growth in traffic to all
destinations), commercial expenses (commercial activity acceleration) and Networks and IT (impact of the depreciation
of the peso against the dollar).
OIBDA (€131m positive €6m impact as a consequence of changes following IFRS 16 adoption) rose 3.2% y-o-y and was
positively affected by €12m capital gains from assets sales. The OIBDA margin stood at 36.6% (-0.2 p.p. y-o-y).
CapEx (€37m) increased 64.4% y-o-y (y-o-y change for the quarter cannot be extrapolated to the full year, given the
different execution levels of investment in both years). Operating cash flow (OIBDA-CapEx) amounted to €95m (-10.4%
y-o-y).
Telefónica México revenues improved from the previous quarter, increasing y-o-y (+1.2%) for the first time in 5 quarters
despite the high competitive intensity in the market that, together with the 2.5 GHz and 1,900 MHz spectrum
commitments recorded as OpEx, continued to penalise OIBDA results.
The company continued improving its competitive offer by launching Movistar Play on 21 March and the “plan lealtad”
(“loyalty plan”) which aims to improve prepay customer loyalty through additional benefits for those that make frequent
top-ups.
Mobile accesses amounted to 25.5m (+1% y-o-y) and contract rose 3%, representing 9% of total mobile accesses. The
plan that offers unlimited voice and data services reached 133k accesses at the end of March, after its launch in
November 2018. In prepay, accesses grew 1% despite the strong competitive intensity. LTE accesses rose 29% (29%
penetration; +6 p.p.) and LTE population coverage increased by +4 p.p. y-o-y to 56%.
In the fixed business, “internet en el hogar” ("internet at home"; broadband offered through mobile network) reached
76k accesses after posting +7k net additions in Q1.
Revenues in the quarter (€296m) increased 1.2% y-o-y, driven by handset revenues (+24.0% y-o-y) and an improvement
in service revenues’ trend. Service revenues (-4.5% in Q1 19 vs. -14.1% in Q4 18) remained affected by the competitive
aggressiveness mainly in prepay and were partially offset by the lower regulatory impact (deducting 0.4 p.p. from y-o-y
growth vs. 6.5 p.p. in Q4 18) and by an improvement in contract ARPU (+10% when compared to the previous quarter
following tariff increases implemented in February and migrations to the new unlimited plan which has a higher ARPU
than the average).
Operating expenses (€281m) grew 18.4% y-o-y due to 2.5 GHz and 1,900 MHz spectrum commitments which have been
registered as OpEx since Q4 18, and were partially offset by lower commercial expenses and the efficiency plans
implemented by the company.
OIBDA (€22m, positive €19m impact as a consequence of the changes following IFRS 16 adoption) decreased
significantly affected by spectrum commitments, lower service revenues and regulation. Excluding both spectrum and
regulatory impacts, OIBDA y-o-y decline would have improved when compared to previous quarter.
CapEx (€12m) decreased 11.0% y-o-y. Operating cash flow (OIBDA-CapEx) amounted to €11m.
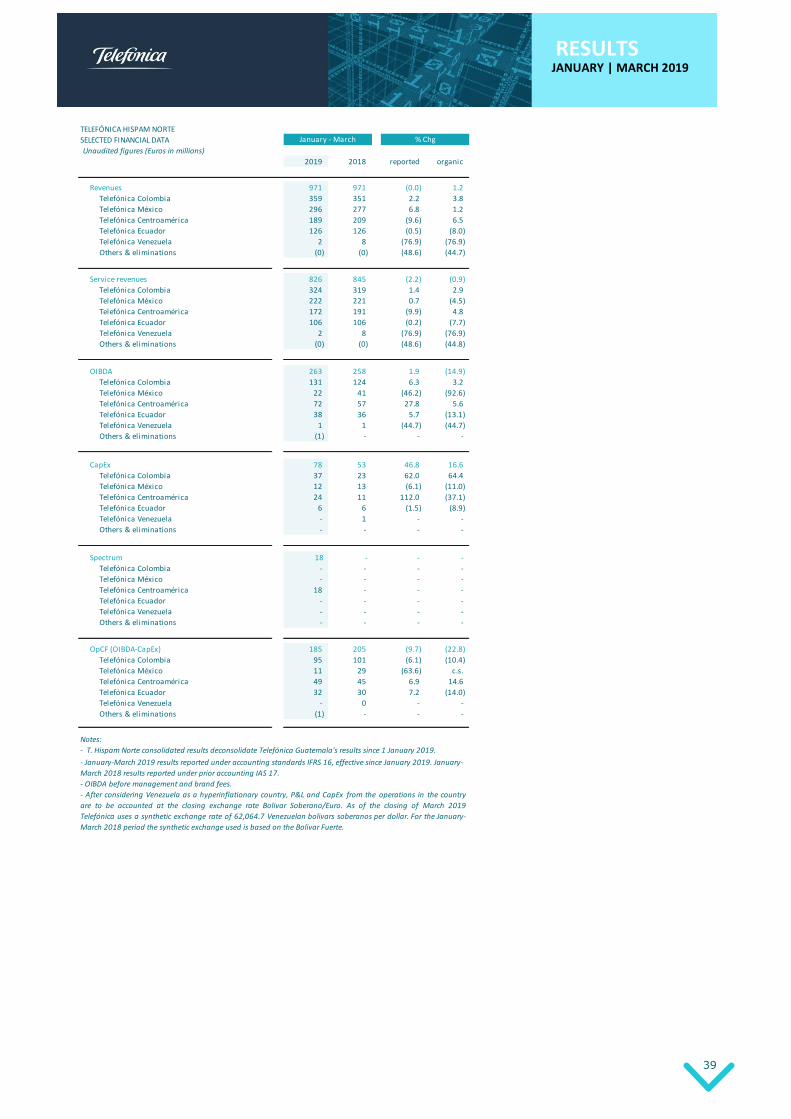
39
RESULTS JANUARY | MARCH 2019
TELEFÓNICA HISPAM NORTE
SELECTED FINANCIAL DATA
Unaudited figures (Euros in millions)
2019 2018 reported organic
Revenues 971 971 (0.0) 1.2
Telefónica Colombia 359 351 2.2 3.8
Telefónica México 296 277 6.8 1.2
Telefónica Centroamérica 189 209 (9.6) 6.5
Telefónica Ecuador 126 126 (0.5) (8.0)
Telefónica Venezuela 2 8 (76.9) (76.9)
Others & eliminations (0) (0) (48.6) (44.7)
Service revenues 826 845 (2.2) (0.9)
Telefónica Colombia 324 319 1.4 2.9
Telefónica México 222 221 0.7 (4.5)
Telefónica Centroamérica 172 191 (9.9) 4.8
Telefónica Ecuador 106 106 (0.2) (7.7)
Telefónica Venezuela 2 8 (76.9) (76.9)
Others & eliminations (0) (0) (48.6) (44.8)
OIBDA 263 258 1.9 (14.9)
Telefónica Colombia 131 124 6.3 3.2
Telefónica México 22 41 (46.2) (92.6)
Telefónica Centroamérica 72 57 27.8 5.6
Telefónica Ecuador 38 36 5.7 (13.1)
Telefónica Venezuela 1 1 (44.7) (44.7)
Others & eliminations (1) - - -
CapEx 78 53 46.8 16.6
Telefónica Colombia 37 23 62.0 64.4
Telefónica México 12 13 (6.1) (11.0)
Telefónica Centroamérica 24 11 112.0 (37.1)
Telefónica Ecuador 6 6 (1.5) (8.9)
Telefónica Venezuela - 1 - -
Others & eliminations - - - -
Spectrum 18 - - -
Telefónica Colombia - - - -
Telefónica México - - - -
Telefónica Centroamérica 18 - - -
Telefónica Ecuador - - - -
Telefónica Venezuela - - - -
Others & eliminations - - - -
OpCF (OIBDA-CapEx) 185 205 (9.7) (22.8)
Telefónica Colombia 95 101 (6.1) (10.4)
Telefónica México 11 29 (63.6) c.s.
Telefónica Centroamérica 49 45 6.9 14.6
Telefónica Ecuador 32 30 7.2 (14.0)
Telefónica Venezuela - 0 - -
Others & eliminations (1) - - -
Notes:
- T. Hispam Norte consolidated results deconsolidate Telefónica Guatemala's results since 1 January 2019.
% Chg
- January-March 2019 results reported under accounting standards IFRS 16, effective since January 2019. January-
March 2018 results reported under prior accounting IAS 17.
- OIBDA before management and brand fees.
- After considering Venezuela as a hyperinflationary country, P&L and CapEx from the operations in the country
are to be accounted at the closing exchange rate Bolivar Soberano/Euro. As of the closing of March 2019
Telefónica uses a synthetic exchange rate of 62,064.7 Venezuelan bolivars soberanos per dollar. For the January-
March 2018 period the synthetic exchange used is based on the Bolivar Fuerte.
January - March

40
RESULTS JANUARY | MARCH 2019
TELEFÓNICA HISPAM NORTE
CONSOLIDATED INCOME STATEMENT
Unaudited figures (Euros in millions)
2019 2018 reported organic
Revenues 971 971 (0.0) 1.2
Mobile Business 790 799 (1.1) (0.1)
Mobile service revenues 645 673 (4.1) (3.0)
Data revenues 390 399 (2.1) (3.2)
Handset revenues 145 126 14.8 15.4
Fixed Business 180 172 4.6 6.7
FBB and new services revenues (1) 106 92 15.4 16.6
Pay TV revenues 21 22 (2.2) (0.6)
Voice & access revenues 53 59 (9.8) (6.6)
Internal expenditure capitalised in fixed assets 11 12 (13.4) (10.9)
Operating expenses (737) (739) (0.4) 8.1
Supplies (308) (307) 0.3 13.0
Personnel expenses (84) (88) (4.0) 2.5
Other operating expenses (344) (344) (0.0) 5.2
Other net income (expense) 7 6 19.3 0.7
Gain (loss) on sale of fixed assets 12 9 35.3 108.6
Impairment of goodwill and other assets - - - -
Operating income before D&A (OIBDA) 263 258 1.9 (14.9)
OIBDA Margin 27.1% 26.6% 0.5 p.p. (4.3 p.p.)
CapEx 78 53 46.8 16.6
Spectrum 18 - - -
OpCF (OIBDA-CapEx) 185 205 (9.7) (22.8)
Notes:
- OIBDA before management and brand fees.
- January-March 2019 results reported under accounting standards IFRS 16, effective since January 2019. January-
March 2018 results reported under prior accounting IAS 17.
January - March % Chg
- T. Hispam Norte consolidated results deconsolidate Telefónica Guatemala's results since 1 January 2019.
- After considering Venezuela as a hyperinflationary country, P&L and CapEx from the operations in the country
are to be accounted at the closing exchange rate Bolivar Soberano/Euro. As of the closing of March 2019
Telefónica uses a synthetic exchange rate of 62,064.7 Venezuelan bolivars soberanos per dollar. For the January-
March 2018 period the synthetic exchange used is based on the Bolivar Fuerte.
(1) Includes broadband connectivity services (retail and wholesale), including value added services, data and ICT
revenues, other services over connectivity and FBB equipment.
TELEFÓNICA HISPAM NORTE
ACCESSES
Unaudited figures (thousands)
March June September December March % Chg
Final Clients Accesses 72,590.0 73,145.9 72,902.0 73,555.6 69,657.0 (4.0)
Fixed telephony accesses (1) 3,478.3 3,484.8 3,301.0 3,169.8 2,832.4 (18.6)
Internet and data accesses 1,253.1 1,274.7 1,332.3 1,337.1 1,124.9 (10.2)
Broadband 1,223.2 1,244.0 1,301.4 1,305.6 1,317.1 7.7
FTTx 167.7 284.4 302.7 303.7 305.5 82.1
Mobile accesses 66,857.0 67,355.8 67,233.7 68,041.1 64,513.3 (3.5)
Prepay 57,061.5 57,360.4 57,226.8 58,010.4 54,623.4 (4.3)
Contract 9,795.4 9,995.4 10,006.9 10,030.7 9,889.9 1.0
M2M 1,785.1 1,882.0 1,914.3 1,922.8 1,927.5 8.0
Pay TV 1,001.6 1,030.6 1,034.9 1,007.6 966.8 (3.5)
Total Acceses Hispam Norte 72,590.5 73,146.4 72,902.5 73,556.1 69,657.0 (4.0)
SELECTED OPERATIONAL DATA
Unaudited figures
March June September December March % Chg
Contract percentage (%) 14.7% 14.8% 14.9% 14.7% 15.3% 0.7 p.p.
Smartphones ('000) 30,059.4 29,995.2 31,376.2 31,960.9 31,644.3 5.3
Smartphone penetration (%) 46.6% 46.2% 48.4% 48.6% 50.9% 4.3 p.p.
LTE ('000) 14,761.5 16,069.9 17,392.6 19,506.4 20,373.8 38.0
LTE penetration (%) 22.7% 24.6% 26.6% 29.5% 32.6% 9.8 p.p.
2018 2019
- T. Guatemala accesses are excluded from 1 January of 2019
2018 2019
(1) Includes fixed wireless and VoIP accesses.
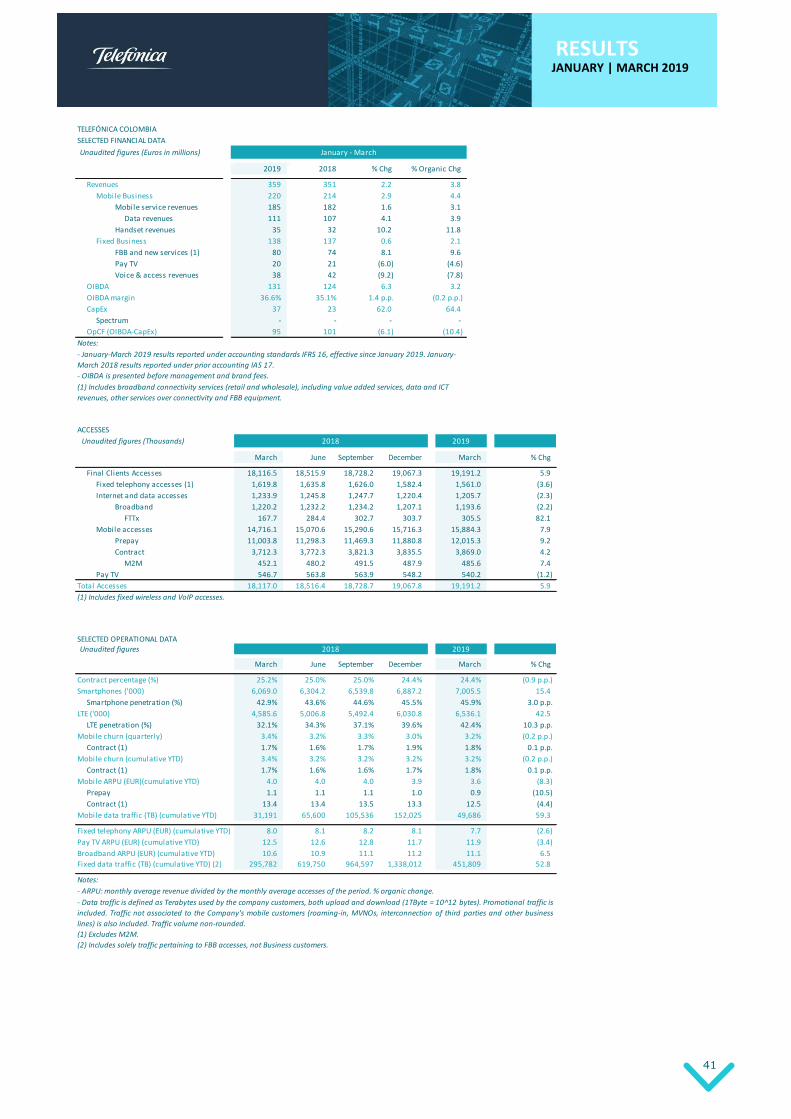
41
RESULTS JANUARY | MARCH 2019
TELEFÓNICA COLOMBIA
SELECTED FINANCIAL DATA
Unaudited figures (Euros in millions)
2019 2018 % Chg % Organic Chg
Revenues 359 351 2.2 3.8
Mobile Business 220 214 2.9 4.4
Mobile service revenues 185 182 1.6 3.1
Data revenues 111 107 4.1 3.9
Handset revenues 35 32 10.2 11.8
Fixed Business 138 137 0.6 2.1
FBB and new services (1) 80 74 8.1 9.6
Pay TV 20 21 (6.0) (4.6)
Voice & access revenues 38 42 (9.2) (7.8)
OIBDA 131 124 6.3 3.2
OIBDA margin 36.6% 35.1% 1.4 p.p. (0.2 p.p.)
CapEx 37 23 62.0 64.4
Spectrum - - - -
OpCF (OIBDA-CapEx) 95 101 (6.1) (10.4)
Notes:
January - March
(1) Includes broadband connectivity services (retail and wholesale), including value added services, data and ICT
revenues, other services over connectivity and FBB equipment.
- January-March 2019 results reported under accounting standards IFRS 16, effective since January 2019. January-
March 2018 results reported under prior accounting IAS 17.
- OIBDA is presented before management and brand fees.
ACCESSES
Unaudited figures (Thousands)
March June September December March % Chg
Final Clients Accesses 18,116.5 18,515.9 18,728.2 19,067.3 19,191.2 5.9
Fixed telephony accesses (1) 1,619.8 1,635.8 1,626.0 1,582.4 1,561.0 (3.6)
Internet and data accesses 1,233.9 1,245.8 1,247.7 1,220.4 1,205.7 (2.3)
Broadband 1,220.2 1,232.2 1,234.2 1,207.1 1,193.6 (2.2)
FTTx 167.7 284.4 302.7 303.7 305.5 82.1
Mobile accesses 14,716.1 15,070.6 15,290.6 15,716.3 15,884.3 7.9
Prepay 11,003.8 11,298.3 11,469.3 11,880.8 12,015.3 9.2
Contract 3,712.3 3,772.3 3,821.3 3,835.5 3,869.0 4.2
M2M 452.1 480.2 491.5 487.9 485.6 7.4
Pay TV 546.7 563.8 563.9 548.2 540.2 (1.2)
Total Accesses 18,117.0 18,516.4 18,728.7 19,067.8 19,191.2 5.9
SELECTED OPERATIONAL DATAUnaudited figures
March June September December March % Chg
Contract percentage (%) 25.2% 25.0% 25.0% 24.4% 24.4% (0.9 p.p.)
Smartphones ('000) 6,069.0 6,304.2 6,539.8 6,887.2 7,005.5 15.4
Smartphone penetration (%) 42.9% 43.6% 44.6% 45.5% 45.9% 3.0 p.p.
LTE ('000) 4,585.6 5,006.8 5,492.4 6,030.8 6,536.1 42.5
LTE penetration (%) 32.1% 34.3% 37.1% 39.6% 42.4% 10.3 p.p.
Mobile churn (quarterly) 3.4% 3.2% 3.3% 3.0% 3.2% (0.2 p.p.)
Contract (1) 1.7% 1.6% 1.7% 1.9% 1.8% 0.1 p.p.
Mobile churn (cumulative YTD) 3.4% 3.2% 3.2% 3.2% 3.2% (0.2 p.p.)
Contract (1) 1.7% 1.6% 1.6% 1.7% 1.8% 0.1 p.p.
Mobile ARPU (EUR)(cumulative YTD) 4.0 4.0 4.0 3.9 3.6 (8.3)
Prepay 1.1 1.1 1.1 1.0 0.9 (10.5)
Contract (1) 13.4 13.4 13.5 13.3 12.5 (4.4)
Mobile data traffic (TB) (cumulative YTD) 31,191 65,600 105,536 152,025 49,686 59.3
Fixed telephony ARPU (EUR) (cumulative YTD) 8.0 8.1 8.2 8.1 7.7 (2.6)
Pay TV ARPU (EUR) (cumulative YTD) 12.5 12.6 12.8 11.7 11.9 (3.4)
Broadband ARPU (EUR) (cumulative YTD) 10.6 10.9 11.1 11.2 11.1 6.5
Fixed data traffic (TB) (cumulative YTD) (2) 295,782 619,750 964,597 1,338,012 451,809 52.8
Notes:
(2) Includes solely traffic pertaining to FBB accesses, not Business customers.
- ARPU: monthly average revenue divided by the monthly average accesses of the period. % organic change.
- Data traffic is defined as Terabytes used by the company customers, both upload and download (1TByte = 10^12 bytes). Promotional traffic is
included. Traffic not associated to the Company's mobile customers (roaming-in, MVNOs, interconnection of third parties and other business
lines) is also included. Traffic volume non-rounded.
(1) Excludes M2M.
2018 2019
(1) Includes fixed wireless and VoIP accesses.
2018 2019

42
RESULTS JANUARY | MARCH 2019
TELEFÓNICA MÉXICO
SELECTED FINANCIAL DATA
Unaudited figures (Euros in millions)
2019 2018 % Chg % Organic Chg
Revenues 296 277 6.8 1.2
Service revenues 222 221 0.7 (4.5)
Data revenues 127 133 (4.7) (9.7)
Handset revenues 73 56 30.8 24.0
OIBDA 22 41 (46.2) (92.6)
OIBDA margin 7.5% 15.0% (7.4 p.p.) (13.9 p.p.)
CapEx 12 13 (6.1) (11.0)
Spectrum - - - -
OpCF (OIBDA-CapEx) 11 29 (63.6) c.s.
Notes:
- OIBDA is presented before management and brand fees.
January - March
- January-March 2019 results reported under accounting standards IFRS 16, effective since January 2019. January-
March 2018 results reported under prior accounting IAS 17.
ACCESSES
Unaudited figures (Thousands)
March June September December March % Chg
Mobile accesses 25,269.3 25,499.9 25,525.0 26,309.9 25,502.3 0.9
Prepay 22,977.1 23,124.3 23,193.1 23,947.0 23,136.6 0.7
Contract 2,292.2 2,375.6 2,331.9 2,362.9 2,365.7 3.2
M2M 932.7 982.8 1,002.1 1,012.1 1,020.0 9.4
Fixed Wireless 750.6 768.6 706.9 703.1 635.1 (15.4)
Total Accesses 26,019.9 26,268.5 26,231.9 27,013.0 26,137.4 0.5
SELECTED OPERATIONAL DATA
Unaudited figures
March June September December March % Chg
Contract percentage (%) 9.1% 9.3% 9.1% 9.0% 9.3% 0.2 p.p.
Smartphones ('000) 11,339.0 11,020.6 11,464.6 11,351.1 11,494.7 1.4
Smartphone penetration (%) 46.7% 45.0% 46.8% 44.9% 47.0% 0.3 p.p.
LTE ('000) 5,427.6 5,591.8 5,828.7 6,589.6 6,996.1 28.9
LTE penetration (%) 22.3% 22.8% 23.8% 26.0% 28.6% 6.3 p.p.
Mobile churn (quarterly) 3.7% 3.6% 3.8% 3.2% 4.7% 1.0 p.p.
Contract (1) 3.1% 4.1% 4.6% 4.0% 3.3% 0.2 p.p.
Mobile churn (cumulative YTD) 3.7% 3.6% 3.7% 3.6% 4.7% 1.0 p.p.
Contract (1) 3.1% 3.6% 3.9% 4.0% 3.3% 0.2 p.p.
Mobile ARPU (EUR)(cumulative YTD) 2.4 2.4 2.4 2.3 2.3 (7.6)
Prepay 1.9 2.0 2.0 1.9 1.9 (7.7)
Contract (1) 11.4 10.4 10.5 9.5 10.9 (5.1)
Mobile data traffic (TB) (cumulative YTD) 46,704 101,195 170,382 261,553 105,005 124.8
- Data traffic is defined as Terabytes used by the company customers, both upload and download (1TByte = 10^12 bytes). Promotional
traffic is included. Traffic not associated to the Company's mobile customers (roaming-in, MVNOs, interconnection of third parties and
other business lines) is also included. Traffic volume non-rounded.
(1) Excludes M2M.
2018 2019
2018 2019
Notes:
- ARPU: monthly average revenue divided by the monthly average accesses of the period. % organic change.
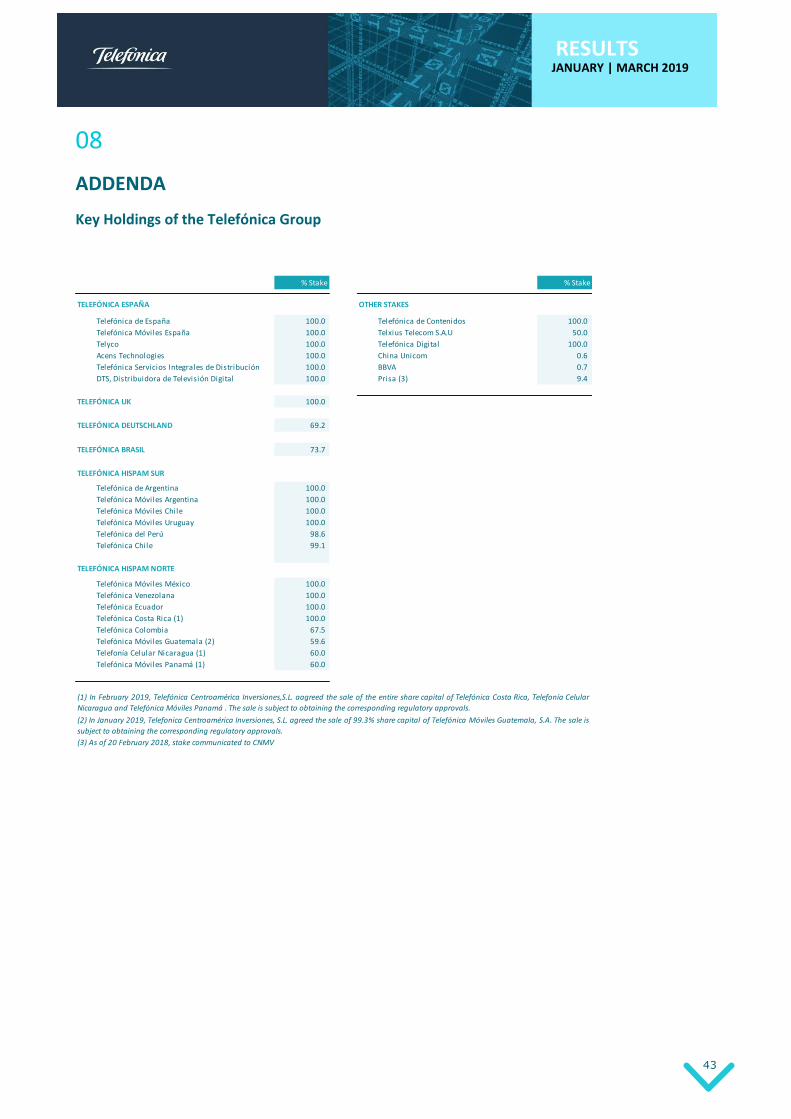
43
RESULTS JANUARY | MARCH 2019
08
ADDENDA
Key Holdings of the Telefónica Group
% Stake % Stake
TELEFÓNICA ESPAÑA OTHER STAKES
Telefónica de España 100.0 Telefónica de Contenidos 100.0
Telefónica Móviles España 100.0 Telxius Telecom S.A.U 50.0
Telyco 100.0 Telefónica Digital 100.0
Acens Technologies 100.0 China Unicom 0.6
Telefónica Servicios Integrales de Distribución 100.0 BBVA 0.7
DTS, Distribuidora de Televisión Digital 100.0 Prisa (3) 9.4
TELEFÓNICA UK 100.0
TELEFÓNICA DEUTSCHLAND 69.2
TELEFÓNICA BRASIL 73.7
TELEFÓNICA HISPAM SUR
Telefónica de Argentina 100.0
Telefónica Móviles Argentina 100.0
Telefónica Móviles Chile 100.0
Telefónica Móviles Uruguay 100.0
Telefónica del Perú 98.6
Telefónica Chile 99.1
TELEFÓNICA HISPAM NORTE
Telefónica Móviles México 100.0
Telefónica Venezolana 100.0
Telefónica Ecuador 100.0
Telefónica Costa Rica (1) 100.0
Telefónica Colombia 67.5
Telefónica Móviles Guatemala (2) 59.6
Telefonía Celular Nicaragua (1) 60.0
Telefónica Móviles Panamá (1) 60.0
(1) In February 2019, Telefónica Centroamérica Inversiones,S.L. aagreed the sale of the entire share capital of Telefónica Costa Rica, Telefonía Celular
Nicaragua and Telefónica Móviles Panamá . The sale is subject to obtaining the corresponding regulatory approvals.
(2) In January 2019, Telefonica Centroamérica Inversiones, S.L. agreed the sale of 99.3% share capital of Telefónica Móviles Guatemala, S.A. The sale is
subject to obtaining the corresponding regulatory approvals.
(3) As of 20 February 2018, stake communicated to CNMV

44
RESULTS JANUARY | MARCH 2019
Changes to the Perimeter
During the January-March 2019 period, the following changes have been made to the perimeter of consolidaton:
→ On 24 January 2019, Telefónica's subsidiary Telefonica Centroamérica Inversiones, S.L., 60% of which is
owned, directly and indirectly, by Telefonica and 40% by Corporación Multi Inversiones, has reached an
agreement with América Móvil for the sale of the entire share capital of Telefónica Guatemala and 99.3%
of Telefónica El Salvador. The closing of the sale of Telefónica El Salvador is subject to the applicable
regulatory conditions, while the closing of the sale of Telefónica Guatemala took place in such date.
→ On 20 February 2019, Telefónica reached an agreement with Millicom International Cellular for the sale
of the entire share capital of Telefónica Costa Rica, and for the sale by Telefónica's subsidiary Telefonica
Centroamérica Inversiones, S.L., of the entire share capital of Telefónica Panamá and Telefónica
Nicaragua.
The closing of the sale of the three companies was subject to the applicable regulatory conditions at the
end of the quarter and will take place for each transaction as those conditions are being satisfied.
With this transaction, together with the sales of T. Guatemala and T. El Salvador, completes the sale of all
its operations in Central America.
→ On 14 February 2019, following the agreement Telefónica reached on 8 November 2018 with Grupo
Catalana Occidente for the sale of 100% of Seguros de Vida y Pensiones Antares, S.A., the closing of such
sale took place, after obtaining the pertinent regulatory approvals.

45
RESULTS JANUARY | MARCH 2019
Alternative performance measures
Information included in compliance with the ESMA Guidelines, 5 October 2015, on Alternative Performance Measures
(APM), applicable to published regulated information from 3 July 2016.
The management of the Group uses a series of APM in its decision-making, in addition to those expressly defined in the
IFRS, because they provide additional information useful to assess the Group’s performance, solvency and liquidity.
These measures should not be viewed in isolation or as a substitute for the measures presented according to the IFRS.
The APM included in this report are: Operating Income Before Depreciation and Amortization, Net Financial Debt, Net
Financial Debt plus leases and Net Financial Debt plus commitments, Leverage Ratio, Free cash flow and Free cash flow
excluding lease principal payments, Organic Result and Underlying Result.
Operating income before amortisation (OIBDA)
Operating income before depreciation and amortization (OIBDA) is calculated by excluding solely depreciation and
amortization from operating income. OIBDA is used to track the performance of the business and to establish operating
and strategic targets of the Telefónica Group companies. OIBDA is a commonly reported measure and is widely used
among analysts, investors and other interested parties in the telecommunications industry, although not a measure
explicitly defined in IFRS, and therefore, may not be comparable to similar indicators used by other companies. OIBDA
should not be considered as a substitute for operating income.
As a result of the entry into force of the new standard IFRS 16 Leases, in 2019 most of lease expenses that under prior
accounting standard affected operating income, are now affecting depreciation and amortization or net financial
expenses, resulting in higher OIBDA under IFRS 16. Nonetheless, in order to ensure comparability vs. prior year figures,
organic variations exclude the effect of IFRS 16 adoption (see Organic Result below).
The detailed reconciliation of Telefónica Group's OIBDA and Operating Income and each of its segments, can be found
in this document (Telefónica Group and Segment P&Ls), as well as on the selected financial information contained in
“https://www.telefonica.com/documents/162467/142176244/rdos19t1-data.zip”.
The OIBDA is also defined on the financial information published by the Group as of December 31, 2018 (see particularly
Note 2 of the Consolidated Financial Statements for the year 2018).
Debt indicators
a) Net financial debt and Net financial debt plus leases and Net financial debt plus commitments
As calculated by us, net financial debt includes: (i) current and non-current financial liabilities in our consolidated
statement of financial position (which includes the negative mark-to-market value of derivatives) and (ii) other
payables included in “Payables and other non-current liabilities” and "Payables and other current liabilities"
(mainly corresponding to payables for deferred payment of radio spectrum that have a financial component).
From these liabilities, the following are subtracted: i) cash and cash equivalents, ii) current financial assets (which
include short-term derivatives), iii) the positive mark-to-market value of derivatives with a maturity beyond one
year, and iv) other interest-bearing assets (components of “Receivables and other current assets”, “Tax
receivables” and “Financial assets and other non-current assets” in our consolidated statement of financial
position). The accounts included in the net financial debt calculation recorded in "Payables and other non-current
liabilities" or "Financial assets and other non-current assets" have a maturity beyond one year and a financial
component. In "Receivables and other current assets" we include the customer financing of terminal sales
classified as short term, and "Financial assets and other non-current assets" includes derivatives, instalments for
the long-term sales of terminals to customers and other long term financial assets.

46
RESULTS JANUARY | MARCH 2019
Net financial debt calculation has been redefined in the first quarter of 2019 excluding the mark to market
adjustment of the unmatured cash flow hedges associated to debt instruments. This change seeks to eliminate
the asymmetry generated by the accounting valuation method of both financial instruments; the debt instrument
valued at amortized cost and the derivative at market value. This new methodology is more aligned with that
used by credit rating agencies and is also used by other companies in the sector. The change has been applied to
all comparative periods. As of March 31, 2019, it represents a reduction in the amount of net financial debt of
€519m (€510m at December 31, 2018).
Likewise, after the entry into force of IFRS 16 Leases, the distinction between finance leases and operating leases
disappears for the purpose of computing the payment obligation. As a result, for comparison purposes, the net
financial debt figure of the comparative periods has been modified to exclude the lease liability of finance leases
(€202m as of December 31, 2018), and the new indicator “Net financial debt plus leases” has been included in
the first quarter of 2019, which is calculated by adding to the net financial debt lease liabilities under IFRS 16
(including also those corresponding to the companies held for sale) and deducting assets from subleases. This
new indicator cannot be presented comparatively for periods prior to 2019.
We calculate net financial debt plus commitments by adding gross commitments related to employee benefits
to net financial debt and deducting the value of long-term assets associated with those commitments and the
tax benefits arising from the future payments of those commitments. Gross commitments related to employee
benefits are current and non-current provisions recorded for certain employee benefits such as termination
plans, post-employment defined benefit plans and other benefits.
We believe that net financial debt, net financial debt plus leases and net financial debt plus commitments are
meaningful for investors and analysts because they provide an analysis of our solvency using the same measures
used by our management. We use them to calculate internally certain solvency and leverage ratios. Nevertheless,
none of them as calculated by us should be considered as a substitute for gross financial debt as presented in
the consolidated statement of financial position.
The reconciliation of Telefónica Group's gross financial debt according to the consolidated statement of financial
position, net financial debt, net financial debt plus leases and net financial debt plus commitments at the end of
March 2019 can be found on page 15 of this document and in the financial information contained in
“https://www.telefonica.com/documents/162467/142176244/rdos19t1-data.zip”. Net financial debt is also
defined on the financial information published by the Group as of December 31, 2018 (see Note 2 of the
Consolidated Financial Statements for the year 2018).
b) Leverage ratio
The leverage ratio is calculated as the ratio of net financial debt over OIBDA for the past 12 months, including or
excluding the OIBDA of the companies which are incorporated or removed from the perimeter of consolidation,
and excluding certain factors in line with the calculation of organic OIBDA. Likewise, OIBDA excludes the impact
of IFRS 16 and includes the expense corresponding to the amortization of assets under finance leases whose
payment obligation has been excluded from the calculation of net financial debt in comparative periods, as
explained above.
The reconciliation of the leverage ratio can be found in the selected financial information contained in
“https://www.telefonica.com/documents/162467/142176244/rdos19t1-data.zip”.
Free Cash Flow
The Group’s free cash flow is calculated starting from “Net cash flow provided by operating activities” as indicated in
the consolidated statement of cash flows; deducting (Payments on investments)/Proceeds from the sale of investments
in property, plant and equipment and intangible assets, net, adding the cash received form government grants and

47
RESULTS JANUARY | MARCH 2019
deducting dividends paid to minority interests. The cash used to cancel commitments related to employee benefits
(originally included in the Net cash flow provided by operating activities) is added as it represents the payments of
principal of the debt incurred with those employees.
After the entry into force of IFRS 16 in 2019, the principal payments of lease liabilities are considered as net cash used
in financing activities within the consolidated cash flow statement. Under the previous standard, it was considered
within net cash flow provided by operating activities. However, to guarantee comparability with previous periods, the
principal payments of lease liabilities are deducted in the calculation of the “Free cash flow” of the first quarter of 2019.
For information purposes, the indicator "Free cash flow excluding lease principal payments" has been added, which
excludes these payments. This indicator cannot be presented comparatively for periods prior to 2019.
We believe that free cash flow is a meaningful measure for investors and analysts because it provides an analysis of the
cash flow available to protect solvency levels and to remunerate the parent company’s shareholders and other equity
holders. The same measure is used internally by our management. Nevertheless, free cash flow as calculated by us
should not be considered as a substitute for the various flows of cash as presented in the consolidated statements of
cash flows.
The reconciliation of net cash flow from operations, according to the consolidated statement of cash flows (on a
straight-line basis) and the Group’s Free cash flow according to the above definition, can be found on the selected
financial information contained in “https://www.telefonica.com/documents/162467/142176244/rdos19t1-data.zip”.
Free cash flow is also defined in the financial information published by the Group as of December 31, 2018 (see Note 2
of the Consolidated Financial Statements for the year 2018).
Organic Result
Year-on-year changes referred to in this document as "organic" or presented "in organic terms" intend to present a
homogeneous comparison, by applying a constant perimeter of consolidation, constant exchange rates and other
specific adjustments which are described herein. "Organic" variations provide useful information about the evolution
of the business due to several factors:
→ They provide information on the organic performance of the Group's operations in the different markets in
which it operates, by maintaining constant exchange rates and perimeter, removing the impact of certain
exogenous factors which may distort the year-on-year comparison since they are specific to a certain moment
and not associated with the ordinary performance of the business (such as, for example, capital gains or losses
from the sale of companies or restructuring associated to simplification plans and aimed at improving efficiency
and future profitability of the Company) and therefore, helping the business performance analysis in
homogeneous terms.
→ Organic results are therefore used both internally and by the various agents in the market to conduct consistent
monitoring of trends and of the operating performance of the business. Moreover, this data helps the
comparison between the business performance of Telefónica and that of other operators, although the term
"organic" is not a term defined in IFRS, and the "organic measures" included herein may not be comparable to
similar measures presented by other companies.
For the purposes of this document, "organic" variation 2019/2018 is defined as the reported variation adjusted by the
following factors:
→ Assumes average constant foreign exchange rates of 2018, except for Venezuela (2019 and 2018 results
converted at the closing synthetic exchange rate for each period).
→ Excludes the hyperinflation adjustment in Argentina.
→ Considers a constant perimeter of consolidation.
48
RESULTS JANUARY | MARCH 2019
→ Excludes in 2019 the impact of IFRS 16 accounting change.
→ At OIBDA and Operating Cash Flow levels, excludes write-offs, capital gains/losses from the sale of companies,
restructuring expenses and non-recurrent material impacts.
→ CapEx also excludes investment in spectrum.
Reconciliation between reported data and organic revenue figures, OIBDA and operating cash flow can be found in the
selected financial information contained in “https://www.telefonica.com/documents/162467/142176244/rdos19t1-
data.zip”.
The Management Report contained in the Consolidated Financial Statements for the period ended December 31, 2018
of Telefónica Group also includes the description of the adjustments for the calculation of the organic variations.
Underlying Result
“Underlying” results or results in “underlying” terms and year-on-year changes referred to in this document as
"underlying" or presented "in underlying terms" intend to present a comparison with the adjustment of certain factors
which distort the year-on-year comparison of the business performance. Unlike the organic result, no exchange rate or
perimeter adjustments are made to the underlying result. Likewise, the underlying result is calculated up to net income,
while organic variations are calculated up to the Operating Cash Flow (OIBDA - CapEx). The "underlying" result and
variations, provide useful information for the company and market agents because:
→ They provide additional information on the underlying performance of the Group's operations in the different
markets, removing the impact of certain factors which distort the year-on-year comparison, as they are specific
to a certain moment and not associated with the ordinary performance of the business, and facilitate the
underlying analysis of the business.
→ The inclusion of the business underlying performance is used both internally and by the various agents in the
market to perform consistent monitoring of trends and operating performance of the business; this data also
facilitates the comparison between the business performance of Telefónica and that of other operators,
although the term "underlying" is not a term defined in IFRS, and the "underlying" measures included herein
may not be comparable to similar measures presented by other companies.
For the purposes of this document, "underlying" variation 2019/2018 is defined as the reported variation as adjusted
by the following factors:
→ Excludes in 2019 the impact of IFRS 16 accounting change.
→ At OIBDA level, excludes write-downs, capital gains/losses from the sale of companies, restructuring expenses
and material non-recurrent impacts. Excludes the hyperinflation adjustment in Argentina.
→ At net income level, amortisation of assets from purchase price allocation processes is also excluded.
Reconciliation between reported data and OIBDA underlying figures and net income can be found on the selected
financial information contained on “https://www.telefonica.com/documents/162467/142176244/rdos18t4-data.zip”.

49
RESULTS JANUARY | MARCH 2019
DISCLAIMER
This document may contain forward-looking statements and information (hereinafter, the “Statements”) relating to the
Telefónica Group (hereinafter, the "Company" or "Telefónica") or otherwise. These Statements may include financial
forecasts and estimates based on assumptions or statements regarding plans, objectives and expectations that make
reference to different matters, such as the customer base and its evolution, growth of the different business lines and
of the global business, market share, possible acquisitions, divestitures or other transactions, Company’s results and
other aspects related to the activity and situation of the Company.
The Statements can be identified, in certain cases, through the use of words such as “forecast”, "expectation",
"anticipation", “aspiration”, "purpose", "belief" or similar expressions or variations of such expressions. These
Statements reflect the current views of Telefónica with respect to future events, do not represent, by their own nature,
any guarantee of future fulfilment, and are subject to risks and uncertainties that could cause the final developments
and results to materially differ from those expressed or implied by such Statements. These risks and uncertainties
include those identified in the documents containing more comprehensive information filed by Telefónica before the
different supervisory authorities of the securities markets in which its shares are listed and, in particular, the Spanish
National Securities Market Commission.
Except as required by applicable law, Telefónica does not assume any obligation to publicly update the Statements to
adapt them to events or circumstances taking place after the date hereof, including changes in the Company's business,
in its business development strategy or any other unexpected circumstance.
This document may contain summarized, non-audited or non-GAAP financial information. The information contained
herein should therefore be considered as a whole and in conjunction with all the public information regarding the
Company available, including, if any, other documents released by the Company that may contain more detailed
information. Information related to Alternative Performance Measures (APM) used in the present document are
included in the Appendix “Alternative performance measures”, page 45 of this document. Moreover, recipients of this
document are invited to read our consolidated financial statements and consolidated management report for the year
2018 submitted to the Spanish National Securities Market Commission (CNMV), in Note 2, page 17, of the pdf filed.
Neither this document nor any of its contents constitute an offer to purchase, sale or exchange any security, a
solicitation of any offer to purchase, sale or exchange any security, or a recommendation or advice regarding any
security.
Investor Relations
Distrito Telefónica - Ronda de la Comunicación, s/n
28050 Madrid (Spain)
Telephone: +34 91 482 87 00
Pablo Eguirón ([email protected])
Isabel Beltrán ([email protected])
Adrián Zunzunegui ([email protected])
Christian Kern ([email protected])
www.telefonica.com/shareholders&investors
FOLLOW US: