interim financial statements kegalle plantations plc · balance as at 31 december 2016 250,000...
TRANSCRIPT

INTERIM FINANCIAL STATEMENTS
KEGALLE PLANTATIONS PLC
For the nine months ended 31 December 2016

Year Ended Year Ended
As at 31 December 2016 2015 31 March 2016 2016 2015 31 March 2016
Rs. '000 Rs. '000 Rs. '000 Rs. '000 Rs. '000 Rs. '000
ASSETS
Non - Current Assets
Leasehold property, plant and equipment 212,301 228,218 224,154 212,301 228,218 224,154
Freehold property, plant and equipment 297,462 332,735 323,978 336,276 377,320 366,631
Bearer biological assets 1,990,431 1,890,459 1,910,589 1,990,431 1,890,459 1,910,589
Consumable biological assets 94,919 78,746 94,919 94,919 78,746 94,919
Financial Assets 1,201,600 1,000,000 1,201,600 1,201,600 1,000,000 1,201,600
Long term investments 491,850 611,850 491,850 861,925 912,811 718,285
4,288,564 4,142,008 4,247,091 4,697,453 4,487,554 4,516,179
Current Assets
Inventories 298,102 201,285 235,954 297,428 200,612 235,281
Trade and other receivables 218,614 178,066 134,518 227,217 186,780 142,813
VAT recoverable 26,023 25,340 26,023 26,030 25,348 26,030
Income tax recoverable 15,883 11,004 12,621 15,883 11,004 12,621
Amounts due from related Companies 37,252 37,434 39,874 526 466 2,795
Short term investment 1,484,600 1,556,683 1,692,867 1,484,600 1,556,683 1,692,867
Cash and bank balances 29,375 13,929 23,395 29,375 13,933 23,395
2,109,849 2,023,740 2,165,251 2,081,059 1,994,825 2,135,802
Total Assets 6,398,413 6,165,748 6,412,342 6,778,512 6,482,379 6,651,981
EQUITY & LIABILITIES
Capital & Reserves
Stated capital (Note 1) 250,000 250,000 250,000 250,000 250,000 250,000
General reserve 225,000 225,000 225,000 225,000 225,000 225,000
Timber reserve 8,485 2,758 8,485 8,485 2,758 8,485
Available for sale reserves 49,320 - 49,320 49,308 - 49,308
Retained profit 1,965,300 1,783,473 1,957,492 2,332,040 2,084,776 2,182,858
Shareholders' Fund 2,498,105 2,261,230 2,490,297 2,864,833 2,562,533 2,715,652
Non - Current Liabilities
Loans & borrowings 1,143,558 1,612,990 1,496,162 1,143,558 1,612,990 1,496,162
Retirement benefit obligations 436,680 480,323 429,478 436,775 480,418 429,573
Deferred income 196,595 210,568 203,037 196,902 212,882 204,262
Deferred tax liability 53,369 79,555 53,369 53,369 79,555 53,369
Liability to make lease payment after one year 259,536 264,695 263,489 259,536 264,695 263,489
2,089,738 2,648,131 2,445,534 2,090,139 2,650,539 2,446,855
Current Liabilities
Loans & borrowings 1,480,244 1,026,576 1,231,351 1,480,244 1,026,576 1,231,351
Liability to make lease payment within one year 5,205 5,004 5,004 5,205 5,004 5,004
Trade and other payables 269,180 170,504 202,685 277,032 178,305 210,529
Dividend payable 19,215 34,697 21,354 19,215 34,697 21,354
Amounts due to related Companies 36,726 19,605 16,116 41,845 24,724 21,235
1,810,570 1,256,387 1,476,510 1,823,540 1,269,307 1,489,474
Total Equity & Liabilities 6,398,413 6,165,748 6,412,342 6,778,512 6,482,379 6,651,981
Net Asset Value per Share (Rs.) 99.92 90.45 99.61 114.59 102.50 108.63
The above figures are subject to audit
These Financial Statements are in compliance with the requirements of the Companies Act No. 07 of 2007.
Sudheera Epitakumbura
Financial Controller
The Board of Directors is responsible for the preparation and presentation of these Financial Statements.
Signed for and on behalf of the Board of Directors of Kegalle Plantations PLC.
S S Poholiyadde
Director
Colombo
13 February 2017
STATEMENT OF FINANCIAL POSITION
INTERIM FINANCIAL STATEMENTS
Director
Company Group
Prof. R C W M R A Nugawela
Kegalle Plantations PLC 2016/17 - Q3

Year Ended Year Ended
Variance Variance 31 March Variance Variance 31 March
For the nine months ended 31 December 2016 2015 + / (-) 2016 2015 + / (-) 2016 2016 2015 + / (-) 2016 2015 + / (-) 2016
Rs. '000 Rs. '000 % Rs. '000 Rs. '000 % Rs. '000 Rs. '000 Rs. '000 % Rs. '000 Rs. '000 % Rs. '000
Revenue 493,061 424,884 16 1,566,669 1,453,790 8 1,933,063 493,061 424,884 16 1,566,669 1,453,790 8 1,933,063
Cost of sales (443,664) (424,093) (5) (1,476,876) (1,425,563) (4) (1,924,776) (443,664) (424,093) (5) (1,476,876) (1,425,563) (4) (1,924,776)
Gross profit / (loss) 49,397 791 6,148 89,793 28,228 218 8,287 49,397 791 6,148 89,793 28,228 218 8,287
Gain/(Loss) on fair value of biological assets - - - - - - 5,728 - - - - - - 5,728
Other income 8,376 4,919 70 26,257 16,698 57 114,607 9,145 6,427 42 28,534 21,221 34 35,651
Administrative expenses (10,006) (9,417) (6) (30,328) (31,736) 4 (43,166) (11,343) (10,956) (4) (34,872) (36,401) 4 (50,761)
Management fee (9,521) (1,621) (488) (19,304) (9,058) (113) (6,543) (9,521) (1,621) (488) (19,304) (9,058) (113) (6,543)
Profit / (loss) from operations 38,246 (5,328) 818 66,418 4,131 1,508 78,912 37,678 (5,359) 803 64,151 3,989 1,508 (7,639)
Finance income 48,062 42,466 13 138,654 138,263 0 183,284 48,062 42,466 13 138,654 138,263 0 183,284
Finance cost (67,605) (47,638) (42) (195,108) (146,158) (33) (198,223) (67,605) (47,638) (42) (195,108) (146,158) (33) (198,223)
Net finance income / (loss) (19,543) (5,172) (278) (56,454) (7,895) (615) (14,939) (19,543) (5,172) (278) (56,454) (7,895) (615) (14,939)
Share of result of associates - - - - - - - 58,487 43,610 34 154,648 118,442 31 140,827
Profit / (loss) before taxation 18,703 (10,500) 278 9,964 (3,764) 365 63,973 76,622 33,079 132 162,345 114,536 42 118,249
Tax (expenses) / Reversal (753) (571) (32) (2,156) (1,715) (26) 37,468 (1,783) (5,794) 69 (13,164) (10,264) (28) 16,876
Profit / (loss) for the period 17,950 (11,071) 262 7,808 (5,479) 243 101,441 74,839 27,284 174 149,181 104,271 43 135,125
Basic earnings per share (Rs.) 0.72 (0.44) 0.31 (0.22) 4.06 2.99 1.09 5.97 4.17 5.41
Dividend per share (Rs.) - - - - 45.00 - - - - 45.00
The above figures are subject to audit
INTERIM FINANCIAL STATEMENTS
STATEMENT OF PROFIT OR LOSS
Quarter Ended Quarter Ended
Group
Nine Months Ended Nine Months Ended
Company
Kegalle Plantations PLC 2016/17 - Q3

Year Ended Year Ended
Variance Variance 31 March Variance Variance 31 March
For the nine months ended 31 December 2016 2015 + / (-) 2016 2015 + / (-) 2016 2016 2015 + / (-) 2016 2015 + / (-) 2016
Rs. '000 Rs. '000 % Rs. '000 Rs. '000 % Rs. '000 Rs. '000 Rs. '000 % Rs. '000 Rs. '000 % Rs. '000
Profit / (loss) for the period 17,950 (11,071) 262 7,808 (5,479) 243 101,441 74,839 27,284 174 149,181 104,271 43 135,125
Other Comprehensive Income
Other Comprehensive income not to be reclassified to
profit or loss in Subsequent periods (net of tax)
Actuarial Gains and (Losses) on Defined Benefit Plans - - - - - - 86,451 - - - - - - 86,451
Income tax effect - - - - - - (13,625) - - - - - - (13,625)
- - - - - - 72,827 - - - - - - 72,827
Share of Other Comprehensive Income of
Equity Accounted Investees
Other Comprehensive income to be reclassified to
profit or loss in Subsequent periods (net of tax)
Net (Loss)/gain on available-for-sale financial assets - - - - - - 49,320 - - - - - - 49,320
Income tax effect - - - - - - - - - - - - - -
- - - - - - 49,320 - - - - - - 49,320
Other Comprehensive income not to be reclassified to
profit or loss in Subsequent periods (net of tax)
Actuarial Gains and (Losses) on Defined Benefit Plans - - - - - - - - - - - - - 125
Income tax effect - - - - - - - - - - - - - (6)
- - - - - - - - - - - - - 119
Other Comprehensive Income for the period, net of tax - - - - - - 122,147 - - - - - - 122,266
Total Comprehensive Income for the period, net of tax 17,950 (11,071) 262 7,808 (5,479) 242.50 223,588 74,839 27,284 174 149,181 104,271 43 257,391
The above figures are subject to audit
INTERIM FINANCIAL STATEMENTS
STATEMENT OF COMPREHENSIVE INCOME
Quarter Ended Quarter Ended
Company Group
Nine Months Ended Nine Months Ended
Kegalle Plantations PLC 2016/17 - Q3
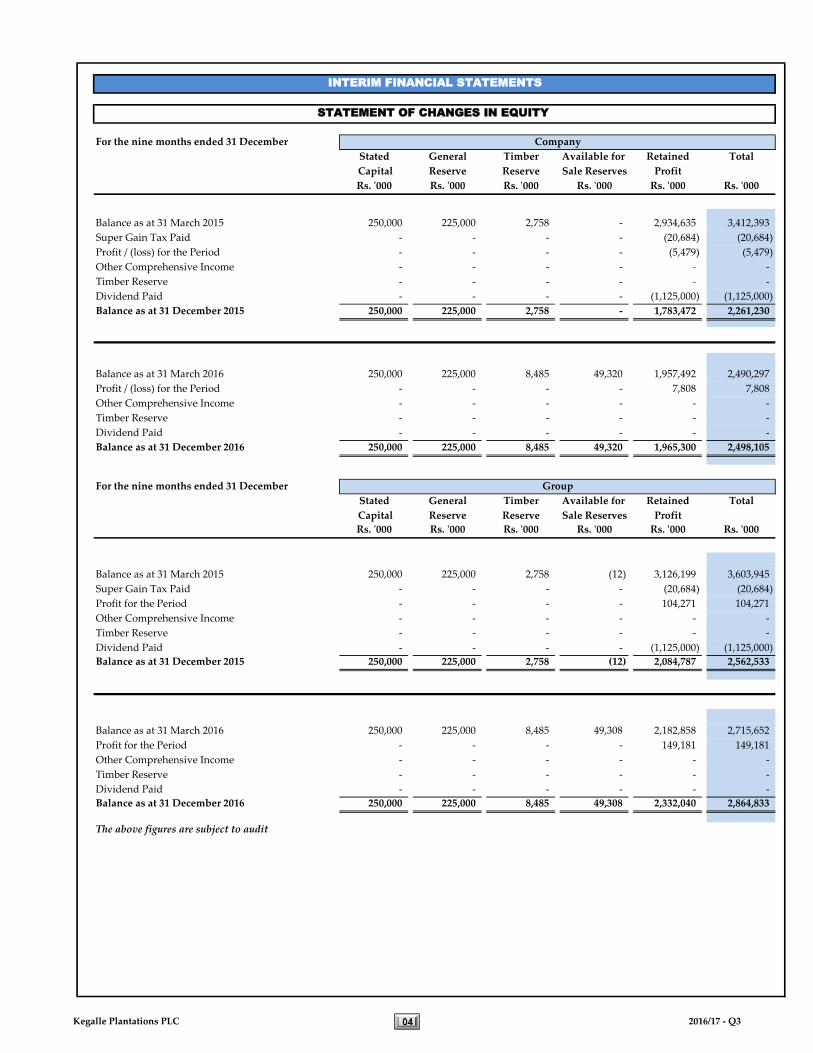
For the nine months ended 31 December
Stated General Timber Available for Retained Total
Capital Reserve Reserve Sale Reserves Profit
Rs. '000 Rs. '000 Rs. '000 Rs. '000 Rs. '000 Rs. '000
Balance as at 31 March 2015 250,000 225,000 2,758 - 2,934,635 3,412,393
Super Gain Tax Paid - - - - (20,684) (20,684)
Profit / (loss) for the Period - - - - (5,479) (5,479)
Other Comprehensive Income - - - - - -
Timber Reserve - - - - - -
Dividend Paid - - - - (1,125,000) (1,125,000)
Balance as at 31 December 2015 250,000 225,000 2,758 - 1,783,472 2,261,230
Balance as at 31 March 2016 250,000 225,000 8,485 49,320 1,957,492 2,490,297
Profit / (loss) for the Period - - - - 7,808 7,808
Other Comprehensive Income - - - - - -
Timber Reserve - - - - - -
Dividend Paid - - - - - -
Balance as at 31 December 2016 250,000 225,000 8,485 49,320 1,965,300 2,498,105
For the nine months ended 31 December
Stated General Timber Available for Retained Total
Capital Reserve Reserve Sale Reserves Profit
Rs. '000 Rs. '000 Rs. '000 Rs. '000 Rs. '000 Rs. '000
Balance as at 31 March 2015 250,000 225,000 2,758 (12) 3,126,199 3,603,945
Super Gain Tax Paid - - - - (20,684) (20,684)
Profit for the Period - - - - 104,271 104,271
Other Comprehensive Income - - - - - -
Timber Reserve - - - - - -
Dividend Paid - - - - (1,125,000) (1,125,000)
Balance as at 31 December 2015 250,000 225,000 2,758 (12) 2,084,787 2,562,533
Balance as at 31 March 2016 250,000 225,000 8,485 49,308 2,182,858 2,715,652
Profit for the Period - - - - 149,181 149,181
Other Comprehensive Income - - - - - -
Timber Reserve - - - - - -
Dividend Paid - - - - - -
Balance as at 31 December 2016 250,000 225,000 8,485 49,308 2,332,040 2,864,833
The above figures are subject to audit
INTERIM FINANCIAL STATEMENTS
Company
Group
STATEMENT OF CHANGES IN EQUITY
Kegalle Plantations PLC 2016/17 - Q3

Year Ended Year Ended
31 March 31 March
For the nine months ended 31 December 2016 2015 2016 2016 2015 2016
Rs. '000 Rs. '000 Rs. '000 Rs. '000 Rs. '000 Rs. '000
CASH FLOWS FROM / (USED IN) OPERATING ACTIVITIES
Net Profit / (loss) before Taxation 9,964 (3,764) 63,973 162,345 114,536 118,249
ADJUSTMENTS FOR
Interest income (138,654) (138,263) (183,284) (138,654) (138,263) (183,284)
Depreciation, amortization and Impairment Loss 81,307 83,407 109,549 85,146 87,817 115,890
Provision for defined benefit plan costs 61,554 31,644 79,623 61,554 31,644 79,623
Amortization of grants (11,721) (3,971) (15,636) (12,640) (7,235) (19,988)
Share of result of associates - - - (154,648) (118,442) (140,827)
Profit on sale of property, plant & equipment (999) (1,329) (2,439) (999) (1,329) (2,439)
Finance costs 195,108 146,158 198,223 195,108 146,158 198,223
Dividend Received from Associates - - (45,765) - - -
Profit on deemed disposal (gain) / loss - - (32,280) - - 6,943
(Gains)/losses on fair value of biological assets - - (5,728) - - (5,728)
Operating profit before working capital changes 196,560 113,882 166,236 197,212 114,887 166,662
(Increase)/decrease in trade & other receivables (84,096) 32,110 74,975 (84,404) 31,830 75,115
(Increase)/decrease in inventories (62,149) 71,080 36,412 (62,149) 71,080 36,412
(Increase)/decrease in amounts due from related companies 2,622 11,780 9,339 2,622 11,780 8,695
Increase/(decrease) in trade & other payables 66,495 (51,117) (18,554) 66,149 (51,850) (18,493)
Increase/(decrease) in amounts due to related companies 20,610 17,367 13,879 20,610 17,367 13,884
Cash generated from / (used in) operations 140,042 195,102 282,287 140,041 195,094 282,275
Defined benefit plan costs paid (54,352) (37,394) (49,768) (54,352) (37,394) (49,768)
Finance cost paid (155,737) (107,938) (147,264) (155,737) (107,938) (147,264)
Income tax/ESC/SGT paid (5,418) (28,381) (30,626) (5,418) (28,381) (30,626)
Net cash from operating activities (75,466) 21,389 54,629 (75,467) 21,381 54,618
CASH FLOWS FROM / (USED IN) INVESTING ACTIVITIES
Interest received 138,654 138,263 183,284 138,654 138,263 183,284
Grant received 5,280 7,413 11,546 5,280 7,413 11,546
Proceeds from sale of property, plant & equipment 999 1,329 2,439 999 1,329 2,439
Field development expenditure (120,864) (175,162) (219,068) (120,864) (175,162) (219,068)
Purchase of property, plant & equipment (1,916) (1,208) (1,580) (1,916) (1,208) (1,580)
Net cash from / (used in) investing activities 22,153 (29,365) (23,379) 22,153 (29,365) (23,379)
CASH FLOWS FROM / (USED IN) FINANCING ACTIVITIES
Dividend paid (2,139) (1,138,588) (1,151,934) (2,139) (1,138,588) (1,151,934)
Dividend Received from Associates - - 45,765 - - 45,765
Payment of Government lease rentals (39,371) (38,220) (50,960) (39,371) (38,220) (50,960)
Payment of Government lease rentals - Capital (3,753) (3,609) (4,812) (3,753) (3,609) (4,812)
Proceeds from loans 171,000 148,000 148,000 171,000 148,000 148,000
Repayment of loans (513,131) (259,223) (368,302) (513,131) (259,223) (368,302)
Net Cash from / (used in) Financing Activities (387,395) (1,291,640) (1,382,243) (387,395) (1,291,640) (1,382,243)
Net increase/(decrease) in cash & cash equivalents (440,708) (1,299,616) (1,350,993) (440,709) (1,299,625) (1,351,004)
Cash & cash equivalents at the beginning of the period Note A 1,164,193 2,515,186 2,515,186 1,164,193 2,515,198 2,515,198
Cash & cash equivalents at the end of the period Note B 723,485 1,215,570 1,164,193 723,484 1,215,573 1,164,193
NOTES
A. Cash & cash equivalents at the beginning of the period
Cash in Hand & at Bank 23,395 22,888 22,888 23,395 22,900 22,900
Bank Overdraft (552,069) - - (552,069) - -
Investment in Treasury Bills, REPO & Others 1,692,867 2,492,297 2,492,297 1,692,867 2,492,297 2,492,297
1,164,193 2,515,186 2,515,186 1,164,193 2,515,198 2,515,198
B. Cash & cash equivalents at the end of the period
Cash in Hand & at Bank 29,375 13,929 23,395 29,375 13,933 23,395
Bank Overdraft (790,489) (355,042) (552,069) (790,489) (355,042) (552,069)
Investment in Treasury Bills, REPO & Others 1,484,600 1,556,683 1,692,867 1,484,600 1,556,683 1,692,867
723,485 1,215,570 1,164,193 723,484 1,215,573 1,164,193
The above figures are subject to audit
INTERIM FINANCIAL STATEMENTS
CASH FLOW STATEMENT
Company Group
Kegalle Plantations PLC 2016/17 - Q3

1.
2.
3.
4.
5.
6.
7.
8. Mr. Sriyan Eriyagama has been appointed as Acting Chief Executive Officer of the Company with effect from 01 January 2017.
In accordance with the Collective Agreement between the Employers' Federation of Ceylon (EFC) and the Trade Unions, with effect from 15 October 2016, the
daily basic wage of workers have been increased from Rs. 450/- to Rs. 500/-. An allowance of Rs.30/- of Fixed Price Share Suppliement is paid in addition to Rs.
60/- as an attendance incentive. Rs.140/- as a productivity incentive, totaling to Rs. 730/- per day, as compared to Rs. 620/- previously.
No circumstances have arisen since the Statement of Financial Position date, which would require adjustment or discloser in the Interim Financial Statements.
INTERIM FINANCIAL STATEMENTS
NOTES TO THE FINANCIAL STATEMENTS
Interim Financial Statements does not include/classify actuarial gain/(loss) on defined benefit plans costs as the valuation is done at the year end.
Stated Capital of Kegalle Plantations PLC amounts to Rs. 250,000,010 represented by 25,000,001 Ordinary Shares.
The Interim Financial Statements of the Company/Group are unaudited and have been prepared in accordance with Sri Lanka Financial Reporting Standards
(SLFRS/LKAS) and are in compliance with Sri Lanka Accounting Standard 34 - Interim Financial Reporting. Further, provisions of the Companies Act No. 7 of
2007 have been considered in preparing the Interim Financial Statements of the Company/Group. They also comply with the accounting policies and methods
set out in the Annual Report for the year ended 31 March 2016.
The presentation and classification of figures for the corresponding period of the previous quarter have been amended, where relevant, for better presentation
and to be comparable with those of the current quarter.
Other than contingent liabilities which may arise from the fair value adjustments, there has been no material changes in the nature of the contingent liabilities,
what was disclosed in the Annual Report for the year ended 31 March 2016.
Kegalle Plantations PLC 2016/17 - Q3

Market price per share Year Ended
31 March
For the period ended 31 December 2016 2015 2016 2015 2016
Rs. Rs. Rs. Rs. Rs.
Highest 58.00 77.90 72.50 146.60 146.60
Lowest 45.00 66.00 45.00 66.00 48.00
Last Traded 48.50 66.50 48.50 66.50 50.70
Twenty largest shareholders of the Company are as follows;
As at
Name of the Shareholder Number of
Shares
% of the
HoldingNumber of
Shares
% of the
Holding
1 RPC Plantation Management Services (Pvt) Ltd 19,770,477 79.08% 19,770,477 79.08%
2 Dhanasiri Recreation (Pvt) Ltd 319,305 1.28% 319,305 1.28%
3 Almar Trading Co. (Pvt) Ltd 243,600 0.97% 243,600 0.97%
4 Mubasher Financial Services BSC 204,972 0.82% 204,972 0.82%
5 HSBC International Nominees Ltd - SSBT - Deustche Bank 200,000 0.80% 200,000 0.80%
6 Tranz Dominion, L.L.C 185,000 0.74% 185,000 0.74%
7 Employees Provident Fund 122,300 0.49% 122,300 0.49%
8 Sandwave Limited 100,000 0.40% 100,000 0.40%
9 Mr. D. M. Kodikara 85,000 0.34% 85,000 0.34%
10 Mrs. M. S. E. V. E. A. U. Von Stumm 59,349 0.24% 59,349 0.24%
11 Seylan Bank PLC/Dr. Thirugnanasambandar 58,200 0.23% - -
12 Mr. N. Balasingam 50,600 0.20% 50,600 0.20%
13 Bank of Ceylon - No. 1 Account 50,600 0.20% 50,600 0.20%
14 Mr. F. G. N. Mendis 45,000 0.18% 45,000 0.18%
15 Mr. P. F. Nandasiri 42,500 0.17% 42,500 0.17%
16 Mr. J. G. De Mel 38,200 0.15% 37,010 0.15%
17 Alliance Finance Company PLC 37,100 0.15% 37,100 0.15%
18 Mr. H. W. M. Woodward 35,706 0.14% 35,706 0.14%
19 Mr. P. P. Subasinghe 32,978 0.13% 28,627 0.11%
20 Mr. R. Gautam 31,593 0.13% 32,000 0.13%
Sub Total 21,712,480 86.85% - -
Balance held by 8,979 Shareholders
(31 March 2016 - 9,023 Shareholders) 3,287,521 13.15% 3,294,275 13.18%
Total Shares 25,000,001 100.00% 25,000,001 100.00%
The percentage of shares held as follows;
Number of
Shareholders
Number of
Shares
% of the
HoldingNumber of
Shareholders
Number of
Shares
% of the
Holding
Public Holding 8,995 5,212,817 20.85% 9,039 5,212,817 20.85%
Other Holding 4 19,787,184 79.15% 4 19,787,184 79.15%
8,999 25,000,001 100.00% 9,043 25,000,001 100.00%
The number of shares held by the Board of Directors are as follows;
As at 31 December
2016
31 March 2016
Dr. Sena Yaddehige - -
Mr. S S Poholiyadde 3,307 3,307
Prof. R C W M R A Nugawela - -
Dr. S S B D G Jayawardena - -
Mr. Shaminda Yaddehige - -
31 December 2016 31 March 2016
Number of Shares
INTERIM FINANCIAL STATEMENTS
SHAREHOLDER & INVESTOR INFORMATION
31 December 2016 31 March 2016
Quarter Ended Nine Months Ended
Kegalle Plantations PLC 2016/17 - Q3

For the nine months ended 31 December
Year Ended Year Ended
31 March 31 March
2016 2015 2016 2016 2015 2016
Rubber Rs. '000 Rs. '000 Rs. '000 Rs. '000 Rs. '000 Rs. '000
Revenue 702,394 686,973 941,732 702,394 686,973 941,732
Revenue expenditure (634,856) (596,592) (813,219) (634,856) (596,592) (813,219)
Depreciation / amortization (56,361) (55,435) (74,348) (56,361) (55,435) (74,348)
Other non cash expenses - gratuity (36,760) (17,634) (43,347) (36,760) (17,634) (43,347)
Segment Result - Gross Profit/(Loss) (25,582) 17,311 10,817 (25,582) 17,311 10,817
Tea
Revenue 726,151 676,540 877,108 726,151 676,540 877,108
Revenue expenditure (677,007) (696,656) (902,838) (677,007) (696,656) (902,838)
Depreciation / amortization (23,688) (26,595) (33,365) (23,688) (26,595) (33,365)
Other non cash expenses - gratuity (24,914) (13,717) (36,275) (24,914) (13,717) (36,275)
Segment Result - Gross Profit/(Loss) 542 (60,428) (95,371) 542 (60,428) (95,371)
Coconut
Revenue 31,718 36,604 45,394 31,718 36,604 45,394
Revenue expenditure (22,416) (18,489) (20,872) (22,416) (18,489) (20,872)
Segment Result - Gross Profit 9,301 18,115 24,522 9,301 18,115 24,522
Others
Revenue 106,406 53,673 68,830 106,406 53,673 68,830
Revenue expenditure (874) (444) (511) (874) (444) (511)
Segment Result - Gross Profit 105,532 53,229 68,318 105,532 53,229 68,318
Total Segments
Revenue 1,566,669 1,453,790 1,933,063 1,566,669 1,453,790 1,933,063
Revenue expenditure (1,335,154) (1,312,182) (1,737,441) (1,335,154) (1,312,182) (1,737,441)
Depreciation / amortization (80,048) (82,030) (107,713) (80,048) (82,030) (107,713)
Other non cash expenses - gratuity (61,674) (31,351) (79,623) (61,674) (31,351) (79,623)
Total Segment Results - Gross Profit 89,793 28,228 8,287 89,793 28,228 8,287
Gain/(Loss) on fair value of biological assets - - 5,728 - - 5,728
Other income 26,257 16,698 114,607 28,534 21,221 35,651
Administrative expenses (30,328) (31,736) (43,166) (34,872) (36,401) (50,761)
Management fee (19,304) (9,058) (6,543) (19,304) (9,058) (6,543)
Finance income 138,654 138,263 183,284 138,654 138,263 183,284
Finance cost (195,108) (146,158) (198,223) (195,108) (146,158) (198,223)
Share of result of associates - - - 154,648 118,442 140,827
Profit / (loss) Before Tax 9,964 (3,764) 63,973 162,345 114,536 118,249
The above figures are subject to audit
INTERIM FINANCIAL STATEMENTS
Company Group
SEGMENT INFORMATION
Kegalle Plantations PLC 2016/17 - Q3

Name of the Company : KEGALLE PLANTATIONS PLC
Legal Form : A Quoted Public Company with limited liability,
Incorporated in Sri Lanka under the Companies Act No. 07 of 2007.
Date of Incorporation : 22 June 1992
Company Registration No : New Registration No. P Q 135 [Old No. N (PBS/CGB) 140]
Head/Registered Office : No. 310, High Level Road, Nawinna, Maharagama, Sri Lanka.
Principal Business Activities : Cultivation, Manufacture and Sale of Rubber, Tea, Coconut,
Cardamom & other agricultural produce.
Ultimate Parent Enterprise : Richard Pieris & Company PLC
No. 310, High Level Road, Nawinna, Maharagama, Sri Lanka.
Board of Directors : Dr. Sena Yaddehige - Chairman
Mr. S S Poholiyadde
Prof. R C W M R A Nugawela
Dr. S S B D G Jayawardena
Mr. Shaminda Yaddehige
Stock Exchange Listing : The Ordinary Shares of the Company are listed with the
Colombo Stock Exchange of Sri Lanka.
Secretaries : Richard Pieris Group Services (Pvt) Limited
No. 310, High Level Road, Nawinna, Maharagama, Sri Lanka
Telephone : + (94) 11 4310500
Auditors : Messrs. Ernst & Young, Chartered Accountants,
No. 201, De Saram Place, Colombo 10.
Bankers : National Development Bank PLC
Hatton National Bank PLC
Bank of Ceylon - Corporate Branch & Regional Branches
Peoples Bank
Seylan Bank PLC
Commercial Bank of Ceylon PLC
Indian Overseas Bank/Indian Bank/State Bank of India
Nations Trust Bank PLC
Legal Advisors : Paul Ratnayeke Associates
International Legal Consultants,
Solicitors and Attorneys-at-Law,
No. 59, Gregory’s Road,
Colombo 7, Sri Lanka.
Contact Details : Telephone : + (94) 11 4310500
Facsimile : + (94) 11 4310799
Internet : www.arpico.com
E-mail : [email protected]
CORPORATE INFORMATION

Kegalle Plantations PLC310, High Level Road, Nawinna, Maharagama, Sri Lanka.Tel : +94 11 4310500Fax : +94 11 4310799Internet : www.arpico.comE-mail : [email protected]