interim financial report 2016 - bourse€¦ · dozen types of beverages, including beers under...
TRANSCRIPT
Interim Financial Report2016
Société anonyme (joint-stock company)With a Supervisory Board and a Management Board
With share capital of €10,459,512Head office: 18, rue Troyon – 92 316 Sèvres, France
Registered in the Nanterre Trade and Companies RegistryUnder number 552 056 152
This report contains the Group’s consolidated financial statements for the first half of 2016 which are preparedin compliance with articles L. 451-1-2 III of the French Monetary Code and Art.222-4 et seq of the RèglementGénéral de l’Autorité des Marchés Financiers.
This is a free translation into English of the French “rapport financier semestriel” and this translation isprovided solely for the convenience of the English speaking users. Only the French version is legally binding.
INTERIM FINANCIAL REPORT
SIX MONTHS ENDED JUNE 30, 2016

1. STATEMENT BY THE PERSON RESPONSIBLE FOR THE INTERIMFINANCIAL REPORT .................................................................................................1
1.1 Person responsible for the interim financial report ...........................................................................1
2.1 Statement..........................................................................................................................................1
2. INTERIM MANAGEMENT REPORT...........................................................................2
2.1 Business overview ............................................................................................................................2
2.3 Analysis of the Group’s financial performance for the six months ended June 30, 2016.................6
2.3.1. Comparison of the group’s results for the six-month periods ended june 30, 2015 andjune 30, 2016 ·············································································································· 6
2.3.2. Revenue············································································································ 6
2.3.3. Gross profit ·······································································································10
2.3.4. Payroll expenses ································································································10
2.3.5. Other recurring operating income and expenses························································10
2.3.6. Consolidated recurring operating income ·································································10
2.3.7. Operating income ·······························································································11
2.3.8. Net finance costs································································································11
2.3.9. Income tax ········································································································11
2.3.10. Net income ······································································································11
2.4 Related party transactions ..............................................................................................................12
2.5 Significant events during the first six months of 2016 ....................................................................12
2.6 Subsequent events .........................................................................................................................13
2.7 Compensation and benefits of the executive corporate officers.....................................................14
2.7.1 Fixed compensation of the members of the Management Board · Erreur ! Signet non défini.
2.7.2 Variable Compensation of the members of the Management Board ·······························14
2.7.3 differed compensation ·························································································14
2.8 Outlook............................................................................................................................................15
3. CONDENSED INTERIM CONSOLIDATED FINANCIAL STATEMENTS FORTHE SIX MONTHS ENDED JUNE, 30 2016.............................................................16NOTES TO THE CONDENSED INTERIM CONSOLIDATED FINANCIALSTATEMENTS ..........................................................................................................21
4. STATUTORY AUDITOR’S REVIEW REPORT ON THE INTERIM FINANCIALINFORMATION .........................................................................................................39

1. STATEMENT BY THE PERSON RESPONSIBLE FOR THEINTERIM FINANCIAL REPORT
1.1.PERSON RESPONSIBLE FOR THE INTERIM FINANCIAL REPORT
Mr. Richard Bielle, Chairman of the Management Board.
1.2.STATEMENT
“I hereby certify that to the best of my knowledge, the consolidated financial statements presented in theinterim financial report, have been prepared in accordance with the applicable set of accounting standards,and give a true and fair view of the assets, liabilities, financial position and results of the Company and all ofits consolidated subsidiaries, and that the interim report on the activity, fairly presents an accurate picture ofthe important events which occurred during the first six months of the fiscal year, their impact on the interimfinancial statements, the main transactions with related parties, and describe the main risks and uncertaintiesfor the remaining six months of the year”.
Sèvres, July 28, 2016
Richard Bielle,Chairman of the Management Board, CFAO
CFAO – 2016 Interim Financial Report
2
2. INTERIM MANAGEMENT REPORT
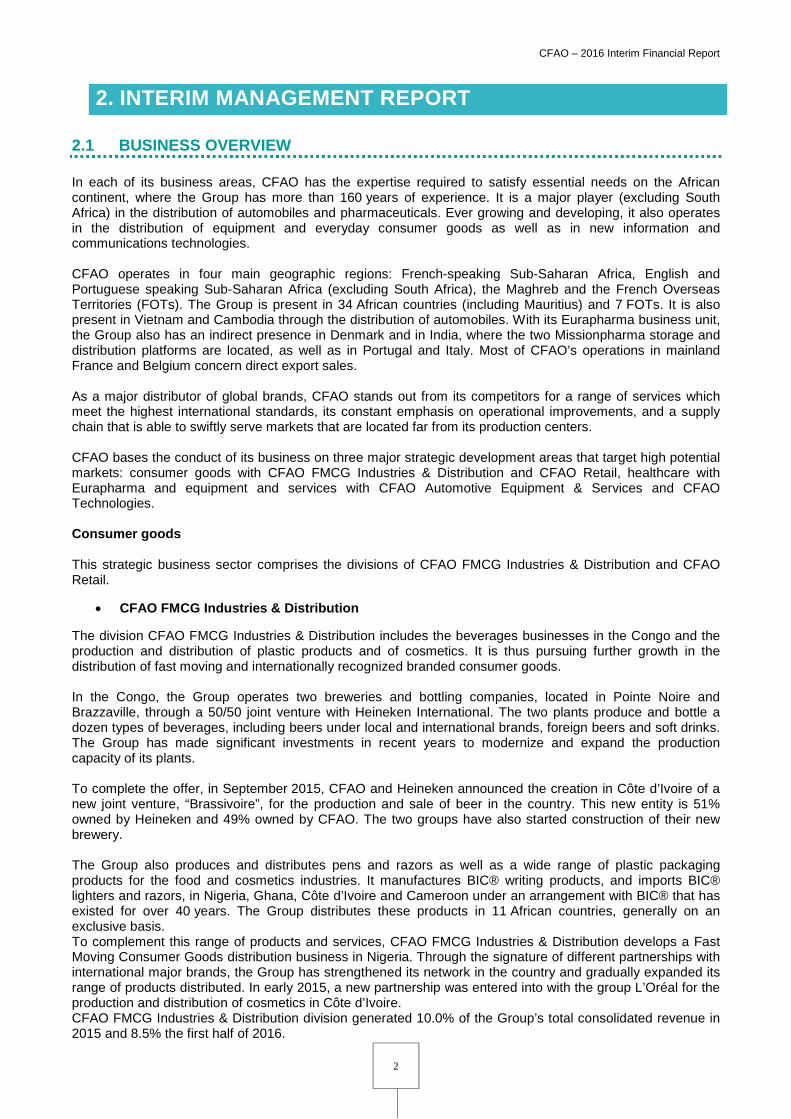
2.1 BUSINESS OVERVIEW
In each of its business areas, CFAO has the expertise required to satisfy essential needs on the Africancontinent, where the Group has more than 160 years of experience. It is a major player (excluding SouthAfrica) in the distribution of automobiles and pharmaceuticals. Ever growing and developing, it also operatesin the distribution of equipment and everyday consumer goods as well as in new information andcommunications technologies.
CFAO operates in four main geographic regions: French-speaking Sub-Saharan Africa, English andPortuguese speaking Sub-Saharan Africa (excluding South Africa), the Maghreb and the French OverseasTerritories (FOTs). The Group is present in 34 African countries (including Mauritius) and 7 FOTs. It is alsopresent in Vietnam and Cambodia through the distribution of automobiles. With its Eurapharma business unit,the Group also has an indirect presence in Denmark and in India, where the two Missionpharma storage anddistribution platforms are located, as well as in Portugal and Italy. Most of CFAO’s operations in mainlandFrance and Belgium concern direct export sales.
As a major distributor of global brands, CFAO stands out from its competitors for a range of services whichmeet the highest international standards, its constant emphasis on operational improvements, and a supplychain that is able to swiftly serve markets that are located far from its production centers.
CFAO bases the conduct of its business on three major strategic development areas that target high potentialmarkets: consumer goods with CFAO FMCG Industries & Distribution and CFAO Retail, healthcare withEurapharma and equipment and services with CFAO Automotive Equipment & Services and CFAOTechnologies.
Consumer goods
This strategic business sector comprises the divisions of CFAO FMCG Industries & Distribution and CFAORetail.
CFAO FMCG Industries & Distribution
The division CFAO FMCG Industries & Distribution includes the beverages businesses in the Congo and theproduction and distribution of plastic products and of cosmetics. It is thus pursuing further growth in thedistribution of fast moving and internationally recognized branded consumer goods.
In the Congo, the Group operates two breweries and bottling companies, located in Pointe Noire andBrazzaville, through a 50/50 joint venture with Heineken International. The two plants produce and bottle adozen types of beverages, including beers under local and international brands, foreign beers and soft drinks.The Group has made significant investments in recent years to modernize and expand the productioncapacity of its plants.
To complete the offer, in September 2015, CFAO and Heineken announced the creation in Côte d’Ivoire of anew joint venture, “Brassivoire”, for the production and sale of beer in the country. This new entity is 51%owned by Heineken and 49% owned by CFAO. The two groups have also started construction of their newbrewery.
The Group also produces and distributes pens and razors as well as a wide range of plastic packagingproducts for the food and cosmetics industries. It manufactures BIC® writing products, and imports BIC®lighters and razors, in Nigeria, Ghana, Côte d’Ivoire and Cameroon under an arrangement with BIC® that hasexisted for over 40 years. The Group distributes these products in 11 African countries, generally on anexclusive basis.To complement this range of products and services, CFAO FMCG Industries & Distribution develops a FastMoving Consumer Goods distribution business in Nigeria. Through the signature of different partnerships withinternational major brands, the Group has strengthened its network in the country and gradually expanded itsrange of products distributed. In early 2015, a new partnership was entered into with the group L’Oréal for theproduction and distribution of cosmetics in Côte d’Ivoire.CFAO FMCG Industries & Distribution division generated 10.0% of the Group’s total consolidated revenue in2015 and 8.5% the first half of 2016.

CFAO – 2016 Interim Financial Report
3
CFAO Retail
The purpose of CFAO Retail is to build and operate a group of shopping centers in 8 countries in West andCentral Africa (Cameroon, Congo, Côte d’Ivoire, Gabon, Ghana, Nigeria, Democratic Republic of the Congoet Senegal) adapted to the needs of the African consumers. The shopping malls will be organized around acentral attraction consisting of a food retail outlet, with Carrefour, the second largest retailer in the world. Theshopping malls will host a “Club of Brands”, a network of international retailers wishing to support the growthof the middle class in Africa, as well as local retailers and services. A food court will complete the consumeroffer.
CFAO Retail covers three areas of expertise: the construction and operation of shopping malls, food retailoutlets and franchises for international retail brands.
2015 was marked by the opening of the first shopping mall in Abidjan (Côte d’Ivoire): PlaYce Marcory.Inaugurated in 2015, this mall has a total surface area of 20,000 square meters and consists of three zones: aCarrefour hypermarket, a shopping arcade with 55 stores and a food court.In June 2016, CFAO has signed an agreement with Wendel and FFC—a joint venture between CDCInternational Capital and Qatar Investment Authority—under which the latter will acquire respective stakes of40% and 20% in SGI Africa, a company established by CFAO in 2015 to support the plan to develop theCarrefour brand and the “Club of Brands” in Africa.
The announcement wraps the round of financing for SGI Africa with a deal under which CFAO will retain a40% stake to continue creating value through the company.
After opening “PlaYce Marcory”, the first shopping centre in Abidjan on 18 December 2015,SGI Africa plans to build and operates some 20 shopping centres in eight countries in West and Central Africain the next five to seven years.
In early April, CFAO launched the Africashop web store in Côte d’Ivoire and Senegal. This unique, innovativee-commerce platform enables African consumers to purchase products from several leading French retailsites but also African designers. Through Africashop.com, consumers in Africa can now shop on partner-brand sites and benefit from home delivery. The platform provides direct access to the latest collections andallows users to add products from a variety of brands to a single basket.In June 2016, Africashop has joined the CFAO Retail Division, in order to take advantage of a wide array ofsynergies and ensure that a consistent overall approach is taken with all our partners.CFAO Retail division generated 0.1% of the Group’s total consolidated revenue in 2015 and 1% the first halfof 2016.
Healthcare
The Group, through its Eurapharma business unit, is one of the leading importers and distributors ofpharmaceutical products in Africa (excluding South Africa), in the French Overseas Territories. The Companyis present in 22 countries in Africa and the FOTs. Eurapharma also has an indirect presence in India andDenmark through Missionpharma (a company specialized in supplying generics and healthcare kits), inPortugal and in Italy. Eurapharma stands out through the range of services it offers to customers bothupstream (laboratories) and downstream (pharmacists). Its customers include the largest internationallaboratories. With over 60 years of experience, Eurapharma enjoys leading positions in its core historicalmarkets, French-speaking Sub-Saharan Africa, and the FOTs. Eurapharma also has a significant presence inmarkets it has entered more recently in English- and Portuguese-speaking Africa, including Nigeria.Furthermore, in Algeria, Eurapharma, via its Propharmal entity, assembles specialized pharmaceuticalproducts under license and manufactures to commissions from Algerian and foreign laboratories. Eurapharmahas also reinforced its Healthcare Institutional Clients segment over recent years by acquiring stakes in bothMissionpharma and Fazzini srl. Since the last quarter of 2015, Eurapharma also operates in Zambia as adistribution agent.Eurapharma has four main businesses: import-Wholesale-Resale, pre-wholesale, distribution agent andhealthcare institutional clients.
The Eurapharma division generated 36.4% of the Group’s total consolidated revenue in 2015 and 38.1% thefirst half of 2016.
Equipment

CFAO – 2016 Interim Financial Report
4
This strategic business sector comprises the divisions CFAO Automotive Equipment & Services and CFAOTechnologies.
CFAO Automotive Equipment & Services
CFAO Automotive is one of the leading importers and distributors of passenger and utility vehicles in Africa(excluding South Africa) and in the FOTs. The network buys, stocks, imports and distributes vehiclesproduced by major global automobile manufacturers. The Group has over 90 years of experience in thisbusiness. CFAO Automotive has dealerships in 33 African countries spanning the Maghreb (Algeria, Morocco)and Sub-Saharan Africa, (including Mauritius), 3 French Overseas Territories, and in Vietnam and Cambodia.As well as selling full ranges of new passenger and utility vehicles, CFAO Automotive also distributesmotorcycles, boats and motors for boats, and offers diverse services ranging from after sales services toselling spare parts and tires. The Group also assembles motorcycles, mopeds and trucks and transportvehicles.
CFAO Automotive is primarily active in business to business markets (private and public companies, NGOsand administrations in Sub-Saharan Africa and larger consumer markets (business to consumer) in the FOTs,the Maghreb, and for the past few months in Côte d’Ivoire with a premium range of second hand vehicles.
CFAO Equipment is a business to business network devoted to the selling and maintenance of equipment.The business offers a comprehensive range of transport vehicles, construction and handling machinery,agricultural equipment, tires, generators and elevators. In its specialized facilities, CFAO Equipment offers allthe services necessary for the machinery, material and equipment to be kept in proper running order:maintenance, tire services, fleet management, repairs, fitting, dismantling and assembly. The CFAOEquipment range of offers is built on robust partnerships with leading brands in their own fields.
Services’ main business activities are short- and long-term rental, spare parts and all brands services. In July2016, CFAO has announced that it has signed a new multi-year licence agreement with Avis Car Rental.CFAO operates the Avis Car Rental brand in western Africa and now, as part of this agreement will also offervehicle leasing to customers under the LOXEA / Avis Fleet new brand. Under the license agreement, CFAOwill offering leasing services in Benin, Burkina Faso, Cameroon, the Central African Republic, Chad, theRepublic of Congo, Gabon, Gambia, Equatorial Guinea, Côte d’Ivoire, Mali, Mauritania, Niger, Sao Tome andPrincipe, and Senegal.The activity covers all the requirements of professional customers to ensure the optimal use of their vehicles.It has access to the CFAO brand portfolio to put together an attractive offer including maintenance services infully-equipped workshops. CFAO also distributes spare parts, and offers multi-brand repair and maintenanceservices.
The CFAO Automotive Equipment & Services division generated 50.7 % of the Group’s total consolidatedrevenue in 2015 and 50.0% the first half of 2016.
CFAO Technologies
Created in 2002, CFAO Technologies is a major player in the market for integrated IT solutions, networks andtelecommunications in French-speaking Sub-Saharan Africa. In Africa, it offers a comprehensive andintegrated, high value added range of services in the field of New Information and CommunicationTechnologies (NICT). This Group business unit operates in 21 African countries through 9 subsidiaries(Cameroon, Côte d’Ivoire, Algeria, Senegal, Burkina Faso, Gabon, Mali, Benin and Togo) and four expertisecenters based in Algeria, Cameroon, Côte d’Ivoire and Senegal. CFAO Technologies draws on the expertiseof 160 engineers certified by its business partners to offer its customers a high level of expertise.CFAO Technologies’ customers include international and pan-African companies and other local marketparticipants. They mainly consist of companies and other public sector entities and telecommunications orbanking companies in the private sector. Furthermore, the division is a commercial partner of major globalcompanies in Africa, including: IBM, Microsoft, Cisco, and others. CFAO Technologies has also expanded itspartnerships with other well-known global brands, supporting the development of their product offers. CFAOTechnologies became in 2015 the first certified partner to Cisco (Gold certification), renewed in May 2016, in18 African countries and certified partner to HP (Gold server).
The CFAO Technologies generated 2.7% of the Group’s total consolidated revenue in 2015 and 2.3% the firsthalf of 2016.
CFAO Holding, the Group's Holding division, includes centralized support services, such as the Group's

CFAO – 2016 Interim Financial Report
5
human resources, IT systems, communication, development, audit and financial, accounting, legal and taxdepartments.Main risks and uncertainties for the remaining six months of the yearThe main risks and uncertainties to which the Group could be exposed in the second half of 2016 are similarto those described in the Risk factors chapter of the 2015 Registration Document (Chapter 4).
CFAO launched recently a new business within the CFAO retail division. Africashop is web platform offeringan access to several different brands of consumer goods. risks remain inherent to the activity and the successof new projects.
2.2. MAIN RISKS AND UNCERTAINTIES FOR THE REMAINING SIX MONTHS OFTHE YEAR
The main risks and uncertainties to which the Group could be exposed in the second half of 2016 aredescribed in the Risk factors chapter of the 2015 Registration Document (Chapter 4).
CFAO launched recently a new business within the CFAO Retail division. Africashop is web platform offeringan access to several different brands of consumer goods. Risks remain inherent to the activity and thesuccess of new projects.

CFAO – 2016 Interim Financial Report
6
2.3 ANALYSIS OF THE GROUP’S FINANCIAL PERFORMANCE FORTHE SIX MONTHS ENDED JUNE 30, 2016
2.3.1. COMPARISON OF THE GROUP’S RESULTS FOR THE SIX-MONTH PERIODSENDED JUNE 30, 2015 AND JUNE 30, 2016
The table below shows the Group’s consolidated income statements for the six-month periodsended June 30, 2015 and June 30, 2016, in millions euros and as a percentage of consolidatedrevenue for the periods presented.
First-half 2016 First-half 2015
Change(in €millions)
as a % ofrevenue
(in €millions)as a % ofrevenue
Revenue 1,674.2 100.0% 1,676.2 100.0% -0.12%
Cost of sales -1,266.1 -75.6% -1,262.4 -75.3% 0.30%
Gross profit 408.1 24.4% 413.8 24.7% -1.38%
Payroll expenses -151.3 -9.0% -150.2 -9.0% 0.75%
Other recurring operatingincome and expenses
-156.8 -9.4% -143.7 -8.6% 9.13%
Recurring operatingincome
100.0 6.0% 119.9 7.2% -16.64%
Other non-recurringoperating income andexpenses
13.3 0.8% 5.3 0.3% 152.53%
Operating income 113.3 6.8% 125.2 7.5% -9.52%
Finance costs, net -21.8 -1.3% -22.3 -1.3% -2.61%
Income before tax 91.5 5.5% 102.9 6.1% -11.02%
Income tax -40.2 -2.4% -42.0 -2.5% -4.41%
Overall effective tax rate 43.9% 40.8%
Share in earnings ofassociates
-0.4 0.0% 0.4 0.0% -187.02%
Net income of consolidatedcompanies
50.9 3.0% 61.3 3.7% -16.98%
Non-controlling interests 14.0 0.8% 18.2 1.1% -23.4%
Net income attributable toowners of the parent
36.9 2.2% 43.1 2.6% -14.29%
2.3.2. REVENUE
Over the first half of 2016 the revenue very slightly decreased by -0.1% to €1,674.2 millioncompared to €1,676.2 million in the first-half of 2015. The Healthcare business line growth wasoffset by the contraction of the Consumer Goods business line mainly due to a difficult economicenvironment in Nigeria and in the Congo. The Equipment & Services business line showed steadyrevenues.
The Group scope changes in the first half 2016 concerned mostly the Consumer Goods businessline with the start of CFAO Retail activity (+€17.2 million) and the acquisition of Sicobel (+€2.4million), and the Equipment & Services business line with the acquisition of the CompagnieMauritanienne de Distribution Automobile (+€9.2 million) and the launch of Yamaha Nigeria(+€1.9 million). These changes had a positive impact on the revenue of +€32.1 million in the first-half 2016.

CFAO – 2016 Interim Financial Report
7
Exchange rate fluctuations had a negative impact on the translation of revenue into euros of-€36.2 million. The Equipment & Services business line was the most impacted by the devaluationof some local currencies against the Euro: Algerian Dinar, Nigerian Naira, Kenyan Shilling, andZambian Kwacha.
On a like-for-like basis (constant Group structure and exchange rates), first-half 2016 revenueincreased by +0.1%.
The table below provides a breakdown of revenue by business line and geographical area for first-half 2015 and first-half 2016.
First-half 2016 First-half 2015 Changeon a like-for-likebasis
Changeon a
reportedbasis
(in €millions)as a % ofrevenue
(in €millions) as a % of revenue
Consumer Goods 160.2 9.6% 168.3 10.0% -13.9% -4.8%
Healthcare 637.7 38.1% 628.5 37.5% +3.2% +1.5%
Equipment & Services 876.3 52.3% 879.4 52.5% +1.0% -0.3%
Total 1,674.2 1,676.2 +0.1% -0.1%
French-speaking Sub-SaharanAfrica
778.6 46.5% 748.1 44.6% +0.3% +4.1%
English andPortuguese-speaking Sub-Saharan Africa
221.4 13.2% 242.5 14.5% -0.8% -8.7%
French Overseas Territories andOther
398.4 23.8% 383.9 22.9% +4.0% +3.8%
Maghreb 67.7 4.0% 124.8 7.4% -40.1% -45.8%
Other Europe 208.2 12.4% 176.8 10.5% +17.6% +17.7%
Total 1,674.2 1,676.2 +0.1% -0.1%
2.3.2.1 Consumer Goods
The table below provides a breakdown of revenue of the Consumer Goods business line for first-half 2015 and first-half 2016:
First-half 2016 First-half 2015Change
(in €millions)as a % ofrevenue
(in €millions)as a % ofrevenue
Beverages 104.2 65.1% 110.2 65.5% -5.5%
Food, Hygiene & Convenience 38.7 24.2% 58.1 34.5% -33.3%
Retail 17.2 10.8% 0.0 0.0%
Total 160.2 168.3 -4.8 %
The Consumer Goods business line revenue for the first-half 2016 decreased by -4.8% to €160.2million.
After several years of ongoing growth, the Beverages activity sales recorded a decrease of -5.5%to €104.2 million, negatively impacted by a more difficult environment in the Congo.
The Food, Hygiene & Convenience activity suffered from an overall slowdown in Nigeria, andshowed a -33.3% drop to €38.7 million.
Those adverse effects were only partially offset by the revenues generated by CFAO Retailbusiness unit launched in December 2015 in Ivory Coast and performing according to expectations.

CFAO – 2016 Interim Financial Report
8
2.3.2.2 Healthcare
The table below provides a breakdown of revenues of the Healthcare business line for first-half2015 and first-half 2016:
First-half 2016 First-half 2015
Change(in €millions)
as a % ofrevenue
(in €millions)as a % ofrevenue
Import-wholesale-retail 444.4 69.7% 421.0 67.0% +5.6%
Pre-Wholesale 80.2 12.6% 97.5 15.5% -17.8%
Distribution agent 46.7 7.3% 44.4 7.0% +5.3%
Healthcare institutional clients 64.0 10.0% 64.2 10.2% -0.2%
Other 2.4 0.4% 1.5 0.2% +58.1%
Total 637.7 628.5 +1.5%
The table below presents the Healthcare business line revenue trends by geographic area in first-half 2015 and first-half 2016:
First-half 2016 First-half 2015
Change(in €millions)
as a % ofrevenue
(in €millions)as a % ofrevenue
French-speaking Sub-SaharanAfrica
254.0 39.8% 233.8 37.2% +8.7%
Maghreb 30.6 4.8% 48.7 7.8% -37.1%
French Overseas Territories andOther
190.4 29.8% 187.2 29.8% +1.7%
English and Portuguese-speaking Sub-Saharan Africa
46.7 7.3% 44.4 7.1% +5.3%
Others Europe 116.0 18.2% 114.4 18.2% +1.3%
Total 637.7 628.5 +1.5%
The Healthcare business line posted +1.5% revenue growth during the first-half 2016 to€637.7 million.
The Import-Wholesale-Retail and Distribution agents activities progressed well, by respectively+5.6% and +5.3%, to reach €444.4 million and €46.7 million.
The Pre-wholesale activity was largely affected by the price decrease of imported medicines inAlgeria and showed in total a -17.8% decrease to €80.2 million.
The Healthcare institutional client activity was steady at €64.0 million compared to €64.2 over thesame period last year.

CFAO – 2016 Interim Financial Report
9
2.3.2.3 Equipment & Services
The table below provides a breakdown of revenue of the Equipment & Services business line forfirst-half 2015 and first-half 2016:
First-half 2016 First-half 2015
Change(in €millions)
as a % ofrevenue
(in €millions)as a % ofrevenue
Light vehicles and others 521.9 60.0% 518.5 59.0% +0.7%
Used vehicles 28.0 3.2% 27.0 3.1% +3.5%
Services, spare parts and tires 117.1 13.4% 124.6 14.2% -6.1%
Motorcycles and other 33.7 3.8% 29.9 3.4% +12.8%
Heavy trucks 71.1 8.1% 82.4 9.4% -13.7%
Machinery 23.5 2.7% 25.1 2.9% -6.1%
Elevators 18.2 2.1% 17.4 2.0% +4.2%
Rental Services 23.8 2.7% 21.5 2.4% +10.5%
Total Automotive Equipment &Services
837.3 95.6% 846.4 96.3% -1.1%
Technologies 39.0 4.4% 32.9 3.7% +18.4%
Total 876.3 879.4 -0.4%
The table below presents the Automotive Equipment & Services business unit revenue trends bygeographic area in first-half 2015 and first-half 2016:
First-half 2016 First-half 2015
Change(in €millions)
as a % ofrevenue
(in €millions)as a % ofrevenue
French-speaking Sub-SaharanAfrica
357.2 40.8% 364.6 41.5% -2.0%
Maghreb 33.7 3.8% 71.9 8.2% -53.2%
French Overseas Territories andOther
208.0 23.7% 196.8 22.4% +5.7%
English and Portuguese-speaking Sub-Saharan Africa
148.1 16.9% 153.8 17.5% -3.7%
France (export) 90.3 10.3% 59.5 6.8% +51.8%
Total Automotive Equipment &Services
837.3 95.6% 846.4 96.3% -1.1%
Technologies 39.0 4.4% 32.9 3.7% +18.4%
Total 876.3 879.4 -0.4%
In the first half of 2016, the Equipment & Services business line revenue showed a slight decreaseto €876.3 million.
In line with last year trend, CFAO’s Automotive Equipment & Services activity was down by -€38.2million in the Maghreb region due to a complex market environment for the Group in this area.Moreover the Equipment activity (notably trucks and machinery) suffered from an adverseenvironment.
The Technologies segment showed a good performance with a +18.4% increase to €39 million.

CFAO – 2016 Interim Financial Report
10
2.3.3. GROSS PROFIT
Gross profit accounted to €408.1 million during the first semester 2016, down by -1.4% year onyear.Gross profit margin decreased by 0.3 point at 24.4%, compared to 24.7% in first-half 2015, mostlydue to the unfavourable trend of the euro/yen exchange rate on the automotive activity.
2.3.4. PAYROLL EXPENSES
Payroll expenses increased by +0.8% to €151.3 million for the first half of the year compared with€150.2 million in first-half 2015. In addition to the entry of new companies in the consolidationscope, this increase reflects the ramp-up of new development projects. The revenue being steady,these expenses represented 9.0% of revenue for the first half of 2016, as in first-half 2015.
2.3.5. OTHER RECURRING OPERATING INCOME AND EXPENSES
Other recurring operating income and expenses moved up +9.1% to a net expense of €156.8million in first-half 2016, versus €143.7 million for the same period in 2015. As a percentage ofrevenue, these expenses increased slightly year on year from 8.6% to 9.4%.
2.3.6. CONSOLIDATED RECURRING OPERATING INCOME
Recurring operating income was down -16.6% at €100.0 million, representing a recurring operatingprofit margin of 6.0% compared to 7.2% over the same period last year, notably due to the start-upcosts of development projects
The table below provides a breakdown of recurring operating income by business line:
First-half 2016 First-half 2015
Change(in € millions)
as a % ofrevenue
(in € millions)as a % ofrevenue
Consumer Goods 8.2 5.1% 26.4 15.7% -69.3%
Healthcare 49.5 7.8% 48.7 7.7% 1.7%
Equipment & Services 55.6 6.3% 60.4 6.9% -7.9%
CFAO Holding -13.3 - -15.7 - -14.7%
Total 100.0 6.0% 119.9 7.2% -16.6%
The Consumer Goods business line business line showed a -69.3% decrease in recurringoperating profit from €26.4 million to €8.2 million. The business line is simultaneously impacted bya difficult business environment in the Congo and in Nigeria, and the increasing start-up costs ofCFAO Retail business unit.
The Healthcare business line recurring operating profit increased by +1.7% to €49.5 million. Thisbusiness line pursued its growth trend while maintaining its profitability.
The Equipment & Services business line recurring operating income was down -7.9% mainlycaused by the drop in the gross margin rate of the Automotive Equipment & Services division.
Lastly, holding costs were reduced from -€15.7 million to -€13.3 million.

CFAO – 2016 Interim Financial Report
11
2.3.7. OPERATING INCOME
CFAO ended the first half of 2016 with an operating income of €113.3 million (including a non-recurring profit of €13.3 million), or 6.8% of revenue, versus €125.2 million last year.
2.3.8. NET FINANCE COSTS
The table below provides a breakdown of the Group’s net finance costs in first-half 2015 and first-half 2016:
In € millions First-half 2016 First-half 2015
Cost of net debt -19.8 -22.0
Other financial income and expenses -2.0 -0.3
Net finance costs -21.8 -22.3
The net finance cost decreased by -€0.5 million during the first half of 2016 to €21.8 million.
2.3.9. INCOME TAX
Income tax includes taxes paid or for which provisions are made in a given period, as well as taxadjustments paid or provisioned during the period.The Group recognized income tax expense of €40.2 million in the first half of 2016 versus €42.0million for the same period in 2015. The overall effective tax rate was 43.9% for the period,compared with 40.8% in first-half 2015.
2.3.10. NET INCOME
The Group's share in earnings of associates amounted to -€0.4 million in the first half of 2016,versus €0.4 million in the comparable prior-year period.
Net income from continuous operations decreased by -17.0% at €50.9 million.
Net income attributable to non-controlling interests decreased by -23.4% to €14.0 million. Itrepresented 27.5% of consolidated net income in first half 2016 vs. 29.7% in first half 2015.
Net income attributable to owners of the parent came in at €36.9 million in first-half 2016, down by-14.3% from €43.1 million in the same period of 2015.
Earnings per share amounted to €0.59 in first-half 2016, versus €0.70 in first-half 2015.
2.3.11 Net debt and capital expenditureIn the context of ongoing investment programs and increasing working capital requirements, thegroup still generated a cash outflow of €4,7million overt the first-half 2016.
As of June 30, 2016, net debt amounted to €585.9 million, up €22.9 million compared to end-2015and €45.9 million compared to end of June 2015.
The gearing ratio stood at 0.6 at end of June 2016, as at end of June 2015, increasing by 7 pointscompared to December 2015.

CFAO – 2016 Interim Financial Report
12
2.4. RELATED PARTY TRANSACTIONS
Information on transactions with related parties is provided in Chapter 19 “Related-partytransactions” of the 2015 Registration Document.
During the first half of 2016, CFAO entered into the following transactions with the related parties:
1. Modification of the employment contracts of Mr. Olivier Marzloff and Mr. Alain Pécheur:fixed compensation for 2016 (approved by the Supervisory Board held onMarch 24
th, 2016). For more details on these elements of compensation, please refer to
Chapter 15 “Compensation and benefits” of the 2015 Registration Document.
The Supervisory board decided to increase their fixed compensation by 2.4%. For 2016,the fixed compensation of both, MM. Oliver Marzloff and Alain Pécheur, amounted to€305,000.
The Supervisory Board held on March 24, 2016 motivated this agreement as follows: “theincrease of the fixed compensation is in line with the benchmark of market practices in2015”.
2. Amendment to the employment contract of M. Toshimtsu Imai, following his appointmentas member of the Management board of CFAO (due to the anteriority of his employmentagreement with CFAO)
The Supervisory board held on February 25th, 2016, appointed Mr. Toshimitsu Imai as new
member and Vice-Chairman of the Management board, pending the resignation of themember he was to replace (Mr. Ichiro Kashitani). The same Supervisory board, uponrecommendation of the Nomination and Compensation Committee, approved his globalcompensation for 2016.
The Supervisory board met on March 24, 2016 motivated this agreement as follows: “thecompensation of Mr. Toshimitsu Imai is in line with (i) his experience (ii) the globalcompensation of his predecessor, Mr. Ichiro Kashitani, (iii) compensation practices inJapan”.
The Group did not make any changes that affected the transactions with related parties describedin the 2015 Registration Document.
Other information pertaining to related-party transactions is described in Note 21 of the appendix ofthe interim consolidated financial statements.
2.5 SIGNIFICANT EVENTS DURING THE FIRST SIX MONTHS OF 2016
CFAO RetailAfter the successful launch of the shopping mall in Abidjan, Côte d’Ivoire, mid-december, CFAOhas signed an agreement with Wendel and FFC under which the latter will acquire respectivestakes of 40% and 20% in SGI Africa, a company established by CFAO in 2015 to support the planto develop the Carrefour brand and the “Club of Brands” in Africa.
CFAO Automotive Equipment & ServicesIn May 2016, the assembly plant CFAO Yamaha was launched in Nigeria and the plant is expectedto produce 70,000 units annually by 2018.
Group

CFAO – 2016 Interim Financial Report
13
Member of the CFAO Supervisory Board since May 2012, M. Pierre Guénant has been appointedChairman of the Supervisory Board on June 17 2016. The Board also appointed Mrs Sylvie Rucar,member of the CFAO Supervisory Board since May 2012, as Vice Chairwoman.
Moreover, M. Momar Nguer, President of the Marketing & Services branch and member of TotalExecutive Committee, joined CFAO Supervisory Board, effective 17 June 2016.
2.6 SUBSEQUENT EVENTS
CFAO Automotive Equipment & ServicesCFAO announced in July 2016 that it has signed a new multi-year license agreement with Avis CarRental, one of the world’s best-known car rental brands. CFAO operates the Avis Car Rental brandin Western Africa and, as part of this agreement, will also from now on offer vehicle leasing tocustomers.

CFAO – 2016 Interim Financial Report
14
2.7 COMPENSATION AND BENEFITS OF THE EXECUTIVE CORPORATEOFFICERS
2.7.1 VARIABLE COMPENSATION OF THE MEMBERS OF THE MANAGEMENTBOARD FOR 2015
Mr. Toshimitsu Imai :
The Supervisory Board held on July 27, 2016, was informed about the 2015 final variablecompensation of Mr. Toshimitsu Imai to be paid in 2016:6 516 000 ¥ which is equivalent to 48 627 €.
As a reminder, this pay-out is not subject to the approval by the Supervisory board as this variablecompensation is due for 2015, therefore, before the appointment of Mr. Toshimitsu Imai as memberof the Management board.
2.7.3 DIFFERED COMPENSATION
2016-2020 Long Term Incentive Plan
The Supervisory Board meetings held on March 24, 2016 and April 27, 2016, decided, afterconsultation of the Nomination and Compensation Committee to approve the proposal made by theManagement Board setting out the terms of the Long Term Incentive Plan covering the period from2016(2020), of which certain members of the Management Board (Mr. Richard Bielle, Mr. OlivierMarzloff and Mr. Alain Pécheur) are also beneficiaries. The Management Board meeting held onJuly 25, 2016 finalized the list of the beneficiaries of the above-mentioned Plan.
The beneficiaries of the Plan are the members of the Management Board, employees ofcontinental France having a role of managers, or being in charge of a particular area or activity, aswell as employees who are General Managers or Administrative and Financial Managers ormembers of the Management Committee of one of the subsidiaries, or key employees identified ashigh-potential ones. In total, 190 employees are beneficiaries of this plan.
The Plan implies having a system of deferred compensation remitted to the beneficiaries if thepresence criterion as well as the performance criteria are met. This system is based on the NetIncome Attributable to Owners annual increase. The threshold for payment is 80% of theperformance criterion. If the objectives are exceeded, it is capped at 150%.
The Supervisory Board has decided that the amount allocated to Mr. Olivier Marzloff and Mr. AlainPécheur should represent 30% of the addition of 2016 compensation and of the target variablecompensation for 2016. For Mr. Richard Bielle, the amount would represent 40% of this fixedaddition.
For confidentiality reasons, the level of achievement of objectives which must be reached to satisfyeach of the performance conditions stated above cannot be disclosed to the public.

CFAO – 2016 Interim Financial Report
15
2.8 OUTLOOK
The economic environment in Sub-Saharan Africa is challenging, growth forecasts in this area isonly 1.6% in 2016 after a growth of 3.3% in 2015 according to the last IMF report update recentlyreleased.Recent falls in the oil price and commodity prices generally imply a decline in revenues for oil-producing countries, especially Nigeria where the Naira was highly devaluated.Security issues are persistent in this area and continue to affect the growth.
For CFAO, the back-half of 2016 should confirm the slight uptrend in sales compared to the firstquarter of the year. The situation should however remain difficult in commodity-based economies,notably those depending on oil, with Nigeria being ranked first.
Development projects will continue to be deployed by the Group with notably new sitesconstruction for the CFAO retail division.

CFAO – 2016 Interim Financial Report
16
3. CONDENSED INTERIM CONSOLIDATEDFINANCIAL STATEMENTS FOR THE SIX MONTHSENDED JUNE, 30 2016
Condensed interim consolidated financial statements for the six months endedJune 30, 2016
In this report, ‘‘Company’’ refers to CFAO SA, parent company of the CFAO Group. ‘‘Group’’ refersto the Company, its consolidated subsidiaries and its interests in associates.
The Group’s consolidated financial statements for the six months ended June 30, 2015 andJune 30, 2016 and for the year ended December 31, 2015 were prepared in accordance with theInternational Financial Reporting Standards (‘‘IFRS’’) and IFRIC interpretations adopted for use bythe European Union and applicable as of June 30, 2016.
Consolidated income statement for the six-month periods ended June 30, 2016 andJune 30, 2015
(in € millions) Notes 30/06/2016 30/06/2015
Revenue 4 1,674.2 1,676.2
Cost of sales (1,266.1) (1,262.4)
Gross profit 408.1 413.8
Payroll expenses 5 - 6 (151.3) (150.2)
Other recurring operating income and expenses (156.8) (143.7)
Recurring operating income 4 100.0 119.9
Other non-recurring operating income and expenses 7 13.3 5.3
Operating income 113.3 125.2
Cost of net debt 8 (19.8) (22.0)
Other financial income and expenses 8 (2.0) (0.3)
Income before tax 91.5 102.9
Income tax 9 (40.2) (42.0)
Share in earnings of associates (0.4) 0.4
Net income of consolidated companies 50.9 61.3
Net income attributable to owners of the parent 10 36.9 43.1
Net income attributable to non-controlling interests 10 14.0 18.2
Net income attributable to owners of the parent 36.9 43.1
Earnings per share (in €) 10 0.59 0.70
Fully diluted earnings per share (in €) 10 0.59 0.70

CFAO – 2016 Interim Financial Report
17
Consolidated statement of comprehensive income for the six-month periods endedJune 30, 2016 and June 30, 2015
(in € millions) Notes 30/06/2016 30/06/2015
Net income 50.9 61.3
Items that may be reclassified to income: (15.3) 1.4
Foreign exchange gains and losses and other (15.3) 1.4
Items taht will not be reclassified to income: 0.0 (0.1)
Actuarial gains and losses(1) 0.0 (0.1)
Other comprehensive income 11 (15.3) 1.3
Total comprehensive income 35.6 62.6
o/w attributable to owners of the parent 23.0 40.5
o/w attributable to non-controlling interests 12.6 22.2
(1) Net of tax

CFAO – 2016 Interim Financial Report
18
Consolidated statement of financial position as of June 30, 2016, June 30, 2015 andDecember 31, 2015ASSETS
(in € millions) Notes 30/06/2016 30/06/2015 31/12/2015
Goodwill 208.0 212.6 212.2
Other intangible assets 49.8 38.6 49.6
Property. plant and equipment 476.0 475.3 521.1
Investments in associates 43.3 12.3 18.9
Non-current financial assets 84.7 64.1 69.8
Deferred tax assets 24.1 26.1 23.0
Other non-current assets 3.5 4.1 3.8
Non-current assets 889.4 832.9 898.5
Inventories 884.5 896.5 892.1
Trade receivables 524.2 544.9 538.6
Current tax receivables 36.0 40.4 59.2
Other current financial assets 12.4 7.4 4.8
Other current assets 168.8 191.3 178.8
Cash and cash equivalents 13 218.3 216.7 201.7
Current assets 1,844.2 1,897.1 1,875.3
Total assets 2,733.6 2,730.0 2,773.9
EQUITY AND LIABILITIES
(in € millions) Notes 30/06/2016 30/06/2015 31/12/2015
Share capital 12 10.5 10.5 10.5
Translation adjustments (40.8) (25.7) (27.0)
Treasury shares (1.3) (0.9) (0.8)
Other reserves 797.7 746.3 812.5
Equity attributable to owners of the parent 12 766.1 730.2 795.1
Non-controlling interests 206.0 214.1 217.0
Total equity 12 972.1 944.3 1 012.2
Non-current borrowings 14 319.2 223.4 219.2
Provisions for pensions and other post-employment benefits 46.2 42.6 43.0
Other provisions 5.2 7.6 5.8
Deferred tax liabilities 1.4 0.2 2.0
Non-current liabilities 372.0 273.9 269.8
Current borrowings 14 485.0 556.2 522.6
Other current financial liabilities 10.8 22.1 9.2
Trade payables 499.9 520.1 528.4
Provisions for pensions and other post-employment benefits 1.1 1.2 1.1
Other provisions 20.0 25.3 21.9
Current tax liabilities 34.1 43.5 57.2
Other current liabilities 338.6 343.5 351.5
Current liabilities 1,389.5 1,511.8 1,491.9
Total equity and liabilities 2,733.6 2,730.0 2,773,9

CFAO – 2016 Interim Financial Report
19
Consolidated statement of cash flows for the six-month periods ended June 30, 2016 andJune 30, 2015, and the year ended December 31, 2015
(in € millions) Notes 30/06/2016 30/06/2015 31/12/2015
Net income 50.9 61.3 145.6
Net charges to depreciation, amortization and provisions on non-current
operating assets37.5 32.0 65.9
Proceeds on disposal of leasing fleets 2.7 3.1 6.3
Other non-cash income and expenses (15.4) (12.9) (17.1)
Cash flow from operating activities 75.7 83.5 200.8
Interest paid/received 22.6 23.6 51.6
Dividends received (0.8) (1.7) (3.7)
Net income tax payable 42.8 42.4 82.1
Cash flow from operating activities before tax, dividends and interest 140.3 147.8 330.8
Change in w orking capital requirement (51.9) (63.1) (41.8)
Income tax paid (43.6) (49.2) (93.8)
Net cash from (used in) operating activities 44.8 35.4 195.2
Purchases of leasing fleets 19.1 (9.8) (8.6) (18.2)
Other purchases of property, plant and equipment and intangible assets 19.1 (49.2) (62.0) (154.9)
Proceeds from disposals of property, plant and equipment and intangible assets19.1 18.9 5.5 24.6
Total investments in property, plant and equipment 19.1 (40.1) (65.1) (148.5)
Acquisitions of subsidiaries, net of cash acquired 19.2 (1.1) (7.6) (12.3)
Proceeds from disposals of subsidiaries, net of cash transferred 19.2 3.3 1.3 2.7
Purchases of other f inancial assets (27.9) (13.2) (26.3)
Proceeds from sales of other f inancial assets 49.6 8.3 16.9
Interest and dividends received (2.2) 0.5 4.5
Total financial investments 21.7 (10.7) (14.5)
Net cash used in investing activities (18.4) (75.8) (162.9)
Share capital increase/decrease 3.9 0.4 1.9
Dividends paid to ow ners of the parent company (50.8) (50.8) (50.8)
Dividends paid to non-controlling interests (27.7) (18.9) (43.0)
Issuance of debt 122.5 136.9 129.6
Repayment of debt (23.7) (9.7) (23.0)
Interest paid and equivalent (22.4) (24.1) (52.5)
Net cash used in financing activities 1.8 33.9 (37.8)
Impact of exchange rate variations 9.1 5.6 8.5
Impact of treasury shares (0.5) (0.0) 0.1
Other movements 14.5 0.4 5.0
Net increase (decrease) in cash and cash equivalents 51.3 (0.6) 8.0
Cash and cash equivalents net of bank overdrafts at beginning of
the period19 (277.5) (285.5) (285.5)
Cash and cash equivalents net of bank overdrafts at end of the
period19 (226.2) (286.1) (277.5)

CFAO – 2016 Interim Financial Report
20
Condensed consolidated statement of changes in equity
Number ofshares
outstanding
Sharecapital
Cumulativetranslation
adjustmentsand other
Otherreserves andnet incomeattributableto owners ofthe parent
Equity
(in € millions)
Owners ofthe parent
Non-controllinginterests
Totalequity
As of December 31, 2014 62,712,875 10.5 (26.9) 758.3 742.0 211.7 953.8
Comprehensive incomefor the year 2015
1.1 39.4 40.5 22.2 62.6
Share capitalincrease/decrease
0.4 0.4
Treasury shares 45,359 (1)
Valuation of share-basedpayment
Dividends paid (50.8) (50.8) (26.4) (77.2)
Changes in scope of consolidation 0,2 (1.7) (1.5) 6.2 4.7
As of June 30, 2015 62,711,706 10,5 (25.7) 745.2 730.2 214.1 944.3
Comprehensive incomefor the second-half 2015
(0.9) 67.8 66.9 1.3 68.2
Share capitalincrease/decrease
0.2 0.2 2.0 2.2
Treasury shares 6,430 (1) 0.1 0.1 0.1
Valuation of share-basedpayment
Dividends paid
Changes in scope of consolidation (0,4) (1.8) (2.2) (0.4) (2.6)
As of December 31, 2015 62,718,136 10,5 (27.0) 811.5 795.1 217.0 1 012.2
Comprehensive incomefor 2016
(14.1) 37.1 23.0 12.6 35.6
Share capitalincrease/decrease
(2.9) (2.9) 6.8 3.9
Treasury shares 39 015 (1) (0.4) (0.4) (0.4)
Valuation of share-basedpayment
Dividends paid (50.8) (50.8) (29.6) (80.4)
Changes in scope of consolidation 0.3 1.8 2.1 (0.8) 1.3
As of June 30, 2016 62,718,050 10.5 (40.8) 796.4 766.1 206.0 972.1(1) Within the framework of the liquidity agreement and share buybacks forperformance share plans

CFAO – 2016 Interim Financial Report
21
4. NOTES TO THE CONDENSED INTERIM CONSOLIDATED FINANCIALSTATEMENTS
Note 1 Introduction ..............................................................................................................................22
Note 2 Accounting policies and methods .........................................................................................22
Note 3 Scope of consolidation ...........................................................................................................24
Note 4 Operating segments ................................................................................................................24
Note 5 Share-based payment..............................................................................................................27
Note 6 Long Term Incentive Plan .......................................................................................................27
Note 7 Other non-recurring operating income and expenses.........................................................28
Note 8 Financial income and expenses.............................................................................................28
Note 9 Income tax ................................................................................................................................29
Note 10 Earnings per share..................................................................................................................29
Note 11 Other comprehensive income ...............................................................................................30
Note 12 Equity…………… .....................................................................................................................30
Note 13 Cash and cash equivalents.....................................................................................................31
Note 14 Gross borrowings ....................................................................................................................31
Note 15 Net debt…….. ...........................................................................................................................32
Note 16 Accounting classification and market value of financial instruments...............................32
Note 17 Exposure to foreign exchange risk........................................................................................34
Note 18 Derivative instruments at market value.................................................................................36
Note 19 Notes to the statement of cash flows ....................................................................................37
Note 20 Contingent liabilities, contractual commitments not recognized and othercontingencies...........................................................................................................................37
Note 21 Related parties .........................................................................................................................38
Note 22 Subsequent events ..................................................................................................................38

CFAO – 2016 Interim Financial Report
22
Note 1 Introduction
The CFAO Group, comprising CFAO SA ("the Company") and its subsidiaries (together, "the CFAOGroup" or "the Group") is one of the leading specialized retail brands in its key businesses in Africaand the French overseas territories.
CFAO is a major player in the import and distribution of vehicles and pharmaceutical products, andrelated logistical services, as well as in certain industrial activities and technological services inAfrica and the French overseas territories.The Group currently has operations in France, 34 African countries, seven French overseasterritories, Vietnam, Cambodia and Mauritius. CFAO is also present in Portugal, Denmark,Belgium, Italy and India where it carries out logistical and supply activities.
CFAO, the Group’s parent company, is a société anonyme (joint-stock company) governed by aSupervisory Board and Management Board incorporated under French law, whose registered officeis located at 18, rue Troyon, 92310 Sèvres, France. It is registered with the Nanterre Register ofCommerce and Companies under the reference 552 056 152 RCS Nanterre. CFAO SA is bound byall regulations governing commercial companies in France, and particularly the provisions of theFrench Commercial Code (Code de commerce).
The CFAO Group prepared its first financial statements under IFRS for the year ended December31, 2008.The CFAO Group's condensed interim consolidated financial statements for the six months endedJune 30, 2016 were approved for issue by the Management Board on July 27, 2016 and arepresented in euros.
Note 2 Accounting policies and methods
General principles and statement of compliance
The consolidated financial statements of the CFAO Group for the six months ended June 30, 2016were prepared in accordance with applicable international accounting standards adopted by theEuropean Union and of mandatory application as of that date. These international standardscomprise International Financial Reporting Standards (IFRS), International Accounting Standards(IAS) and the interpretations of the International Financial Reporting Interpretations Committee(IFRIC).
The condensed interim consolidated financial statements for the six months ended June 30, 2016have been prepared in accordance with IAS 34 – Interim Financial Reporting as adopted by theEuropean Union, which allows entities to present selected explanatory notes.
The notes do not therefore include all of the disclosures required for a complete set of annualfinancial statements, and should be read in conjunction with the consolidated financial statementsfor the year ended December 31, 2015.
IFRS basis adopted
The interim financial statements have been prepared in accordance with the accounting principlesand methods applied by the Group for the 2015 financial statements, except for income tax andemployee benefits, which are subject to specific valuation methods (Note 2.1).The standards, amendments and interpretations applicable for the first time in accounting periodsbeginning on or after January 1, 2015 and 2016 are as follows :IFRIC 21 : provides guidance on when to recognise a liability for a levy imposed by a government,both for levies that are accounted for in accordance with IAS 37 Provisions, Contingent Liabilitiesand Contingent Assets and those where the timing and amount of the levy is certain. The P&Limpact in June 2016 is equal to 1.8 M€.This interpretation has not been a material impact on the

CFAO – 2016 Interim Financial Report
23
group level and has not been retreated in June 2015.
2.1. Details specific to the preparation of interim financial statements
2.1.1. Income tax
The income tax charge for the period (current and deferred) is calculated based on the estimatedeffective tax rate for the period, for each tax entity.
2.1.2. Employee benefits
Barring a specific event during the period, no actuarial valuations are performed for the preparationof the interim consolidated financial statements. The charge for the first half of the year relating topost-employment benefits represents one-half of the net charge calculated for full-year 2016,based on the data and actuarial assumptions used for the year ended December 31, 2015.
2.1.3. Seasonality of operations
Seasonal fluctuations in operations do not have a material impact on any of the Group’s divisions.
2.2. Use of estimates and judgment
The preparation of interim consolidated financial statements requires the use of estimates andassumptions by Group management that can affect the carrying amounts of certain assets andliabilities, income and expenses, and the information disclosed in the accompanying notes. Groupmanagement reviews these estimates and assumptions on a regular basis to ensure theirpertinence with respect to past experience and the current economic situation. Items in futurefinancial statements may differ from current estimates as a result of changes in these assumptions.The impact of changes in accounting estimates is recognized during the period in which the changeoccurs and all affected future periods.
The main estimates made by Group management in the preparation of the interim consolidatedfinancial statements concern the value and useful lives of operating assets, property, plant andequipment, intangible assets and goodwill; the amount of contingency provisions and otherprovisions relating to operations; and deferred tax balances and derivatives.The main assumptions made by the Group are detailed in specific sections of the notes to thefinancial statements, in particular:
- Note 5 – Share-based payment- Note 16 – Accounting classification and market value of financial instruments- Note 17 – Exposure to foreign exchange risk
The cash-generating units (CGUs) providing the basis for impairment testing of non-financialassets reflect the criteria taken into account in defining operating segments (see Note 4).

CFAO – 2016 Interim Financial Report
24
Note 3 Scope of consolidation
The following changes in the scope of consolidation have occurred since June 30, 2015:
During the year 2015, CFAO created a joint-venture with Heineken to produce beer in Côted’Ivoire, this company named Brassivoire being consolidated with equity method.
On June 28, 2016, CFAO has signed an agreement with Wendel and FFC – a joint venturebetween CDC International Capital and Qatar Investment Authority – under which the latter willacquire respective stakes of 40% and 20% in SGI Africa, a company established by CFAO in 2015to support the plan to develop the Carrefour brand and the “ Club of Brands “ in Africa. CFAO joint-controlling SGI Africa, it is now consolidated in the Group accounts with equity method for 40%.
The other changes in the Group’s scope of consolidation did not have a material impact on thefinancial statements for the year.
Note 4 Operating segments
In accordance with IFRS 8 – Operating Segments, segment information is reported on the samebasis as used internally by the Chairman and/or other members of the Management Board – whoare the Group's chief operating decision makers – for evaluating operating segment performanceand deciding how to allocate resources to the segments.
In accordance with IFRS 8, an operating segment is a component of the Group that engages inbusiness activities from which it may earn revenues and incur expenses, whose operating resultsare regularly reviewed by the chief operating decision maker, and for which discrete financialinformation is available.Each operating segment is monitored separately for internal reporting purposes, according toperformance indicators common to all of the Group’s segments.
The segments presented are operating segments or groups of similar operating segments.As of the beginning of 2016, CFAO's organizational structure is based around our three strategicdevelopment areas :Equipment & Services : Automotive, Equipment & Services (the Equipment and Rental Servicesbusinesses now form part of this business line) and TechnologiesHealthcare : represented by Eurapharma Business unitConsumer Goods : FMCG Industries & Distribution (comprising the beverages, plastic productsand FMCG businesses) and CFAO Retail
The CFAO Holding & Others division primarily includes the overhead costs of the registered officeat Sèvres with all cross-divisional services which are not allocated to the operating divisions.
No aggregation of operating segments has taken place since the year ended December 31, 2015.The management data used to assess operating segment performance are prepared inaccordance with IFRS as applied by the Group for its consolidated financial statements.
The performance of each operating segment is measured based on recurring operating incomeand Net Income Attributable to Owners, which is the method used by the Group’s chief operatingdecision maker.

CFAO – 2016 Interim Financial Report
25
4.1 Information by division
(in € millions)
ConsumerGoods
HealthcareEquipment& Services
CFAOHolding& Other
Eliminations Total
As of June 30. 2016
Revenue 179.6 637.9 939.3 (82.6) 1,674.2
– non-Group 160.2 637.7 876.3 0.0 1,674.2
– Group 19.4 0.2 63.0 (0.0) 82.6
Recurring operating income 8.2 49.5 55.6. (13.3.) 100.0
Net recurring charges to depreciation.amortization and provisions on non-current operating assets
13.0 4.7 19.2 0.6 (0.0) 37.5
Proceeds on disposal of leasing fleets 2.7 2.7
Other non-cash recurring operatingincome and expenses
(2.3) (3.0) (1.8) (8.3) (0.0) (15.4)
Purchases of leasing fleets 0.0 9.8 9.8
Other purchases of property. plant andequipment and intangible assets. gross
23.6 8.2 16.9 0.5 49.2
Segment assets 332.7 722.2 1 203.8 56.1 2 314.8
Segment liabilities 60.7 296.8 447.0 33.7 838.2
(in € millions)
ConsumerGoods
HealthcareEquipment& Services
CFAOHolding& Other
Eliminations Total
As of June 30. 2015
Revenue 187.0 628.4 938.2 (77.5) 1,676.2
– non-Group 168.3 628.4 879.4 0.1 1,676.2
– Group 18.6 0.0 58.9 (0.1) 77.5
Recurring operating income 26.4 48.7 60.4 (15.7) 119.9
Net recurring charges to depreciation.amortization and provisions on non-current operating assets
9.9 4.2 17.4 0.5 (0.0) 32.0
Proceeds on disposal of leasing fleets 3.1 3.1
Other non-cash recurring operatingincome and expenses
(0.6) 0.9 (11.6) (1.6) 0.0 (12.9)
Purchases of leasing fleets 0.0 8.6 0.0 8.6
Other purchases of property. plant andequipment and intangible assets. gross
34.0 13.7 13.6 0.8 (0.0) 62.0
Segment assets 335.7 719.4 1,276.6 31.5 0.0 2,363.2
Segment liabilities 60.7 317.6 471.3 13.9 0.0 863.6
CFAO – 2016 Interim Financial Report
26
(in € millions)
ConsumerGoods
HealthcareEquipment& Services
CFAOHolding& Other
Eliminations Total
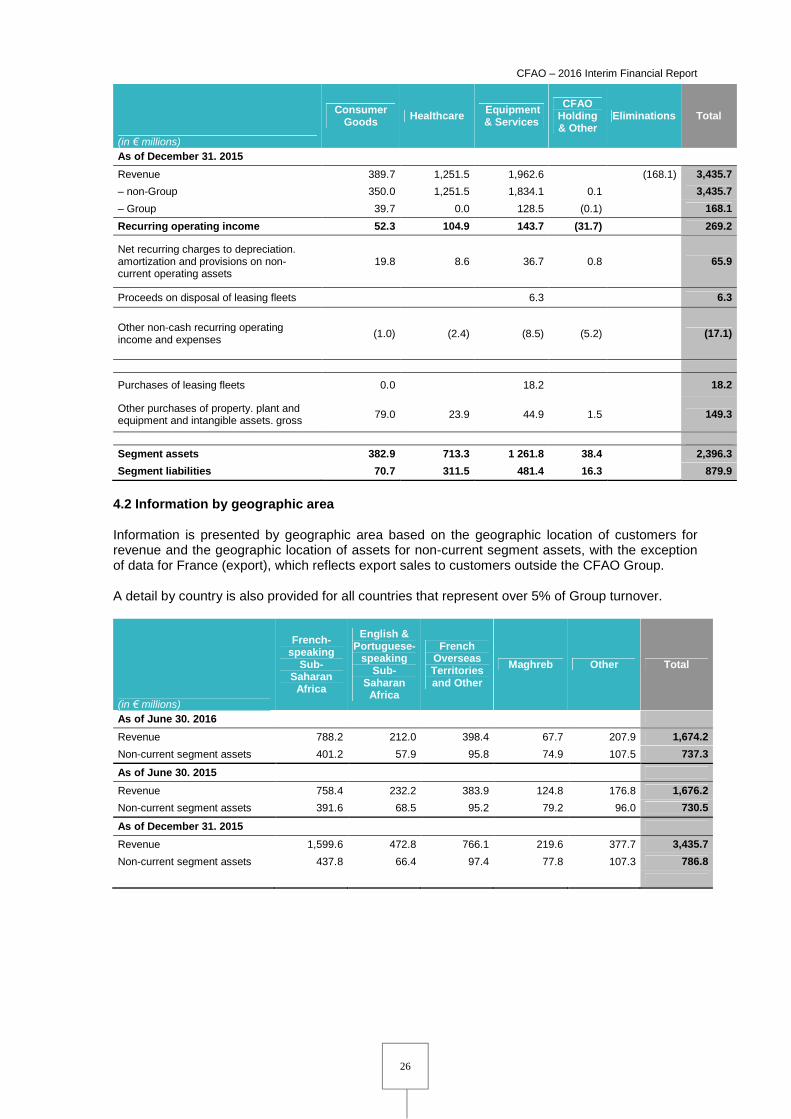
As of December 31. 2015
Revenue 389.7 1,251.5 1,962.6 (168.1) 3,435.7
– non-Group 350.0 1,251.5 1,834.1 0.1 3,435.7
– Group 39.7 0.0 128.5 (0.1) 168.1
Recurring operating income 52.3 104.9 143.7 (31.7) 269.2
Net recurring charges to depreciation.amortization and provisions on non-current operating assets
19.8 8.6 36.7 0.8 65.9
Proceeds on disposal of leasing fleets 6.3 6.3
Other non-cash recurring operatingincome and expenses
(1.0) (2.4) (8.5) (5.2) (17.1)
Purchases of leasing fleets 0.0 18.2 18.2
Other purchases of property. plant andequipment and intangible assets. gross
79.0 23.9 44.9 1.5 149.3
Segment assets 382.9 713.3 1 261.8 38.4 2,396.3
Segment liabilities 70.7 311.5 481.4 16.3 879.9
4.2 Information by geographic area
Information is presented by geographic area based on the geographic location of customers forrevenue and the geographic location of assets for non-current segment assets, with the exceptionof data for France (export), which reflects export sales to customers outside the CFAO Group.
A detail by country is also provided for all countries that represent over 5% of Group turnover.
(in € millions)
French-speaking
Sub-Saharan
Africa
English &Portuguese-
speakingSub-
SaharanAfrica
FrenchOverseasTerritoriesand Other
Maghreb Other Total
As of June 30. 2016
Revenue 788.2 212.0 398.4 67.7 207.9 1,674.2
Non-current segment assets 401.2 57.9 95.8 74.9 107.5 737.3
As of June 30. 2015
Revenue 758.4 232.2 383.9 124.8 176.8 1,676.2
Non-current segment assets 391.6 68.5 95.2 79.2 96.0 730.5
As of December 31. 2015
Revenue 1,599.6 472.8 766.1 219.6 377.7 3,435.7
Non-current segment assets 437.8 66.4 97.4 77.8 107.3 786.8

CFAO – 2016 Interim Financial Report
27
(in € millions)
Congo ReunionCôte
d'IvoireCameroon
FrenchAntilles
Nigeria Algeria
As of June 30. 2016
Revenue 154.6 131.7 129.7 121.1 114.8 63.2 46.0
as a % of Total revenue 9.2% 7.9% 7.7% 7.2% 6.9% 3.8% 2.7%
Non-current segment assets 201.2 21.3 43.3 18.3 12.2 22.8 33.6
as a % of Total Non-currentsegment assets
27.3% 2.9% 5.9% 2.5% 1.7% 3.1% 4.6%
As of June 30. 2015
Revenue 164.6 129.0 111.4 115.4 114.3 90.3 98.7
as a % of Total revenue 9.8% 7.7% 6.6% 6.9% 6.8% 5.4% 5.9%
Non-current segment assets 185.0 21.6 52.7 18.3 12.1 35.0 36.3
as a % of Total Non-currentsegment assets
25.3% 3.0% 7.2% 2.5% 1.7% 4.8% 5.0%
As of December 31. 2015
Revenue 330.8 258.8 244.1 241.8 227.8 180.7 170.7
as a % of Total revenue 9.6% 7.5% 7.1% 7.0% 6.6% 5.3% 5.0%
Non-current segment assets 199.9 22.1 76.9 19.4 12.0 31.9 35.9
as a % of Total Non-currentsegment assets
25.4% 2.8% 9.8% 2.5% 1.5% 4.1% 4.6%
Note 5 Share-based payment
In 2010, 2011 and 2012 the Group set up a stock option plan and free share plans. These plansare all vested.Following the take-over bid from TTC on CFAO in 2012, TTC owned 97.8 % of CFAO. As theliquidity on CFAO stock was reduced, a liquidity agreement was signed between TTC and stockoption and performance share plans beneficiaries.
Note 6 Long Term Incentive Plan
As a consequence of the illiquidity described above, long term incentive plans are now granted inplace of share-based payments. These plans are cash based plans with a vesting period of 4 yearsand have presence and performance conditions. The performance condition is capped at 120%and there is a cancelling threshold at 80%.
Rights are progressively acquired under the condition of remaining on the payroll of any TTC groupcompany (33% at the end of year 2, 66% at the end of year 3 and 100% at the end of year 4). Theplans charge is spread linearly over the four vesting years and is reestimated at the end of eachsemester.
A first plan was granted on November 7, 2013. Performance criterium is linked to a 7% yearlygrowth of recurring Operating Income from 2013 to 2016. The value of the plan is €7.1 millionincluding employer contribution and was granted to 631 beneficiaries. As the performancecondition was very under the threshold, the charge for the whole plan was cancelled.A second plan was granted on July 1, 2014. Performance criterium is linked to a 7% yearly growthof net income attributable to the owners of the parent from 2014 to 2017. The value of the plan is€7.8 million including employer contribution and was granted to 669 beneficiaries.A third plan was granted on July 1, 2015. Performance criterium is linked to a 7% yearly growth ofnet income attributable to the owners of the parent from 2015 to 2018. The value of the plan is €5.8million including employer contribution and was granted to 186 beneficiaries.
An income of €1.6 million was accounted at end of June 2016 in respect of LTI plans due to the

CFAO – 2016 Interim Financial Report
28
cancellation of 2013 LTI charge. These Long Term Incentive Plans are accounted for accordingIAS19 revised
Note 7 Other non-recurring operating income and expenses
(in € millions) 30/06/2016 30/06/2015
Non-recurring operating income 14.6 11.6
Net proceeds from the disposal of non-current operating assets 9.3 7.3
Net proceeds from the disposal of investments (0.3) 0.9
Nissan Indemnity in New Caledonia 3.0
Reversal of provisions for risk 3.4
Gain on SGI AFRICA shares revaluation 2.2
Other 0.3
Non-recurring operating expenses (1.3) (6.3)
Restructuration costs in Maghreb (1.2) (3.3)
Other (0.1) (3.0)
Non-recurring operating result 13.3 5.3
The Group’s other non-recurring operating income and expenses consist of unusual items thatcould distort the assessment of each division’s financial performance.The net balance of this caption is an income of €13.3 million for the first half of 2016 with a gain of€8.4 million mainly on disposal of building in Nigeria. This amount also includes the revaluation ofshares SGI AFRICA at the market value, following the loss of control to the joint-control withWendel and FFC. The gain is equal to €2.2 million.
Restructuration costs are related to termination of two-wheeler activity in Maroc.
In 2015, this item included a gain of €5.3 million mainly on disposal of assets in Morocco andTahiti by the Equipment & services division. The gain on disposal of investments comes from thecession of OHE subsidiary in Vietnam by the Equipment & services division.
Note 8 Financial income and expenses
This caption can be analyzed as follows:
(in € millions) 30/06/2016 30/06/2015
Cost of net debt (19.8) (22.0)
Income from cash and cash equivalents 0.1 0.4
Finance costs at amortized cost (19.9) (22.4)
Other financial income and expenses (2.0) (0.3)
Gains and losses on fair value foreign exchange hedges(1) (0.2) 0.2
Foreign exchange gains and losses (1.4) (0.5)
Dividends and interim dividends received 0.8 1.7
Impact of discounting assets and liabilities (0.0) (0.4)
Other finance costs (1.2) (1.3)
Total (21.8) (22.3)
(1) This item corresponds to the ineffective portion of fair value hedges.
Finance costs carried at amortized cost mainly consist of interest on bank overdrafts.The net impact on income of the ineffective portion of foreign exchange hedges amounted to a lossof € (0.2) million. This reflects (i) a loss of €6.2 million relating to changes in the fair value of

CFAO – 2016 Interim Financial Report
29
commitments, and (ii) a gain of €6 million relating to changes in the fair value of derivativeinstruments.
Other financial expenses include discount costs.
Note 9 Income taxThe Group income tax rate is calculated as follows:(in € millions) 30/06/2016 30/06/2015
Income before tax 91.5 102.9
Taxes paid out of operating income (42.8) (42.4)
Other taxes payable not impacting operating cash flow 1.2 0.2
Income tax payable (41.6) (42.2)
Deferred tax income/(expense) 1.4 0.2
Total tax expense (40.2) (42.0)
Effective tax rate 43.9% 40.8%
The income tax rate applicable in France is the standard rate of 33.33% subject to: (i) the socialsurtax of 1.1%, which is applied to the standard rate, bringing the total to 34.43%.
Note 10Earnings per shareBasic earnings per share are calculated on the basis of the weighted average number of sharesoutstanding, after deducting the weighted average number of shares held by consolidatedcompanies.Fully diluted earnings per share are based on the weighted average number of shares as definedabove for the calculation of basic earnings per share, plus the weighted average number ofpotentially dilutive ordinary shares.As all stock option and free share plans were delivered there is no more potential dilution.
Earnings per share as of June 30, 2016
(in € millions)Consolidated
Group
Net income attributable to ordinary shareholders 36.9
Weighted average number of ordinary shares outstanding 62,241,254
Weighted average number of treasury shares 39 862
Weighted average number of ordinary shares 62,281,117
Basic earnings per share (in €) 0.59
Net income attributable to ordinary shareholders 36.9
Stock subscription options
Performance shares
Diluted net income attributable to owners of the parent 36.9
Weighted average number of ordinary shares 62,281,117
Stock subscription options
Performance shares
Weighted average number of diluted ordinary shares 62,281,117
Fully diluted earnings per share (in €) 0.59

CFAO – 2016 Interim Financial Report
30
Earnings per share as of June 30, 2015
(in € millions)Consolidated
Group
Net income attributable to ordinary shareholders 43.1
Weighted average number of ordinary shares outstanding 61,897,379
Weighted average number of treasury shares (44,536)
Weighted average number of ordinary shares 61,852,844
Basic earnings per share (in €) 0.70
Net income attributable to ordinary shareholders 43.1
Stock subscription options
Performance shares
Diluted net income attributable to owners of the parent 43.1
Weighted average number of ordinary shares 61,852,844
Stock subscription options
Performance shares
Weighted average number of diluted ordinary shares 61,852,844
Fully diluted earnings per share (in €) 0.70
Note 11 Other comprehensive income
The components of other comprehensive income include:gains and losses arising from translating the financial statements of a foreign operation;components relating to the measurement of employee benefit obligations (unrecognized surplus ofpension plan assets and actuarial gains and losses on defined benefit plans).These items can be analyzed as follows, before and after the tax effect:
(in € millions) Gross Tax Net
Translation adjustments and other 1.4 1.4
Actuarial gains and losses (0.1) (0.1)
Other comprehensive income (expense) As of June 30. 2015 1.3 1.3
Translation adjustments and other 1.3 1.3
Actuarial gains and losses 1.2 (0.4) 0.8
Other comprehensive income (expense) As of December 31. 2015 2.4 (0.4) 2.0
Translation adjustments and other (15.3) (15.3)
Actuarial gains and losses
Other comprehensive income (expense) As of June 30. 2016 (15.3) (15.3)
Note 12 EquityShare capital amounted to €10,459,512 as of June 30, 2016, comprising 62,757,065 fully paid-up shares.
The Ordinary Shareholders’ Meeting called to approve the 2015 financial statements approved thepayment of a dividend in respect of 2015 corresponding to €0.81 per share and €50.8 millionin total.

CFAO – 2016 Interim Financial Report
31
The dividend paid in respect of 2015 amounted to €0.81 per share and €50.8 million in total.
Note 13 Cash and cash equivalents
This item breaks down as follows:(en € millions) 30/06/2016 30/06/2015
Cash 218.0 216.7
Cash equivalents 0.3 0.0
Total 218.3 216.7
The €218.3 million in cash and cash equivalents includes €86.5 million (versus €89.0 million atJune 30, 2015) in surplus cash from the management of central purchasing accounts by CFAOHolding.
Note 14 Gross borrowings(in € millions) 30/06/2016 N+1 N+2 N+3 N+4 N+5 Beyond
Non-current borrowings319.2 48.9 249.8 12.9 4.3 3.3
Bonds 8.7 2.9 2.9 2.9
Confirmed lines of credit 230.0 230.0
Other bank borrowings 51.1 22.6 13.0 8.7 3.5 3.3
Obligations under finance leases 6.1 1.8 3.0 0.9 0.4
Employee profit-sharing 1.3 0.5 0.3 0.3 0.2
Other borrowings 22.0 21.1 0.6 0.1 0.2
Current borrowings 485.0 485.0
Bonds 2.9 2.9
Confirmed lines of credit 10.8 10.8
Other bank borrowings 20.5 20.5
Employee profit-sharing 0.1 0.1
Bank overdrafts 444.4 444.4
Other borrowings 6.3 6.3
Total 804.2 485.0 48.9 249.8 12.9 4.3 3.3
% 60.3% 6.1% 31.1% 1.6% 0.5% 0.4%
As of June 30, 2016, all gross borrowings were recognized at amortized cost based on the effectiveinterest rate.
Other borrowings include a financial liability of €18.4 millions for the put options granted to theminority shareholders of the following companies :Fazzini : 15%New Caledonia companies’ Holding : 26%Mission Pharma Holding : 20%
The financial liability calculated for put options is a multiple of Recurring Operating Income orEBITDA (Recurring Operating Income plus depreciation, amortization, and provisions for non-recurring operating assets recognized in recurring operating income) minus the Net Debt.
Non-current borrowings mainly include the €230 million drawdown on the syndicated facility out ofa total confirmed credit line of €400 million. CFAO signed on 17 December 2013 a new 5-year EUR

CFAO – 2016 Interim Financial Report
32
400 million revolving credit facility including the refinancing of CFAO’s existing EUR 300 millionrevolving credit facility dated 7 December 2009.This facility was classified within non-currentconfirmed lines of credit in light of its less than four-year term.
As of June 30, 2016, the Group complied with the credit facility covenants.Accrued interest is recorded in ‘‘Other borrowings’’.Borrowings with a maturity of more than one year represented 39.7% of total gross borrowings asof June 30, 2016 (28.7% as of June 30, 2015).
Note 15 Net debt
Group net debt breaks down as follows:(in € millions) 30/06/2016 30/06/2015 31/12/2015
Gross borrowings (804.2) (779.6) (741.7)
Cash 218.3 216.7 201.7
Net debt (585.9) (562.9) (540.0)
Note 16 Accounting classification and market value of financialinstruments
The basis of measurement for financial instruments and their market values as of June 30, 2016are presented below:
30/06/2016
(in € millions)Carryingamount
Marketvalue
Available-for-saleassets
Loans andreceivables
Amortizedcost
Derivativesqualifying for
hedgeaccounting
Non-current assets
Non-current financial assets 84.7 84.7 15.4 59.8 9.5
Current assets
Trade receivables 524.2 524.2 524.2
Other current financial assets 12.4 12.4 3.7 8.7
Cash and cash equivalents 218.3 218.3 0.3 218.0
Non-current liabilities
Non-current borrowings 319.2 319.2 319.2
Current liabilities
Current borrowings 485.0 485.0 485.0
Other current financial liabilities 10.8 10.8 6.7 4.1
Trade payables 499.9 499.9 499.9

CFAO – 2016 Interim Financial Report
33
30/06/2015
(in € millions)Carryingamount
Marketvalue
Available-for-saleassets
Loans andreceivables
Amortizedcost
Derivativesqualifying for
hedgeaccounting
Non-current assets
Non-current financial assets 64.1 64.1 10.4 44.5 9.1
Current assets
Trade receivables 544.9 544.9 544.9
Other current financial assets 7.4 7.4 1.9 5.5
Cash and cash equivalents 216.7 216.7 0.0 216.7
Non-current liabilities
Non-current borrowings 223.4 223.4 223.4
Current liabilities
Current borrowings 556.2 556.2 556.2
Other current financial liabilities 22.1 22.1 12.4 9.7
Trade payables 520.1 520.1 520.1
Assets and liabilities recognized at fair value are measured as follows:Level 1: prices quoted in an active marketWhere available, prices quoted in an active market are used as the preferred method fordetermining market value. No instruments were included in level 1 of the fair value hierarchy as ofJune 30, 2016.Level 2: internal models using valuation techniques drawing on observable market inputsThese techniques are based on standard mathematical calculations incorporating observablemarket inputs such as futures prices, yield curves, etc. Most derivatives traded on markets aremeasured based on models commonly used by market practitioners in pricing these financialinstruments.Level 3: internal models based on non-observable inputsThe fair values used to determine the instruments’ carrying amounts represent reasonableestimates of their market values. This method chiefly concerns non-current financial assets.In 2016, no changes were made to the methods used to measure the fair values of financial assetsand liabilities.
30/06/2016 30/06/2015 31/12/2015
(in € millions)Carryingamount
Marketvalue Carrying amount
Marketvalue
Carryingamount Market value
Non-current assets
Non-current financial assets 84.7 84.7 64.1 64.1 69.8 69.8
Current assets
Trade receivables 524.2 524.2 544.9 544.9 538.6 538.6
Other current financial assets 12.4 12.4 7.4 7.4 4.8 4.8
Cash and cash equivalents 218.3 218.3 216.7 216.7 201.7 201.7
Non-current liabilities
Non-current borrowings 319.2 319.2 223.4 223.4 219.2 219.2
Current liabilities
Current borrowings 485.0 485.0 556.2 556.2 522.6 522.6
Other current financial liabilities 10.8 10.8 22.1 22.1 9.2 9.2
Trade payables 499.9 499.9 520.1 520.1 528.4 528.4

CFAO – 2016 Interim Financial Report
34
Note 17 Exposure to foreign exchange risk
The outstanding notional amounts of instruments used by the CFAO Group to manage its foreignexchange risk were as follows:
(in € millions) 30/06/2016 30/06/2015 31/12/2015
Currency forwards and currency swaps 129.8 119.9 62.2
Total 129.8 119.9 62.2
The Group primarily uses forward currency contracts to hedge commercial import/export risks andfinancial risks arising on inter-company refinancing transactions in foreign currencies.Some local subsidiaries – notably in Morocco, Kenya – have entered into and recorded forwardpurchase contracts in their accounts. As of June 30, 2016, outstanding notional amounts underthese agreements totaled €45.5 million.These derivative financial instruments were analyzed with respect to IAS 39 hedge accountingeligibility criteria. As of June 30, 2016, derivative instruments documented as hedges were asfollows :
(in € millions)30/06/2016
Japaneseyen
USdollar
Euro Other 30/06/2015 31/12/2015
Fair value hedges
Forward purchases and forward purchaseswaps
282.3 85.7 172.1 17.2 7.3280.2
243.2
Forward sales and forward sale swaps -152.5 -7.1 -144.0 0.0 -1.4 -160.3 -181.0
Total 129.8 78.6 28.1 17.2 5.9 119.9 62.2
The ‘‘Other’’ column mainly reflects transactions carried out in South African rands and poundssterling.Foreign exchange derivatives are recognized in the statement of financial position at their marketvalue as of the end of the reporting period.As of June 30, 2016, the exposure to foreign exchange risk on the statement of financial positionwas as follows:
(in € millions)30/06/2016 Euro
USdollar
Japaneseyen
Other 31/12/2015
CENTRAL PURCHASING OFFICES
Central purchasing receivables 77.5 73.1 4.4 0.0 79.9
Central purchasing payables 83.2 50.5 32.4 0.3 77.4
Gross exposure in the statement of financial position -central purchasing
-5.7 0.0 22.6 -28.0 -0.3 2.5
Customer orders 59.5 55.3 2.9 1.3 72.8
Supplier orders 130.1 81.6 42.1 6.4 131.7
Projected gross exposure – central purchasing -70.6 0.0 -26.3 -39.2 -5.1 -58.9
Gross exposure before hedging – central purchasing -76.3 0.0 -3.7 -67.2 -5.4 -56.4
Hedging instruments – central purchasing 87.5 3.5 78.4 5.6 60.6
Net exposure after hedging – central purchasing 11.2 0.0 -0.2 11.2 0.2 4.1

CFAO – 2016 Interim Financial Report
35
CFAO’s central purchasing offices hedge the foreign exchange risk arising on the statement offinancial position (trade receivables/payables) and on forecast transactions (confirmed supplier andcustomer orders) with respect to their reporting currency (euro).
(in € millions)
30/06/2016 EuroUS
dollarJapanese
yenOther 31/12/2015
INTERCOMPANY REFINANCING
Financial assets 3.6 0.0 3.6 0.0 0.0 4.0
Financial Liabilities -0.4 0.0 0.0 0.0 -0.4 -0.4
Gross exposure before hedging 3.2 0.0 3.6 0.0 -0.4 3.5
Hedging instruments -3.2 0.0 -3.6 0.0 0.4 -3.5
Net exposure after hedging 0.0 0.0 0.0 0.0 0.0 0.0
(in € millions)30/06/2016 Euro
USdollar
Japaneseyen
Other 31/12/2015
SUBSIDIARIES HEDGED (EXCLUDING CENTRALPURCHASING)
Subsidiaries that use hedging instruments
Receivables due to subsidiaries hedging foreign exchange risk 8.5 8.5 25.6
Payables owed by subsidiaries hedging foreign exchange risk 54.1 17.2 36.8 0.1 30.7
Gross exposure in the statement of financial position -45.6 -17.2 -28.3 -0.1 0.0 -5.2
Customer orders 0.0
Supplier orders 0.0
Projected gross exposure 0.0 0.0 0.0 0.0 0.0 0.0
Gross exposure before hedging -45.6 -17.2 -28.3 -0.1 0.0 -5.2
Hedges set up by subsidiaries 45.5 17.2 28.3 0.1 0.0 5.2
Net exposure after hedging of foreign exchange risk bysubsidiaries
-0.1 0.0 0.0 0.0 0.0 0.0
Certain subsidiaries may use financial instruments to hedge the foreign exchange risk betweentheir debt in US dollars or euros and their reporting currency (Moroccan dirhams, Kenyan shillings).
(in € millions)30/06/2016 Euro
USdollar
Japaneseyen
Other 31/12/2015
SUBSIDIARIES NOT HEDGED
Subsidiaries that do not use hedging instruments
Receivables due to subsidiaries 79.4 34.7 28.4 0.0 16.3 33.6
Payables owed by subsidiaries 108.3 43.6 57.9 0.7 6.1 125.8
Cash 15.1 6.3 5.9 0.0 2.9 14.2
Borrowings 59.7 29.9 29.2 0.0 0.6 51.0
Gross exposure in the statement of financial position -73.5 -32.5 -52.8 -0.7 12.5 -129.0
Hedging instruments 0.0
Net exposure after hedging -73.5 -32.5 -52.8 -0.7 12.5 -129.0
Subsidiaries excluding central purchasing offices that do not use foreign exchange hedginginstruments owing to regulatory constraints are exposed to the risk of changes in the value of theirreporting currency against operating and financial receivables and payables denominated in eurosor US dollars.The above table does not include the exposure of euro-denominated assets and liabilities ofsubsidiaries in the CFA franc zone, since the exchange rate of this currency is fixed against the

CFAO – 2016 Interim Financial Report
36
euro. These items amounted to €146.5 million as of June 30, 2016.
The following table summarizes the Group’s net consolidated position:
(in € millions)30/06/2016 Euro
USdollar
Japaneseyen
Other 31/12/2015
CFAO Group
Receivables 165.8 35.1 110.0 4.4 16.3 140.7
Payables 386.6 201.8 145.2 33.2 6.4 395.3
Cash 18.8 6.4 9.5 0.0 2.9 18.3
Borrowings 65.2 35.8 29.2 0.0 0.2 51.7
Gross exposure in the statement of financial position -267.2 -196.1 -54.9 -28.8 12.6 -288.0
Customer orders 59.5 0.0 55.3 2.9 1.3 72.8
Supplier orders 130.1 0.0 81.6 42.1 6.4 131.7
Projected gross exposure -70.6 0.0 -26.3 -39.2 -5.1 -58.9
Gross exposure before hedging -337.8 -196.1 -81.2 -68.0 7.5 -346.9
Hedging instruments 129.8 17.2 28.1 78.5 6.0 62.2
Net exposure after hedging -208.0 -178.9 -53.1 10.5 13.5 -284.7
Analysis of sensitivity to foreign exchange risk
Based on market data at the end of the period, the negative impact of a sudden 10% increase inthe exchange rate of unhedged purchasing currencies against local currencies (excluding the CFAfranc) would have been €7,4 million at end-June 2016.This analysis excludes the impacts of translating the financial statements of each Group entity intothe Group’s presentation currency (euro).The sensitivity analysis assumes that all other market variables remain unchanged.
Note 18 Derivative instruments at market valueThe Group uses derivative financial instruments to manage its exposure to foreign exchange risk. Ithas no cash flow or net investment hedges.As of June 30, 2016, June 30, 2015, and December 31, 2015, and in accordance with IAS 39, themarket values of derivative financial instruments were recognized in assets under ‘‘Other currentfinancial assets’’ and in liabilities under ‘‘Other current financial liabilities’’.The fair values of foreign exchange derivatives were recognized in other current financial assets orliabilities.
(in € millions)
30/06/2016Interest rate
risk
Foreignexchange
risk
Othermarket
risks30/06/2015 31/12/2015
Derivative assets 8.7 8.7 5.5 3.9
Non-current
Current 8.7 8.7 5.5 3.9
Fair value hedges 8.7 8.7 5.5 3.9
Derivative liabilities 4.1 4.1 9.7 5.3
Non-current
Current 4.1 4.1 9.7 5.3
Fair value hedges 4.1 4.1 9.7 5.3
Total 4.6 4.6 (4.2) (1.5)

CFAO – 2016 Interim Financial Report
37
Note 19 Notes to the statement of cash flowsAs of June 30, 2016, cash and cash equivalents net of bank overdrafts and cash accounts with acredit balance (including accrued interest) stood at a negative €226.2 million, representing totalcash and cash equivalents as shown in the statement of cash flows.
(in € millions) 30/06/2016 30/06/2015 31/12/2015
Cash and cash equivalents as reported in the statement offinancial position
218.3 216.7 201.7
Bank overdrafts (444.5) (499.9) (478.5)
Cash current accounts with a credit balance (0.0) (2.8) (0.7)
Cash and cash equivalents as reported in the statement ofcash flows
(226.2) (286.1) (277.5)
19.1 Purchases of property, plant and equipment and intangible assets
Purchases of property, plant and equipment and intangible assets totaled €59 million in first-half2016 (€70.7 million in first-half 2015).
19.2. Acquisitions and disposals of subsidiaries
(In € millions) 30/06/2016 30/06/2015 31/12/2015
Acquisitions of subsidiaries. net of cash acquired (1.1) (7.6) (16.3)
Proceeds from disposals of subsidiaries. net of cashtransferred
3.3 1.3 7.7
Total 2.2 (6.4) (8.6)
In the first half of 2016, there is no significant acquisition. Proceeds from disposal concernedessentially SCI Bain Lothi in Tahiti.In the first half of 2015, acquisitions of subsidiaries concerned SICOBEL in Côte d’Ivoire inConsumer Goods division and Compagnie Mauritanienne de Distribution Automobile, a Toyotadistributor in Mauritania in Equipment & Services division.
Factoring contracts were put in place at Eurapharma :€14.5 million in Import Resale activity in French Overseas Territories on a half-yearly basis ;€10.1million in pre-whole sale activity in France on a quarterly basis.These contracts transfer all risks and advantages on receivables to the bank and are notaccounted for anymore on the balance sheet.
Note 20 Contingent liabilities, contractual commitments not recognizedand other contingencies
20.1. Commitments given following asset disposals
During the first half of 2016, the Group did not enter into any vendor warranty agreements.20.2. Other developmentsTo the best of the Group’s knowledge, there were no other material developments regarding othercommitments given or received by CFAO or contingent liabilities in first-half 2016.
Brasseries du Congo has filed claims with the Congolese administration concerning a specialcorporate tax amounting to €8.5 millions in respect of 2012, 2013, 2014, 2015, and 2016. This tax

CFAO – 2016 Interim Financial Report
38
would be completed with a 100% penalty, the whole tax contestation amounting to €21.6 million.This claim is not provisioned. The company believes that it is exempt from this tax due to itsestablishment agreement. These claims have been referred to a higher administrative authoritythrough pre-litigation proceedings.
Note 21 Related partiesToyota Tsusho Corporation owns 97.50% of the CFAO Group's and 97.57 % of its voting rights,further to its tender offer on CFAO shares in 2012.
In 2015, a dividend of €49.6 million was paid to TTC in respect of 2014 results. In 2016, a dividendof €50.8 million was paid to TTC in respect of 2015 results.
In the first half of 2016, CFAO purchased vehicles and spare parts from Toyota and itssubsidiaries, for an amount of €4.8million. Other current liabilities shows a debit balance of €1.0million.In the first half of 2015, CFAO purchased vehicles and spare parts from Toyota and itssubsidiaries, for an amount of €9.5 million. Other current liabilities shows a credit balance of €1.0million.
Note 22 Subsequent eventsNo subsequent events had a material impact on the condensed interim consolidated financialstatements for the six months ended June 30, 2016.

CFAO – 2016 Interim Financial Report
REGISTRATION DOCUMENT 2016 - CFAO 39
4. STATUTORY AUDITOR’S REVIEW REPORT ON THEINTERIM FINANCIAL INFORMATION
Deloitte & Associés185 avenue Charles de Gaulle92524 Neuilly-sur-Seine Cedex
PricewaterhouseCoopers Audit63, rue de Villiers
92208 Neuilly-sur-Seine Cedex
This is a free translation into English of the Statutory Auditors’ review report issued in French and is providedsolely for the convenience of English-speaking readers. This report should be read in conjunction with, andconstrued in accordance with, French law and professional auditing standards applicable in France.
To the Shareholders,
In compliance with the assignment entrusted to us by your Shareholders’ general meeting and in accordancewith the requirements of article L. 451-1-2-III of the French Monetary and Financial Code ("Code monétaireet financier"), we hereby report to you on:
the review of the accompanying condensed half-year consolidated financial statements of CFAO, forthe period from January 1 to June 30,2016;
the verification of the information presented in the half-year management report.
These condensed half-year consolidated financial statements are the responsibility of the Board of directors.Our role is to express a conclusion on these financial statements based on our review.
CFAO
Société Anonyme
18, rue Troyon92316 Sèvres
Statutory Auditors’ Review Report on the Half-yearFinancial Information
For the period from January 1 to June 30, 2016

CFAO – 2016 Interim Financial Report
REGISTRATION DOCUMENT 2016 - CFAO 40
I. Conclusion on the financial statements
We conducted our review in accordance with professional standards applicable in France. A review ofinterim financial information consists of making inquiries, primarily of persons responsible for financial andaccounting matters, and applying analytical and other review procedures. A review is substantially less inscope than an audit conducted in accordance with professional standards applicable in France andconsequently does not enable us to obtain assurance that we would become aware of all significant mattersthat might be identified in an audit. Accordingly, we do not express an audit opinion.
Based on our review, nothing has come to our attention that causes us to believe that the accompanyingcondensed half-year consolidated financial statements are not prepared, in all material respects, inaccordance with IAS 34 - standard of the IFRSs as adopted by the European Union applicable to interimfinancial information.
II. Specific verification
We have also verified the information presented in the half-year management report on the condensedhalf-year consolidated financial statements subject to our review.
We have no matters to report as to its fair presentation and consistency with the condensed half-yearconsolidated financial statements.
Neuilly-sur-Seine, July 28, 2016The Statutory Auditors
French original signed by
Deloitte & AssociésThierry QUERON
Partner
PricewaterhouseCoopers AuditOlivier AUBERTY
Partner

CFAO – 2016 Interim Financial Report
REGISTRATION DOCUMENT 2016 - CFAO 41