interim evaluation of the commission staff...
TRANSCRIPT
EN EN
EUROPEAN COMMISSION
Brussels, 6.10.2017
SWD(2017) 338 final
COMMISSION STAFF WORKING DOCUMENT
INTERIM EVALUATION
of the
Joint Undertakings operating under Horizon 2020
{SWD(2017) 339 final}

2
Table of Contents
EXECUTIVE SUMMARY .................................................................................................... 3
1. INTRODUCTION .............................................................................................................. 5
2. BACKGROUND ................................................................................................................ 7
2.1. Context ......................................................................................................................... 7
2.2. Objectives and intervention logic ................................................................................ 9
3. EVALUATION QUESTIONS ......................................................................................... 12
4. METHODOLOGY ........................................................................................................... 13
5. IMPLEMENTATION STATE OF PLAY ....................................................................... 14
5.1. Participations in proposals and in projects per type of organisation ......................... 15
5.2. Success rates .............................................................................................................. 15
6. ANSWERS TO THE EVALUATION QUESTIONS ..................................................... 20
6.1. Relevance ................................................................................................................... 20
6.2. Effectiveness .............................................................................................................. 22
6.2.1. Engagement of stakeholders ............................................................................... 22
6.2.2. Governance ......................................................................................................... 24
6.2.3. Impact: Key Performance Indicators .................................................................. 25
6.2.4. SME participation .............................................................................................. 30
6.2.5. Member States participation and Widening ....................................................... 31
6.3. Efficiency ................................................................................................................... 32
6.3.1. Analysis of the Joint Undertakings' performance .............................................. 33
6.3.2. Beneficiary satisfaction with the JU services ..................................................... 35
6.3.3. Simplification ..................................................................................................... 36
6.4. Coherence .................................................................................................................. 37
6.5. EU added value .......................................................................................................... 41
6.5.1. Leverage effect ................................................................................................... 43
6.6. Openness .................................................................................................................... 43
6.7. Transparency ............................................................................................................. 48
7. CONCLUSIONS .............................................................................................................. 50
Annex A. Procedural information ............................................................................................ 60
Annex B. Stakeholder consultation results .............................................................................. 62
Annex C. Evidence and Methodology ..................................................................................... 80
Annex D. Outcome of the Final evaluations of the JUs established under FP7 ...................... 83
Annex E. Interim Evaluation Reports for the JUs under Horizon 2020 .................................. 91
Annex F. Final Evaluation Reports for the JUs under FP7 ...................................................... 92

3
EXECUTIVE SUMMARY
Joint Undertakings (JUs), launched under article 187 of the Treaty on the Functioning of the
European Union, are a special legal instrument of implementing Horizon 2020 through a
public-private partnership (PPP) in key strategic areas. Their aim is to implement research and
innovation activities to enhance competitiveness and to tackle the grand societal challenges
with the active engagement of Europe's industry.
The seven JUs currently in operation implement specific parts of Horizon 2020 in the areas of
transport (CleanSky2, Shift2Rail and SESAR), transport/energy (FCH2), health (IMI2), bio-
economy (BBI) and electronic components and systems (ECSEL). For the duration of the
framework programme, they will manage around 10% of the global Horizon 2020 budget and,
through the leverage effect, will mobilise additional resources from the private side of each
JU.
The legal framework of each of the JUs foresees an interim evaluation to be carried out with
the assistance of independent experts. The Commission is required to prepare a report - a Staff
Working Document (SWD) - which addresses the conclusions of the evaluations and the
related observations by the Commission services. The report should also take into account the
findings and conclusions reached by the independent experts in the final evaluations of the six
JUs that operated under FP7, namely, SESAR, ARTEMIS, CLEAN SKY, ENIAC, FCH and
IMI.
During the period from October 2016 to June 2017, a total of 39 independent experts working
in seven groups evaluated the progress realised until the end of 2016 by the seven JUs
operating under Horizon 2020; this work also covered the six JUs that operated under FP7.
This SWD presents the Commission services' view on the performance of the seven JUs under
Horizon 2020, based on the findings of the seven expert groups, the outcomes of the public
consultation of stakeholders and the survey of project coordinators.
The overarching conclusion is that the JU-based PPPs under Horizon 2020, while it is still
early for most of them to demonstrate tangible project outputs, have demonstrated efficiency
improvements in comparison to FP7. They have also effectively managed to engage the major
actors in research and innovation in the respective industrial sectors and have shown their
potential as important drivers for strengthening Europe's competitiveness and helping to
respond to major socio-economic challenges. The private funding leveraged by the JUs is
shown to be well on track against the targets defined in the respective legal frameworks.
The industrial sectors addressed by the JUs are not only of high economic relevance for
Europe, but also areas where well-identified market risks require a long-term concerted
research and innovation effort. Taking into account the needs of the specific sector, JUs are
fostering synergies by linking activities across the innovation cycle, from research outcomes
to closer-to-market activities and facilitating the creation of an internal market for innovative
technologies, products and services.
The Commission services' view, shared by the vast majority of the stakeholders who
participated in the open public consultation, is that the JUs are on track to deliver against the
set objectives, despite a number of identified shortcomings that need to be addressed by the
JUs and the Commission services in order to improve their functioning, ensure delivery of
solid output and objectively assess impact.

4
Strengths
The evaluations, supported by the views of the stakeholders involved in the consultation,
confirmed the continued relevance of the seven JUs in contributing directly to
competitiveness and EU policy goals. The key strength of the JUs is their ability to engage
major, strategic industry partners in priority areas of the Union, across borders and
business sectors and lead a step change in comparison to standard research. This effect has
been observed in all JUs. The JUs have also managed to overcome the fragmentation in
their respective sectors, bringing together competing or even previously unrelated
stakeholders and creating long-lasting collaborative networks. While the definite amount of
leveraged funding will only be known at the end of the JU operations, current Commission
estimations point to private sector funding that already equals or exceeds the set targets in four
out of the seven JUs, whereas for the remaining three it is closing in to the target.
Regarding openness, it is generally agreed that, in comparison to the first generation, the
second generation JUs have developed more open and straightforward policies regarding
membership of the private entities, which are described clearly, along with the eligibility
criteria, in the respective Council regulations. JUs implement the programme with small
teams, focusing on research priorities that are, to a large extent, coherent with the
corresponding Horizon 2020 activities. They are lean, efficient structures, most of them
benefiting from a simplified and more uniform application of rules and processes in Horizon
2020. Performance indicators such as time-to-grant, time-to-inform and time-to-pay, are all
observed to be within the set targets. As a result, the JUs achieved a very high stakeholder
satisfaction for their services (more than 90%).
Challenges
Despite the general acceptance that the JUs operating under Horizon 2020 are on track to
achieve their objectives, the seven groups of experts identified a number of issues that need to
be addressed in order to reap the maximum of their potential and impact. As each JU has its
own specific features, only a handful of these challenges are common to all.
Even though it is generally acknowledged that most of the key players in the respective
industrial sectors are already engaged actively, many expert groups call for the inclusion of a
wider range of stakeholders either in the governance structures or in submitted proposals.
The limited interaction between the Governing Boards and their advisory bodies is another
issue where possible improvements should be explored. Additional efforts are also needed to
further align JU activities with policies at EU, national and regional level.
The choices of the Key Performance Indicators (KPIs) used to measure JU-specific impact
are criticised by several expert groups. They propose to re-visit and re-define the whole set
of KPIs by including indicators related to global competitiveness of the relevant industrial
sectors and, also, to couple the indicators with baseline metrics showing progress over time.
Experts report uneven SME participation rates that, on average are lower than those
observed in Pillars II (the LEIT part) and III (Societal Challenges) of Horizon 2020, a finding
which might be linked to cost considerations and long term commitments. Similarly, the
participation rates of the EU-13 Members States, while they have improved over those in
FP7, are still overall lower than the already low rates of Pillars II and III. Finally, there is a
need to improve and enforce communication activities and, in particular, to ensure effective
dissemination of project results.
5
1. INTRODUCTION
The framework programme Horizon 2020 may be implemented through public-private
partnerships (PPPs) when the research and innovation activities are of strategic importance to
the Union's competitiveness and industrial leadership or to addressing specific societal
challenges. Where there is a sufficient scale and scope and other forms of partnership would
not fulfil the objectives or generate the necessary leverage, the option chosen is a Joint
Undertaking (JU), established under Article 187 of the Treaty on the Functioning of the
European Union.
Seven JU-based PPP initiatives were launched under Horizon 2020, building on the
experience gathered with the six JUs operating under the seventh framework programme
(FP7). Since PPPs are one of the key instruments of the current framework programme, the
interim evaluation of these JUs supports and feeds into the Horizon 2020 interim evaluation1,
which three years after its launch assesses the overall progress towards achieving its
objectives.
The individual Council Regulations2 require the Commission to carry out, with the assistance
of independent experts, an interim evaluation for each of the JUs, the results of which should
be communicated by the Commission to the European Parliament and the Council not later
than 31 December 2017. The set of the seven JU evaluations, covering their implementation
until end of 2016, provides a critical look on whether they are fit for purpose and whether this
PPP instrument can deliver in an optimal way the desired outcomes. They also shape a solid
evidence base for designing future initiatives in strategic industrial sectors.
Each JU evaluation focuses on the evaluation criteria prescribed in the better regulation
framework, notably efficiency, relevance, coherence, effectiveness and EU added value, with
an additional concern on openness and transparency, as required in the Horizon 2020
regulation.
This Commission Staff Working Document (SWD) presents the views of the relevant
Commission services based on a wide range of sources comprising the expert group
evaluation reports, results from the common open public consultation and the seven surveys
of JU project coordinators.
It concentrates on the more generic issues identified, and provides the related views from the
Commission services and some conclusions in relation to the JU-based PPP instrument. The
more specific results of each individual evaluation can be found in Annexes E and F, together
with the final evaluation of the JUs established under FP7, which was performed in parallel
by the corresponding expert group.
The results of this SWD will provide input to the forthcoming Commission Communication
on the results of the Horizon 2020 interim evaluation.
1 Commission Staff Working Document SWD(2017) 221
2 Council Regulations 560/2014 (OJ L 169, 7.6.2014, p. 130–151), 557/2014 (OJ L 169, 7.6.2014, p.54),
558/2014 (OJ L 169, 7.6.2014, p.77), 561/2014 (OJ L 169, 7.6.2014, p. 152), 559/2014 (OJ L 169, 7.6.2014,
p.108), 642/2014 (OJ L 177, 17.6.2014, p. 9), and 219/2007 (OJ L 64, 2.3.2007, p.1) amended by Council
Regulations 1361/2008 and 721/2014

6
Figure 1: Overview of the seven JU-based PPP initiatives under Horizon 2020.
The Clean Sky 2 JU develops
new environmentally-friendly
technologies for the commercial
aviation under Horizon 2020.
Clean Sky was created in 2008
as a PPP between the EU and the
aeronautics industry, and it
developed under FP7 break-
through technologies for the
civil aircraft market.
The current initiative aims to
increase fuel efficiency and to
reduce emissions and noise
compared to the reference
aircraft that uses current state-of-
the-art technologies.
Clean Sky 2 involves 16
industry leaders. In addition,
already 136 Core Partners and
more than 400 partners were
selected through open calls for
proposals.
The IMI 2 JU is a PPP between the
EU and the EFPIA Association. Its
main objectives are to remove
bottlenecks and improve the
efficiency, effectiveness and quality of
the drug development process, helping
produce safe, effective and innovative
medicines more rapidly.
It builds on the success of a JTI
established during the first years of
FP7. The scope has been expanded to
cover all areas of life sciences
research and innovation which are of
interest for health, as identified by the
World Health Organisation.
The initiative brings together a broad
range of partners from different
sectors (biomedical imaging, medical
information technology, diagnostic,
etc.) and of different types (academic
organisations, SMEs, industries,
regulatory agencies, patient
organisations, etc.)
The Shift2Rail Joint Undertaking
is a public-private partnership in
the rail sector, pursuing research
and innovation activities in support
of the achievement of the Single
European Railway Area and
improving the attractiveness and
competitiveness of the European
rail system.
The initiative was launched in
2014, with ambitious objectives of
cutting the life-cycle cost of
railway transport, increasing
capacity, reliability and
punctuality.
Railway undertakings,
infrastructure managers and public
transport operators will also benefit
from innovations that drastically
reduce infrastructure and operating
costs. This should also help to
reduce the subsidies paid out by
national authorities.
The SESAR JU,
established in 2007 to
concentrate and
coordinate all air traffic
management (ATM)
R&D efforts in the EU
under the development
phase of the SESAR
project is the
technological pillar of
the Single European
Sky (SES) initiative
launched in 2004.
The SES is expected to
enable a 3-fold increase
in capacity, improve
safety performance by a
factor of 10 and reduce
the cost of ATM
services by a half.
The Fuel Cells and
Hydrogen JU has among its
objectives the development of
a strong, sustainable and
globally competitive fuel cells
and hydrogen sector in the
EU. Although this sector is
small, it is of strategic value
due to its potential knock-on
effect on other areas.
The FCH JU is building on the
previous implementation
under FP7. In Horizon 2020, it
is aiming to develop a
portfolio of clean, efficient
and affordable fuel cells and
hydrogen technologies to the
point of market introduction
and to help secure the future
international competitiveness
of this strategically important
sector in Europe.
Environmental and
socio-economic benefits
in the area of the bio-
based economy are the
key objectives of the
BBI JU, set up under
Horizon 2020.
A strong European bio-
based industrial sector
will significantly reduce
Europe’s dependency
on petroleum products,
help the EU address the
challenge of the climate
change, and lead to
greener and more
environment friendly
growth, also increasing
employment in
particular in rural areas.
The ECSEL JU is a
merger of the ENIAC
nanoelectronics and the
ARTEMIS embedded
systems JTIs set up in
2008. ECSEL focuses
on embedded/cyber
physical systems,
nanoelectronics and
smart systems.
The main aims of the
PPP are to grow
semiconductor and
smart system
manufacturing
capability, while
developing a strong and
globally competitive
electronics components
and systems industry in
Europe and to underpin
next generation digital
technologies.
7
2. BACKGROUND
2.1. Context
Around the turn of the century, European industry was increasingly hindered by an inadequate
technological base, arising particularly from lack of specialisation in high technology sectors3.
This unfavourable environment was further weakened by inadequate funding and lack of scale
to focus on key strategic projects that have high downstream industrial potential.
Before the EU considered potential partnerships with industry to support European research,
some Member States had already begun funding parts of their research activities through
public-private partnerships, an approach which saw a significant increase between 1998 and
2002, focusing on selected strategic areas.
The importance of innovation to growth and jobs was explicitly acknowledged in the
December 2006 Council Conclusions on a broad-based innovation strategy4, which recognised
the support for innovation as an essential part of the Lisbon Strategy. The Council
Conclusions set out the strategic priorities for innovation action at an EU level and included
the launch of Joint Technology Initiatives (JTIs) among its key actions.
The JTIs were public-private partnerships in industrial research at European level which were
implemented through Joint Undertakings (JUs), launched under Article 187 of the Treaty on
the Functioning of the EU (TFEU). They were set up in 2007-2008 under the Seventh
Framework Programme (FP7) in five strategic areas - aeronautics and air transport (Clean
Sky), health (IMI), fuel cell and hydrogen technologies (FCH), embedded computing systems
(ARTEMIS), and nanoelectronics (ENIAC). The SESAR JU (not launched as JTI) was also
setup to coordinate all air traffic management (ATM) research at EU level, as the
technological component of the broader Single European Sky initiative aiming to modernise
and harmonise ATM systems in the EU.
Article 25 of the current framework programme Horizon 2020 regulation addresses the
implementation of parts of the programme through public-private partnerships for research
and innovation activities of strategic importance. Two possible forms are considered:
financial contributions from the Union to Joint Undertakings established pursuant to Article
187 TFEU or the signing of contractual arrangements with the relevant industries specifying
objectives, commitments, Key Performance Indicators (KPIs) and outputs to be delivered
(contractual PPPs)5.
It is also mentioned that these PPPs shall be identified and implemented in an open,
transparent and efficient way, and that their identification shall be based on: added-value at
Union level, scale of impact, long-term commitment, scale of resources involved, clear
definition of roles and KPIs, and complementarity with other parts of Horizon 2020.
Based on the experience gained during FP7, the European Commission prepared a series of
proposals for Council regulations on public-private partnerships under Horizon 2020. In May
3 As shown by the 2002 value of the share of high-tech industries in manufacturing value-added (based on data
from the Groningen Growth and Development Centre), see Commission SWD SEC(2005) 800 4 2769
th Competitiveness (Internal Market, Industry and Research) Council meeting, 4 December 2006
5 http://ec.europa.eu/research/industrial_technologies/ppp-in-research_en.html

8
2014, the Innovation Investment Package was officially adopted setting up a new generation
of JU-based partnerships.
Figure 2: Lifetime of the JUs
Source: EC based on the Council Regulations establishing the JUs
The package includes seven JUs that organise their own research and innovation agenda and
award funding to projects on the basis of competitive calls. Among these, three JUs are active
in the transport sector, one in the energy / transport sector, one in the field of health, one in
the bio-economy and one in electronic components and systems. Two new initiatives have
joined those launched during FP7 – the Bio-Based Industries (BBI) and the Shift2Rail (S2R) JUs. The pre-existing ARTEMIS and ENIAC initiatives were merged into the new ECSEL
JU, with updated joint objectives.
9
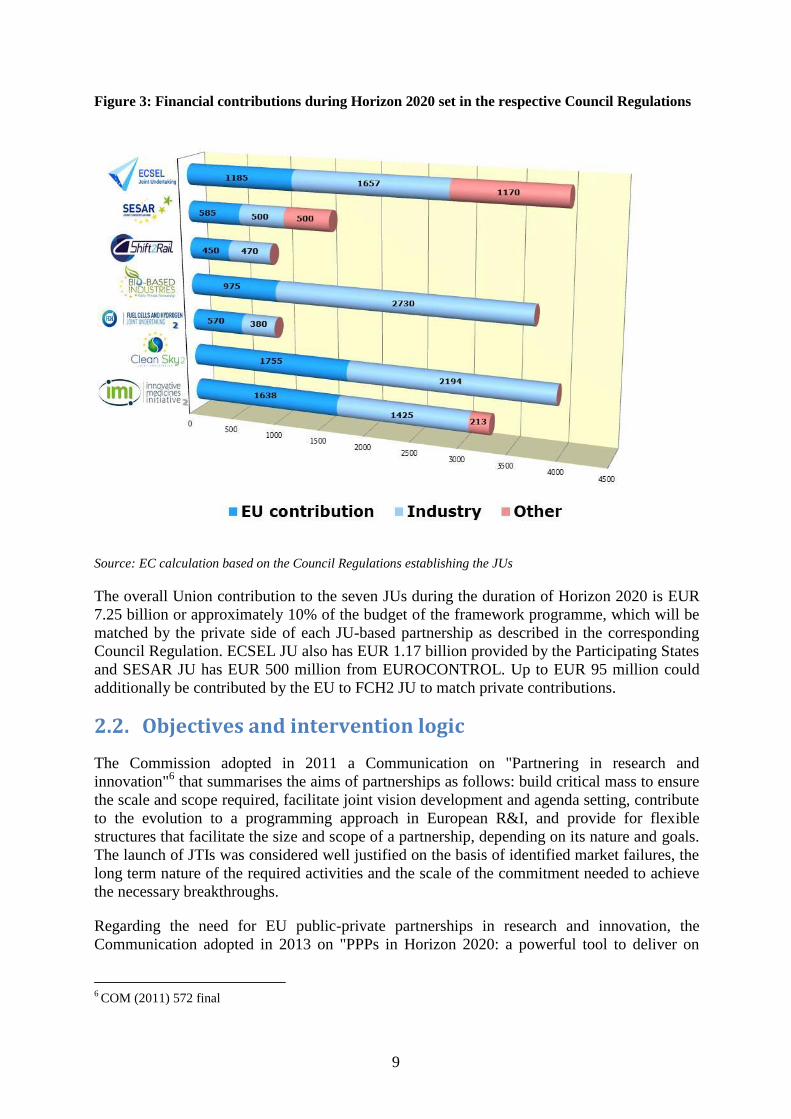
Figure 3: Financial contributions during Horizon 2020 set in the respective Council Regulations
Source: EC calculation based on the Council Regulations establishing the JUs
The overall Union contribution to the seven JUs during the duration of Horizon 2020 is EUR
7.25 billion or approximately 10% of the budget of the framework programme, which will be
matched by the private side of each JU-based partnership as described in the corresponding
Council Regulation. ECSEL JU also has EUR 1.17 billion provided by the Participating States
and SESAR JU has EUR 500 million from EUROCONTROL. Up to EUR 95 million could
additionally be contributed by the EU to FCH2 JU to match private contributions.
2.2. Objectives and intervention logic
The Commission adopted in 2011 a Communication on "Partnering in research and
innovation"6 that summarises the aims of partnerships as follows: build critical mass to ensure
the scale and scope required, facilitate joint vision development and agenda setting, contribute
to the evolution to a programming approach in European R&I, and provide for flexible
structures that facilitate the size and scope of a partnership, depending on its nature and goals.
The launch of JTIs was considered well justified on the basis of identified market failures, the
long term nature of the required activities and the scale of the commitment needed to achieve
the necessary breakthroughs.
Regarding the need for EU public-private partnerships in research and innovation, the
Communication adopted in 2013 on "PPPs in Horizon 2020: a powerful tool to deliver on
6 COM (2011) 572 final

10
innovation and growth in Europe"7 explains that "research and innovation are high risk
activities and there is no guarantee of success. If the risk of failure is too large, the private
sector may be unwilling to invest, even if the economic and societal returns could potentially
be very large. In addition, the economic benefits of research investments may be captured by
others, meaning that individual firms will be unwilling to invest, or there may be compelling
policy reasons which limit the size of the market and therefore the potential return (e.g. when
developing new antibiotics where microbial resistance is a growing concern)".
According to this Communication, "these general market failures provide a strong rationale
for public support to private research and innovation activities. However, in a number of
cases, the importance of the sectors, the complexity of the challenges and technologies, the
long time periods involved and the scale of investment needed are such that public support to
individual projects is not effective. It is for these cases that structured partnerships are needed
between the public and the private sector to jointly develop, fund and implement ambitious
research and innovation agendas. For sectors that operate at European and international levels,
and where the scale of the investments is beyond the means of the individual Member States,
the most effective approach was considered to be to establish such PPPs at EU level".
The newly created JUs have been designed to help the Commission reach the overarching
Union priorities, not only in the research and innovation domain, but also regarding major EU
policy objectives under the Europe 2020 strategy.
The diagram below shows the main features of each JU and their objectives. Due to the large
number of individual intervention logics followed by the expert groups, this summary has
been prepared to give a more accessible overview across all the JUs. Footnote
7 COM (2013) 494 final

11
The diagram below shows the main features of each JU and their aims. Due to the large
Figure 4: Intervention logic for the JUs under Horizon 2020

12
3. EVALUATION QUESTIONS
In line with the Better Regulation guidelines, each JU interim evaluation was required to
address the criteria of relevance, efficiency, effectiveness, coherence and EU added value. On
the basis of article 32(3) of the Horizon 2020 regulation8, it was also necessary to perform an
in-depth assessment of the JUs on the additional criteria of openness and transparency, as part
of the interim evaluation of Horizon 2020. Therefore, the overall evaluation framework
integrated the above mentioned seven criteria as summarised in the table below.
Relevance
Description of the objectives of Joint Undertakings and the problem they
intended to address and assessment whether the original objectives still
correspond to the needs within the EU
Effectiveness
The progress towards achieving the objectives set, including how all parties in
the public-private partnerships live up to their financial and managerial
responsibilities.
Main achievements (KPIs)
Effectiveness of implementation
To what extent is the JU achieving its objectives?
Assessment of the programme administration lifecycle and
setting up a research agenda
Are all stakeholders relevant to the specific area of JU involved?
Have the actions attracted and allowed a satisfactory level of participation of the
best European players active in their specific areas?
Efficiency
The relationship between the resources used by an intervention and the changes
generated by the intervention.
Timely execution of the functions: time-to-grant, time-to-pay and
average evaluation cost per proposal.
Cost-efficiency of the management and control arrangements.
Budget execution of commitment and payment appropriations
Simplification and reduction of the administrative burden for the participants.
Coherence
To what extent is the JU coherent with other interventions (such as specific
programme within Horizon 2020) that have similar objectives?
What is the relation with other Union funding programmes (complementarity,
synergies, potential overlaps)?
EU added
value
Changes that can be reasonably attributed to JUs, rather than other factors.
Leverage effect.
Scale of resources involved.
Ability to leverage additional investments in research and innovation.
Openness
The extent to which the JUs enable world-class research that helps Europe reach
a leadership position globally, and how they engage with a wider constituency to
open the research to the broader society.
Transparency
The extent to which the JUs keep an open non-discriminatory attitude towards a
wide community of stakeholders and provide them with easy and effective
access to information.
8 Council Regulation 1291/2013 establishing Horizon 2020

13
4. METHODOLOGY
Seven independent expert groups were set up to carry out the interim evaluation of each of the
Joint Undertakings (JUs) and produce evaluation reports. The experts were selected from a
list that is continuously updated through an open call for applications. The independent
experts were selected based on their level of professional experience and appropriate range of
skills in the relevant fields covered by this evaluation. For the JUs in the transport domain,
some of the experts were also tasked with ensuring a consistent approach between the three
expert groups.
The expert groups used a wide range of methods and tools suitable for carrying out the
requested tasks, since each task required a specific methodological approach. The expert
groups collected relevant quantitative and qualitative information and evidence from different
sources, as is shown in the table below.
Table 1: Overview of methodology for each JU evaluation
Source of evidence BBI CS2 ECSEL9 FCH2 IMI2 SESAR S2R
Documentary review and desk
research X X X X X X X
Quantitative, statistical analysis
CORDA data X X X X X X X
Semi-structured or in-depth
interviews with stakeholders X X X X X X X
Interviews X X X X X X X
Number of conducted interviews 19 20+ 47 35 24 30 28
Focus groups
X
A common open public consultation X X X X X X X
JU Project Coordinators survey X X X X X X X
Survey (other than the standard
project coordinators survey) X X
X X
Other (e.g. project visits) X X
Participation in the events organised
by the JUs X X X X
Source: EC summary based on the individual JU interim evaluation reports
This Staff Working Document is based on a wide range of sources comprising the expert
group evaluation reports, results from the common open public consultation and the seven
surveys of JU project coordinators, as well as the views of the relevant Commission services.
At such an early stage, it is difficult to make an adequate quantitative assessment of the
outcomes and impacts of these initiatives under Horizon 2020, due to the long time it takes for
the research results to reach the market. This issue, together with the other limitations (timing,
difficulty of benchmarking, early calculation of the leverage) encountered by the seven groups
involved in this evaluation exercise are further discussed in Annex C.
9 For ECSEL, ENIAC and ARTEMIS, a fact-finding study was produced to support the evaluation process. This
study includes interviews and dedicated surveys.

14
5. IMPLEMENTATION STATE OF PLAY
The timing of adoption of the Council Regulations, with the first initiatives just starting in
May 2014, had a significant impact on the Horizon 2020 calls calendar in 2014. Only a few
calls were launched in 2014, and 2015 was basically the first year of actual implementation of
calls for the JUs operating under Horizon 2020. The figure below presents the outcome of the
calls launched and concluded by January 2017 by all seven JUs.
Figure 5: Number of calls launched and concluded by the JUs (left) and overall requested EU
contribution in EUR million for the eligible proposals (right)
In total, by the data extraction time of 17 January 2017 from Common Research Data
Warehouse (CORDA) 34 calls had been launched and concluded. The calls attracted 1 751
eligible proposals with 13 815 participations in
proposals. After the corresponding evaluations,
1 065 proposals were above the threshold and
482 of them were retained for funding.
The EU financial contribution to the 482
retained proposals amounted to EUR 2 296.8
million.
Regarding funded projects, by the CORDA
extraction time in January 2017, 329 grants with
3 642 participations were already signed with a
total of EUR 1 273.9 million in EU funding.
During the first three years of Horizon 2020
implementation, JU funded projects attracted participants from 44 countries. The participation
characteristics demonstrate an improvement over FP7 and are very much similar to those of
Horizon 2020. Member States account for 93% in terms of participation and 94% in terms of
EU funding. The participation rates of third countries account for 1% in terms of both
participation and EU funding. They represent an increase from FP7 (respectively 0.52% and
0.02%) and are close to the respective rates of Horizon 2020 (1.9% in terms of participation
and 0.6% in terms of EU funding).
The top five countries in terms of participations are Germany (546 participations), France
(422), Spain (300), Italy (237) and the Netherlands (200). Participations from the top
countries account for 47% of the overall participations in the signed grants. It should be noted
1 751 eligible proposals were received in the
34 calls launched in three years
53% of the beneficiaries in the signed grants
are newcomers
For the retained grants, the total requested
EU funding is EUR 2.3 billion

15
that a large portion (53%) of the Horizon 2020 JUs' beneficiaries are new (they have not
received funding from first generation JUs).
The average EU contribution to the signed grant is EUR 3.9 million. The average number of
participants per signed grant is 11 organisations.
5.1. Participations in proposals and in projects per type of organisation
The following descriptions and convention codes are used for distinguishing between
different types of organisations:
Private for profit companies (PRC)
Public bodies (excluding research and education) (PUB)
Research organisations (excluding education) (REC)
Secondary and higher education establishments (HES)
As of January 2017, the largest share of all 13 815 participations in the 1 751 eligible
proposals corresponds to PRC (51%), followed by HES (24%), while REC ranks third with
20%.
Moreover, there are 3 642 participations (with 1 997 unique participants) in the 329 signed
grants. The largest number of participants in the signed grants come from PRC (64%),
followed by REC (18%) and HES (13%).
Figure 6: Participations in proposals and projects per type of organisation – eligible
proposals (left) and signed projects (right)
5.2. Success rates
Success rates are important in order to monitor the relationship between the proposals
submitted to the JUs calls and the proposals finally retained for funding. In this section, three
different ways of assessing this ratio are presented:
Proposals: The success rate is equal to the number of retained proposals divided by
the number of eligible proposals.
Participations in proposals: The success rate is equal to the number of participations
in the retained proposals divided by the number of total participations in the eligible
proposals.

16
EU financial contribution: The success rate is equal to the requested EU financial
contribution going to the retained proposals divided by the EU financial contribution
requested by the eligible proposals.
Figure 7: Success rates in terms of eligible proposals, applicants and requested EU contribution
(2014-2016)
Source: CORDA, data extraction on 17 January 2017
The overall success rate for the JU-related calls is 28% in terms of proposals. The success rate
ranges from 25% in FCH 2 and CS2 calls to 49% in S2R calls. The overall success rate in
terms of participations in proposals is 33%, ranging from 23% in CS2 to 61% in the SESAR
calls. The overall success rate for the EU financial contribution is 33%, ranging from 22% in
CS2 to 77% in SESAR.
The overall success rates for the JU–related Horizon 2020 calls (28%, 33%, 33%) are lower
than the success rates of the JU-related FP7 calls. However, these success rates for JU calls
are much higher than the respective rates under Pillars II (the LEIT part) and III ("Societal
Challenges") of Horizon 2020, 10%, 16% and 14% respectively. The high success rates in JU-
related calls can be explained by the focused industry related calls, highly relevant to the
particular sector with fewer potential applicants. Good support from the JUs staff during
proposal submission phase was also a positive factor.
Overall, 22.4% of all participations in proposals are by SMEs, with a 29.02% success rate on
the basis of those participations. They represent 16.9% of the total requested EU contribution.
In signed grants, SMEs represent 22% of all JU beneficiaries and receive 17.6% of the EU
funding. The SME participation rate in the JUs in terms of EU funding (17.6%) is higher than
the overall Horizon 2020 rate, 15.9%. However, even though the SME rates represent an
improvement in comparison to FP7 (20% and 16%), they are nevertheless lower than the
corresponding combined rates in Pillars II (the LEIT part) and III ("Societal Challenges") of
Horizon 2020, 27% and 24% respectively.
Figure 8: SME share in terms of participation and requested EU contribution (%)
25% 28% 25% 35% 49% 26% 27% 23%
33% 30%
61% 58%
30% 28%
22%
36%
26%
76%
62%
36% 28%
0%
10%
20%
30%
40%
50%
60%
70%
80%
CS2 IMI2 FCH SESAR S2R ECSEL BBI
In terms of proposals (average 31%) In terms of applicants (average 38%) In terms of EU contribution (average 41%)

17
It is not easy to compare and benchmark the performance of JUs operating under
Horizon 2020 with that of other similar entities as there are no comparable organisations (in
terms of scale and scope). To overcome this challenge, whenever possible (e.g. in the case of
the analysis of participation patterns), FP7 was used as a benchmark.
Table 2 lists the key implementation statistics on JUs under FP7 (2007-2013) and the first
three years of Horizon 2020 (2014-2016).
Table 2: Overview of the implementation and participation patterns for JUs calls under FP7
(2007-2013) and Horizon 2020 (2014-2016)
JUs calls under
FP 7
JUs calls under
Horizon 2020
PROPOSALS
Average number of calls per year 9 11
Average number of proposals (eligible) per call 36 52
Average number of participations per proposal 6 8
Requested EU contribution per proposal (EUR million) 1.8 3.9
Requested EU contribution per participation (EUR million) 0.3 0.5
EVALUATION
Average number of participations per retained proposal 8 9
Requested EU contribution per retained proposal (EUR million) 3.1 4.8
Requested EU contribution per participation in retained proposals
(EUR million) 0.38 0.51
Success rate in terms of proposals 33.2% 27.5%
Success rate in terms of participations in proposals 38.8% 32.5%
Success rate in terms of EU contribution 8.5%* 32.9%
PROJECTS
Average number of participations per project 8 11
Average EU contribution per project (EUR million) 2.8 3.9
Average EU contribution per participation (EUR million) 0.3 0.3
Participation rates by type of organisations
…in terms of participation
Industry (PRC) 54.0% 63.7%
Research organisations (REC) 20.0% 18.1%
Higher educational organisations (HES) 23.2% 12.8%
Public (PUB) 1.3% 3.3%
Other (OTH) 1.5% 2.1%
…in terms of EU contribution
Industry (PRC) 43.5% 66.2%
Research organisations (REC) 23.1% 21.8%
Higher educational organisations (HES) 30.6% 9.7%
Public (PUB) 1.9% 0.9%
Other (OTH) 0.9% 1.4%
SME participation
SME share in terms of participations (%) 21.8% 21.9%
SME share in terms of granted EU contribution (%) 18.9% 17.6%
Source: CORDA, data extraction on 17 January 2017.
For IMI JU – the calls results from the 2nd
stage were taken into account.
* Low rate is due to IMI's unusually low success rates in two calls. Excluding IMI data, the respective success
rates are 37.3%, 46.2%, 54.6%.
18
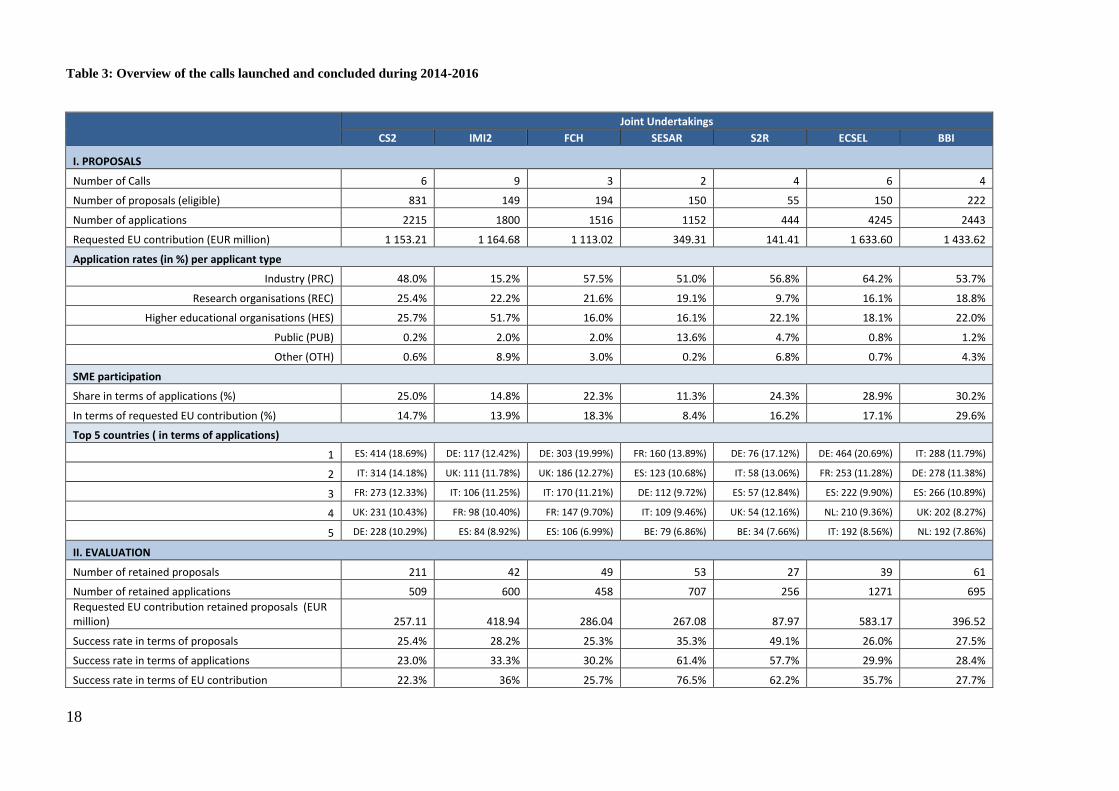
Table 3: Overview of the calls launched and concluded during 2014-2016
Joint Undertakings
CS2 IMI2 FCH SESAR S2R ECSEL BBI
I. PROPOSALS
Number of Calls 6 9 3 2 4 6 4
Number of proposals (eligible) 831 149 194 150 55 150 222
Number of applications 2215 1800 1516 1152 444 4245 2443
Requested EU contribution (EUR million) 1 153.21 1 164.68 1 113.02 349.31 141.41 1 633.60 1 433.62
Application rates (in %) per applicant type
Industry (PRC) 48.0% 15.2% 57.5% 51.0% 56.8% 64.2% 53.7%
Research organisations (REC) 25.4% 22.2% 21.6% 19.1% 9.7% 16.1% 18.8%
Higher educational organisations (HES) 25.7% 51.7% 16.0% 16.1% 22.1% 18.1% 22.0%
Public (PUB) 0.2% 2.0% 2.0% 13.6% 4.7% 0.8% 1.2%
Other (OTH) 0.6% 8.9% 3.0% 0.2% 6.8% 0.7% 4.3%
SME participation
Share in terms of applications (%) 25.0% 14.8% 22.3% 11.3% 24.3% 28.9% 30.2%
In terms of requested EU contribution (%) 14.7% 13.9% 18.3% 8.4% 16.2% 17.1% 29.6%
Top 5 countries ( in terms of applications)
1 ES: 414 (18.69%) DE: 117 (12.42%) DE: 303 (19.99%) FR: 160 (13.89%) DE: 76 (17.12%) DE: 464 (20.69%) IT: 288 (11.79%)
2 IT: 314 (14.18%) UK: 111 (11.78%) UK: 186 (12.27%) ES: 123 (10.68%) IT: 58 (13.06%) FR: 253 (11.28%) DE: 278 (11.38%)
3 FR: 273 (12.33%) IT: 106 (11.25%) IT: 170 (11.21%) DE: 112 (9.72%) ES: 57 (12.84%) ES: 222 (9.90%) ES: 266 (10.89%)
4 UK: 231 (10.43%) FR: 98 (10.40%) FR: 147 (9.70%) IT: 109 (9.46%) UK: 54 (12.16%) NL: 210 (9.36%) UK: 202 (8.27%)
5 DE: 228 (10.29%) ES: 84 (8.92%) ES: 106 (6.99%) BE: 79 (6.86%) BE: 34 (7.66%) IT: 192 (8.56%) NL: 192 (7.86%)
II. EVALUATION
Number of retained proposals 211 42 49 53 27 39 61
Number of retained applications 509 600 458 707 256 1271 695
Requested EU contribution retained proposals (EUR million) 257.11 418.94 286.04 267.08 87.97 583.17 396.52
Success rate in terms of proposals 25.4% 28.2% 25.3% 35.3% 49.1% 26.0% 27.5%
Success rate in terms of applications 23.0% 33.3% 30.2% 61.4% 57.7% 29.9% 28.4%
Success rate in terms of EU contribution 22.3% 36% 25.7% 76.5% 62.2% 35.7% 27.7%

19
Joint Undertakings
CS2 IMI2 FCH SESAR S2R ECSEL BBI
III. PROJECTS
Number of signed grants 120 25 45 53 27 25 34
Number of participations 290 488 442 969 319 721 413
Number of unique participants 205 296 286 181 183 505 341
EU contribution (EUR million) 106.37 275.88 242.99 70.43 87.92 291.01 198.31
Average size projects in terms of EU contribution (EUR million) 0.89 11.04 5.40 1.33 3.26 11.64 5.83
Average number of project participants 2.42 19.52 9.82 18.28 11.81 28.84 12.15
Participation rates (in %) per activity type
Industry (PRC) 45.5% 34.0% 60.9% 70.2% 59.6% 66.4% 62.7%
Research organisations (REC) 28.3% 19.7% 19.0% 16.3% 10.3% 18.2% 19.9%
Higher educational organisations (HES) 25.2% 35.7% 13.4% 6.6% 16.3% 14.4% 12.4%
Public (PUB) 0.7% 1.4% 2.5% 6.7% 6.9% 0.4% 1.0%
Other (OTH) 0.3% 9.2% 4.3% 0.2% 6.9% 0.6% 4.1%
SME participation
In terms of EU funded participations (%) 25.2% 11.8% 26.5% 6.6% 19.1% 28.9% 35.4%
In terms of granted EU contribution (%) 23.8% 10.3% 30.7% 7.3% 10.8% 13.2% 27.4%
Top 5 countries ( in terms of participations)
1 FR: 55 (18.97%) DE: 48 (16.22%) DE: 90 (20.36%) FR: 149 (18.4%) DE: 65 (20.38%) DE: 153 (21.2%) DE: 61 (14.77%)
2 ES: 45 (15.52%) UK: 47 (15.88%) FR: 57 (12.90%) ES:112 (11.56%) ES: 47 (14.73%) FR: 89 (12.34%) NL: 59 (14.29%)
3 IT: 37 (12.76%) FR: 31 (10.47%) UK: 55 (12.44%) IT: 93 (9.60%) IT: 32 (10.03%) NL: 81 (11.23%) IT: 34 (8.23%)
4 UK: 37 (12.76%) NL: 30 (10.14%) IT: 41 (9.28%) DE: 78 (8.05%) FR: 29 (9.09%) ES: 67 (9.29%) BE: 31 (7.51%)
5 DE: 32 (11.03%) FR: 43 (8.81%) ES: 29 (6.56%) BE: 51 (5.26%) SE: 29 (9.09%) AT: 61 (8.46%) FI: 31 (7.51%)
Source: CORDA, data extraction on 17 January 2017
20
6. ANSWERS TO THE EVALUATION QUESTIONS
Each group of independent experts in charge of a JU evaluation addressed the set of
evaluation questions in chapter 4, which are organised under the seven criteria, required in
this exercise, namely relevance, coherence, efficiency, effectiveness, EU added value,
openness and transparency. The following assessments, corresponding to each of those
criteria, are based on the findings of the seven expert groups, the outcomes of the common
open public consultation of stakeholders and the survey of project coordinators, as well as the
views of the relevant Commission services summarised in the text boxes in each section.
6.1. Relevance
All individual evaluations confirm the continued relevance of the JUs in addressing strategic
technologies that are already or rapidly emerging as cornerstones of a knowledge-based
European economy and are linked to the objectives of the Europe 2020 strategy and Horizon
2020. They also underline that the socio-economic conditions that in 2013 justified the choice
of the JU as the instrument to be used for the current JU based PPPs are still present and
remain valid.
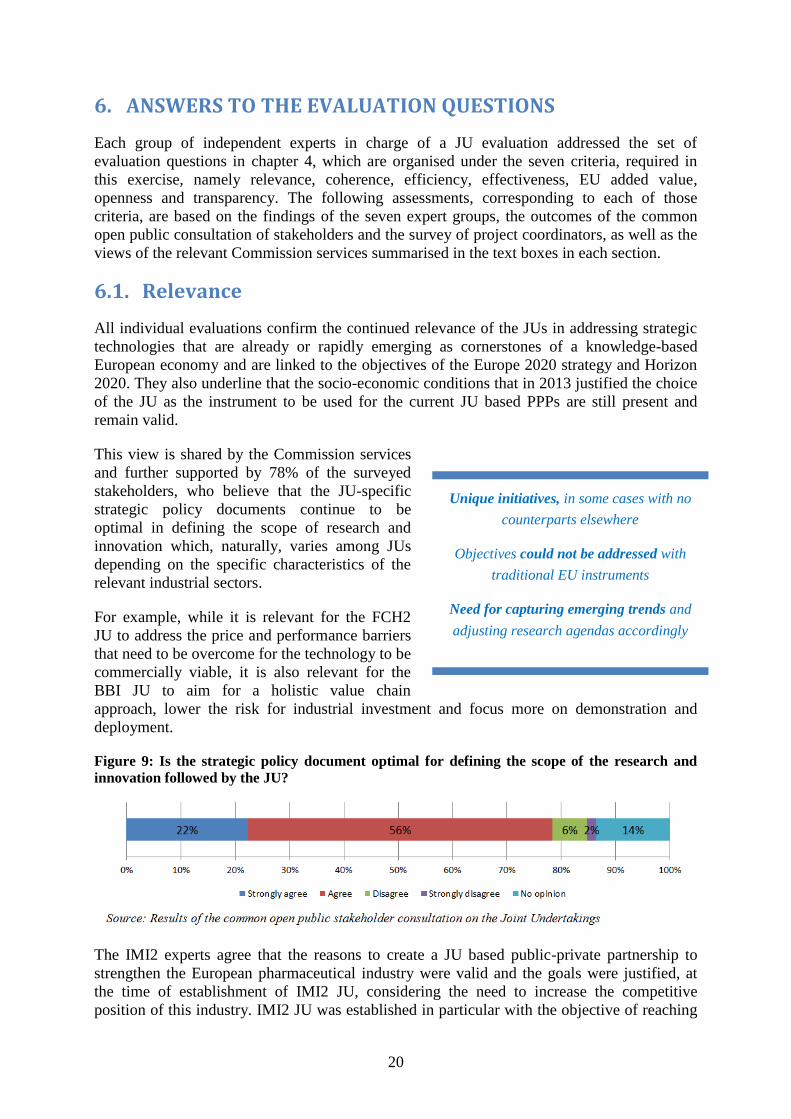
This view is shared by the Commission services
and further supported by 78% of the surveyed
stakeholders, who believe that the JU-specific
strategic policy documents continue to be
optimal in defining the scope of research and
innovation which, naturally, varies among JUs
depending on the specific characteristics of the
relevant industrial sectors.
For example, while it is relevant for the FCH2
JU to address the price and performance barriers
that need to be overcome for the technology to be
commercially viable, it is also relevant for the
BBI JU to aim for a holistic value chain
approach, lower the risk for industrial investment and focus more on demonstration and
deployment.
Figure 9: Is the strategic policy document optimal for defining the scope of the research and
innovation followed by the JU?
The IMI2 experts agree that the reasons to create a JU based public-private partnership to
strengthen the European pharmaceutical industry were valid and the goals were justified, at
the time of establishment of IMI2 JU, considering the need to increase the competitive
position of this industry. IMI2 JU was established in particular with the objective of reaching
Unique initiatives, in some cases with no
counterparts elsewhere
Objectives could not be addressed with
traditional EU instruments
Need for capturing emerging trends and
adjusting research agendas accordingly
21
out to new stakeholders and broadening the network of collaboration in the healthcare family
to non-pharmaceutical companies. The experts consider that increasing and facilitating
collaborations with non-pharmaceutical companies remains essential.
The FCH2 JU experts perceive the activities of the JU as highly relevant to the grand
challenges facing Europe by supporting the climate change objectives, helping improve
energy security and contributing to raising the status of Europe as an international leader in
FCH technologies. They add that in the specific cases where Europe is leading (e.g. hydrogen
fuel cell buses, refuelling infrastructure), the contribution of the JU through R&D activities,
demonstration projects and fostering European collaboration is clear and substantial.
Example Box: Relevance of ECSEL JU – The experts 'view
The intended role and objective of ECSEL is to keep Europe at the forefront of technology development in
the area of Electronic Components and Systems, bringing together embedded systems (ARTEMIS),
nanoelectronics (ENIAC) and Smart Systems Integration (EPOSS). It is clear that the combination of the
three domains supported by private and public investment has allowed problems that could not be addressed
by single funding sources alone to be tackled in order to create significant impacts.
The relevance of ECSEL JU regarding its key aim to bring together the fragmented Electronic Components
and Systems community with the purpose to achieve a greater impact is demonstrated unambiguously by its
stakeholder participation of over 1000 organisations in 3 years. Source : All Example Box texts quote the opinions from the expert group reports referred to in Annexes E and F,
unless stated otherwise
All transport-related expert groups (S2R JU, CS2 JU and SESAR JU) agree that the JUs show
significant matches with EU strategic goals and/or initiatives such as those detailed in the
Transport White Paper.
The SESAR JU experts highlight the importance of the JU as a key enabler of the wider
Single European Sky policy, already delivering solutions for the modernisation of the Air
Traffic Management (ATM) in Europe and strengthening cooperation among ATM
stakeholders, who have never before worked together, including national authorities.
Summary Box: Is the public-private partnership the most appropriate instrument to address the strategic
objectives of the industrial sector?
The experts' views
FCH2 JU: The experts consider that this was the correct choice at that time. Neither the continuation under the
Framework Programme, nor contractual PPP would have stimulated the creation of the FCH community that has
developed around the JU, nor would it have engaged industry as fully or fostered the development of a strategic
research agenda.
BBI JU: In the interviews, the change of situation before and after creating the BBI JU was characterised mainly
through two main aspects: BBI JU has provided a structuring effect, bringing together the sectors and actors
towards deployment of new value chains, and it has mobilised increasing investments on developing innovations
for the bio-based industries.
CS2 JU: The policy and rationale that underlay the Clean Sky programme in 2007 is still in line with the current
challenges in the air transport sector and the portfolio of tasks entrusted to the Clean Sky 2 Joint Undertaking,
and the effective execution of them in Clean Sky 1, continues to underwrite the PPP approach.
SESAR JU: “The on-time implementation of SESAR, compared with a scenario in which ATM is not
modernised, would have a positive impact on GDP estimated at EUR 419 billion (SJU, 2011)." The experts
agreed that this result continues to be relevant. Modernisation of the ATM is a key enabler of air transport and
GDP growth.
22
The S2R JU experts agree that the JU and its objectives continue to be relevant. In this
respect, they highlight the need for capturing emerging trends and incorporating them in the
research agenda of a possible second generation S2R JU. They cite the emergence of new
trends in the transportation market (driverless car, car-sharing platforms, etc.) that may
significantly impact the innovation needs and existing market conditions and, as such, they
should be added in the relevant research agendas.
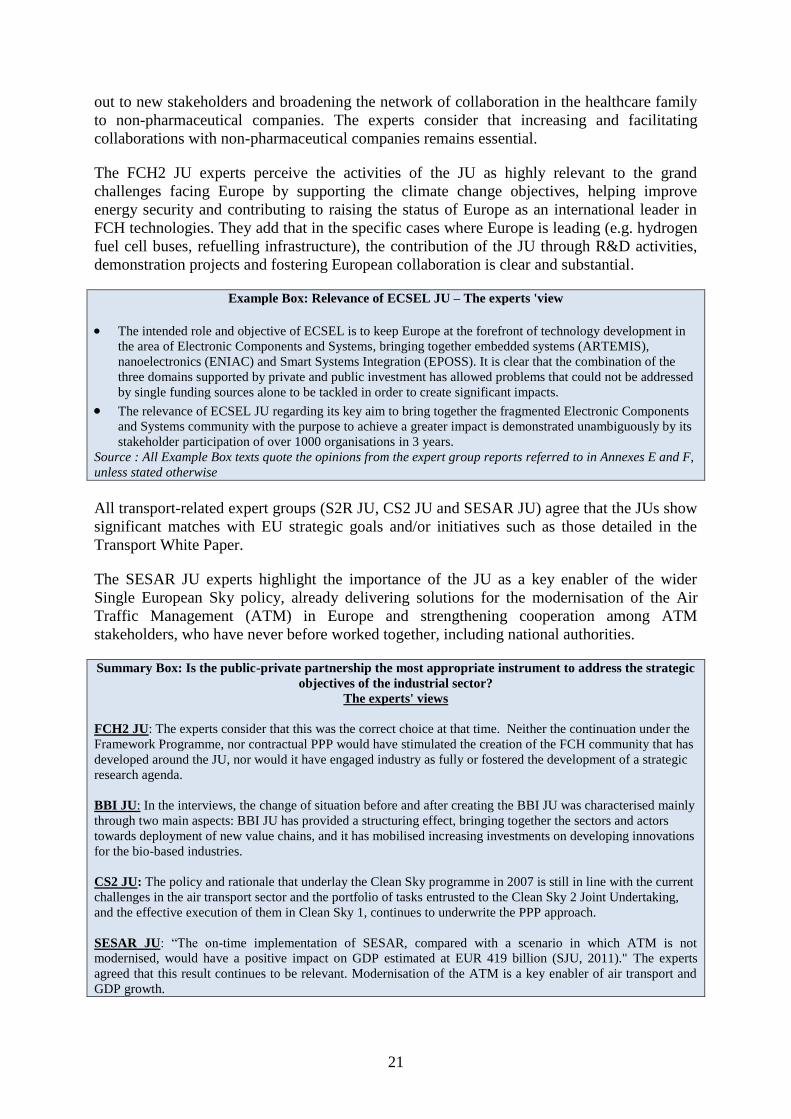
This opinion of the experts regarding the relevance of the current activities is shared by the
stakeholders. In general, only 33% of them consider that the JU should undertake new tasks in
order to achieve the objectives set out in the current Regulation.
Figure 10: Should the JU undertake any other tasks in order to achieve the objectives set out in
the Regulation?
6.2. Effectiveness
The question aims to provide an insight into the extent that JUs are on track to meet their
objectives with regard to the intended outcome and expected impact. It is important to keep in
mind that any reference to outcome and impact presented in this section is based on partial
data and they can only present a partial snapshot of today's state-of-play.
Where possible, the achievements contributing to the objectives will be measured through
some of the Key Performance Indicators (KPIs) structured into three types: the Horizon 2020
KPIs common to all JUs, Horizon 2020 KPIs on cross-cutting issues and the JU specific
KPIs.
For a closer look at selected indicators, please refer to the individual evaluation reports, which
present a detailed quantitative or qualitative assessment of the KPIs per JU.
6.2.1. Engagement of stakeholders
All expert groups agree that a main achievement is that the JUs managed to structure and
mobilise an otherwise fragmented landscape of different sectors and industries and convince
competing or different, seemingly unrelated stakeholders to work together in pursuit of
commonly shared visions and goals.
Due to their importance in setting the research agenda, coupled with their ability to mobilise
significant resources, both public and private, JUs are quickly becoming leaders in their areas

23
of interest, potentially rising to a position of major influence when the core technology and
changes are in question.
Therefore, there is a high interest of major players to be
actively involved in the JUs. Judging from the
composition of the individual JUs' membership and their
top ranking beneficiaries, one can conclude that the JUs
are able to attract prominent players in their respective
fields of activity, not only in terms of size and position in
the market but also in terms of R&D intensity and
innovation potential.
For example, in the case of the CS2 JU, the experts
underscore that the JU is gathering together world-class
aeronautical companies and industry leaders in the supply
chain such as, for example, Airbus, Dassault Aviation,
Augusta Westland, Rolls Royce, Saab, DLR, ONERA, Fraunhofer, Piagio Aerospace, Safran
and Thales.
In the case of the ECSEL JU, the experts note that it is attracting the best European players in
the semiconductor and systems domains like, for example, STMicroelectronics, Infineon,
Philips, Thales, NXP, Bosch, Siemens, Daimler, Atos, etc.
However, despite this significant achievement, many expert groups call for a wider range of
stakeholders to be included either in the governance structures or in project consortia.
For example, the FCH2 JU experts have counted among the participants many of the world
class car manufacturers (Volkswagen, Daimler, Honda, BMW, Nissan, Renault) as well as top
energy and utility companies (Bosch, Siemens, General Electric), and conclude that for both
the transport and energy applications, top innovators are represented very well. They also
consider that the way in which industry built the representative structure and engaged itself
into the planning and execution of the programme is indicative of the appeal the JU exerts on
the stakeholders and a testament to their commitment. At the same time, they call for stronger
cooperation with additional regulators (e.g. health and safety, standards, etc.) than the ones
currently in the Governing Board in order to foster further FCH technology deployment.
Finally, they recommend strengthening the value chain approach by a greater participation of
end users and customers.
Example box: Engagement of major R&I actors – The experts view of IMI2 JU
IMI2 JU: A unique collaboration model creating long-lasting collaborative networks
The main achievement of IMI2 JU, on which there was general consensus, was that since the Joint Undertaking
started collaborations between different competing global companies, SMEs and academia became possible.
These collaborations created trust and new partnerships, including partners from a number of expertise areas,
such as patient representative groups or regulatory bodies, which are essential stakeholders for medicines to
enter the market with quality, safety and efficacy guarantees and in the shortest possible time.
However,
The experts note that there is an urgent and pressing need to meaningfully involve industries from other sectors
beyond the biopharmaceutical sector, such as technology providers.
The Joint Undertakings effectively
managed to engage the major R&I
actors in the industrial sectors
concerned
Need to reach a wider range of
stakeholders
24
Considering that the ECSEL JU emerged from the fusion of the ARTEMIS and ENIAC JUs
existing under FP7, the experts appreciated the considerable efforts devoted by all actors to
integrate the activities of three communities of stakeholders in the area of embedded systems,
nanoelectronics and smart systems into one single domain, the ECSEL JU, and note that there
is still a need for additional actions to this end.
The BBI JU experts confirm that the JU has attracted a satisfactory level of participation of
the best European players in the areas of the selected value chains. At the same time they call
for increased involvement of educational and research institutions in BBI JU programmes and
projects in medium to long-term precompetitive industrial innovation topics that should be
defined in common by all stakeholders.
The S2R JU experts mention that the JU helped already to create continuity and shared
common vision for rail research within the railway community. In addition it has helped to
build trust between players that would otherwise not have the opportunity to share ideas and
common interests outside a commercial situation. They also note that, the presence of rail
operators in the JU should be strengthened over time.
Finally, with regard to the SESAR JU, the experts note that, in comparison to the operation of
the SESAR JU under FP7, a greater emphasis is already placed on achieving a wider
involvement of the full range of stakeholders for the implementation of the European ATM
Master Plan.
6.2.2. Governance
All experts agree that the governance structures of the JUs are
effective in both their strategic and management tasks.
Moreover, they acknowledge improvements over FP7 on the
division of responsibilities between the Executive Directors
and the Governing Boards allowing the latter to focus more
on strategic matters.
In analysing the interactions between the different bodies in
the governance of the JUs, a number of expert groups express
concern on the role of the advisory groups and their limited impact on Governing Boards'
strategic research decisions.
For example, the IMI2 JU experts suggest improvements that could lead to a more efficient
and effective communication between the different bodies. In particular, they call for a
stronger interaction with the States' Representatives Group (SRG) in order to ensure better
alignment between national and regional developments and priorities. Also, they call for
better feedback from the Governing Board on the relevance and impact of contributions from
the Scientific Committee (SC), similar to the efficient communication established between the
Governing Board and the seven Strategic Governing Groups, itself an improvement over FP7.
They also comment on the communication with patient groups, which has also improved in
comparison to FP7.
The FCH2 JU experts note that it is not clear how the advice and feedback of the advisory
bodies is taken into account and reflected in the JU's strategic documents. This follows similar
conclusions regarding the FCH JU under FP7 where the experts concluded that the roles and
responsibilities were not clear to all members of the advisory bodies and, therefore, they have
Effective governance structures
Need for stronger interaction
between Governing Boards and
advisory bodies

25
not delivered to their full potential. While they acknowledge that the members of the SC are
now carrying out their tasks meaningfully to provide a useful service to the JU, they also call
for improved coordination within the Member States, starting with upgrading the SRG with
members of sufficient seniority and power to reach agreements on improving consistency
with national programmes.
The CS2 JU experts also consider that the SRG does not seem to have fulfilled its full
potential in maintaining a close relationship with the Member States in order to influence the
Clean Sky programme or to develop synergies with national research strategies. They do
however praise the role of the SC in offering a good appreciation of the state of the art and
analysing Clean Sky from the perspectives of environmental impact, technology and scientific
trends and societal and economic considerations.
The S2R JU experts suggest enlarging the composition of the Scientific Committee with
scientists other than railway engineers, such as economists, sociologists and geographers. In
addition, synergies with other advisory bodies such as Transport Advisory should be created.
In the case of the SESAR JU, its strong link to the Single European Sky framework allows for
the involvement of Member States, through i) the European Commission who consults the
Single Sky Committee on strategic decisions of the Administrative Board such as the updates
of the European ATM Master Plan, and ii) through cooperative agreements between the JU
and the National Supervisory Authorities.
6.2.3. Impact: Key Performance Indicators
Key Performance Indicators (KPIs) are used to measure
impact in order to improve the understanding of JU
strategic challenges from the perspective of decision
makers, management and societal stakeholders and, also, to
justify support for the JU instrument.
Under FP7, while special care was taken to measure and
report on input parameters (programme implementation
statistics, budget execution, participation rates, etc.) and
output (project results, patent applications, scientific
publications), less effort has been devoted to measuring
impact by defining objective, stable over time KPIs. The absence or selective use of such
indicators hampers our ability to assess the lasting effects of the JUs under FP7.
The absence of established KPIs is no longer an issue under Horizon 2020. As provided for
in the legal bases, three sets of KPIs were defined to measure impact, improve the
understanding of strategic challenges from the perspective of decision makers, stakeholders
and management and, also, justify support for the JU instrument. The first set contains KPIs
common to all Horizon 2020 implementing entities including the JUs, the second set
addresses Horizon 2020 cross-cutting issues that are also common to all JUs and the third set
consists of KPIs that are specific to the objectives and impact of each JU.
All three sets of KPIs are monitored and reported by the JUs on an annual basis even though
the majority of the JU-specific KPIs (third set of KPIs) cannot be properly measured yet since
they rely on project output data that, with 93% of the projects running the first or second year
of implementation, are not yet available.
Re-visit and re-define the JU-
specific Key Performance Indicators
With 93% of projects running the
first or second year of
implementation, no JU-specific KPIs
can be properly measured

26
At present only two KPIs related to sustainable development and climate change can be safely
reported since they are based on initial feedback from 420 ongoing JU funded projects. As
indicated by the table below, the percentages of EU contribution to JU funded projects not
only exceed the set targets but, also, they are significantly higher than the respective
combined rates in Pillars II (the LEIT part) and III ("Societal Challenges") of Horizon 2020.
Table 4: KPIs measuring the impact on sustainable development and climate change actions
KPI JUs funded
projects
Horizon 2020
(Pillars II and III)
Climate action target: 35% of EU financial contribution is
climate–related (RIO-Markers methodology)
79% 35%
Sustainable development target: 60% of EU financial contribution
is sustainability related ((RIO-Markers methodology)
92% 75%
Source: CORDA data
Despite the abundance of available KPIs, several expert groups criticise the choices of the JU-
specific KPIs, their respective targets and their presentation in the Annual Activity Reports by
arguing that they do not serve the intended purpose and, therefore, need to be re-visited and
re-defined.
In a discussion paper produced by the chair of the evaluation teams of the transport-related
(CS2 JU, S2R JU and SESAR JU) expert groups, an in-depth analysis of the KPIs used
currently by the JUs is presented, and it is concluded that while many KPIs are defined and
reported, their current strategic value for decision makers, both within the JUs and outside, is
limited. The experts suggest, among others, to reduce the number of reported KPIs to only
those relevant to the main strategic challenges, focusing more on sector-specific global
competitiveness. They also stress the importance of reporting evolution of KPIs over time.
The IMI2 JU group calls for a new performance measurement framework to replace the
existing KPIs with SMART10
indicators and report on them along with corresponding
baseline metrics. The Commission Internal Audit Service had also recommended previously
to IMI2 JU to design RACER (relevant-accepted-credible-easy-robust) KPIs.
The ECSEL JU group calls for the definition of appropriate metrics and compulsory follow
up, once projects are finalised, to assess the impact of projects and thus justify EU funding.
While not questioning the choice of KPIs, the FCH2 JU group calls for revisiting the set
targets since some were considered to be not sufficiently ambitious and others over-ambitious.
Finally, in the case of the BBI JU, while the available JU-specific KPIs were found to be on
track, the experts call for further monitoring activity and analysis, making a clear distinction
between the actually achieved KPIs at the end of each year and the projected KPIs.
10
Specific, Measurable, Achievable, Relevant, Time-bound
27
Outputs
Owing to the late adoption of the Council
Regulations establishing the JUs under Horizon
2020, only a few JU calls were launched late in 2014,
with the majority following in 2015 and 2016. For
this reason, the number of calls launched (34) and
grants signed (329) during the reference period
remain limited. Consequently, as of January 2017,
93% of the signed JU projects are running the first or
second year of their duration and only a single JU
project was completed. Clearly, this makes it too
soon to make a comprehensive assessment of the
outcome and impact of the projects funded by the
JUs under Horizon 2020.
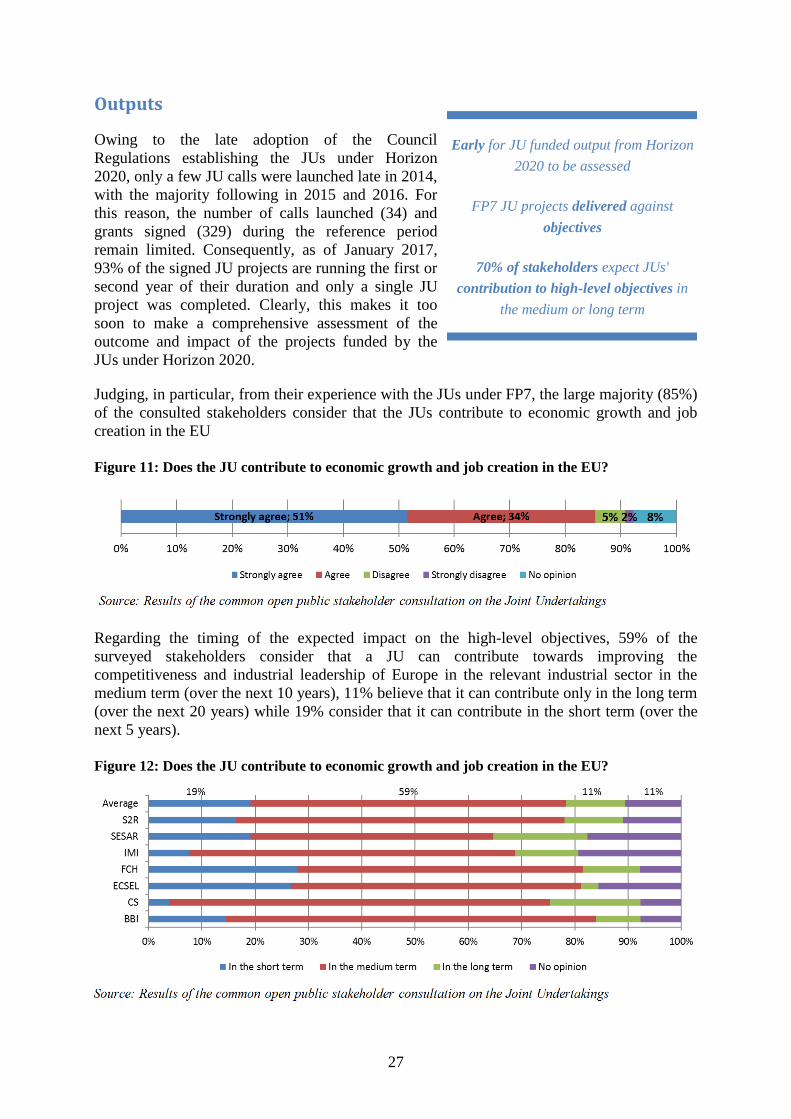
Judging, in particular, from their experience with the JUs under FP7, the large majority (85%)
of the consulted stakeholders consider that the JUs contribute to economic growth and job
creation in the EU
Figure 11: Does the JU contribute to economic growth and job creation in the EU?
Regarding the timing of the expected impact on the high-level objectives, 59% of the
surveyed stakeholders consider that a JU can contribute towards improving the
competitiveness and industrial leadership of Europe in the relevant industrial sector in the
medium term (over the next 10 years), 11% believe that it can contribute only in the long term
(over the next 20 years) while 19% consider that it can contribute in the short term (over the
next 5 years).
Figure 12: Does the JU contribute to economic growth and job creation in the EU?
Early for JU funded output from Horizon
2020 to be assessed
FP7 JU projects delivered against
objectives
70% of stakeholders expect JUs'
contribution to high-level objectives in
the medium or long term

28
FP7 project outputs
In contrast to Horizon 2020, the final evaluations of the JUs under FP7 report on a large
number of concrete project outputs that, according to the experts, give rise to reasonable
expectations with regard to impact in the medium term.
For example, in the case of the SESAR JU, the experts report on impressive and concrete
project outputs, as summarised in the box below.
Example box: SESAR JU – Major achievements
Completion of over 400 projects, 350 validation exercises and 30,000 flight trials.
63 SESAR Solutions (new or improved operational procedures or technologies).
23 are already mandated for deployment by the SESAR Deployment Manager under the Pilot Common
Project regulation.
A strong and leading brand for ATM modernisation both within Europe and globally.
In the transport area, the FCH JU demonstrated 140 fuel cell cars and light duty vehicles and
45 buses in several Member States along with 17 hydrogen refuelling stations. The FCH
experts consider that in the areas where Europe maintains a technology leading edge -
hydrogen fuel cell buses, refuelling infrastructure - it is possible to detect a substantial
contribution from the FCH JU through its demonstration projects, its capacity to facilitate
European collaboration and its brokerage of cooperative solutions.
A good example of success for the ENIAC JU is the company AMS AG. With the help of the
EU funding schemes, especially ENIAC and later ECSEL, but also to a number of
acquisitions, it has managed to transform itself from a foundry with commodity products into
a specialist for producing sensors and sensor systems for a variety of markets. Located
originally in Austria, it now has research and development facilities in 20 design centres
world-wide, employing around 3 300 people.
The IMI JU experts also report on a number of significant project outputs (see example box)
even though they stress that impact is not yet demonstrated.
Example box: Examples of significant long term networks established by IMI JU under FP7
New Drugs 4 Bad Bugs: this programme represents an unprecedented partnership between industry, academia
and biotech organisations to combat anti-microbial resistance in Europe by tackling the scientific, regulatory,
and business challenges that are hampering the development of new antibiotics.
Under COMBACTE-Net project, a pan-European clinical trial hospital network - CLIN-Net - was set up, with
more than 800 clinical sites in 40 European countries to conduct high-quality clinical studies, to find new
antimicrobials against resistant bacterial pathogens. This project has set up a clinical research network in autism
which currently consists of 93 sites spread across 37 European countries. The database compiles clinical data of
over 7 000 individuals with Autism Spectrum Disorder.
EU-AIMS: This project has set up a clinical research network in autism which currently consists of 93 sites
spread across 37 European countries. The database compiles clinical data of over 7, 000 individuals with Autism
Spectrum Disorder.
PROTECT: established an open access Adverse Drug Reaction database and Drug Consumption Databases.
Along the same lines, the majority of the stakeholders (76%) believe that the JU projects have
resulted in specific scientific and/ or technological successes.

29
Figure 13: Do you consider that JU projects have resulted in specific scientific and/ or
technological successes?
The importance of the sustainability of project results and outputs beyond the end of the
projects is underscored by the experts, as they consider it to be an important success factor
leading to the realisation of the greater, high-level and long-term objectives of the JUs. A
sample of such projects is presented below.
Example box: Sustainability of JU funded project results
IMI JU: The eTOX project aimed to develop a drug safety database to better predict the toxicological profiles of
small molecules in early stages of the drug development pipeline. The database includes a mature and
professional software platform and a collection of useful models to support toxicity prediction. Several tools are
now freely accessible for the scientific community benefit.
ARTEMIS JU: The AUTOSAR (AUTomotive Open System ARchitecture) was originally developed as a
European standard for automotive systems integration (electronic control units) but has now been adopted world-
wide by manufacturers, including in the US and Japan.
CS JU: The Tech 800 engine demonstrator provides a platform to test new engine designs with significant
environmental and economic characteristics. The technologies were integrated in the product development of
the new Turbomeca ARRANO engine, which has recently been selected by Airbus helicopters for the new
Airbus H160 helicopter.
Patent applications
The industrial nature and orientation of the research agendas of the JUs is best reflected by the
outstanding performance of CS JU and ENIAC JU in filing a large number of applications for
patents (see table below). On average, the JUs under FP7 filed 2.73 applications per EUR 10
million of funding against 1.20 applications for the FP7-Cooperation Specific Programme.
Table 5: Patent applications filed by FP7 JUs funded projects
Joint Undertaking FCH CS IMI ENIAC Artemis Total JUs FP7
Cooperation*
IPR reported as patent applications
36 151 32 303 49 606 1 593
No. of patent applications per EUR 10 million
0.82 7.44 0.33 6.46 3.49 2.73 1.20
Source: EC calculation based on the evaluation reports and CORDA data; FP7 data are reported based on the
FP7 projects by July 2017
Publications
On average, the JU funded projects under FP7 published 34 publications per EUR 10 million
against 41 respectively published by the projects funded by the Cooperation Specific
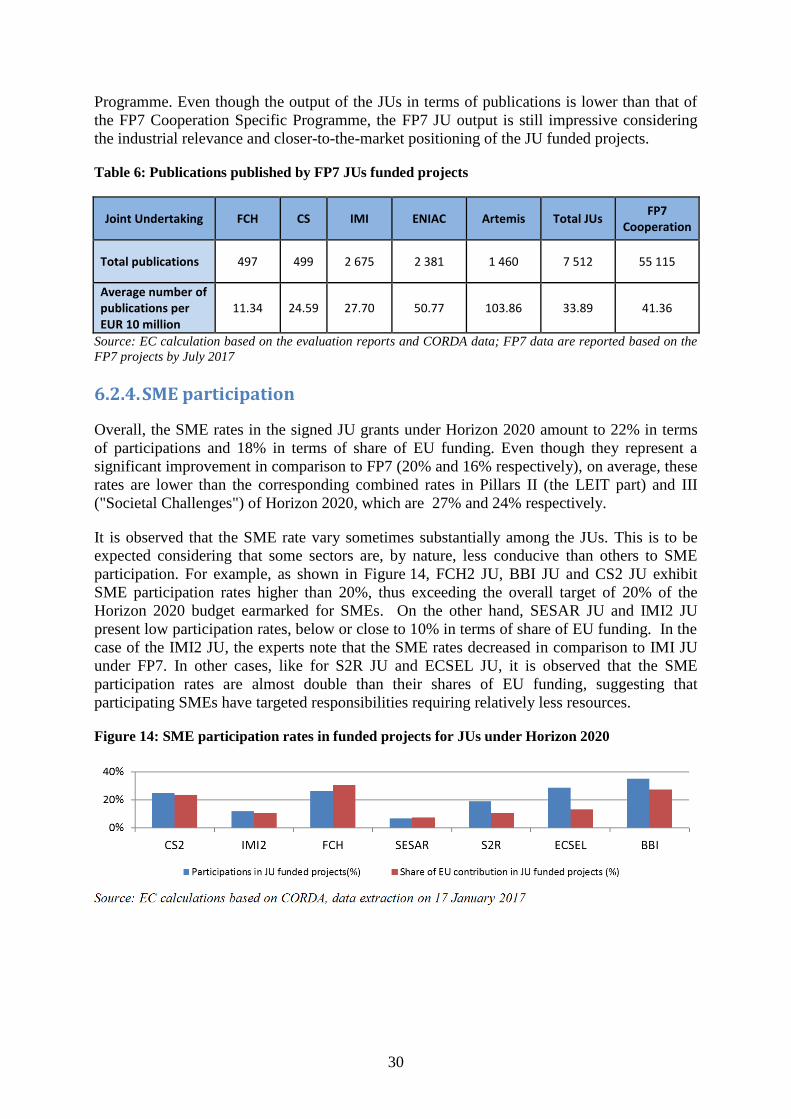
30
Programme. Even though the output of the JUs in terms of publications is lower than that of
the FP7 Cooperation Specific Programme, the FP7 JU output is still impressive considering
the industrial relevance and closer-to-the-market positioning of the JU funded projects.
Table 6: Publications published by FP7 JUs funded projects
Joint Undertaking FCH CS IMI ENIAC Artemis Total JUs FP7
Cooperation
Total publications 497 499 2 675 2 381 1 460 7 512 55 115
Average number of publications per EUR 10 million
11.34 24.59 27.70 50.77 103.86 33.89 41.36
Source: EC calculation based on the evaluation reports and CORDA data; FP7 data are reported based on the
FP7 projects by July 2017
6.2.4. SME participation
Overall, the SME rates in the signed JU grants under Horizon 2020 amount to 22% in terms
of participations and 18% in terms of share of EU funding. Even though they represent a
significant improvement in comparison to FP7 (20% and 16% respectively), on average, these
rates are lower than the corresponding combined rates in Pillars II (the LEIT part) and III
("Societal Challenges") of Horizon 2020, which are 27% and 24% respectively.
It is observed that the SME rate vary sometimes substantially among the JUs. This is to be
expected considering that some sectors are, by nature, less conducive than others to SME
participation. For example, as shown in Figure 14, FCH2 JU, BBI JU and CS2 JU exhibit
SME participation rates higher than 20%, thus exceeding the overall target of 20% of the
Horizon 2020 budget earmarked for SMEs. On the other hand, SESAR JU and IMI2 JU
present low participation rates, below or close to 10% in terms of share of EU funding. In the
case of the IMI2 JU, the experts note that the SME rates decreased in comparison to IMI JU
under FP7. In other cases, like for S2R JU and ECSEL JU, it is observed that the SME
participation rates are almost double than their shares of EU funding, suggesting that
participating SMEs have targeted responsibilities requiring relatively less resources.
Figure 14: SME participation rates in funded projects for JUs under Horizon 2020

31
Figure 15 shows that with the exception of IMI2 JU and SESAR JU, the SME share of EU
funding is higher in funded projects than in proposals, and in some cases (CS2 JU, ECSEL
JU) substantially higher. This is indicative of the capacity of SMEs to be part of strong
consortia that submit proposals of higher quality. It may also be due to the measures
introduced by some JUs in order to increase the presence of SMEs in their activities like, for
example, defining SME-friendly topics in calls for proposals, providing for specific SME
representation in the Governing Board etc.
Figure 15: SME share of EU funding in proposals and projects for JUs under Horizon 2020
In fact, the issue of SME participation should be considered separately for each JU by taking
into account the respective industrial characteristics. In this respect, it is important to study
the differences between JUs and the typical industry profile participating in JUs' activities.
For some JUs, SME participation objectives are easier to reach simply due to the nature of
their private sector, e.g. in the case of ECSEL, where over 1000 organisations took part in the
JU activities in the period 2014 – 2016 and, correspondingly, the SME participation was also
above average, hovering around 27%. On the other hand, JUs like SESAR, which support
research in air traffic management in Europe, attract partners with a different profile, since air
traffic management is not an area of interest to typical SMEs. Other barriers that can prevent
SMEs to participate are11
:
Competition with other programmes at national level and EU level, which are
sometimes more attractive to SMEs, such as the SME instrument and Eurostars;
The rather short deadlines in the calls, in combination with a rather long time-to-grant
from an SME perspective;
SMEs have relatively weak links with the rest of the innovation ecosystem (academia,
pharmaceutical industries), thus facing problems to join the right consortia;
Topics that are too narrowly defined for SMEs, which would need more flexibility
The results of the public consultation show that 67% of the respondents agree that the JUs
sufficiently encourage participation of SMEs in their research funded projects. However 20%
of the respondents disagree, proving that there is a need for a continuous effort from JUs to
involve SMEs and to tackle the potential barriers.
6.2.5. Member States participation and Widening
Member States' participation rates in JU funded projects are quite similar to those in Horizon
2020 projects as shown in the table below. More specifically, table 7 presents the Top 10
ranking of the Member States by share of JU funding and the same ranking by share of the
11
SWD Interim evaluation Horizon 2020

32
Horizon 2020 funding. It is observed that 9 out the 10 top Member States are the same under
both rankings. The exceptions are Denmark and Finland which swap between the 10th
and
11th
positions in the two rankings. It is also observed that the cumulative shares of funding
and participations are close to each other, with the JU rates being consistently higher by
around 5%. This relatively small difference in the rates can be attributed to the more focused,
product or market oriented research promoted by the JUs, a declared JU objective, which
typically attracts participants from the top industrial Member States.
Table 7: Top 10 Member States by share of JU funding (left) and Top 10 Member States by
share of Horizon 2020 funding (right)
Ranking by
share of JU
funding
Member State
JU
Ranking by
share of H2020
funding
Member State
Horizon 2020
Share of participa-
tions
Share of JU funding
Share of participa-
tions
Share of H2020
funding
1 Germany 16.1% 19.9%
1 Germany 13.7% 18.4%
2 France 13.3% 14.7%
2 UK 13.5% 16.2%
3 UK 8.7% 14.5%
3 France 10.8% 11.0%
4 Netherlands 8.4% 11.0%
4 Spain 11.3% 9.5%
5 Italy 9.3% 7.9%
5 Italy 10.6% 8.7%
6 Spain 10.5% 7.8%
6 Netherlands 6.9% 8.3%
7 Belgium 5.7% 6.2%
7 Belgium 4.9% 5.3%
8 Austria 5.4% 4.3%
8 Sweden 3.4% 3.7%
9 Sweden 4.6% 3.4%
9 Austria 3.1% 3.0%
10 Finland 3.0% 2.5%
10 Denmark 2.5% 2.6%
Total Top 10 85.3% 92.2%
Total Top 10 80.6% 86.7%
Regarding Widening, the participation rates of the EU-13 Member States in JU funded
projects amount to 7.3% in terms of number of participations and 3.6% in terms of share of
EU funding. While these rates are higher than those of FP7 (4.3% and 2.3% respectively) and
suggest improved performance over time, they are nevertheless lower than the corresponding
combined rates of 8.2% and 4.7% in Pillars II (the LEIT part) and III (Societal Challenges) of
Horizon 2020. Here again, one important reason for the poor performance of EU-13 in JU
funded research is considered to be the more focused, product or market oriented research
promoted by the JUs that corresponds well to the interests and capacities of applicants from
advanced industrial countries.
While it can be argued that the extent of EU-13 participation is generally commensurate with
the number of researchers or the scale of R&D investment, it is acknowledged that EU-13
rates are still rather low, despite their improvement over FP7.
6.3. Efficiency
All expert groups concluded that the JUs carry out their operations in an efficient manner.
The Commission shares the positive views of all expert groups on the operational efficiency
of the JUs, even though it is unfortunate that the current lack of Horizon 2020 project outputs
limits the possibility for an in-depth comparative assessment of inputs invested against
outputs/impact acquired.

33
Most experts consider the JUs to be lean and efficient
organisations operating with low administrative costs
(5 out of 7 JUs function below 5% of their operational
budget) given the complexity, spectrum and volume of
operations that they are called to carry out by
respecting and following EU rules and procedures.
Basic performance indicators such as time-to-grant,
time-to-inform and time-to-pay are all shown to be
within the set targets and have shown improvement in
comparison to the first generation JUs under FP7.
Summary Box: Experts conclusions on the JUs operational efficiency
CS 2 JU: - The Clean Sky Programme Office performs remarkably well and efficiently.
FCH2 JU: The overall operational efficiency of the FCH 2 JU has improved as the institution has matured.
Settlements of prepayments and costs claims (TTP) were never late, which is a very important fact in particular
for SMEs and beneficiaries of large demonstration projects.
IMI 2 JU: The operational efficiency including the efficiency of management and budget execution is
satisfactory for IMI2 JU as well as IMI JU.
S2R JU: S2R is still setting into its management processes. The management functions of the JU appear to be
timely and well executed. There is no benchmark for time-to-grant, as there are few calls to base this on. There
are some areas which may improve matters in the future.
SESAR JU: There is currently limited evidence available to gauge the efficiency of the SESAR JU under
Horizon 2020 rules, as only a limited part of the programme has been just launched. The SESAR JU has engaged
extra staff with the requisite knowledge to deal with the additional burden. Current metrics indicate transition
issues from SESAR 1, but this was due to an initial lack of knowledge by the JU and its members of the Horizon
2020 rules, procedures, and tools as well as lack of maturity in those rules, procedures and tools, which caused
some delays. The SESAR JU has already taken corrective action and performance levels have returned to the
excellent levels of SESAR 1.
6.3.1. Analysis of the Joint Undertakings' performance
6.3.1.1. Timely execution of the functions
The summary table below shows that the JUs were efficient in producing the planned outputs
(issuing calls, evaluating proposals and administering grants) and achieving good results in
terms of KPIs. All calls for proposals were published and closed according to the respective
work plans. The results regarding 'time-to-grant' and 'time-to-pay' are considered as very
good, as all JUs remained well below the defined targets. The KPIs corresponding to 2016
demonstrated an improvement compared to the values corresponding to 2015 (e.g. the average
time-to-grant in 2016 is 222 days compared to 261 days in 2015).
Table 8: Management performance indicators (2016)
Management performance
indicators 2016 CS2 IMI 2 FCH 2 BBI S2R SESAR ECSEL
Time-to-inform (target 153) 74.5 76 126 99 92 113 71
Time-to-grant (target 245 days) 218 232 222 233 184 240 224
Time-to-pay (final - 90 days) 69 62 71 n/a n/a 55 79
JUs carry out their operations in an
efficient manner
Programme management indicators
have improved
High levels of satisfaction with JUs'
services among stakeholders

34
Source – EC calculation based on Annual Activity Reports 2016; time-to-pay figures are mostly for FP7
projects, as there are only a limited number of interim-payments for Horizon 2020 projects
Similarly, the time-to-pay indicator was well within the target. There were no notable issues
in pre-financing, interim payments or in final payments. The BBI JU and S2R JU, having
been established recently, have not registered any interim or final payments yet, while for the
rest of the JUs the time-to-pay is within the 90-day target.
The systematic monitoring of the JUs' operational performance started in 2011. In 2014, the
basic performance indicators were redefined under Horizon 2020 rules and procedures and, in
addition, ambitious respective targets were also set. The absence of set targets under FP7
limits the possibility for a comparative assessment of the performance of the individual JUs
under FP7 and under Horizon 2020.
JUs project coordinators assessed the overall timelines of the key
processes positively
The JU project coordinators were asked in the survey to assess the overall timeliness of the processes
involved in the proposal application stage. The majority of the respondents (77%) expressed their positive
opinion about the duration of the time-to-inform. The time for grant preparation was assessed positively by
68% respondents. The opinions of coordinators were slightly less positive on the overall time-to-grant (58%).
6.3.1.2. Cost-efficiency of the programme management
The cost-efficiency indicator used in the evaluations of the individual JUs is defined by the
ratio between the administrative costs (e.g. infrastructure, staff salaries, external IT services
and others) and the operational budget managed by the JU.
Overall, the programme management cost ratio (administrative/ operational budget) remains
below or close to 5% and this points to rather lean and efficient organisational structures.
Table 9: Administrative efficiency
Administrative efficiency 2016 CS2 IMI 2 FCH 2 BBI S2R SESAR ECSEL
Programme management cost ratio
(administrative/ operational budget) 3.10% 4.34% 5.37% 4.95% 4.67% 6.97% 2.05%
Source: Annual Activity Reports 2016, calculation by the Commission based on payment appropriations
Average evaluation costs per proposal vary substantially among JUs. The reported 2016
figures range from EUR 902 to more than EUR 6 000. These significant variations from one
JU to another are due to differences in particular in the respective proposal evaluation
procedures, the most important being the two-stage proposal evaluations and the organisation
of hearings.
6.3.1.3. Budget execution
The JUs implement approximately 10% of the overall Horizon 2020 budget through EU
contributions ranging from EUR 450 million for the S2R JU to EUR 1 755 million for the
CS2 JU.

35
Table 10: Horizon 2020 contributions to each JU budget
CS2 IMI 2 FCH 2 BBI S2R SESAR ECSEL
Maximum EU contribution
(EUR million) 1755 1638 665 975 450 585 1185
% from Horizon 2020 budget 2.26% 2.21% 0.86% 1.26% 0.58% 0.76% 1.54%
Source – EC calculation based on the Council Regulations establishing JUs
Regarding operational budget execution, on average the JUs executed their respective budget
by 96% (commitments) and 80% (payments) over the 2014-2016 period. While this is not
considered an optimal performance, it can be explained, at least in part, by the phasing in and
adapting to the new Horizon 2020 rules and procedures, as well as the result to use newly
developed corporate IT tools.
Table 11: JU Operational budget execution 2014-2016
Budget execution in 2014
- 2016 CS2 IMI 2 FCH 2 BBI S2R SESAR ECSEL
% to Commitments 97% 93% 89% 93% 100% 98% 99%
% to Payments 84% 72% 83% 99% 87% 66% 72%
Source – EC calculation based on Annual Activity Reports 2016
6.3.2. Beneficiary satisfaction with the JU services
Overall, 94% of the project coordinators are very satisfied (33%) or satisfied (61%) with the
services provided by the JUs. It is interesting to note that the two most recently established
JUs, S2R and BBI, record the highest rate of project coordinators' satisfaction for services
provided, which is 56% and 50% respectively.
Figure 16: Overall satisfaction with the services provided by JUs
The project coordinators acknowledge that the JUs strive to provide excellent programme
management and high quality services and praise JU staff for knowledge and competence
(90%), commitment to providing quality service (89%), as well as courtesy and availability
(92%).

36
6.3.3. Simplification
A key feature of Horizon 2020 is that it has been constructed from the outset around a radical
simplification of previous rules and procedures to attract more top researchers and a broader
range of innovative enterprises. The simplification measures focus mainly on simplified
business processes and simpler rules for applicants and participants. JUs under Horizon 2020
benefit from a number of implementation features that will make them better fit for purpose.
Cutting red tape for businesses in Horizon 2020 includes:
Simplified administration through alignment with Horizon 2020 (uniform application
of Horizon 2020 Rules for Participation12
and funding rates).
Establishment of the Common Support Centre (CSC). The CSC assists the
Commission departments implementing Horizon 2020, as well as the JUs.
Lighter financial rules – based on Article 209 of Financial Regulation13
.
Fewer controls and audits, but without compromising the sound financial management
of EU funds.
Introduction of additional activities – commitment of industry in order to leverage
more investment in the form of in-kind contributions.
Figure 17: When you applied for funding from the JU, did you think that:
To a certain extent the improved operational efficiency can be attributed to the uniform
application of the Horizon 2020 Rules for Participation and the accompanying simplification
measures and to the corporate IT support tools that have grown to maturity since FP7. While
this is true for many of the JUs, the SESAR JU experts consider that enforcing the application
of the Horizon 2020 rules that were developed specifically for carrying out traditional R&I
activities, may not be the most appropriate approach for PPPs such as the SESAR JU, which
carries out activities beyond R&I14. They also express concern on the cumbersome reporting
12
Regulation (EU) No 1290/2013 of the European Parliament and of the Council of 11 December 2013 laying
down the rules for participation and dissemination in "Horizon 2020 - the Framework Programme for Research
and Innovation (2014-2020)" and repealing Regulation (EC) No 1906/2006 (OJ L 347, 20.12.2013, p. 81). 13 SESAR JU has financial rules based on Article 208 of the Financial Regulation. 14
It should however be noted that SESAR JU has followed, under Horizon 2020, a different approach in its basic
act (amendment of the SESAR JU regulation instead of re-establishment of the JU) and is not using the financial
rules based on Art. 209 of the Financial Regulation, specifically introduced in order to facilitate budget
implementation through PPPs, but those for Regulatory Agencies under Art. 208 of the Financial Regulation.
37
imposed to each JU member by the above-mentioned rules, which may lead in some cases to
double reporting requirements.
Others, like the experts of the CS2 JU and S2R JU mentioned the obligation imposed by the
Horizon 2020 Rules for Participation to use the common IT applications that, in their view are
not adapted to the specific JU reporting needs. On this issue, it should be emphasised that
despite a number of teething issues experienced immediately following the launch of
Horizon 2020, the corporate IT applications have evolved significantly since then and are now
delivering state-of-the-art support and responding to the specific requirements of a large
community of users on a constant basis.
Opinions from the stakeholders in the open public consultation varied when assessing the
administrative burden for preparing the proposal and application procedure. Overall, 45% of
the respondents consider that the application procedure is straightforward and simple. 42% of
the respondents expressed their agreement that the administrative burden for preparing the
proposal was within acceptable limits.
JUs project coordinators confirmed that JUs under Horizon 2020
present improvement compared to JUs under FP7
A majority of respondents to the JU project coordinators survey (58%) agrees that the second generation JUs
present an improvement compared to their predecessor under FP7. The responses refer to IMI2, CS2, FCH2
and ECSEL JUs.
6.4. Coherence
This section examines how well the JUs'
activities align with other instruments of
similar objectives and their relation to other
Union funding programmes. Based on the
specific evaluation findings, Figure 19 at the
end of this section presents an overview of the
coherence of JUs' activities with those of
Horizon 2020 and with the EU, national and
regional policies.
Being part of and supported by Horizon 2020, it is important that the JU specific objectives,
both long- and short-term, are synchronised and complementary to those of the framework
programme. Most expert groups acknowledge the efforts made by the Commission services
and the JUs to ensure coherence in the research priorities and avoid duplication in the funded
projects. They conclude that the JUs' activities are overall coherent and well-coordinated with
their respective parts of the framework programme.
For example, in the case of the ECSEL JU, the experts commend the efforts made by the
Commission services to promote the JU activities and ensure that Horizon 2020 calls
specifically require synergies with ECSEL activities.
Good synergy with relevant parts of
Horizon 2020
Closer cooperation and alignment of
research and innovation at national and
regional level
Risk of decreased national funding due to
the success of some JUs (SESAR)

38
The SESAR JU experts consider that coherence with Horizon 2020 is ensured through
synergies with the CS2 JU and also by working together with ACARE15
in defining
synchronised and complementary research priorities.
The IMI2 JU experts identified similar objectives with a number of Joint Programming
Initiatives, citing also views of stakeholders advocating for a better coordination with Horizon
2020 funded projects and for building on synergies.
Example Box: Coherence of the Joint Undertakings with Horizon 2020 – The experts' view on the BBI JU
The experts consider that the objectives of the JU are in line and complementary with other parts of Horizon
2020. They specifically cite:
The JU mainly finances projects with much higher Technology Readiness Level and market potential
compared to Horizon 2020 projects.
A working group between BBI JU and SPIRE (Sustainable Process Industry through Resource and Energy
Efficiency; a contractual Public-Private Partnership) under Horizon 2020 was established in June 2016
aiming at searching for synergies and collaborations between the two partnerships and at avoiding
redundancies in the work programmes and projects.
Around 72% of the consulted stakeholders consider the activities of the JUs to be very or
somewhat coherent with Horizon 2020 activities; only 3% think otherwise.
Figure 18: To what extent are the activities of the JU coherent with other activities of the
Horizon 2020 programme?
Regarding coherence with EU policies, while all experts agree that the JUs are effectively
supporting the goals of EU policies in the fields of energy, transport, environment,
competiveness and citizens' health and wellbeing, they consider that there is still room for
additional synergies and efforts to this end.
A notable exception is raised by the FCH2 JU experts, who underline the difficulties faced by
this JU to position itself and contribute meaningfully to the EU energy and transport policies,
due to the lack of clearly defined boundaries in the scopes of the two policies (in FCH
relevant contexts). They concede, however, that the issue is beyond the will or power of the
JU to rectify.
15
ACARE: Advisory Council for Aviation Research and innovation in Europe

39
Focusing on the synergies with large scale initiatives across Europe, like the ITEA and
EURIPIDES programmes under EUREKA, the ECSEL JU experts identified
complementarities, synergies and links, noting, however, the need for closer collaboration in
order to avoid potential overlaps.
Unlike their positive views on JUs' coherence with parts of Horizon 2020, the experts
consider that the alignment of the JUs' activities with the relevant policies at national and
regional level varies from one JU to another, reflecting the different Smart Specialisation
priorities and research and industrial capacities of the EU countries and regions.
Specifically, while the SESAR JU experts consider that there exist strong policy links at all
levels (global, EU, national and regional), the ECSEL JU experts call for synchronisation with
national activities. Similarly, the IMI2 JU experts detect "a lack of buy in" by Member States
leading to a limited alignment with national policies and strategies. In the case of the CS2 JU,
the experts conclude that the coordination of national programmes has not yet yielded visible
and explicit results and call for more action to this end.
Regarding SESAR, the experts point to an interesting observation: the emergence of SESAR
and its increasingly important role as an EU-wide authority and leader in Air Traffic
Management (ATM) technology has led to a gradual retreat by national programmes from
pure ATM research. Therefore, the success of the EU-level initiative has caused an important
scaling back of other funding sources in the EU.
Example Box: Coherence of the Joint Undertakings with national activities –
The experts' view on FCH2 JU
There is no obvious evidence that there are overall synergies or cooperation between FCH 2 JU and similar
international, national and intergovernmental programmes.
National programmes and interventions are in some countries formed through workshops and discussions with
relevant national stakeholders. By evaluating the specific needs at a national level, strategies and work plans are
not influenced by the priorities in FCH 2 JU.
Consequently, the coherence between national programs and FCH 2 JU can be weak. Thereby, projects are
funded through other channels such as national programmes and structural funds.
At regional level the experts report on the efforts of the FCH2 JU that signed 70 memoranda
of understanding with EU regions and municipalities and those of the CS2 JU that signed
memoranda of understanding with 13 EU regions with 8 pilot projects currently being under
preparation.
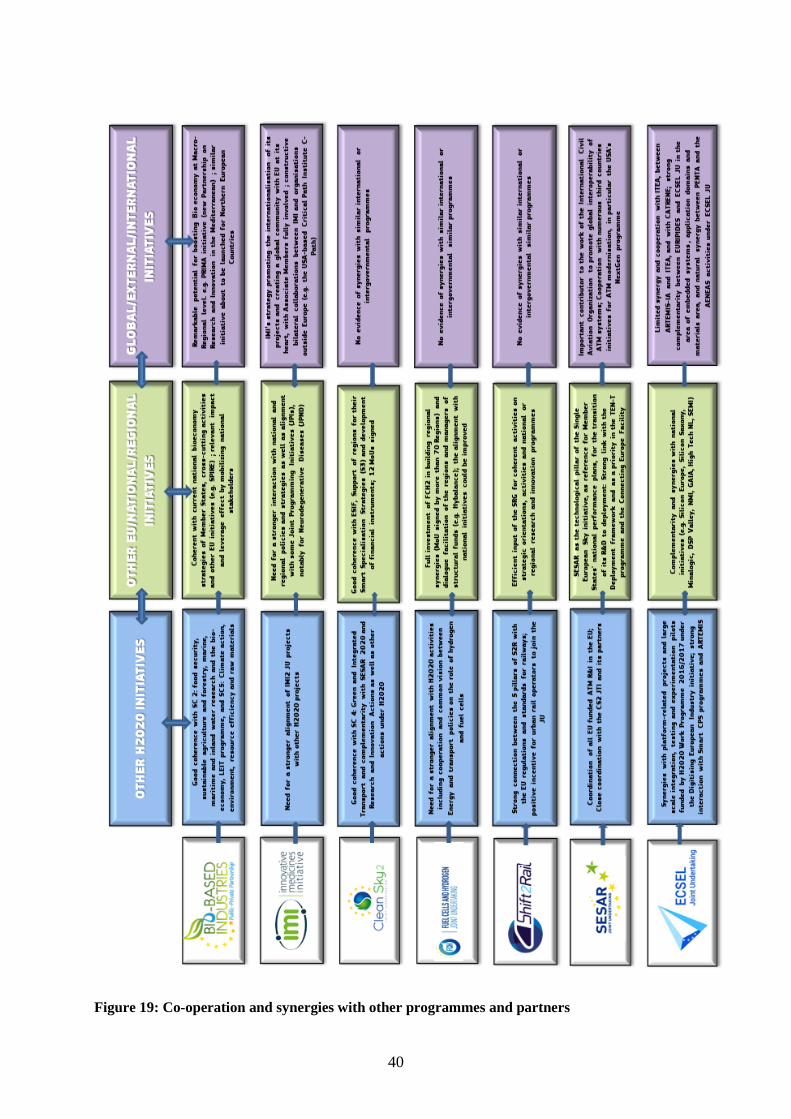
40
Figure 19: Co-operation and synergies with other programmes and partners
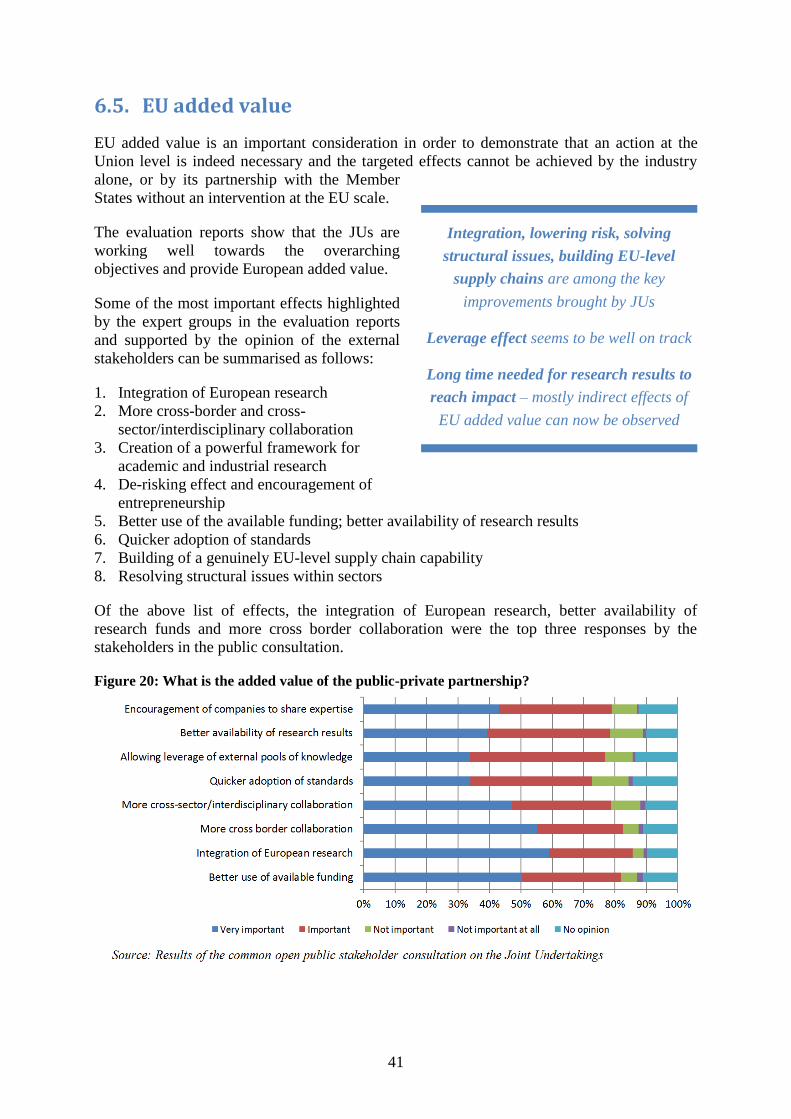
41
6.5. EU added value
EU added value is an important consideration in order to demonstrate that an action at the
Union level is indeed necessary and the targeted effects cannot be achieved by the industry
alone, or by its partnership with the Member
States without an intervention at the EU scale.
The evaluation reports show that the JUs are
working well towards the overarching
objectives and provide European added value.
Some of the most important effects highlighted
by the expert groups in the evaluation reports
and supported by the opinion of the external
stakeholders can be summarised as follows:
1. Integration of European research
2. More cross-border and cross-
sector/interdisciplinary collaboration
3. Creation of a powerful framework for
academic and industrial research
4. De-risking effect and encouragement of
entrepreneurship
5. Better use of the available funding; better availability of research results
6. Quicker adoption of standards
7. Building of a genuinely EU-level supply chain capability
8. Resolving structural issues within sectors
Of the above list of effects, the integration of European research, better availability of
research funds and more cross border collaboration were the top three responses by the
stakeholders in the public consultation.
Figure 20: What is the added value of the public-private partnership?
Integration, lowering risk, solving
structural issues, building EU-level
supply chains are among the key
improvements brought by JUs
Leverage effect seems to be well on track
Long time needed for research results to
reach impact – mostly indirect effects of
EU added value can now be observed
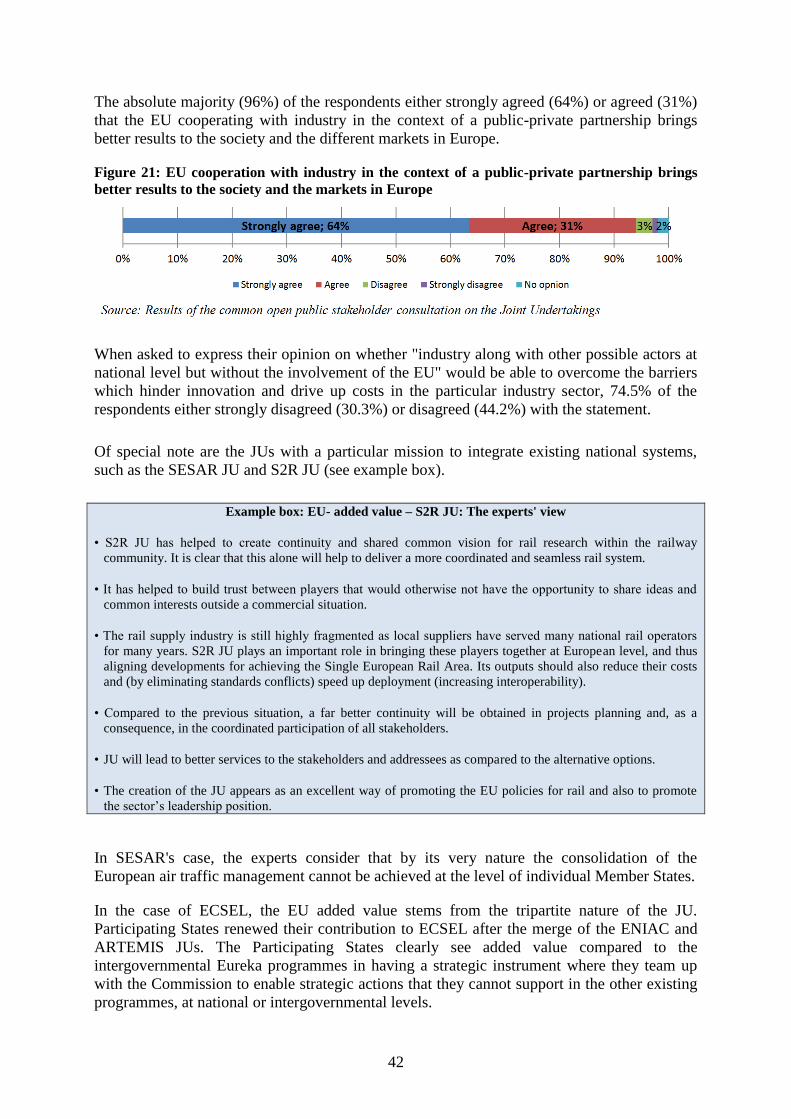
42
The absolute majority (96%) of the respondents either strongly agreed (64%) or agreed (31%)
that the EU cooperating with industry in the context of a public-private partnership brings
better results to the society and the different markets in Europe.
Figure 21: EU cooperation with industry in the context of a public-private partnership brings
better results to the society and the markets in Europe
When asked to express their opinion on whether "industry along with other possible actors at
national level but without the involvement of the EU" would be able to overcome the barriers
which hinder innovation and drive up costs in the particular industry sector, 74.5% of the
respondents either strongly disagreed (30.3%) or disagreed (44.2%) with the statement.
Of special note are the JUs with a particular mission to integrate existing national systems,
such as the SESAR JU and S2R JU (see example box).
Example box: EU- added value – S2R JU: The experts' view
• S2R JU has helped to create continuity and shared common vision for rail research within the railway
community. It is clear that this alone will help to deliver a more coordinated and seamless rail system.
• It has helped to build trust between players that would otherwise not have the opportunity to share ideas and
common interests outside a commercial situation.
• The rail supply industry is still highly fragmented as local suppliers have served many national rail operators
for many years. S2R JU plays an important role in bringing these players together at European level, and thus
aligning developments for achieving the Single European Rail Area. Its outputs should also reduce their costs
and (by eliminating standards conflicts) speed up deployment (increasing interoperability).
• Compared to the previous situation, a far better continuity will be obtained in projects planning and, as a
consequence, in the coordinated participation of all stakeholders.
• JU will lead to better services to the stakeholders and addressees as compared to the alternative options.
• The creation of the JU appears as an excellent way of promoting the EU policies for rail and also to promote
the sector’s leadership position.
In SESAR's case, the experts consider that by its very nature the consolidation of the
European air traffic management cannot be achieved at the level of individual Member States.
In the case of ECSEL, the EU added value stems from the tripartite nature of the JU.
Participating States renewed their contribution to ECSEL after the merge of the ENIAC and
ARTEMIS JUs. The Participating States clearly see added value compared to the
intergovernmental Eureka programmes in having a strategic instrument where they team up
with the Commission to enable strategic actions that they cannot support in the other existing
programmes, at national or intergovernmental levels.

43
A relevant recognition of IMI's worldwide reputation is offered by the IMI2 JU experts,
reporting that in a US House of Representatives issued white paper on the "21st Century
Cures initiative" (February 2015), it is acknowledged that what is missing in the USA is a
public-private partnership that would bring together the various stakeholders and would need
to be “modelled after the Innovative Medicines Initiative”.
As already mentioned above, it should be clear at this stage that mostly indirect effects may
be observed (e.g. establishing framework, building capacities, developing community,
lowering risk, etc.). Although some Horizon 2020 JUs report jobs created through their
actions, these are usually projections based on trends started by a few early Horizon 2020
projects. Similarly, project results for JUs' Horizon 2020 activities are limited, with most
supported projects still in early stages. Concrete numerical evidence is not yet available.
SESAR is an exception, as it is more advanced in connecting R&D with industrialisation and
deployment. Since 2014, there are EU rules making the deployment of essential SESAR
solutions mandatory for the Member States. The SESAR JU is at the heart of SESAR's ATM
modernisation lifecycle.
6.5.1. Leverage effect
A key objective and measure of the success of the JUs is their capacity to leverage private
funding, the minimum amount of which is explicitly mentioned in the respective JU
establishing Council regulations.
While it was generally agreed that the JUs under FP7 managed to leverage private funding
that matched or exceeded the EU funding, it became clear from the evaluation findings and
comments of experts that the private members reported in-kind contributions without clear
references to the methodologies used for such calculations.
Given the importance of the leverage effect in the justification of support for the JUs, existing
and future, the description of a methodology for the calculation of in-kind contributions,
commonly agreed by the private members of all JUs, has been drafted by the Commission
services and is now used by the JUs operating under Horizon 2020.
The calculation of the leverage effect takes into account on one side the operational
component (private in-kind and financial contributions to projects for each euro committed by
the European Commission) and on the other side the additional leverage (private contributions
to additional activities not directly linked to the portfolio of projects but contributing to the
overall JUs' objectives).
For the CS JU, IMI JU and FCH JU operating under FP7 the target for the leverage effect was
to achieve parity, i.e. that the contributions from the private side matched those from the EU.
All experts agreed that the FP7 JUs have met, even exceeded their respective targets.
The experts report that even in the cases of the ENIAC JU and ARTEMIS JU where no
specific targets were set, the two JUs clearly succeeded in increasing both private and public
investment in the respective sectors, reporting that EUR 630 million of EU funding under FP7
leveraged EUR 912 million of national contributions and EUR 2.46 billion of private funding.
Finally, the SESAR JU experts estimate a leverage of 1.8 counting in the contribution of
EUROCONTROL.

44
While the definite amount of leveraged funding will only be known at the end of the JUs'
operations, current Commission estimates point to private sector committed funding that
already equals or exceeds the set targets in four out of seven Joint Undertakings whereas for
the remaining three, the leverage funding is closing in (table 12). In reading table 12, it
should be noted that the presented leverage effects should not lead to a comparison between
JUs but, rather, to assess progress against the targets set by the respective Council regulations.
Evidently, the target leverage effects reflect the individual JU characteristics.
Table 12: Interim values of leverage effect compared to the overall Horizon 2020 targets
Joint Undertaking FCH2 CS2 IMI2 BBI ECSEL* S2R* SESAR*
The overall Horizon 2020 targets (EUR million) set in the Council Regulations over the whole period 2014-2020
Total minimum contribution
from members other than the
EU
380 2 193 1 638 2 730 1 657 470 825
EU contribution 570 1 755 1 638 975 1 184 450 585
Interim values for the calls concluded by December 2016 (EUR million)
Operational component (in kind
and in financial contributions by
members to projects)
279 131.58 263.5 115.37 1 089.02 79.3 241.4
Certified additional activities 186.4 199.16 n.a. 291.48 n.a. 0 n.a.
Committed EU contribution to
projects 286 214 275.88 228.69 459.98 88 235.8
Interim values of leverage effect for the calls concluded by December 2016
Target leverage effect over the
whole 2014-2020 period** 0.67 1.25 1.00 2.80
1.39 (on EU
funding only) 1.04 1.41
Interim values of leverage effect
(December 2016)*** 1.63 1.55 0.96 1.78 2.17 0.90 1.02
Source: EC calculation based on committed amounts presented in JU Annual Activity Reports 2016 and
complemented by CORDA data (with the exception of BBI JU which is solely based CORDA data). Costs in
additional activities in 2016 which are not yet certified have not been taken into account.
*Please note that ECSEL JU and SESAR JU receive additional contributions from the Participating States and
Eurocontrol respectively. Additional details can be consulted in the evaluation report.
For S2R only 70% of the EUR 450 milion of EU contribution is planned to contribute to the leverage effect (i.e.
(up to) 40% is reserved for the Founding Members and (up to) 30% going to the Associated Members). The
remaining 30% is equivalent to the main H2020 open call programme, although it is managed by the JU rather
than the Commission; see also Article 17, Annex I to the Council Regulation (EU) 642/2014 of 16 June 2014
establishing the S2R JU.
** The ratio is calculated as a total minimum contribution from members other than the EU set in the respective
Council Regulations over EU contribution
*** The ratio is calculated as the sum of operational component and certified additional activities over the
committed EU contribution to projects

45
Stakeholders opinion: the current minimum leverage targets are
realistic
When asked to assess if the current minimum leverage targets foreseen in the Council Regulations establishing Joint
Undertakings, 58.4% respondents to the open public consultation stated that the level is realistic, 10% think that it is too
low, while 12% believes that it is too high.
The opinions expressed in the open questions confirm that the current minimum leverage targets are feasible and come
across as fair and balanced. The leverage also depends on the specific area of research –for the projects closer to
commercialisation the value should be higher, while for basic research more public contribution is needed.
However, some of the industry respondents emphasised on the importance of the flexible framework for the valuation of
the in-kind contributions. For example, a narrow interpretation of Horizon 2020 rules led companies either to declare
contribution much lower than their actual costs or renounce to participate in projects where their costs would not be
considered eligible. The respondents consider that the real leverage effects are actually higher than the reported figures.
The BBI JU and IMI2 JU are the only currently operating JUs for which there is a specific
provision in the Council Regulation for financial contributions to the operational costs of the
JU by the private members. Owing to difficulties by the private members to contribute
financially to the operations of the BBI JU, the Commission deferred part of its contribution
towards the end of the programme. An amendment to the Council Regulation is under way to
facilitate private members' financial contributions to the BBI JU field of activities.
6.6. Openness
For the purpose of this evaluation, openness is understood as the extent to which the JUs
enable world-class research that helps Europe advance to a leadership position globally, and
how they engage with a wider constituency to open the research to the broader society.
The expert groups confirmed that overall the JUs have
an open access policy towards membership. As a
general rule, any legal entity that directly or indirectly
supports research and innovation in a Member State or
in an Associated Country can become a member.
However, depending on the level of the membership,
some eligibility conditions and entry or annual fees
apply.
It is also important to analyse the openness of JUs
towards new members and to new participants. While
except maybe for ECSEL JU the public side,
represented by the Commission, is fixed, the private side usually takes form of a consortium
of industry leaders, with its own membership requirements.
Membership policy
Most JUs apply a system where a request for membership can be submitted at any given time
and is evaluated on a case by case basis. Others organise competitive calls for membership on
a periodic basis. Members are asked to contribute financially and /or provide in-kind
contributions to the JUs in exchange of important benefits such as direct involvement in JU
governance, voice on the definition of the research agenda and call topics, etc.
Positive steps towards openness
JUs have an open access policy
towards membership
Uneven SME participation
46
In order to overcome some of the entry barriers and to demonstrate openness towards
newcomers and players like SMEs, universities and research organisations, some of the JUs
(CS2 JU, S2R JU) introduced different levels of membership (e.g. full members vs. associated
partners) corresponding to different levels of financial contributions.
In the case of S2R JU, smaller stakeholders have the possibility of participating in different
ways, as members (in this case a long-term commitment and financial contribution is
expected) or as beneficiaries participating in open calls.
Openness towards newcomers
According to call participation policy, JUs:
publish calls that are open to all, members and non-members (BBI JU, IMI2 JU, FCH2
JU, and ECSEL JU),
prescribe restricted research activities reserved to members only and, also, publish
calls on other research activities open to non-members (SESAR JU, S2R JU and CS2
JU). In addition, the SR2 JU organises calls that are reserved to non-members only,
reserve a minimum percentage of the EU contribution to open calls (CS2 JU and S2R
JU). The S2R JU experts consider that there is an argument for the open-calls for non-
members to form a larger proportion of the budget.
Example Box: JUs approach to newcomers – experts views
ECSEL JU: A key requirement for the JUs funded under Horizon 2020 is that they are open to all. In this
respect, ECSEL has made very good efforts to be open with all the calls made being open to all. Anyone can
participate in ECSEL projects and they do not need to be a member of ARTEMIS-IA, AENEAS or EPOSS
Industrial Associations.
BBI JU: The nature of BBI calls is fully open to the participation of any stakeholder. BBI JU has made great
efforts in communicating the BBI JU and its calls to the stakeholders in the EU through its events, meetings and
website.
IMI2 JU is open to newcomers through several modes. They can become Associated Partners with IMI2 JU,
they can join EFPIA (the private partner of IMI) as members or as partners in research, or they can participate as
beneficiaries in IMI2 JU funded projects. Participation of Associated Partners is still low considering the
objectives established in the IMI2 JU Regulation and will need to be scaled up in the remaining years of IMI2
JU.
S2R JU: There is, however, a certain danger for the JU to be considered as a "closed shop", partly due to
historical reasons that remain in people's minds. It is necessary to address this and for progress and trust to be
built, especially via the open processes for the selection of future innovation topics and new partners in view of a
possible S2R-2. Elsewhere in the report, referring to stakeholders' views on the "close shop", the experts mention
in a footnote that "It is difficult to estimate if this is a historical reaction or the present day reality as the experts
are aware of significant efforts made by the JU management to address this."
It should be noted that the efforts to foster openness and attractiveness of the JUs are already
showing results; 53% of the current beneficiaries in second generation JU funded projects are
newcomers i.e., they have not received funding from first generation JUs. The percentage of
newcomers in JU funded projects is slightly above the overall percentage of newcomers in
Horizon 2020 funded projects (52%).

47
Additionally, during the first three years of Horizon 2020 implementation JU funded projects
attracted participants from 44 countries - an increase from FP7 where 40 countries received
funding from JUs during the 2007-2013 period.
Example box: Openness – BBI JU: The experts' view
A total of 517 out of the 729 (71%) project beneficiaries are not members of the Bio-Based Industries
Consortium (BIC), the private member of BBI JU. This as a signal of the openness and attractiveness of the JU.
When analysing the type of participation of BIC members in funded projects, the percentage of associated BIC
members has increased significantly from 2014 to 2016. Specifically, it was observed that while the percentage
of full BIC members taking part in funded projects was slightly higher than that of the associated BIC members
in 2014 and 2015 calls, in 2016 calls the percentage of the associated BIC members rose to 64% of the total
number of BIC members. This is indicative of a significant and growing mobilisation of non-industrial BIC
members.
Openness to SMEs
The evaluation reports show that the SME participation rates vary among JUs and while there
are JUs with SME participation rates already exceeding the current global rates of Horizon
2020, others need to intensify their efforts to attract more SMEs to their activities. A more
detailed analysis on SME participation, on participation patterns of the other type of
organisations is presented in chapter 5 on Implementation and in section 6.2 on Effectiveness.
On average, the majority of the stakeholders (77%) in the public consultation considered that
the JUs encourage the participation of SMEs. However, the positive (or negative) responses
vary significantly among JUs. It is observed, for example, that the efforts of the BBI JU, FCH
2 and IMI2 JU to encourage the participation of SMEs are acknowledged by most (82%) of
the stakeholders, whereas those of the SESAR JU and the ECSEL JU are acknowledged
respectively by 55% and 67% of the stakeholders.
Figure 22: Do you consider that the JU encourages the participation of SMEs?

48
6.7. Transparency
In this evaluation, transparency analyses the extent to which the JUs keep a transparent
attitude towards the wide community of stakeholders
and provide them with easy and effective access to
information.
The expert groups observe an improvement over FP7
in the way in which JUs communicate and interact
with the community of stakeholders, although some
areas still need attention. Under FP7, when the JUs
were still struggling to establish their organisation
structures, define business processes and launch
operations, they had to invest additional effort into
setting up their communication toolset and developing
best practices.
Communication
While the Horizon 2020 communication strategy is defined centrally by the Commission, the
implementation of the strategy, as well as any additional support communication activities are
carried out by the JUs themselves.
The procedures established by the JUs on the provision of information to external
stakeholders are a crucial aspect of the transparency of the JUs. In this respect, the evaluation
reports confirmed that the JUs have implemented a range of mechanisms in order to ensure an
open and non-discriminatory attitude towards the wider stakeholder community, including the
general public. This included various communication tools like an up-to-date, informative
website, the use of social media, organisation of and/or participation in events, seminars and
conferences and publications in the specialized and general press.
Overall, the respondents were satisfied with the information provided in the JU websites. The
websites provide easy and effective access to information by the public (76% of the
respondents strongly agreed or agreed with this statement). However, the respondents were
slightly less positive (70%) when assessing JU websites in terms of providing effective access
to information and sufficient guidance to interested organisations to facilitate their
participation in proposals (70%).
Figure 23: Assessment of the information provided in the JU website
Improved communication and
interaction with stakeholders activities
Easy access and clear information
provided in the JU websites
Need to improve dissemination of
project results
49
Despite the overall positive views on JUs' communication efforts, however, the chair of the
transport-related expert groups (CS2 JU, S2R JU and SESAR JU) considers that social media
are not used consistently across JUs, while the IMI2 JU experts highlight the need for more
efforts towards improving the monitoring and impact of communication activities. Finally, the
FCH2 JU group of experts calls for more efforts in order to raise public awareness on FCH
technologies.
Dissemination
In order to communicate on and disseminate project results to a community as large as
possible, the JUs use a variety of tools, very similar to the above mentioned communication
tools:
A dedicated section on the JU's website for dissemination of project results and
publishable project summaries (SESAR, BBI, CS2, ECSEL JUs). FCH2 JU, for example,
has a fully searchable project database, accessible to all.
Scientific publications and articles related to project results.
Publication of a book summarising important project results (ECSEL, CS2, FCH2 JUs
annual programme review report, SESAR JU releases, solutions catalogue and solution
packages).
Social Media such as Twitter, Facebook or YouTube to communicate and demonstrate
project results.
Organisation of and participation in events aiming at the distribution of project results
(conferences, project demonstrations).
Despite the above-mentioned dissemination tools, many experts report that while project
results originating from JU-funded projects are communicated effectively to stakeholders that
are directly involved in the JUs, this is not the case for the external stakeholders and the
general public. In this respect, the chair of the transport-related expert groups in a discussion
paper reports the absence of clear dissemination strategies implemented by the JUs. A
notable exception to this relatively poor performance of these JUs is the SESAR JU. In its
initial days, the JU was only communicating to professionals within the relevant industries.
Under Horizon 2020, this approach has changed: SESAR offers factsheets and makes
available through its website the SESAR Solutions catalogue and the data packs for almost all
solutions. The experts opinions are supported by the stakeholders' views on the access to
knowledge generated by JU funded projects (around 60% positive assessment).

50
7. CONCLUSIONS
During the period from October 2016 to June 2017, a total of 39 independent experts working
in seven groups evaluated the progress realised until the end of 2016 by the seven Joint
Undertakings (JUs) operating under Horizon 2020.
Their findings and conclusions, specific to each JU, are presented as part of the respective
evaluation reports. The present chapter presents the Commission services' view on the
performance of the seven JUs operating under Horizon 2020 based on their own experience,
the findings of the seven expert groups, the outcomes of the public consultation of
stakeholders and the survey of project coordinators.
The overarching conclusion is that the JU-based public-private partnerships (PPPs), while
still early for most of them to demonstrate tangible project outputs leading towards stated
objectives and expected achievements, have demonstrated efficiency improvements in
comparison to FP7. They have effectively managed to engage the major actors in research and
innovation in the respective industrial sectors and have shown their potential as important
drivers for strengthening Europe's competitiveness and helping to respond to major socio-
economic challenges.
The Commission services' view is that the JUs are on track to deliver against their set
objectives, despite a number of identified shortcomings that need to be addressed by the JUs,
industries and the Commission services in order to improve their functioning, ensure delivery
of solid output and objectively assess impact.
The industrial sectors addressed by the JUs are not only of high economic relevance for
Europe but, also, areas where well-identified market risks require a long-term concerted
research and innovation effort. Depending on the needs of the specific sector, JUs are
fostering synergies by linking activities across the innovation cycle, from research outcomes
to closer to market activities and facilitating the creation of an internal market for innovative
technologies, products and services.
This view is shared by more than 95% of the consulted stakeholders who consider that EU
cooperation with industry in the context of a JU-based public-private partnership brings better
results to the society and markets in Europe. Moreover, 85% of the stakeholders consider that
the JUs contribute to economic growth and job creation in Europe.
It is also the position16
of the European industry associations and the European Association of
Research and Technology organisations (EARTO) stating that the public-private partnerships
are '… unique platforms, which foster cooperation between public and private actors by
pooling their diverse capabilities and creating the critical mass for innovative breakthrough.
They also leverage the necessary funds for large-scale European projects. Understanding the
channels to market as well as the challenges to upscaling, industry bridge gaps and
accelerate the generation of impact and results from R&I programmes."
16
"An Ambitious FP9 Strengthening Europe’s Industrial Leadership – Joint Declaration by Industry and RTOs",
7 June 2017
51
Strengths
The continued relevance of the seven Joint Undertakings in contributing directly to
competiveness and EU policy goals is confirmed by all expert groups and the consultation of
stakeholders.
All JUs are addressing strategic technologies in sectors that are already or rapidly emerging as
cornerstones of a knowledge-based European economy and are linked to the objectives of the
Europe 2020 strategy and Horizon 2020.
Overall, it is confirmed that the socio-economic conditions that justified the establishment of
such public-private partnerships in 2013 are still present and valid.
This is also the opinion of 78% of the respondents to the stakeholders' consultation who
consider that the JU-specific strategic policy documents continue to be optimal in defining the
scope of research and innovation.
Naturally, the scope varies among JUs depending on the specific characteristics of the
relevant industrial sectors. For example, while it is relevant for the FCH2 JU to address the
price and performance barriers that need to be overcome for the technology to be
commercially viable, it is also relevant for the BBI JU to aim for a holistic and sustainable
value chain approach, lower the risk for industrial investment and focus more on
demonstration and deployment.
For the transport-related JUs (S2R, CS2 and SESAR), it is clear that they all show significant
links with, and contribute towards achieving EU strategic goals and/or initiatives such as
those detailed in the Transport White Paper.
Similarly, the IMI2 JU experts agree on the relevance of the Strategic Research Agenda and
the launched calls for proposals.
Finally, ECSEL is one of the important pillars of the strategy on electronics and the main
implementation of research and innovation in the area of electronic components and systems.
It allows for a long-term stable environment for the fostering of advanced technologies in this
area in support of the digitisation of the European economy.
The Joint Undertakings effectively managed to engage the major actors in research and
innovation in the industrial sectors concerned.
One of the main achievements since the establishment of the JUs, on which there is general
consensus among the expert groups, is that the JUs managed to structure and mobilise an
otherwise fragmented landscape of different sectors and industries and convince competing
or different, seemingly unrelated stakeholders to work together within a single project.
For the IMI2 JU, the expert group acknowledges that the JU led to a new type of consortia
where competing pharmaceutical industries work together to achieve a common goal and,
equally important, these consortia induced a change in the respective perceptions of scientists
from academia and industry. The experts conclude that the IMI2 JU is a unique collaboration
model, creating long-lasting collaborative networks.
52
The CS2 JU, building on the success of the first generation JU under FP7, fosters further
coordinated cooperation among world-class aeronautical companies and major industry
leaders in the supply chain to pursue common objectives.
The ECSEL JU and SESAR JU bring together not only academia and industry but, also, the
Member States. In the case of the SESAR JU, the Member States are participating through
the EUROCONTROL. In the case of the ECSEL JU - a public-private partnership with a
unique tri-partite model that brings together on equal footing the participating states, three
industrial associations and the EU - the experts acknowledge that it succeeded in mobilising a
high level of investments, which would not have been available otherwise. They cite as a
particular challenge the considerable efforts required by all actors to integrate the activities of
the three communities of stakeholders in the areas of embedded systems, nanoelectronics and
smartsystems into one single domain, the ECSEL JU, and note that there is still a need for
additional actions to this end.
Leveraged private funding, measured in a harmonised manner across all Joint Undertakings,
is well on track against set targets
A key objective, which is also a measure of the success of a JU, is the capacity to leverage
private funding, the minimum amount of which is explicitly mentioned in the respective JU
Council regulation.
A long standing criticism carried over from the evaluation of the first generation of JUs was
directed at private members reporting in-kind contributions without clear references to the
methodologies used for such calculations. In response to this criticism and in the light of the
revised, more ambitious targets set for the in-kind contributions by the private members in the
second generation JUs, the Commission together with the JUs defined, a year ago, commonly
agreed and transparent principles for the calculation of such contributions.
While the definite amount of leveraged funding will only be known at the end of the JU
operations, current Commission estimations point to private sector funding that already equals
or exceeds the set targets in four out of the seven JUs, whereas for the remaining three it is
closing in to the target.
In this context, it should be noted that the BBI JU and IMI2 JU are the only JUs for which
there is a specific provision in the Council Regulation for financial contribution to the
operational costs of the JU by the private members. An amendment to the Council Regulation
is currently under way to facilitate private members' financial contributions to the BBI JU
field of activities.
Positive steps towards openness
It is generally accepted that, in comparison to the first generation, the second generation JUs
have developed more open and straightforward policies regarding membership of private
entities which are described clearly, along with eligibility criteria, in the respective Council
regulations. Members are required to contribute financially and/or in kind to the JUs in
exchange of important benefits such as direct involvement in JU governance and a voice in
the definition of research agenda and call topics, etc.
For the FCH JU calls under FP7, each consortium was required to include at least one
member of either the industry group or the research group in order to ensure alignment with

53
the JU strategic objectives. Under Horizon 2020, this rule has been abandoned, and currently
is used only exceptionally, for duly justified reasons. This approach has significantly
increased the participation of non-members; under FP7, 48% of the funding was attributed to
non-member entities, whereas (for the three first calls under Horizon 2020) this percentage
had grown to 54%; in these three calls the members represented only 37% of the beneficiaries
and 24% of the participants in signed grants were newcomers.
The BBI JU experts also commend the openness and attractiveness of the JU by reporting that
71% of the beneficiaries in JU funded projects are not members of the Bio-Based Industries
Consortium (BIC), the private member of the BBI JU. Also interesting to note is that the
percentage of associated BIC members in JU funded projects has increased significantly over
time from 2014 to 2016. In 2016 calls, the percentage of associated BIC-members in JU
funded projects rose to 64% of the total BIC members. This is indicative of a significant and
growing mobilisation of non-industrial BIC members.
Conscious of the financial burden that SMEs, universities and research organisations may face
in becoming members and keen to demonstrate openness, some JUs have introduced a
number of special facilitating provisions such as offering different levels of membership (CS2
JU, S2R JU). They also organise calls which are reserved to non-members only (S2R JU).
Others CS2 JU and S2R JU reserve a minimum percentage of the EU contribution for open
calls. These efforts are already showing results; 53% of the current beneficiaries are
newcomers i.e., they have not received funding from first generation JUs.
Joint Undertakings carry out their operations in an efficient manner
The Commission shares the positive views of all expert groups that the operational efficiency
of the second generation JUs has improved in comparison to the first generation. This
improvement can be partly attributed to the uniform application of the Horizon 2020 Rules for
Participation and to the gradual development of simplified business processes despite a
number of concerns expressed mainly by the SESAR JU experts who question the one-size-
fits-all approach considering the inherent specificities of the JUs. Regarding the IT support
applications, the need to address the specific needs of JUs is still present despite their ever
evolving development and delivery of excellent support to a large community of users.
Overall, it is concluded that public funds have been managed through transparent processes
and competitive calls, even though complaints are voiced with regard to the process of
defining call topics in some JUs and the share of the budget reserved for open calls in others.
An added complication that impacts efficiency is reported by the ECSEL JU experts on the
need for projects to report both to the JUs and the funding national authorities.
Basic performance indicators – such as time-to-grant, time-to-inform and time-to-pay – are all
observed to be within the set targets. As an example of operational efficiency and flexibility,
the experts commended the IMI2 JU for its rapid and efficient reaction to the threat resulting
from the Ebola outbreak in Africa at the end of 2014.
The majority of the surveyed project coordinators (58%) consider that the efficiency of the
second generation JUs has improved in comparison to the first generation. All JUs score
above 90% in terms of stakeholder satisfaction on their services. More than 94% of the
coordinators acknowledge that the JUs strive to provide excellent programme management
and high quality services and praise JU staff for its knowledge and competence (90%),
commitment to providing quality service (89%) as well as courtesy and availability (92%).
54
The objectives and activities of the Joint Undertakings are coherent with the corresponding
Horizon 2020 activities
Being part of and supported by Horizon 2020, it is important to find that the JU specific
objectives, both long- and short-term, are synchronised and complementary to those of the
framework programme.
Almost 72% of the surveyed stakeholders consider the activities of the JUs to be coherent
with Horizon 2020 activities; only 3% think otherwise.
Most expert groups acknowledge the conscious efforts made by the Commission services and
the JUs in ensuring coherence in research priorities and funded projects.
For example, in the case of the ECSEL JU, the experts commend the Commission services for
being a strong promoter of the JU activities and ensuring that Horizon 2020 calls specifically
require synergies with the JU activities.
In the case of the BBI JU, the experts find that the objectives of the JU are in line, but also
complementary with other parts of Horizon 2020. They specifically note that the JU mainly
finances projects with much higher technology readiness level and market potential compared
to Horizon 2020 projects. They also make reference to a joint working group established by
the BBI JU and SPIRE17
, aiming to search for synergies and collaborations between the two
partnerships and to avoid redundancies in the work plans and funded projects.
The SESAR JU experts report that coherence with Horizon 2020 is ensured through synergies
with the CS2 JU and also, by working together with ACARE (Advisory Council for Aviation
Research and innovation in Europe) in defining synchronised and complementary research
priorities. The technical solutions developed by SESAR JU play a key role in the development
of global standards for air traffic management prepared by the International Civil Aviation
Organisation (ICAO).
The IMI2 JU experts cite views of stakeholders advocating better coordination with Horizon
2020 funded projects and building on synergies and identify potential overlaps with some
Joint Programming Initiatives.
Challenges
Despite the general acceptance that the JUs operating under Horizon 2020 are on track to
achieve their objectives, the seven groups of experts identified a number of issues that need to
be addressed in order to reap the maximum of their potential and impact. Owing to the
specific nature of the JUs, very few of these issues are common to all; some apply to a group
of JUs whereas many just point to a problem within one or two JUs.
The following is a list of challenges that, according to the Commission services, are
considered to be important to the objectives and expected socio-economic impacts of the JUs
and therefore need to be carefully considered. It is emphasised that this list is by no means
17 SPIRE: Sustainable Process Industry through Resource and Energy Efficiency; a contractual Public-Private
Partnership under Horizon 2020
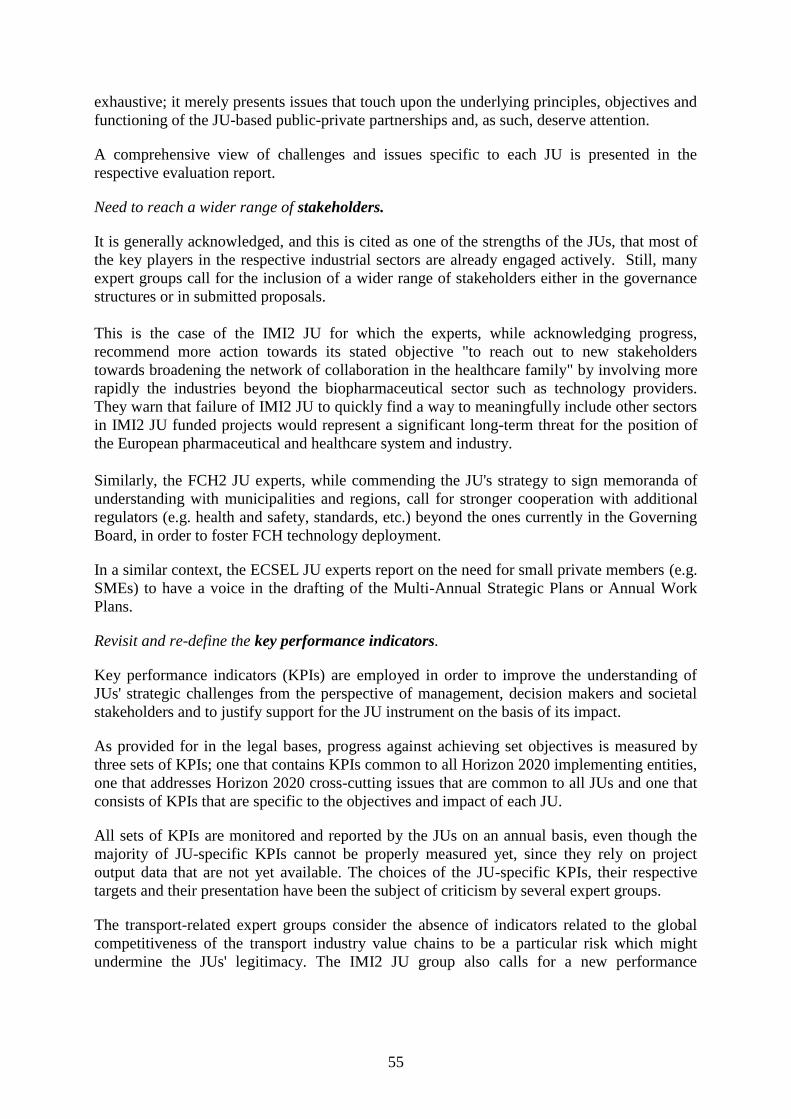
55
exhaustive; it merely presents issues that touch upon the underlying principles, objectives and
functioning of the JU-based public-private partnerships and, as such, deserve attention.
A comprehensive view of challenges and issues specific to each JU is presented in the
respective evaluation report.
Need to reach a wider range of stakeholders.
It is generally acknowledged, and this is cited as one of the strengths of the JUs, that most of
the key players in the respective industrial sectors are already engaged actively. Still, many
expert groups call for the inclusion of a wider range of stakeholders either in the governance
structures or in submitted proposals.
This is the case of the IMI2 JU for which the experts, while acknowledging progress,
recommend more action towards its stated objective "to reach out to new stakeholders
towards broadening the network of collaboration in the healthcare family" by involving more
rapidly the industries beyond the biopharmaceutical sector such as technology providers.
They warn that failure of IMI2 JU to quickly find a way to meaningfully include other sectors
in IMI2 JU funded projects would represent a significant long-term threat for the position of
the European pharmaceutical and healthcare system and industry.
Similarly, the FCH2 JU experts, while commending the JU's strategy to sign memoranda of
understanding with municipalities and regions, call for stronger cooperation with additional
regulators (e.g. health and safety, standards, etc.) beyond the ones currently in the Governing
Board, in order to foster FCH technology deployment.
In a similar context, the ECSEL JU experts report on the need for small private members (e.g.
SMEs) to have a voice in the drafting of the Multi-Annual Strategic Plans or Annual Work
Plans.
Revisit and re-define the key performance indicators.
Key performance indicators (KPIs) are employed in order to improve the understanding of
JUs' strategic challenges from the perspective of management, decision makers and societal
stakeholders and to justify support for the JU instrument on the basis of its impact.
As provided for in the legal bases, progress against achieving set objectives is measured by
three sets of KPIs; one that contains KPIs common to all Horizon 2020 implementing entities,
one that addresses Horizon 2020 cross-cutting issues that are common to all JUs and one that
consists of KPIs that are specific to the objectives and impact of each JU.
All sets of KPIs are monitored and reported by the JUs on an annual basis, even though the
majority of JU-specific KPIs cannot be properly measured yet, since they rely on project
output data that are not yet available. The choices of the JU-specific KPIs, their respective
targets and their presentation have been the subject of criticism by several expert groups.
The transport-related expert groups consider the absence of indicators related to the global
competitiveness of the transport industry value chains to be a particular risk which might
undermine the JUs' legitimacy. The IMI2 JU group also calls for a new performance

56
measurement framework to replace the existing KPIs with SMART18
ones together with the
corresponding baseline metrics. The ECSEL JU group calls for the definition of appropriate
metrics and compulsory follow up, once projects are finalised, to assess the impact of projects
and thus justify EU funding.
While not questioning the choice of KPIs, the FCH2 JU expert group calls for revisiting the
set targets, since some were considered to be not sufficiently ambitious and others over-
ambitious.
Finally, in the case of the BBI JU, while the available JU-specific KPIs were found to be on
track, the experts call for further monitoring activity and analysis making a clear distinction
between the actually achieved KPIs at the end of each year and the projected KPIs.
Need for stronger interaction between Governing Boards and advisory bodies (States'
Representatives Groups and Scientific Committees).
Despite the well thought out governance structure of the JUs designed to ensure transparency
and inclusiveness of the widest possible community of stakeholders, a number of expert
groups express concern on the role of the advisory groups and their impact on Governing
Boards' strategic research decisions.
For example, the S2R JU group notes that the Scientific Committee and the States'
Representatives Group have little involvement, apart from a formal consultation process, in
the preparation of the multi-annual action plan. They suggest enlarging the composition of
the Scientific Committee with scientists other than railway engineers, such as economists,
sociologists and geographers.
The FCH2 JU expert group points out that it is not clear how the advice and feedback of the
advisory bodies is taken into account and reflected in the JU's strategic documents. The group
calls for improved coordination between Member States starting with upgrading the States'
Representatives Group with members of sufficient seniority and power to reach agreements
on improving consistency with national programmes.
Finally, the IMI2 JU experts suggest improvements that could lead to a more efficient and
effective communication between the different bodies. In particular, they call for a stronger
interaction with the States' Representatives Group in order to ensure better alignment between
national and regional developments and priorities. Also, they call for better feedback from the
Governing Board on the relevance and impact of contributions from the Scientific Committee,
similar to the efficient communication established between the Governing Board and the
seven Strategic Governing Groups.
18
Specific, Measurable, Achievable, Relevant, Time-bound

57
Need for closer cooperation and alignment of research and innovation priorities at national
and regional level, in particular with Smart Specialisation priorities
Regarding EU policies, while all experts agree that the JUs are supporting EU policies in the
fields of energy, transport, environment, competiveness and citizens' health and wellbeing,
they also consider that there is still room for additional synergies.
For example, the FCH2 JU experts point to the difficulties faced by this JU to position itself
and contribute meaningfully to the EU energy and transport policies, due to not clearly
defined boundaries in the scopes of the two policies (in FCH relevant contexts). They
concede, however, that the issue is beyond the will or power of the JU to rectify.
Focusing on the synergies with large scale initiatives across Europe, like the ITEA and
EURIPIDES programmes under EUREKA, the ECSEL JU experts identify
complementarities, synergies and links, while highlighting at the same time the need for even
closer collaboration in order to avoid potential overlaps.
Unlike their positive views on JUs' coherence with parts of Horizon 2020, the experts
consider that the alignment of the JUs' activities with the relevant policies at national and
regional level varies from one JU to another, reflecting the different Smart Specialisation
priorities and research and industrial capacities of the EU countries and regions.
Specifically, while the SESAR JU experts consider that there exist strong policy links at all
levels (global, EU, national and regional), the ECSEL JU experts call for synchronisation with
national activities. Similarly, the IMI2 JU experts detect "a lack of buy in" by Member States
leading to a limited alignment with national policies and strategies. In the case of CS2 JU, the
experts conclude that the coordination of national programmes has not yet yielded visible and
explicit results and call for more action to this end.
Notable exceptions, at regional level, are the efforts of the FCH2 JU that signed 70
memoranda of understanding with EU regions and municipalities and those of the CS2 JU
that signed memoranda of understanding with 13 EU regions with 8 pilot projects currently
being underway.
Regarding SESAR, the experts point to an interesting observation; the emergence of SESAR
and its increasingly important role as an EU-wide authority and leader in Air Traffic
Management (ATM) technology has led to a gradual retreat by national programmes from
pure ATM research. Thus the success of the EU-level initiative has caused an important
scaling back of other funding sources in the EU.
Uneven SME participation rates; overall lower than those in Pillars II (LEIT19
) and III
(Societal Challenges)
Overall, the SME rates in signed JU grants amount to 22% in terms of participations and 18%
in terms of share of EU funding. Even though they represent a significant improvement in
comparison to FP7 (20% and 16% respectively), these overall rates are lower than the
corresponding rates in Pillars II (the LEIT part) and III (Societal Challenges) of Horizon
2020; 27% and 24% respectively.
19
Leadership in Industrial Technologies
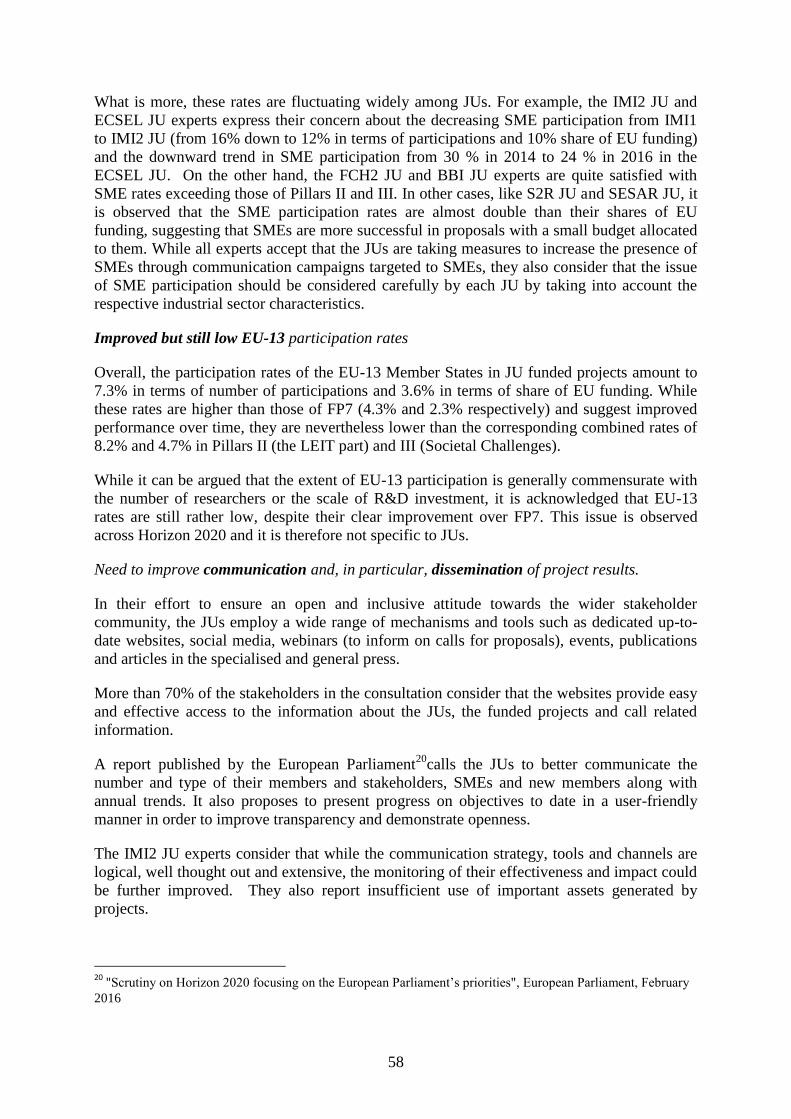
58
What is more, these rates are fluctuating widely among JUs. For example, the IMI2 JU and
ECSEL JU experts express their concern about the decreasing SME participation from IMI1
to IMI2 JU (from 16% down to 12% in terms of participations and 10% share of EU funding)
and the downward trend in SME participation from 30 % in 2014 to 24 % in 2016 in the
ECSEL JU. On the other hand, the FCH2 JU and BBI JU experts are quite satisfied with
SME rates exceeding those of Pillars II and III. In other cases, like S2R JU and SESAR JU, it
is observed that the SME participation rates are almost double than their shares of EU
funding, suggesting that SMEs are more successful in proposals with a small budget allocated
to them. While all experts accept that the JUs are taking measures to increase the presence of
SMEs through communication campaigns targeted to SMEs, they also consider that the issue
of SME participation should be considered carefully by each JU by taking into account the
respective industrial sector characteristics.
Improved but still low EU-13 participation rates
Overall, the participation rates of the EU-13 Member States in JU funded projects amount to
7.3% in terms of number of participations and 3.6% in terms of share of EU funding. While
these rates are higher than those of FP7 (4.3% and 2.3% respectively) and suggest improved
performance over time, they are nevertheless lower than the corresponding combined rates of
8.2% and 4.7% in Pillars II (the LEIT part) and III (Societal Challenges).
While it can be argued that the extent of EU-13 participation is generally commensurate with
the number of researchers or the scale of R&D investment, it is acknowledged that EU-13
rates are still rather low, despite their clear improvement over FP7. This issue is observed
across Horizon 2020 and it is therefore not specific to JUs.
Need to improve communication and, in particular, dissemination of project results.
In their effort to ensure an open and inclusive attitude towards the wider stakeholder
community, the JUs employ a wide range of mechanisms and tools such as dedicated up-to-
date websites, social media, webinars (to inform on calls for proposals), events, publications
and articles in the specialised and general press.
More than 70% of the stakeholders in the consultation consider that the websites provide easy
and effective access to the information about the JUs, the funded projects and call related
information.
A report published by the European Parliament20
calls the JUs to better communicate the
number and type of their members and stakeholders, SMEs and new members along with
annual trends. It also proposes to present progress on objectives to date in a user-friendly
manner in order to improve transparency and demonstrate openness.
The IMI2 JU experts consider that while the communication strategy, tools and channels are
logical, well thought out and extensive, the monitoring of their effectiveness and impact could
be further improved. They also report insufficient use of important assets generated by
projects.
20
"Scrutiny on Horizon 2020 focusing on the European Parliament’s priorities", European Parliament, February
2016

59
Along the same lines, the FCH2 JU group welcomes the possibility to download from the
webpage most of the public deliverables of the projects (also the case with the SESAR JU),
but calls for more communication activities to be focused on the general public to increase
FCH technologies awareness.
Concerning dissemination, the satisfaction of stakeholders drops to 60% with regard to access
to knowledge generated by funded projects. The experts also point to poor or insufficient
dissemination of project results to stakeholders other than those involved directly in the JUs.
In this context, it is recalled that the Commission has recently developed a "Strategy for the
Dissemination and Exploitation of Horizon 2020 Research Results" that aims at creating the
necessary conditions and establishing the means to put research results into economic and
societal use and make available scientific evidence in support of policy making. The actions
set out by this strategy apply to all actors involved in Horizon 2020 activities, including the
JUs.
As most of the JU research projects started within the past two years and, therefore, it is still
early for project outputs to be delivered, the Commission services are currently working
together with the JUs in order to set up a transparent dissemination system taking into account
the provisions of the above-mentioned strategy, the specific characteristics of the JUs and the
sensitivities of the involved industrial actors.

60
Annex A. Procedural information
Lead DG: Directorate General Research and Innovation (RTD)
Agenda Planning number: 2015/RTD/009 final and interim evaluation of Joint
Undertakings.
The requirement for the Interim evaluation of the Joint Undertakings under Horizon 2020
derives from Article 11 of the Council Regulation establishing each Joint Undertaking21
. This
stipulates that "by 30 June 2017 the Commission shall carry out, with the assistance of
independent experts, an interim evaluation of the Joint Undertaking. The Commission shall
prepare a report on that evaluation which includes conclusions of the evaluation and
observations by the Commission. The Commission shall send that report to the European
Parliament and to the Council by 31 December 2017." Where applicable, each expert group
was also required to carry out the final evaluation of the corresponding JU established under
the seventh framework programme. Finally, the results of the interim evaluation of the Joint
Undertakings would be taken into account in the in-depth assessment as part of the interim
evaluation referred to in Article 32 of Regulation (EU) No 1291/2013 establishing Horizon
2020. The evaluation roadmap of this overall Horizon 2020 interim evaluation, published in
May 201622
, presents the required information on the final and interim evaluation of JUs.
The evaluations were carried out by seven independent expert groups, with the "New
management modes" Unit in DG RTD coordinating this process. To guarantee coherence
between the seven evaluations and ensure that all legal requirements as well as the
recommendations from previous evaluations were properly addressed, common terms of
reference have been drafted by the "New management modes" Unit in DG RTD in close
consultation with the responsible thematic directorates and horizontal Commission services
(e.g. Secretariat-General).
As already mentioned, for each JU interim evaluation, the Commission is required to prepare
a report presenting the conclusions along with its observations, which has to be
communicated to the European Parliament and the Council by 31 December 2017. For
reasons of efficiency and clarity, it was agreed by the relevant Directors-General that only one
comprehensive report in a form of a Staff Working Document would be prepared, presenting
the conclusions of the evaluation of each of the seven JUs.
The Staff Working Document is based on a wide range of sources comprising the expert
group evaluation reports, results from the common open public consultation and the seven
surveys of JU project coordinators as well as the internal assessment and observations of the
European Commission.
An inter-service group (ISG)23
to overlook and follow the final and interim evaluation of all
the Joint Undertakings was set up early in 2016 and held four meetings until the Staff
Working Document was finished in July 2017 (on 24 February 2016, 31 May 2016, 27 April
21
In the case of SESAR, the requirement for the interim evaluation derives from Article 7, Council Regulation
(EU) No 721/2014 amending Regulation (EC) No 219/2007 on the establishment of a Joint Undertaking to
develop the new generation European air traffic management system (SESAR) as regards the extension of the
Joint Undertaking until 2024. 22
See: http://ec.europa.eu/smart-regulation/roadmaps/docs/2015_rtd_005_evaluation_ie_horizon_2020_en.pdf 23
The ISG for the JU interim evaluation consisted of representatives from the following Directorates-General:
BUDG, HR, CNECT, MOVE, RTD, and SG.

61
2017 and 27 June 2017). In addition, to facilitate the evaluation process a large number of
working level meetings took place between the thematic units in charge of each JU and the
relevant horizontal services of the European Commission. Finally, a meeting of the
rapporteurs of the seven independent expert groups was organised by the Commission
services on 2 March 2017.
External expert groups
The expert groups produced 12 evaluation reports (seven interim evaluation reports for
Horizon 2020 and five final evaluation reports for FP7). The full list of the evaluation reports
can be found in Annexes E and F.
Expert Group Experts
Expert group on the final evaluation of the Innovative
Medicines Initiative Joint Undertaking operating under the
Seventh Framework Programme and the Interim Evaluation of
the Innovative Medicines Initiative 2 Joint Undertaking operating
under Horizon 2020
André Syrota (FR), Chair
Kathleen D'Hondt (BE), Rapporteur
Katherine Payne (UK)
Belen Crespo (ES)
Marcin Szumowski (PL)
Expert group on the interim evaluation of BBI Joint Undertaking
(2014-2016) operating under Horizon 2020
Roland Wohlgemuth (CH), Chair
Lucia Gardossi (IT), Rapporteur
Alistair Reid (UK)
Tiina Pursula (FI)
Erick Vandamme (BE) (until January 2017 )
Danuta Cichocka (PL)
Expert group on the final evaluation of the Clean Sky Joint
Undertaking operating under the Seventh Framework Programme
and the Interim Evaluation of the Clean Sky 2 Joint Undertaking
operating under Horizon 2020
Michael Dooms (BE), Chair
Heather Allen (UK)
Helge Pfeiffer (DE)
Cheryl Atkinson (NL), Rapporteur
Piotr Doerffer (PL)
Expert group on the final evaluation of the Fuel Cells and
Hydrogen Joint Undertaking operating under the seventh
framework programme and the interim evaluation of the Fuel
Cells and Hydrogen 2 Joint Undertaking operating under Horizon
2020
Ana Sofia Caires Branco (PT), Chair
Annelie Carlson (SE)
John Loughhead (UK)
Renate Lemke (DE)
Piotr Bujlo (PL)
Expert group on the final evaluation of the ENIAC and
ARTEMIS Joint Undertakings (2008-2016) operating under the
Seventh Framework Programme and the interim evaluation of
the ECSEL Joint Undertaking (2014-2016) operating under
Horizon 2020
Emilio Lora-Tamayo (ES), Chair
Haydn Thompson (UK), Rapporteur
Jean-Luc Dormoy (FR)
Margriet Jansz (NL)
Leonard Hobbs (IE)
Wolfgang Pribyl (AT)
Werner Damm (DE)
Tomasz Kosmider (PL)
Expert group on the interim evaluation of the Shift2Rail Joint
Undertaking (2014-2016) operating under Horizon 2020
Michael Dooms (BE), Chair
Roderick Smith (UK), Rapporteur
Heather Allen (UK)
Eric Fontanel (FR)
Expert group on the final evaluation of the SESAR Joint
Undertaking (2007-2016) operating under the seventh framework
programme and the interim evaluation of the SESAR Joint
Undertaking (2014-2016) operating under Horizon 2020
Michael Dooms (BE), Chair
Tatjana Bolic, Rapporteur
Helge Pfeiffer (DE)
Heather Allen (UK)
Paul Ravenhill (UK)
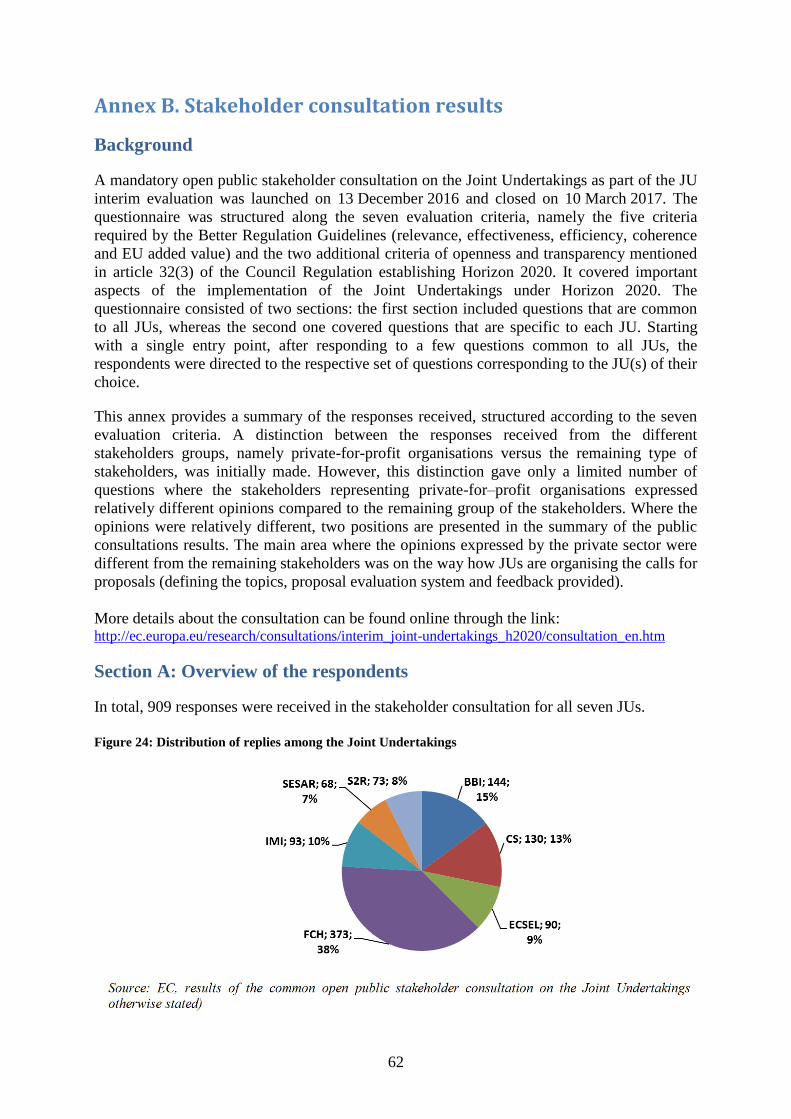
62
Annex B. Stakeholder consultation results
Background
A mandatory open public stakeholder consultation on the Joint Undertakings as part of the JU
interim evaluation was launched on 13 December 2016 and closed on 10 March 2017. The
questionnaire was structured along the seven evaluation criteria, namely the five criteria
required by the Better Regulation Guidelines (relevance, effectiveness, efficiency, coherence
and EU added value) and the two additional criteria of openness and transparency mentioned
in article 32(3) of the Council Regulation establishing Horizon 2020. It covered important
aspects of the implementation of the Joint Undertakings under Horizon 2020. The
questionnaire consisted of two sections: the first section included questions that are common
to all JUs, whereas the second one covered questions that are specific to each JU. Starting
with a single entry point, after responding to a few questions common to all JUs, the
respondents were directed to the respective set of questions corresponding to the JU(s) of their
choice.
This annex provides a summary of the responses received, structured according to the seven
evaluation criteria. A distinction between the responses received from the different
stakeholders groups, namely private-for-profit organisations versus the remaining type of
stakeholders, was initially made. However, this distinction gave only a limited number of
questions where the stakeholders representing private-for–profit organisations expressed
relatively different opinions compared to the remaining group of the stakeholders. Where the
opinions were relatively different, two positions are presented in the summary of the public
consultations results. The main area where the opinions expressed by the private sector were
different from the remaining stakeholders was on the way how JUs are organising the calls for
proposals (defining the topics, proposal evaluation system and feedback provided).
More details about the consultation can be found online through the link: http://ec.europa.eu/research/consultations/interim_joint-undertakings_h2020/consultation_en.htm
Section A: Overview of the respondents
In total, 909 responses were received in the stakeholder consultation for all seven JUs.
Figure 24: Distribution of replies among the Joint Undertakings

63
Figure 25: In which capacity are you responding to this consultation?
In total, 26% of the responses were received from individuals and 74% from organisations. A
similar structure for the responses could be observed across all JUs, except for SESAR where
the individual contributions are almost equal in number to the ones from organisations. In
addition, two organisations submitted their position papers, European Association of Research
and Technology Organisations (EARTO) and the Netherlands’ position paper on the interim
evaluation of Horizon 2020 from the Ministry of Economic Affairs.
Overall, 37% of the respondents agreed that their contribution could be published with their
personal information, while the remaining 63% agreed to publish their contributions only if
they remained anonymous.
The replies from private-for-profit organisations accounted for 44%, followed by research
organisations (21%) and academia (13.6%). Additionally, 8.2% of the responses were
received from national and regional authorities.
Figure 26: What type of organisation do you represent?
In total 719 respondents to the stakeholder survey did it on behalf of their organisations.
Overall, 151 respondents were SMEs.
Figure 27: Are you a small or medium-sized enterprise (SME)?
26%
74%
0%
50%
100%
BBI CS ECSEL FCH IMI SESAR S2R Average
As an individual in my personal capacity In my professional capacity or on behalf of an organisation

64
Figure 28: Country of the respondents
The answers came from 33 countries, with Germany and Italy being the most active. The
replies from organisations located in Germany, Italy, France, United Kingdom and Spain
accounted jointly for 43% of the total replies.
In their replies, 90% of the respondents indicated that they are either very familiar with the
objectives and activities of the JUs (59.4% of the respondents) or expressed their moderate
knowledge about the JUs (30.6%). Also, 8.9% of the respondents indicated that they are
slightly familiar with the JUs and 1.1% indicated that they are not at all familiar with the
objectives and activities of the JUs.
Figure 29: Are you directly involved with the JU?
To this question, 56.6% of the respondents said that they are directly involved with the JUs,
40.2% of them as beneficiaries of the JUs, 39% of them as core partners or members, 5.2% as
Advisory Board members and the remaining 3% as evaluators.

65
Figure 30: Have you applied for funding from the JU?
In total, 68% of the respondents mentioned that they had applied for funding from the Joint
Undertakings.
Section B: European added value
When asked to express their opinion on whether "industry along with other possible actors at
national level but without the involvement of the EU" would be able to overcome the barriers
which hinder innovation and drive up costs in the particular industry sector, 74.5% of the
respondents either strongly disagreed (30.3%) or disagreed (44.2%) with the statement.
The expressed opinions varied between the different JUs. For example, for the FCH JU 81%
of the respondents agreed with the statement that without EU involvement it would be
difficult to overcome the barriers which hinder the market introduction and deployment of
fuel cells and hydrogen technologies, while for the SESAR JU 63% of the respondents agreed
that without EU support for the ATM industry it would be difficult to develop innovative and
interoperable solutions in order to modernise and harmonise the European ATM system.
The absolute majority (96%) of the respondents either strongly agreed (64%) or agreed (31%)
that the EU cooperating with industry in the context of a public-private partnership brings
better results to the society and the different markets in Europe.
Figure 31: EU cooperation with industry in the context of a public-private partnership brings
better results to the society and the markets in Europe
With regard to its financial participation in the public-private partnerships, industry has
committed to fulfil the obligations set out in the Council Regulations establishing the
corresponding Joint Undertaking. The leverage effect is defined as the ratio between the total
contributions provided by "the members of the JU other than the EU" and the EU
contribution.

66
Figure 32: The current minimum "leverage effect" foreseen is:
When asked to assess the current minimum leverage effect foreseen in the Council
Regulations establishing Joint Undertakings, 58.4% respondents stated that the level is
realistic, 10% thought that it is too low while 12% believed that it is too high.
Figure 33: What is the added value of the public-private partnership?
Overall, the respondents considered that the most important value added of the public-private
partnership is the integration of European research (86% of respondents considered this as
very important or important element), better availability of research funds and more cross
border collaboration (scored equally 82% as very important or important element).
Figure 34: Does the JU contribute to economic growth and job creation in the EU?

67
Overall, 85.3% of the respondents strongly agreed (51%) or agreed (34%) that the JUs
contribute to economic growth and job creation in the EU.
Section C: Openness -Transparency
The respondents were asked to assess the information provided in the JU websites and express
their opinion on whether the JU websites provide to the general public and potential
participants an easy access to information.
Overall, the respondents were satisfied with the information provided in the JU websites. The
websites provide easy and effective access to information by the public (76% of the
respondents strongly agreed or agreed with this statement). The respondents also agreed that
the JU websites provide easily accessible and sufficient information about their funded
projects (74%). The respondents were slightly less positive in their assessment that the JU
websites provide effective access to information and sufficient guidance to interested
organisations to facilitate their participation in proposals (70%). Opinions varied more when
assessing the JU websites regarding whether they provide an easy and effective access to the
knowledge generated by the projects funded under a specific JU (60%).
Figure 35: Assessment of the information provided in the JU website
The respondents were satisfied with the current way of defining topics for the JU calls for
proposals. Some 60% of the respondents strongly agreed (13%) or agreed (47%) that the
current way of defining topics for the calls for proposals is open and inclusive. On average,
the respondents were slightly less positive when assessing the proposal evaluation system.
Specifically, 55% of the respondents found it was organised in a sound and fair way, based on
both scientific and technological excellence and industrial relevance. The opinions varied
more when assessing the communication of the evaluation results and the feedback provided
to the applicants. Just over half of the respondents (52%) found that the feedback provided is
effective and meaningful.
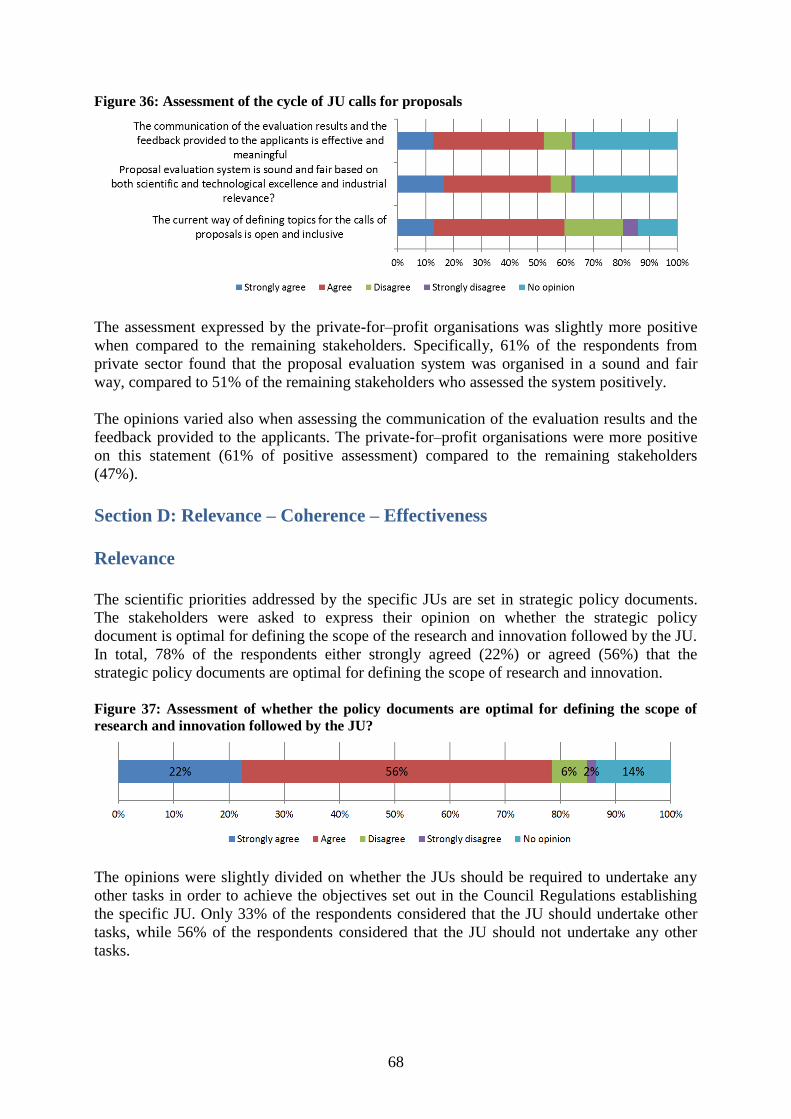
68
Figure 36: Assessment of the cycle of JU calls for proposals
The assessment expressed by the private-for–profit organisations was slightly more positive
when compared to the remaining stakeholders. Specifically, 61% of the respondents from
private sector found that the proposal evaluation system was organised in a sound and fair
way, compared to 51% of the remaining stakeholders who assessed the system positively.
The opinions varied also when assessing the communication of the evaluation results and the
feedback provided to the applicants. The private-for–profit organisations were more positive
on this statement (61% of positive assessment) compared to the remaining stakeholders
(47%).
Section D: Relevance – Coherence – Effectiveness
Relevance
The scientific priorities addressed by the specific JUs are set in strategic policy documents.
The stakeholders were asked to express their opinion on whether the strategic policy
document is optimal for defining the scope of the research and innovation followed by the JU.
In total, 78% of the respondents either strongly agreed (22%) or agreed (56%) that the
strategic policy documents are optimal for defining the scope of research and innovation.
Figure 37: Assessment of whether the policy documents are optimal for defining the scope of
research and innovation followed by the JU?
The opinions were slightly divided on whether the JUs should be required to undertake any
other tasks in order to achieve the objectives set out in the Council Regulations establishing
the specific JU. Only 33% of the respondents considered that the JU should undertake other
tasks, while 56% of the respondents considered that the JU should not undertake any other
tasks.

69
Figure 38: Should the JU undertake any other tasks in order to achieve the objectives set out in
the Regulation?
Coherence
Around 61% of the respondents assessed positively the scope of the research funded by JU in
relation with other Union funding programmes and/ or with similar international, national or
intergovernmental programmes. A quarter of the respondents considered that the research
funded by the JU provides complementarity, 36% considered that it gives synergies with other
Union funding programmes and/ or with similar international, national or intergovernmental
programmes. However, 13% of the respondents considered that in some areas there is a
potential overlap.
Figure 39: What is the relation of the JU with other Union funding programmes and/ or with
similar international, national or intergovernmental programmes?
The majority of the respondents (72%) considered that in general the activities of the JU were
very coherent (34%) or coherent (38%) with other activities of the Horizon 2020 programme.
Just 3% of the respondents expressed a negative opinion about the coherence between the
respective activities and almost a quarter of the respondents did not have an opinion on this
question.

70
Figure 40: To what extent are the activities of the JU coherent with other activities of the
Horizon 2020 programme?
The opinions expressed by private and public sectors were relatively different on this topic.
The respondents from the public sector considered that the activities of the JU were very
coherent or coherent with other activities of the Horizon 2020 programme in a higher
percentage when compared to the assessment of the respondents from the private sector (75%
and 66% respectively).
Figure 41: Do you have any experience in combining different sources of EU funds and/ or with
national funds for research and over the innovation value chain?
Effectiveness
Figure 42: Do you consider that JU projects have resulted in specific scientific and/ or
technological successes?
The majority of the respondents (76%) confirmed that the JU projects have resulted in
specific scientific and/ or technological successes.
Overall, the respondents either strongly agreed or agreed that one of the three major benefits
of participating in a JU project is a direct financial support for innovative research and
development (92%), followed by greater visibility across Europe and reputation (88%) and
then by inclusion in open innovation networks, with direct contact to leading researchers in
universities and the industry (82%).

71
Figure 43: Which would you consider as major benefits of participating in a JU project?
Overall, the respondents either strongly agreed or agreed that one of the three major benefits
of participating in a JU project is a direct financial support for innovative research and
development (92%), followed by greater visibility across Europe and reputation (88%) and
then by inclusion in open innovation networks, with direct contact to leading researchers in
universities and the industry (82%).
Figure 44: Do you think that the JU can contribute towards improving the competitiveness and
industrial leadership of Europe in the particular industries sector?
Most of the respondents (59%) considered that the JUs can contribute towards improving the
competitiveness and industrial leadership of Europe in the particular industries sector in the
medium term (over the next ten years), 19% of the respondents considered that it can
contribute in the short term (over the next five years) and 11% believed that it can contribute
only in the long term (over the next twenty years).

72
Section E. Efficiency
Figure 45: When you applied for funding from the JU, did you think that:
The opinions varied more when assessing the administrative burden for preparing the
proposal and the application procedure. A total of 45% of the respondents considered that the
application procedure is straightforward and simple and 42% of the respondents expressed
their agreement that the administrative burden for preparing the proposal was within
acceptable limits.
Figure 46: Do you consider that the JU overall budget (public and private) in relation to its
objectives and expected outcomes is too low, appropriate or too high?
A total of 46.1% of the respondents considered that the JUs overall budget (public and
private) in relation to their objectives and expected outcomes is appropriate, 35.7%
considered that the overall budget is too low and should be increased and 4.1% of the
respondents considered that the budget is too high and it should be partly used for other types
of research and innovation actions in this area.
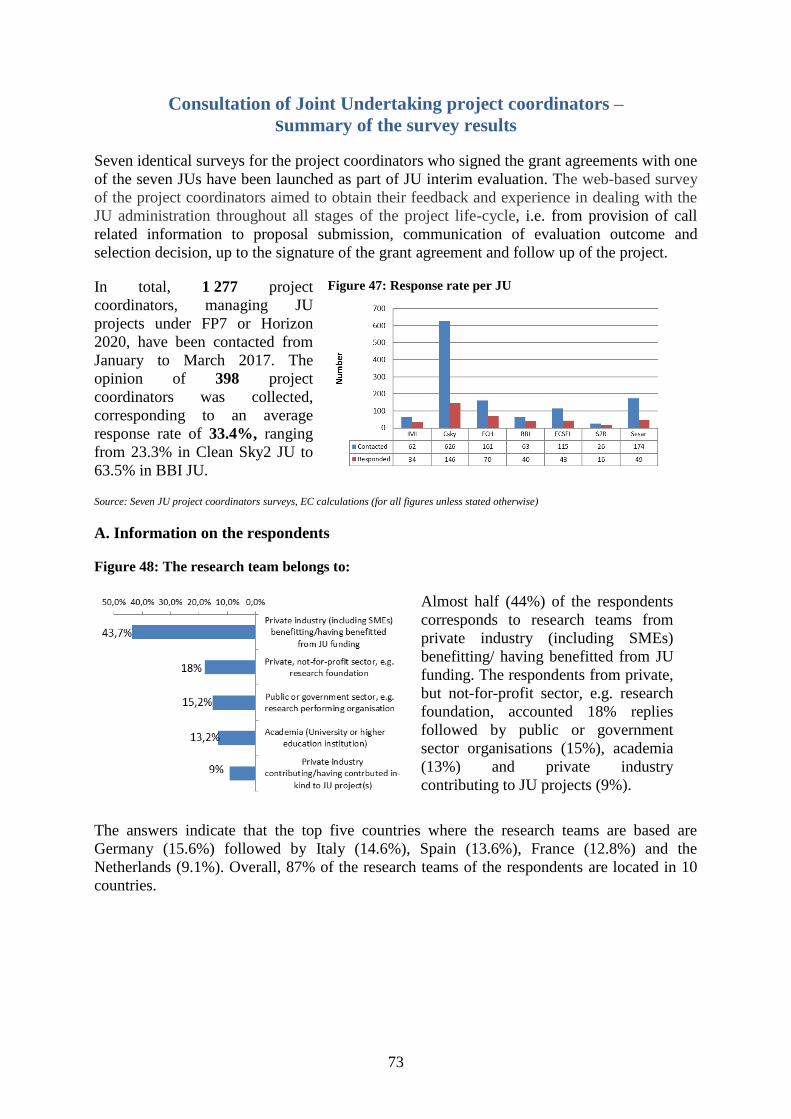
73
Consultation of Joint Undertaking project coordinators –
Summary of the survey results
Seven identical surveys for the project coordinators who signed the grant agreements with one
of the seven JUs have been launched as part of JU interim evaluation. The web-based survey
of the project coordinators aimed to obtain their feedback and experience in dealing with the
JU administration throughout all stages of the project life-cycle, i.e. from provision of call
related information to proposal submission, communication of evaluation outcome and
selection decision, up to the signature of the grant agreement and follow up of the project.
In total, 1 277 project
coordinators, managing JU
projects under FP7 or Horizon
2020, have been contacted from
January to March 2017. The
opinion of 398 project
coordinators was collected,
corresponding to an average
response rate of 33.4%, ranging
from 23.3% in Clean Sky2 JU to
63.5% in BBI JU.
Figure 47: Response rate per JU
Source: Seven JU project coordinators surveys, EC calculations (for all figures unless stated otherwise)
A. Information on the respondents
Figure 48: The research team belongs to:
Almost half (44%) of the respondents
corresponds to research teams from
private industry (including SMEs)
benefitting/ having benefitted from JU
funding. The respondents from private,
but not-for-profit sector, e.g. research
foundation, accounted 18% replies
followed by public or government
sector organisations (15%), academia
(13%) and private industry
contributing to JU projects (9%).
The answers indicate that the top five countries where the research teams are based are
Germany (15.6%) followed by Italy (14.6%), Spain (13.6%), France (12.8%) and the
Netherlands (9.1%). Overall, 87% of the research teams of the respondents are located in 10
countries.
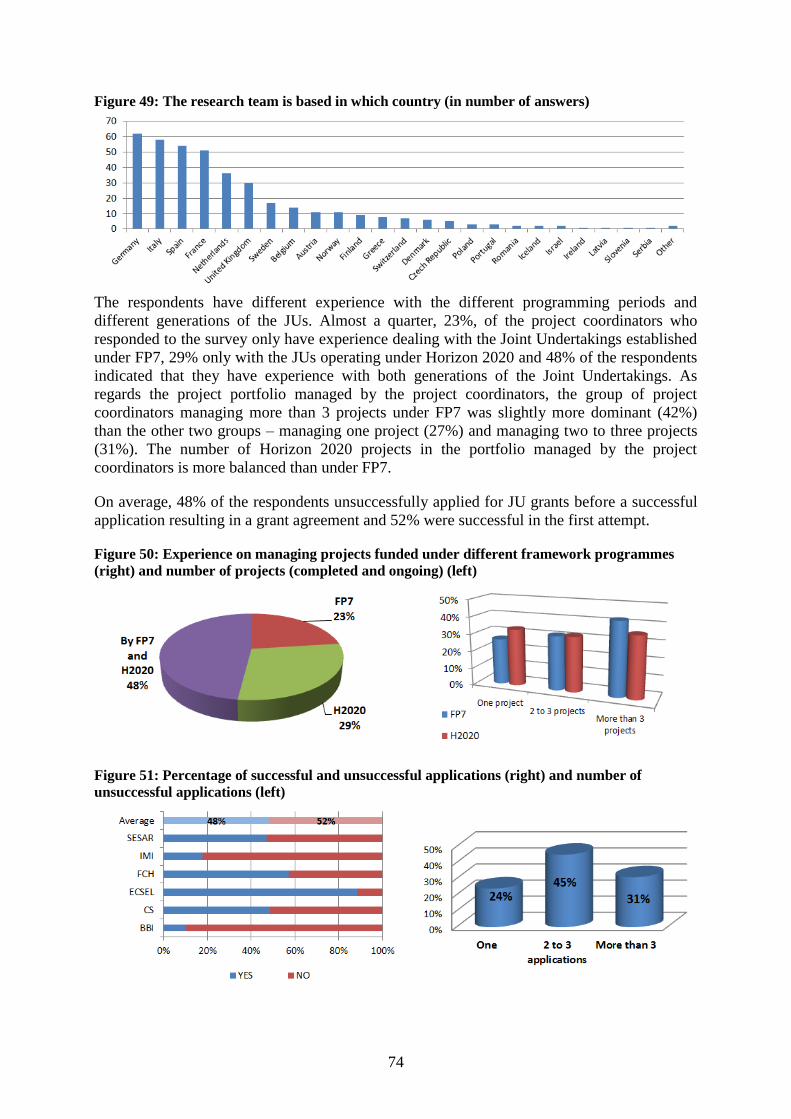
74
Figure 49: The research team is based in which country (in number of answers)
The respondents have different experience with the different programming periods and
different generations of the JUs. Almost a quarter, 23%, of the project coordinators who
responded to the survey only have experience dealing with the Joint Undertakings established
under FP7, 29% only with the JUs operating under Horizon 2020 and 48% of the respondents
indicated that they have experience with both generations of the Joint Undertakings. As
regards the project portfolio managed by the project coordinators, the group of project
coordinators managing more than 3 projects under FP7 was slightly more dominant (42%)
than the other two groups – managing one project (27%) and managing two to three projects
(31%). The number of Horizon 2020 projects in the portfolio managed by the project
coordinators is more balanced than under FP7.
On average, 48% of the respondents unsuccessfully applied for JU grants before a successful
application resulting in a grant agreement and 52% were successful in the first attempt.
Figure 50: Experience on managing projects funded under different framework programmes
(right) and number of projects (completed and ongoing) (left)
Figure 51: Percentage of successful and unsuccessful applications (right) and number of
unsuccessful applications (left)
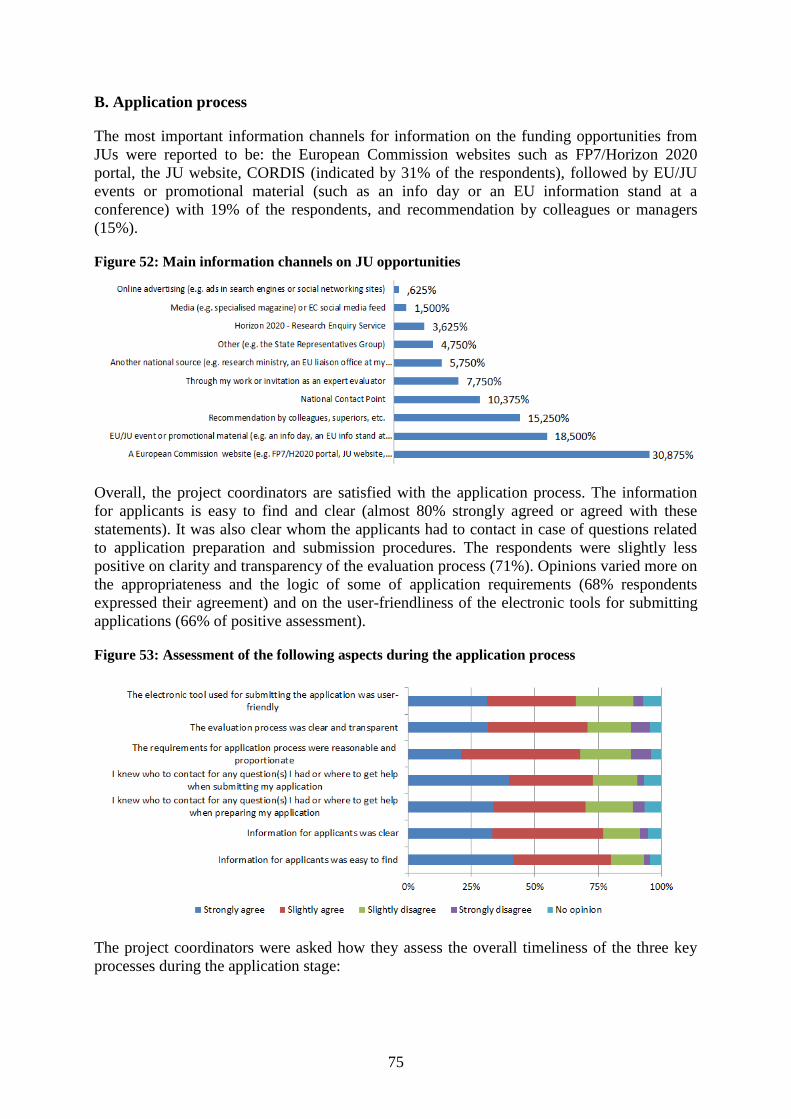
75
B. Application process
The most important information channels for information on the funding opportunities from
JUs were reported to be: the European Commission websites such as FP7/Horizon 2020
portal, the JU website, CORDIS (indicated by 31% of the respondents), followed by EU/JU
events or promotional material (such as an info day or an EU information stand at a
conference) with 19% of the respondents, and recommendation by colleagues or managers
(15%).
Figure 52: Main information channels on JU opportunities
Overall, the project coordinators are satisfied with the application process. The information
for applicants is easy to find and clear (almost 80% strongly agreed or agreed with these
statements). It was also clear whom the applicants had to contact in case of questions related
to application preparation and submission procedures. The respondents were slightly less
positive on clarity and transparency of the evaluation process (71%). Opinions varied more on
the appropriateness and the logic of some of application requirements (68% respondents
expressed their agreement) and on the user-friendliness of the electronic tools for submitting
applications (66% of positive assessment).
Figure 53: Assessment of the following aspects during the application process
The project coordinators were asked how they assess the overall timeliness of the three key
processes during the application stage:

76
The time period from the call deadline to the time when the outcome of the proposal
evaluation was announced to the responded (i.e. time-to-inform);
The time period from the announcement of your proposal’s outcome to the time when
you signed the grant agreement (i.e. grant preparation);
The overall time period from submission of the proposal to signature of the grant
agreement (i.e. overall time-to-grant).
Figure 54: Assessment of the timeliness of the three key processes
The majority of the respondents (77%)
expressed their positive opinion about
the duration of the time-to-inform. The
duration of the grant preparation was
assessed positively by 68% respondents.
Opinions were slightly less positive
regarding the duration of the overall
time-to-grant (58%).
C. Grant finalisation phase
The satisfaction of the project coordinators with the JU staff during the grant agreement
finalisation phase is high in terms of their accessibility and responsiveness (82%) as well as
the clarity of the JU requests (79%). The project coordinators were less positive when
assessing the electronic tools used during the contracting phase (60%) and the electronic tools
(56%) and processes (54%) for validation of beneficiaries.
Figure 55: Assessment of grant finalisation process
D. Communication and interaction
The respondents are very satisfied with the communication and interaction with the JU. The
majority of the respondents found very useful or useful the communication through email
(96%), face-to-face contacts during various meetings or events (77%), the telephone contacts
(75%) as well as the information available at the website (75%). Opinions were not so
positive on life web briefings (30% respondents consider them useful) and recorded messages
(17%).
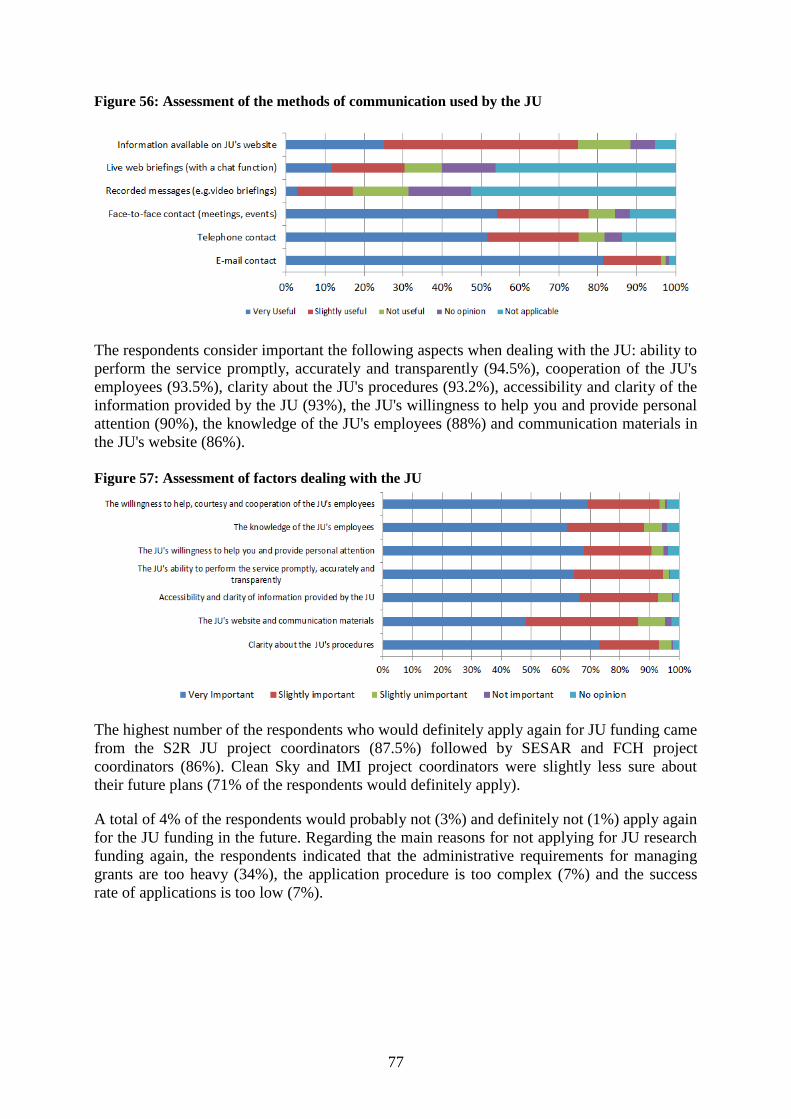
77
Figure 56: Assessment of the methods of communication used by the JU
The respondents consider important the following aspects when dealing with the JU: ability to
perform the service promptly, accurately and transparently (94.5%), cooperation of the JU's
employees (93.5%), clarity about the JU's procedures (93.2%), accessibility and clarity of the
information provided by the JU (93%), the JU's willingness to help you and provide personal
attention (90%), the knowledge of the JU's employees (88%) and communication materials in
the JU's website (86%).
Figure 57: Assessment of factors dealing with the JU
The highest number of the respondents who would definitely apply again for JU funding came
from the S2R JU project coordinators (87.5%) followed by SESAR and FCH project
coordinators (86%). Clean Sky and IMI project coordinators were slightly less sure about
their future plans (71% of the respondents would definitely apply).
A total of 4% of the respondents would probably not (3%) and definitely not (1%) apply again
for the JU funding in the future. Regarding the main reasons for not applying for JU research
funding again, the respondents indicated that the administrative requirements for managing
grants are too heavy (34%), the application procedure is too complex (7%) and the success
rate of applications is too low (7%).

78
E. Overall performance of JU
A majority of the respondents (58%) agreed that the second generation of the JU presents an
improvement compared to its predecessor under FP7. This question is applicable for assessing
IMI 2, Clean Sky2, FCH 2, SESAR and ECSEL JUs.
Figure 58: Assessment of whether the 2nd generation JUs present an improvement compared to
their predecessors
On average, 94% of the project coordinators were very satisfied (33%) or satisfied (61%) with
the services provided by the JU. The Shift2Rail and BBI JUs recorded the highest rate of the
project coordinators who are very satisfied with the services provided (56% and 50%
respectively).
Figure 59: Overall satisfaction of the services provided by JUs
The project coordinators were positive (strongly or slightly agreed) on the following
statements when evaluating the actual services provided by JUs: the methods of
communication provide relevant and useful information (positively assessed by 84.4% of the
respondents), the JU strives to provide excellent programme management and high quality
service (84.2%), the information provided by the JU is easily accessible (78.9%) and the JU's
website and information materials are visually appealing and user-friendly (77.6%).
The usefulness of the events organised by the JU (information days, project meetings,
information visits, etc.) scored slightly less positive (75.4%), as well as the appreciation on
JU's documents without mistakes or errors (73.4% positive assessment) and the transparency
of the JU's procedures (71.9%).

79
Figure 60: Assessment of the services provided by JU
The respondents provided very positive assessment of the JU staff. The project coordinators
expressed themselves positively (strongly agreed or slightly agreed) on the following
statements when assessing the JU employees: JU employees are consistently courteous and
always willing to help (91.5%), knowledgeable and competent (90.2%), committed to doing
quality work and provide a prompt service (89.2%), cooperative and give personal attention
(89.2%), showing a sincere interest in solving a problem (86.7%).
Figure 61: Assessment of the JU employees
F. Overview of the project(s) objectives and impacts
The project coordinators reported
that 34% of the projects have fully
achieved their objectives and/ or
have delivered unexpected results
with significant immediate or
potential impact (even if not all
objectives mentioned in the technical
annex were achieved). Almost half,
49% of the projects have achieved
most of their objectives with
relatively minor deviations and only
2% failed to achieve critical
objectives and/ or were severely
delayed. The remaining 15% of the
Figure 62: Overview of the project(s) objectives and impacts

80
projects are still ongoing.
In addition, the majority (83%) of project coordinators indicated that the project(s) directly
contributed (or are expected to contribute) to new products and services for their organisation.
Furthermore, the project coordinators indicated that the projects funded by JU research grants
also had impacts beneficial to their organisation: the project augmented (or were expected to
augment) the capability of their organisation (91%), the project led (or is expected to lead) to
the establishment of new business relationships for their organisation (80%) and the project
required (or will require) the development of new skills in their organisation (78%).
Figure 63: Project(s) impact to the beneficiary organisation
G. Level of satisfaction with the content of the programme
Regarding the question How satisfied are you with the JU programme content in respect to its
state-of the-art?, 93% of the respondents indicated that they are either very satisfied (39%) or
satisfied (54%).
A very high number of project coordinators (93.5%) expressed their satisfaction with the JU
programme content with respect to its relevance for the particular industry and the society.
Figure 64: Level of satisfaction with the content of the JU research programme
81
Annex C. Evidence and Methodology
The JU Interim evaluation focuses on the implementation of the Joints Undertakings (JUs)
under Horizon 2020 from 6 May 2014 (adoption of the Council Regulations establishing the
JUs) to 31 December 2016, a date that was adopted as the cut-off point for the analysis.
Seven independent expert groups were set up to carry out the interim evaluation of each of the
JUs and produce evaluation reports. In total, 39 experts were selected from a list, prepared
through an open call for applications. The independent experts were selected based on their
level of professional experience and appropriate range of skills in the relevant fields covered
by this evaluation.
The expert groups used a wide range of methods and tools suitable for carrying out the
requested tasks. Each task required a specific methodological approach. The expert groups
undertook a detailed review of pertinent literature, gathered evidence from interviews with a
wide range of stakeholders, including both participants and non–participants in funded grants.
The expert groups were given a standard set of data on the calls launched by the JUs and their
funded research projects under Horizon 2020 and under FP7, where applicable, from the
Common Research Data Warehouse (CORDA) database. Additionally, the results from the
various surveys (e.g. common open public consultation, seven surveys of JU project
coordinators) were analysed and cross-referenced to assess their validity. More details on
individual methodologies can be found in the respective expert group reports annexed to this
Staff Working Document (SWD).
The European Commission prepared the SWD based on a wide range of sources comprising
the expert group evaluation reports, results from the common open public consultation and the
seven surveys of JU project coordinators, as well as the views of the relevant Commission
services. Reports and opinions produced by the other EU institutions were also taken into
account: namely, the Council Conclusions on the FP7 ex-post evaluation, opinions and reports
from the European Parliament, the European Economic and Social Committee and the
Committee of Regions and relevant Court of Auditors reports.
The main limitation of this interim evaluation concerns its timing: it is taking place only three
years at most after establishing the JUs operating under Horizon 2020. The different JUs only
launched their first calls late in 2014 or even later. Many projects are still in the very early
stages of implementation. There is, in fact, only one completed project presently, out of 329
grant agreements signed.
Concretely this means that it is too early to carry out a full 'effectiveness' assessment, i.e.
an analysis of progress towards achieving the objectives. The emphasis on the 'effectiveness'
assessment will therefore be on the preliminary expectations based on individual JU design
features, first reported project outputs and preliminary results (publications, patents, etc.). On
the other hand, a much deeper analysis was possible regarding relevance, coherence,
European added value, and efficiency (but mostly on the inputs parts, since so far the effects
can only be estimated).
This limitation and the related reservation were shared by all the expert groups. However, the
expert groups noted that significant progress has been made in launching the calls, signing the
grant agreements and the follow-up of the running projects in 2017, but this has not been
covered by the current evaluation exercise.

82
In addition to the effect of some of the key performance indicators specific to each JU, the
above mentioned limitation also applies to the leverage effect, which is a key aspect of a PPP:
in fact, the Horizon 2020 targets are set for the whole period 2014 – 2024. Currently, there
are only partial results that can be consulted in the evaluation question of EU added value and
in chapter six of the SWD, but the final figures will not be available before the framework
programme has finished.
It deserves to be emphasised that the JU interim evaluation cannot and does not present
results and impacts achieved by the JUs operating under Horizon 2020. It is difficult to
make already an adequate quantitative assessment of the results and impacts of these
initiatives under Horizon 2020, due to the long time it takes for the research results to reach
the market. This is the well-known 'time-lag' issue, i.e. the fact that research projects take time
to produce societal impacts: it takes years before the new knowledge generated within the
scope of a single project or a portfolio of projects is valorised in the form of new products.
This makes it hard for the experts to make an informed assessment on the eventual outcomes
or the subsequent impacts.
Limitations also include shortcomings on data availability and measurability of outcomes.
For example, most indicators focus on input/results but not on impact. The majority of the
indicators to track progress relate to classical outputs from R&I projects - publications,
patents, prototypes, but not to their impacts on e.g. decreasing CO2 emissions, improving
health of the citizen. As the indicators are collected for individual JUs only and the
monitoring data come from various data sources, it is really difficult to aggregate them.
Additionally, there is a reliability issue of certain monitoring data as, for example, data on
patents and publications are based on self-reporting by project coordinators; data on the cross-
cutting issues are based on flagging by project officers.
Another limitation is the lack of benchmarks to compare performance. It is not easy to
compare and benchmark the performance of JUs operating under Horizon 2020 with the
performance of other similar entities, as no comparable (in terms of scale and scope)
organisations exist. To overcome this challenge, whenever possible (e.g. in the case of the
analysis of participation patterns), FP7 results and figures were used for benchmarking.
As regards the stakeholder consultation, it was considered only as a complementary
information source to validate or cross-check various evidence coming from the other sources.
A distinction between the responses received from the different stakeholders groups, namely
private-for-profit organisations versus the remaining type of stakeholders, was initially made.
However, this distinction gave only a limited number of questions where the stakeholders
representing private-for–profit organisations expressed relatively different opinions compared
to the remaining group of the stakeholders. Where the opinions were relatively different, two
positions were presented in the summary of the public consultations results (Annex B). The
main area where the opinions expressed by the private sector were different from the
remaining stakeholders was on the way how JUs are organising the calls for proposals
(defining the topics, proposal evaluation system and feedback provided).
To overcome/mitigate these limitations, the SWD is always indicating its data sources. All
underlying data sources are also made publicly available. All evaluation results have been
systematically cross-referenced and checked against several inputs, namely quantitative data
available, opinions and judgements expressed by the experts groups and opinions expressed
by various stakeholders. Conclusions are drawn based on the systematic triangulation of
evidence from various data sources.
83
Annex D. Outcome of the Final evaluations of the JUs established under FP7
Conclusions on the final evaluations of Joint Undertakings operating under FP7
During the period from October 2016 to July 2017, a total of 32 independent experts working
in five groups evaluated the outcomes provided by the six Joint Undertakings (JUs) that
operated under FP7, namely, ARTEMIS, CS, ENIAC, FCH, IMI and SESAR.
Their conclusions, specific to each JU, are presented as part of the respective evaluation
reports. This annex presents the Commission services' position on the performance of the six
JUs that operated under FP7, based on the findings of the five expert groups (the ARTEMIS
and ENIAC JUs were evaluated by one, enlarged group of experts) and its own experience.
The main conclusion, shared by all individual JU evaluation findings, is that the first
generation of JU-based public-private partnerships (PPPs) demonstrated their capacity to
effectively and efficiently pursue and contribute to objectives that, while highly relevant to
the major socio-economic challenges that Europe is facing, were often judged to be very
ambitious, in one case even unrealistic considering the resources available, the capacity of
competitors at global level and the relatively limited timeframes.
They managed to overcome significant teething problems under particularly challenging
circumstances, such as bridging public and private mentalities and interests while operating
under firm Community rules and procedures. The industrial sectors addressed by the JUs
continue to be of high economic relevance for Europe and define the areas where well-
identified market failures or risks require a long-term concerted research and innovation
effort.
Subject to the specificities of the respective industrial sectors, the JUs promoted synergies in
linking activities across the innovation cycle, from research outcomes to closer to market
activities. As regards impact, while the experts identified project outputs that collectively
contribute to set, high-level objectives of the respective JUs, they also stress that it is still
early for these outputs to materialise into products or processes ready for market deployment
and therefore to assess properly the impact.
Strengths
The relevance of the six Joint Undertakings in contributing to EU competitiveness and policy
goals is confirmed.
All JUs addressed strategic technologies in sectors that were, and still are, emerging as
cornerstones of a knowledge-based European economy and were linked to the FP7 objectives.
For example, the IMI JU experts consider that the underlying socio-economic conditions at
that time justified the establishment of a JU-based public-private partnership aiming at
improving the efficiency and effectiveness of the drug development process to produce more
effective and safer innovative medicines.
Along this line, the CS JU experts confirm that the policy and rationale that motivated the
Clean Sky programme in 2007 is still in line with the current challenges in the air transport

84
sector and that the portfolio of tasks entrusted to the CS JU continues to underwrite the
public-private partnership approach.
The FCH JU experts perceive the activities of the JU as highly relevant to the grand
challenges facing Europe by supporting the climate change objectives, helping improve
energy security and contributing to raising the status of Europe as an international leader in
FCH technologies. They add that in the specific cases where Europe is leading (e.g. hydrogen
fuel cell busses, renewable hydrogen production via electrolysis, etc.), the contribution of
FCH through R&D activities, demonstration projects and fostering European collaboration, is
clear and substantial.
Similarly, in the area of information and communication technologies (ICT), the ARTEMIS
and ENIAC JUs have strongly supported the embedded systems and semiconductor domains
thereby contributing to the strengthening of the European industry in key strategic areas
which generate billions of euros in turnover for Europe and are supporting tens of millions of
jobs across Europe.
Finally, the SESAR JU experts highlight the importance of the JU as a key enabler of the
wider Single European Sky policy, already delivering solutions for the modernisation of the
Air Traffic Management (ATM) in Europe and strengthening cooperation among ATM
stakeholders, who have never before worked together, including national authorities.
The Joint Undertakings effectively engaged the major actors in research and innovation in
the industrial sectors concerned.
One of the main achievements on which there is general consensus among the expert groups
is that the JUs managed to structure and mobilise an otherwise fragmented landscape of
different sectors and industries and to convince competing or different, unrelated stakeholders
to work together within a single project.
In the case of the IMI JU, the expert group concludes that the JU led to a new model of
collaboration where competing pharmaceutical industries work together to achieve a common
goal and, equally important, these collaborations were based on trust, mutual understanding
and appreciation among previously distant researchers from academia and industry.
The FCH JU experts agree that one of the JU's main achievements is that it managed to bring
together a wide range of stakeholders combining diverse skills and functions. The way in
which industry built the representative structure (originally NEW-IG, renamed to Hydrogen
Europe in 2014) and engaged into the planning and execution of the programme is indicative
of the appeal that this public-private partnership exerts on the stakeholders and a distinct
proof of commitment on their part.
The experts evaluating the ARTEMIS and ENIAC JUs acknowledge the presence of all key
players necessary to have a strong impact on the respective markets while noting the
increased complexity of the JUs' tri-partite organisation (Members States, Industry and the
EU) and the associated administrative and coordination difficulties faced by the two JUs.
Similarly, the SESAR JU experts see clear benefits in air navigation service providers,
airspace users and airports working together and leading to partnerships beyond the JU's
scope and in manufacturers having their R&D potential improved by gaining access to
operational stakeholders.

85
Projects funded by the Joint Undertakings effectively delivered against objectives.
While it is generally acknowledged that it is still early to assess the final impact of the JUs
against high level goals (e.g. competiveness, jobs creation, commercialisation, energy
savings, etc.), the evaluations do report on a large number of JU funded project outputs that
give rise to reasonable expectations with regard to impact a few years later.
Depending on the orientation of the research agendas and priorities, these very promising
outcomes linked to project results range from the leveraging of private funding and filing
patent applications to dissemination via publications and direct employment in funded
projects.
For example, ENIAC JU funded projects led to the filing of 209 patent applications, while
those of the CS JU filed for 151 patent applications. Projects funded under the ENIAC and
ARTEMIS JUs engaged more than 3 000 full time researchers while IMI JU projects led to
over 2 700 direct jobs.
IMI JU projects produced close to 2 700 publications with an average citation impact (2.03)
almost double than that of the EU (1.14), while ENIAC JU projects produced close to 2 400
publications. IMI JU projects also produced 32 patents by end 2016. Twelve of the 21
finished IMI JU projects had already created a total of 16 spin-offs by end 2016. Also 2768
full-time jobs had been created by end 2016.
In the case of SESAR JU, more than 300 completed projects resulted in 350 validation
exercises and 30 000 flight trials leading to 61 SESAR solutions (new or improved
operational procedures or technologies) of which 27 are in the pipeline for deployment.
According to the experts, this uptake of solutions is indicative of the excellent quality of the
research performed by the SESAR JU projects.
Finally, the FCH experts commented on the JU's excellent performance in matching the
allocation of funds to the research priority areas funded by the calls. In the transport area the
JU demonstrated 140 fuel cell cars and light duty vehicles and 45 buses in several Member
States along with 17 hydrogen refuelling stations.
Despite the fact that not all projects managed to achieve the planned objectives due to
inherent R&I risks and over-ambitious targets, the experts report that project results were
comparable to those of the main global competitors. In the area of stationary power
generation, the FCH JU portfolio of projects helped Europe to maintain its leading edge
internationally, even though deployment activities in Europe are lagging significantly
compared to Japan and the USA, probably due to less favourable regulatory regimes in
Europe.
Joint Undertakings carried out their operations in an efficient manner.
There is an overall satisfaction with the operational efficiency of the JUs. As expected from
newly established entities faced with the complexities of integrating public and industrial
interests in a research context and constrained by Community rules and procedures,
operations were slow in the initial period.
This was best reflected by the long time to grant reported by most JUs in the early years of
their operations. However, operational efficiency picked up as the JUs matured, even though
in some cases the increasing number and/or size of projects affected performance.
86
Time to grant indicators improved significantly over time while the time-to-pay indicator was
always found to be within the set targets.
Most experts consider the JUs to be lean and efficient organisations operating with reasonably
low administrative costs (below or close to 5% of the operational costs), given the
complexity, spectrum and volume of operations carried out by following cumbersome FP7
processes and sub-optimal IT support tools.
Leveraged private funding matched or exceeded EU funding.
An important argument in justifying support for funding FP7 JU-based public-private
partnerships has been the requirement for the JUs to leverage private funding that, in the cases
of CS JU, IMI JU and FCH JU, would at least match the corresponding EU funding.
The private funding is considered to be in the form of in-kind contributions by the private
members (IMI JU, FCH JU) or the legal entities participating in JU activities (CS JU). All
experts agreed that the JUs have met, even exceeded their targets of matching the respective
EU contributions.
In the cases of the ENIAC JU and ARTEMIS JU, there was a general objective to increase
and leverage private and public investment in the sectors of nanoelectronics and embedded
systems in Europe without specifying any targets.
The experts report that the two JUs clearly succeeded in increasing both private and public
investment in the respective sectors, citing that EUR 630 million of EU funding leveraged
EUR 912 million of national contributions and EUR 2.46 billion of private funding.
Finally, the SESAR JU experts estimate a leverage factor of 1.8 counting in the contribution
of EUROCONTROL.
Challenges
Despite the general acceptance of the fact that the JUs under FP7 performed efficiently and
delivered outputs that were considered remarkable by many accounts, the evaluations identify
a number of shortcomings that have persistently limited the potential of the JUs to contribute
even more effectively to their objectives. Most of them, relating to management efficiency
and effectiveness, have already been addressed by the Horizon 2020 JUs and are now
considered to be less of a problem.
However, there still exist a few important ones that continue to affect the currently operating
second generation of JUs. Very few, if any, of these shortcomings are common to all JUs;
some apply to a few, whereas most refer to one or two only.
The following is a list of the challenges associated to the identified shortcomings that the
Commission considers important in relation to the objectives and expected outputs of the JUs.
It is by no means exhaustive; for a comprehensive list of challenges specific to each JU the
reader is referred to the respective evaluation report.
87
Need for a stable set of objective key performance indicators.
Key Performance Indicators (KPIs) are used to measure impact in order to improve the
understanding of JU strategic challenges from the perspective of management, decision
makers and societal stakeholders and, also, to justify support for the JU instrument.
While special care was taken on measuring and reporting on input parameters
(implementation statistics, participation rates, etc.), less effort has been devoted to measuring
outputs. The absence or selective use of such indicators hampers our ability to assess the
lasting effects of the JUs. The issue is a long-standing one and still figures among the main
challenges faced by the Horizon 2020 JUs, even though serious efforts were devoted to
composing and defining long lists of KPIs and associated targets that, according to experts of
some JUs, still do not serve well the intended purpose and need to be revisited.
For instance, the IMI JU experts argue strongly for the development of SMART24
KPIs along
with baseline metrics to allow benchmarking exercises over time.
Similarly, the ARTEMIS JU and ENIAC JU experts consider the absence of objective, stable
over time KPIs to be of critical importance to the legitimacy and justification of the support to
the JUs.
Need for clear, harmonised methodology for the calculation of in-kind contributions by the
private members.
While it was generally agreed that the JUs managed to leverage private funding that matched
or exceeded the EU funding, it became clear from the evaluation findings and comments of
experts that the private members reported in-kind contributions without clear references to the
methodologies used for such calculations.
Given the importance of the leverage effect in the justification of the support for the JUs,
existing and future, the definition of a methodology for the calculation of in-kind
contributions, commonly agreed by the private members of all JUs, was treated as a
Commission priority and a harmonised methodology is now implemented by the JUs
operating under Horizon 2020.
Openness to new members
Many expert groups make specific references to the difficulties experienced by certain
organisations such as SMEs, universities or research centres in becoming members of the JUs.
In exchange of important benefits such as direct involvement in JU governance, voice on the
definition of research agendas and call topics, candidate members were required to contribute
financially amounts disproportionate to their size or financial capacity (e.g. CS JU and
SESAR JU).
In the IMI JU, mid-cap companies could not benefit from EU funding, and companies active
in non-pharma sectors could not easily contribute to IMI JU activities (these limitation were
later lifted in IMI2 JU respectively with the eligibility for EU funding of mid-size companies,
and with the new status of "Associated Partners").
24
Specific, measurable, achievable, relevant, time-bound

88
Prior to the autonomy of the CS JU, the Commission together with the private members
launched an "Associates" programme in order to establish a critical mass of stakeholders in an
open and transparent manner. Despite the efforts, the selection process left many rejected
candidates complaining about the absence of reasoned decisions.
Closely linked to the openness of JUs to new members is the concern expressed by the experts
about the top-down approach employed when compiling the Strategic Research Agendas
(SRA) or, equally important, defining call topics. A number of experts pointed to the fact that
such processes were influenced heavily by the large industries even though they conceded that
the issues addressed in the SRA were relevant to realise the set objectives.
Participation in projects was also not straightforward in JUs characterised by the presence of
large industries where, in addition to financial burdens, SMEs and academic stakeholders
were often discouraged by complex and time-consuming decision-making procedures,
negotiations on IP rights, etc.
Need for stronger interaction between Governing Boards and advisory bodies (States'
Representatives Groups and Scientific Committees).
When establishing the governance structure of the JUs, great emphasis was placed on defining
the role of advisory bodies such as the States' Representatives Group (SRG) and the Scientific
Committees (SC), and their interaction with the Governing Boards (GBs) of the JUs. The
efficient collaboration between these bodies is considered by all experts to be of critical
importance to the purposeful functioning and successful outcome of the JUs.
On this important issue, a number of expert groups express concern, among others, on the low
impact of the advisory bodies on the Governing Boards' strategic decisions. For example, the
CS JU experts consider that the NSRG (National States' Representatives Group) did not seem
to have fulfilled its full potential in ensuring a close relationship with the Member States in
order to influence the Clean Sky programme or to develop synergies with national research
strategies.
The IMI JU experts call for improved communication between these bodies echoing the
opinion of SRG and SC that the GB should be more open to their feedback and input.
Finally, in the case of FCH JU, the experts report that even though the definitions of roles and
responsibilities were clearly defined in the regulation, some of these roles and responsibilities
were not clear to all members of the advisory bodies and, therefore, they have not delivered
according to their full potential. They especially noted and questioned the appropriateness or
effectiveness of SRG membership.
Uneven SME participation rates; close to those of the FP7 Cooperation Specific Programme.
Overall, the SME rates in signed JU grants were around 20% in terms of participations and
16% in terms of share of EU funding. These rates are close to the corresponding rates in the
FP7 COOPERATION Specific Programme; 19% and 17% respectively.
All experts, as well as the Commission, expected higher SME rates from JUs that have
industrial needs at the heart of the matter. Another issue is that these rates are fluctuating
widely among JUs.

89
For example, the CS JU rates for SMEs are among the highest in FP7 programmes (34% both
in terms of participation and share of EU funding), the IMI JU rate of 13% in share of EU
funding is lower than that of the FP7 Health Priority Area which is 18% (but equivalent in
terms of share of participations, with respectively 16% and 15.9%).
Also worth noting is that although 16% of the participants in ENIAC JU projects are SMEs,
their share of funding is only 6%, raising questions about the meaningfulness and motivation
of such participations. Clearly, the issue of SME participation should be considered separately
for each JU, by taking into account the respective industrial specificities and characteristics.
Further efforts are required to increase coherence of the objectives and activities of the Joint
Undertakings with the corresponding parts of FP7 and other EU funding programmes as well
as the policies at EU, national and regional level.
Being part of and supported by FP7, the JUs should ensure that their scope and objectives
were synchronised and considered to be complementary to the respective priority areas of
FP7.
The CS JU and SESAR JU experts identified clear synergies between the JU and FP7
activities and commented on the fruitful coordination between CS JU, SESAR JU and
ACARE (Advisory Council for Aviation Research and innovation in Europe. Regarding
national policies, while the SESAR JU maintains strong links with national authorities and
agencies, the CS JU experts did not detect any visible and explicit results stemming from the
JU's coordination with national research programmes.
The Strategic Research Agendas developed by the ARTEMIS JU and ENIAC JU were used to
ensure the relevance of these themes and therefore influence FP7 priority research areas.
However, the experts found overlaps and weak, if any, links with other EC and national
programmes.
The IMI JU experts considered that complementarity with other FP7 projects, as well as with
Joint Programming Initiatives, remained only limited.
The FCH JU experts concluded that while the existence of the JU contributed to a reduced
fragmentation in FP7 and other EU support programmes, the boundaries between the JU and
FP7 were not clearly defined. Regarding coherence with national programmes, the experts
believed that this was the task of the States' Representatives Group; to provide guidance to the
JU activity and provide a forum through which the content of the Member States’ own
programmes might be influenced. This goal has been realised to a limited extent, so in this
area the FCH JU has not brought about significant changes.
Low EU-13 participation rates.
Overall, the participation rates of EU-13 Member States in JU funded projects amount to
4.3% in terms of number of participations and 2.3% in terms of share of EU funding. These
rates are lower than the corresponding rates of 7.0% and 3.8% in the FP7 Cooperation
Specific Programme. While it can be argued that the extent of EU-13 participation is
generally commensurate with the number of researchers or the scale of R&D investment, it is
acknowledged that EU-13 rates are rather low.

90
Need to improve communication and dissemination of project results
In their effort to ensure an open and inclusive attitude towards the wider stakeholder
community, the JUs employed a range of mechanisms and tools such as websites, social
media, webinars (to inform on calls for proposals), events, publications and articles in the
specialised and general press. These means of communication have improved considerably
over the course of the JUs lifetime.
It was generally accepted that the websites provide easy and effective access to information
about the JUs, the funded projects and call related information. The experts evaluating the
transport JUs note that social media are not used consistently across JUs and also the absence
of clear dissemination strategies. The IMI JU experts consider that while the communication
strategy, tools and channels are logical, well thought out and extensive, the monitoring of
their effectiveness and impact could be further improved. Along the same lines, the FCH JU
group calls for more focused communication activities to increase FCH technologies
awareness.
The dissemination of project results, however, was considered to be insufficient. Access to
knowledge generated by funded projects was mostly confined to directly involved
stakeholders.
Both the Commission and the experts see the need for more active and targeted dissemination,
especially to the wider European industry and potential end-users. The dissemination of
results continues to be a challenge for the second generation of JUs, under Horizon 2020.

91
Annex E. Interim Evaluation Reports for the JUs under Horizon 2020
Expert Group, Interim Evaluation of the Innovative Medicines Initiative 2 Joint Undertaking
(2014-2016) operating under Horizon 2020, Publications Office of the European Union,
Luxembourg, 2017, ISBN 978-92-79-69299-4
Expert Group, The Interim Evaluation of Bio-based Industries Joint Undertaking (2014-2016)
operating under Horizon 2020, Publications Office of the European Union, Luxembourg,
2017, ISBN 978-92-79-67438-9
Expert Group, Interim Evaluation of the Clean Sky2 Joint Undertaking (2014-2016) operating
under Horizon 2020, Publications Office of the European Union, Luxembourg, 2017, ISBN
978-92-79-69188-1
Expert Group, The Interim Evaluation of the Fuel Cells and Hydrogen 2 Joint Undertaking
(2014-2016) operating under Horizon 2020, Publications Office of the European Union,
Luxembourg, 2017, ISBN 978-92-79-68891-1
Expert Group, Interim Evaluation of the ECSEL Joint Undertaking (2014-2016) Operating
under Horizon 2020, Publications Office of the European Union, Luxembourg, 2017, ISBN
978-92-79-69619-0
Expert Group, Interim Evaluation of the Shift2Rail Joint Undertaking (2014-2016,
Publications Office of the European Union, Luxembourg, 2017, ISBN 978-92-79-69617-6
Expert Group, Interim Evaluation of the SESAR Joint Undertaking (2014-2016) operating
under Horizon 2020, Publications Office of the European Union, Luxembourg, 2017, ISBN
978-92-79-70191-7
92
Annex F. Final Evaluation Reports for the JUs under FP7
Expert Group, Final Evaluation of the Innovative Medicines Initiative Joint Undertaking
(2008-2016) operating under the Seventh Framework Programme, Publications Office of the
European Union, Luxembourg, 2017, ISBN 8-92-79-69295-6
Expert Group, The Final Evaluation of the Clean Sky Joint Undertaking (2008-2016)
operating under FP7 and H2020, Publications Office of the European Union, Luxembourg,
2017, ISBN 978-92-79-69189-8
Expert Group, Final Evaluation of the Fuel Cells and Hydrogen Joint Undertaking (2008-
2014) operating under FP7, Publications Office of the European Union, Luxembourg, 2017,
ISBN 978-92-79-62582-4
Expert Group, Final Evaluation of the ARTEMIS and ENIAC Joint Undertaking (2008-2013)
Operating under FP7, Publications Office of the European Union, Luxembourg, 2017, ISBN
978-92-79-69634-3
Expert Group, Final Evaluation of the SESAR Joint Undertaking (2014-2016) operating
under the SESAR 1 Programme (FP7), Publications Office of the European Union,
Luxembourg, 2017, ISBN 978-92-79-70192-4