interim condensed consolidated financial statements azul s.a. · net income before income tax and...
TRANSCRIPT

Interim Condensed Consolidated Financial Statements
Azul S.A. As of and for the six-months ended June 30, 2018
2
Unaudited Interim condensed consolidated financial statements June 30, 2018 Contents Interim consolidated statements of financial position ............................................................................ 3 Interim consolidated statements of operations ..................................................................................... 5 Interim consolidated statements of other comprehensive income ........................................................ 6 Interim consolidated statements of changes in equity .......................................................................... 7 Interim consolidated statements of cash flows ..................................................................................... 8 Notes to the unaudited interim condensed consolidated financial statements ...................................... 9

3
Azul S.A. Interim consolidated statements of financial position As of June 30, 2018 and December 31, 2017 (In thousands of Brazilian reais)
June 30, 2018 (Unaudited)
December 31, 2017
Assets Current assets
Cash and cash equivalents (Note 5) 848,961 762,319 Short-term investments (Note 6) 725,287 1,036,148 Restricted investments (Note 7) 548 8,808 Trade and other receivables 1,175,690 914,428 Inventories 171,465 150,393 Assets held for sale (Note 10) 96,600 - Taxes recoverable 176,974 112,891 Financial instruments (Note 15) 29,652 10,345 Prepaid expenses 103,279 109,784 Related parties (Note 8) - 73,241 Other current assets 95,488 125,984
Total current assets 3,423,944 3,304,341 Non-current assets
Related parties (Note 8) 11,658 9,711 Long-term investments (Note 15) 1,090,710 835,957 Security deposits and maintenance reserves (Note 9) 1,569,381 1,259,127 Financial instruments (Note 15) 461,664 410,477 Prepaid expenses 16,631 4,472 Other non-current assets 272,827 205,996 Property and equipment (Note 10) 3,144,578 3,325,535 Intangible assets 972,097 961,000
Total non-current assets 7,539,546 7,012,275
Total assets 10,963,490 10,316,616

4
June 30, 2018 (Unaudited)
December 31, 2017
Liabilities and equity
Current liabilities
Loans and financing (Note 12) 542,304 568,234 Accounts payable 1,097,869 953,534 Air traffic liability 1,469,092 1,287,434 Salaries, wages and benefits 253,793 246,336 Insurance premiums payable 7,672 24,411 Taxes payable 29,749 44,418 Federal tax installment payment program 9,749 9,772 Financial instruments (Note 15) 41,612 48,522 Other current liabilities 169,093 151,696
Total current liabilities 3,620,933 3,334,357 Non-current liabilities
Loans and financing (Note 12) 3,292,213 2,921,653 Financial instruments (Note 15) 310,331 378,415 Deferred income taxes (Note 11) 351,931 326,911 Federal tax installment payment program (Note 11) 100,580 105,431 Provision for tax, civil and labor risk (Note 20) 80,539 73,198 Other non-current liabilities 341,598 343,041
Total non-current liabilities 4,477,192 4,148,649 Equity
Issued capital (Note 13) 2,204,884 2,163,377 Capital reserve 1,901,083 1,898,926 Treasury shares (Note 13) (13,781) (2,745) Other comprehensive loss (Note 13) (135,869) (11,192) Accumulated losses (1,090,952) (1,214,756)
2,865,365 2,833,610
Total liabilities and equity 10,963,490 10,316,616
The accompanying notes are an integral part of these financial statements.

5
Azul S.A. Interim consolidated statements of operations (Unaudited) Three months ended June 30, 2018 and 2017 (In thousands of Brazilian reais, except income (loss) per share)
For the three months ended June 30,
2018 2017
Operating revenue
Passenger revenue 1,905,723 1,484,309 Other revenue 112,153 238,947
Total revenue 2,017,876 1,723,256 Operating expenses
Aircraft fuel (563,003) (415,916) Salaries, wages and benefits (354,705) (310,808) Aircraft and other rent (361,043) (290,628) Landing fees (141,084) (116,320) Traffic and customer servicing (92,682) (83,367) Sales and marketing (77,562) (68,627) Maintenance materials and repairs (146,499) (129,293) Depreciation and amortization (84,543) (80,576) Other operating expenses, net (Note 16) (404,274) (122,793)
(2,225,395) (1,618,328)
Operating income (207,519) 104,928 Financial result (Note 17)
Financial income 11,376 26,194 Financial expense (93,141) (137,974) Financial instruments, net 300,087 (53,267) Foreign currency exchange, net (152,664) 6,756
65,658 (158,291) Result from related parties transactions, net (Note 8) 122,780 8,880
Net income before income tax and social contribution (19,081) (44,483) Income tax and social contribution (Note 11) 292 (173) Deferred income tax and social contribution (Note 11) (26,217) 10,709
Net income (45,006) (33,947)
Basic net income per common share - R$ (Note 14) (0.00) (0.00) Diluted net income per common share - R$ (Note 14) (0.00) (0.00) Basic net income per preferred share - R$ (Note 14) (0.13) (0.10) Diluted net income per preferred share - R$ (Note 14) (0.13) (0.10)
The accompanying notes are an integral part of these financial statements.
6
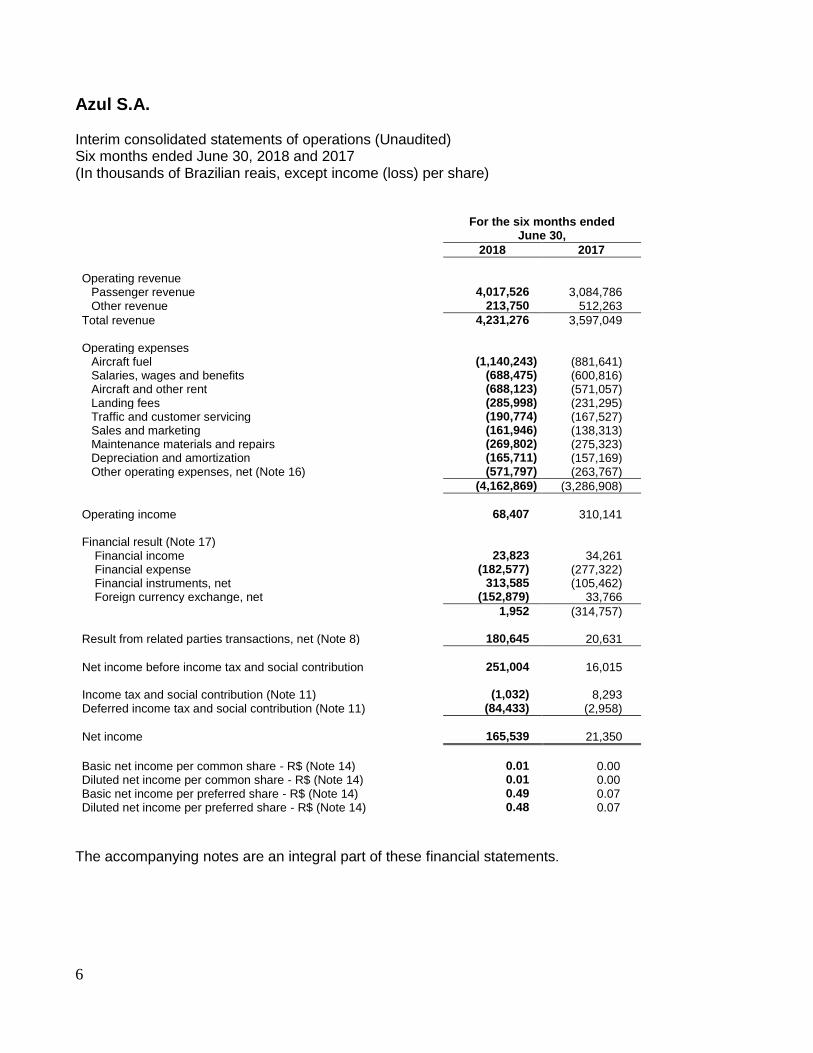
Azul S.A. Interim consolidated statements of operations (Unaudited) Six months ended June 30, 2018 and 2017 (In thousands of Brazilian reais, except income (loss) per share)
For the six months ended June 30,
2018 2017
Operating revenue
Passenger revenue 4,017,526 3,084,786 Other revenue 213,750 512,263
Total revenue 4,231,276 3,597,049 Operating expenses
Aircraft fuel (1,140,243) (881,641) Salaries, wages and benefits (688,475) (600,816) Aircraft and other rent (688,123) (571,057) Landing fees (285,998) (231,295) Traffic and customer servicing (190,774) (167,527) Sales and marketing (161,946) (138,313) Maintenance materials and repairs (269,802) (275,323) Depreciation and amortization (165,711) (157,169) Other operating expenses, net (Note 16) (571,797) (263,767)
(4,162,869) (3,286,908)
Operating income 68,407 310,141 Financial result (Note 17)
Financial income 23,823 34,261 Financial expense (182,577) (277,322) Financial instruments, net 313,585 (105,462) Foreign currency exchange, net (152,879) 33,766
1,952 (314,757) Result from related parties transactions, net (Note 8) 180,645 20,631
Net income before income tax and social contribution 251,004 16,015 Income tax and social contribution (Note 11) (1,032) 8,293 Deferred income tax and social contribution (Note 11) (84,433) (2,958)
Net income 165,539 21,350
Basic net income per common share - R$ (Note 14) 0.01 0.00 Diluted net income per common share - R$ (Note 14) 0.01 0.00 Basic net income per preferred share - R$ (Note 14) 0.49 0.07 Diluted net income per preferred share - R$ (Note 14) 0.48 0.07
The accompanying notes are an integral part of these financial statements.

7
Azul S.A. Interim consolidated statements of other comprehensive income, (Unaudited) Six months ended June 30, 2018 and 2017 (In thousands of Brazilian reais)
For the three months ended June 30,
For the six months ended June 30,
2018 2017 2018 2017
Net income (loss) (45,006) (33,947) 165,539 21,350 Other comprehensive income to be reclassified to
profit or loss in subsequent periods: Changes in fair value of cash flow hedges, net of tax (126,708) 18,706 (124,677) 19,331
Total comprehensive income (loss) (171,714) (15,241) 40,862 40,681
The accompanying notes are an integral part of these financial statements.

8
Azul S.A. Interim consolidated statements of changes in equity Six months ended June 30, 2018 and 2017 (Unaudited) (In thousands of Brazilian reais)
Issued capital
Capital Reserve
Treasury shares
Cash flow hedge reserve
Accumulated losses Total
December 31, 2016 1,488,601 1,290,966 - (33,785) (1,743,795) 1,001,987
Profit for the period - - - - 21,350 21,350 Other comprehensive income - - - 19,331 - 19,331
Total comprehensive income - - - 19,331 21,350 40,681
Issued capital (Note 13) 661,500 646,479 - - - 1,307,979 Share issuance costs (Note 13) - (68,970) - - - (68,970) Share-based payment expense (Note 19) - 6,497 - - - 6,497
June 30, 2017 2,150,101 1,874,972 - (14,454) (1,722,445) 2,288,174
Issued capital
Capital reserve
Treasury shares
Cash flow hedge reserve
Accumulated losses Total
December 31, 2017 2,163,377 1,898,926 (2,745) (11,192) (1,214,756) 2,833,610
Impact of adoption of IFRS 9 (Note 3) - - - - (416) (416)
Impact of adoption of IFRS 15 (Note 3) - - - - (41,319) (41.319)
January 1, 2018 2,163,377 1,898,926 (2,745) (11,192) (1,256,491) 2,791,875
Profit for the period - - - - 165,539 165,539
Other comprehensive income - - - (124,677) - (124,677)
Total comprehensive income - - - (124,677) 165,539 40,862
Issuance of shares due exercise of stock options (Note 13) 41,507 (10,622) - - - 30,885
Treasury shares (Note 13) - - (11,036) - - (11,036)
Share-based payment expense (Note 19) - 12,779 - - - 12,779
June 30, 2018 2,204,884 1,988,324 (13,781) (135,869) (1,090,952) 2,865,365
The accompanying notes are an integral part of these financial statements.

9
Azul S.A.
Interim consolidated statements of cash flows (Unaudited) Six months ended June 30, 2018 and 2017 (In thousands of Brazilian reais)
For the six months ended June 30,
2018 2017
Cash flows from operating activities Net income for the period 165,539 21,350
Adjustments to reconcile net loss to cash flows provided by (used in) operating activities Depreciation and amortization 165,711 157,169 Write-off of fixed assets and intangibles 21,358 25,193 Results unrealized from financial instruments (509,513) 31,015 Share-based payment expenses 12,779 6,497 Exchange (gain) and losses on assets and liabilities denominated in foreign currency 93,857 (38,179) Interest (income) and expenses on assets and liabilities 90,755 144,505 Deferred income tax and social contribution 84,433 67,179 Allowance for doubtful accounts 2,133 (119) Provision for tax, civil and labor risks (Note 20) 37,415 37,886 Provision for inventory 1,308 (6,695) Loss (profit) on sale of property and equipment (Note 10) 174,237 (5,515)
Changes in operating assets and liabilities Trade and other receivables, net (264,026) (105,238) Inventories (22,380) (15,818) Security deposits and maintenance reserves (95,495) (87,139) Prepaid expenses (5,765) 6,505 Recoverable taxes (64,083) (42,810) Other assets (36,329) (22,760) Accounts payable 111,767 (151,409) Salaries, wages and employee benefits 7,457 36,051 Insurance premiums payable (16,739) (18,093) Taxes payable (14,669) (32,329) Federal installment payment program (3,847) (3,234) Air traffic liability 119,050 29,474 Provision taxes, civil and labor risks (Note 20) (30,074) (40,011) Other liabilities 23,329 (1,928) Interest paid (105,531) (159,477)
Net cash (used) provided by operating activities (57,323) (167,930)
Cash flows from investing activities
Short and long term investment Acquisition of short-term investments (1,346,161) (1,404,599)) Disposal of short-term investments 1,673,893 900,218
Restricted investments, net 5,083 47,991 Proceeds from sale of property and equipment 198,657 112,632 Acquisition of intangibles (33,936) (26,511) Acquisition of property and equipment (Note 10) (392,154) (343,153)
Net cash used in investing activities 105,382 (686,911)
Cash flows from financing activities
Debentures Proceeds 500,000 197,133 Repayment (83,574) -
Loans and financing Proceeds 98,940 183,285 Repayment (648,434) (798,232)
Redemption of preferred shares - (44,655) Issued capital - 1,254,763 Issuance of shares due exercise of stock options (Note 13) 30,885 - Treasury shares (Note 13) (11,036) - Related parties (Note 8) 76,949 (328) Proceeds from sale and leaseback 11,889 -
Net cash provided by financing activities (24,381) 791,966
Exchange gain and (losses) on cash and cash equivalents 62,964 14,625 Net (decrease) increase in cash and cash equivalents 86,642 (48,250) Cash and cash equivalents at the beginning of the period 762,319 549,164
Cash and cash equivalents at the end of the period 848,961 500,914
The accompanying notes are an integral part of these financial statements.

Azul S.A. Notes to the unaudited interim condensed consolidated financial statements June 30, 2018 (In thousands of Brazilian reais, except when otherwise indicated)
10
1. Operations Azul S.A. (“Azul”) is a corporation headquartered at Av. Marcos Penteado de Ulhôa Rodrigues, 939, in the city of Barueri, in the state of São Paulo, Brazil. Azul was incorporated on January 3, 2008 and is a holding company for providers of airline passenger and cargo services. Azul and its subsidiaries are collectively referred to as the “Company”.
Azul Linhas Aéreas Brasileiras S.A. (“ALAB”), a 100% owned subsidiary incorporated on January
3, 2008, has operated passenger and cargo air transportation in Brazil since beginning operations
on December 15, 2008. Canela Investments LLC (“Canela”), a 100% owned special purpose
entity, headquartered in the state of Delaware, United States of America, was incorporated on
February 28, 2008, to acquire aircraft outside of Brazil and lease them to ALAB.
The Company’s shares are traded on the BM&FBOVESPA and American Depositary Share
(“ADS”) on the New York Stock Exchange (“NYSE”).
The consolidated financial statements are comprised of the individual financial statements of the
entities as presented below:
% equity interest
Entities Main activities Country of
incorporation June 30, 2018 December 31,
2017
Azul Linhas Aéreas Brasileiras S.A. (ALAB) Airline operations Brazil 100.0% 100.0% Azul Finance LLC (a) Aircraft financing United States 100.0% 100.0% Azul Finance 2 LLC (a) Aircraft financing United States 100.0% 100.0% Blue Sabiá LLC (a) Aircraft financing United States 100.0% 100.0% ATS Viagens e Turismo Ltda. (a) Package holidays Brazil 99.9% 99.9% Azul SOL LLC (a) Aircraft financing United States 100.0% 100.0% Azul Investment LLP (a) Group financing United States 100.0% 100.0% Fundo Garoupa (b) Exclusive investment fund Brazil 100.0% 100.0% Fundo Safira (a) Exclusive investment fund Brazil 100.0% 100.0% Fundo Azzurra (a) Exclusive investment fund Brazil 100.0% 100.0% Canela Investments LLC (Canela) (a) (c) Aircraft financing United States 100.0% 100.0% Canela 336 LLC (d) Aircraft financing United States 100.0% 100.0% Canela 407 LLC (d) Aircraft financing United States 100.0% 100.0% Canela 429 LLC (d) Aircraft financing United States 100.0% 100.0% Canela Turbo Three LLC (d) Aircraft financing United States 100.0% 100.0% Daraland S.A. (a) Holding Uruguay 100.0% 100.0% Encenta S.A. (Azul Uruguai) (e) Airline operations Uruguay 100.0% 100.0% TudoAzul S.A. Loyalty programs Brazil 100.0% 100.0% (a) Azul’s investment is held indirectly through ALAB. (b) Azul’s investment is held 1% directly and 99% through ALAB. (c) Transfer of ownership from Azul to ALAB on December 1, 2017. (d) ALAB’s investments are held indirectly through Canela. (e) Investments are held indirectly through Daraland.

Azul S.A. Notes to consolidated financial statements June 30, 2018 (In thousands of Brazilian reais, except when otherwise indicated)
11
Secondary International Offering by Hainan Airlines Holding Co., Ltd ("HNA")
On June 29, 2018, the Company announced the liquidation of the public offering of secondary
distribution of 58,138,005 preferred shares of the Company in an international offering. The
preferred shares were offered directly and in the form of US depositary shares, or ADSs, each
representing three preferred shares. It is an international public offer of exclusively secondary
distribution, there was no concession of any type of preference or priority to the current
shareholders of the Company for the acquisition of the ADSs, nor dilution of the equity position.
The international offer price was US$16.15 per ADS.
The international offer represented the sale of all the shares issued by the Company and held by
HNA, except for one remaining share after the formation of the ADSs, which HNA will dispose of
after the conclusion of the offer.
Senior notes
On October 19, 2017, Azul Investments LLP priced an offering of US$400.0 million aggregate
principal amount of 5.875% senior unsecured notes due in 2024. This transaction is part of Azul’s
liability management strategy and net proceeds were used for debt refinancing and general
corporate purposes.
On December 14, 2017, the total amount referring to the Senior Notes was exchanged from Dollars
to Reais by means of swap derivative contracts and exchange options to protect interest expenses,
and through exchange options to protect the principal amount against foreign currency fluctuations
up to an exchange rate of R$4.7500 for US$1.00.
Strategic Partnerships
Empresa Brasileira de Correios e Telégrafos (Brazil’s Postal Service) On December 20, 2017, ALAB and Correios (Brazil’s Postal Service) signed a memorandum of understanding for the creation of a private integrated logistics solutions company, Azul will own a 50.01% stake of the new company and Correios the remaining 49.9%. With the existing demand already served by ALAB and Correios, the new company anticipates handling approximately 100 thousand tons of cargo per year. Both companies expect the new company to generate cost savings, operating efficiency and revenue gains while improving the service offer to the consumer. The memorandum of understanding was submitted to the Brazilian authorities and appropriate government bodies for approval. Only after regulatory approval, the new company will be established and its activities are expected to initiate by the end of 2018. Azul expects to consolidate this entity and its related operations.
Azul S.A. Notes to consolidated financial statements June 30, 2018 (In thousands of Brazilian reais, except when otherwise indicated)
12
2. Basis of preparation of financial statements The interim condensed consolidated financial statements for the six months ended June 30, 2018 were approved and authorized for issuance during the executive board of directors meeting held on August 7, 2018. The interim condensed consolidated financial statements were prepared in accordance with the IAS 34, Interim Financial Reporting, as issued by the International Accounting Standards Board (IASB). The interim condensed consolidated financial statements were prepared in Brazilian Reais, which is the functional currency of the Company. The Company has adopted, when applicable, all standards and interpretations issued by the IASB, the International Financial Reporting Standards (IFRS) and Interpretations Committee that were in effect on June 30, 2018. The interim condensed consolidated financial statements were prepared using the historical cost basis, except for the valuation of certain financial instruments which are measured at fair value.
3. Significant accounting policies
The accounting policies adopted in the preparation of the interim condensed consolidated financial statements are consistent with those used in the preparation of the Company’s annual consolidated financial statements for the year ended December 31, 2017 except for the new standards adopted on January 1, 2018, presented in notes 3.1, 3.2 and 3.3. The interim condensed consolidated financial statements do not include all the information and disclosures required in the annual financial statements, and should be read in conjunction with the Company’s annual financial statements at December 31, 2017.
3.1 Financial instruments
3.1.1. Non-derivative financial assets—initial recognition and subsequent measurement Initial recognition Non-derivative financial assets, other than trade receivables, are measured at initial recognition at their fair value plus (in the case of a financial asset not at fair value through profit or loss) transaction costs that are directly attributable to the acquisition of the financial asset. Trade receivables that do not contain a significant financing component are measured at initial recognition at the transaction price.

Azul S.A. Notes to consolidated financial statements June 30, 2018 (In thousands of Brazilian reais, except when otherwise indicated)
13
Classification of financial instruments Under CPC 48 / IFRS 9 classification and measurement of financial instruments is based on the business model of the Company to manage financial assets and on the contractual cash flow characteristics of the financial assets. Financial assets are classified in three categories: (i) measured at amortized cost, (ii) measured at fair value through other comprehensive income, and (iii) measured at fair value through profit or loss Financial assets are classified in the categories above upon initial recognition when the Company is required to assess how the Company manages the asset or group of assets and to determine whether the contractual cash flows are solely payments of principal or interest on the principal amount outstanding. Business model assessment The business model assessment requires classification of the asset in one of the business models defined by IFRS 9. The business models reflect how the Company manages the financial asset in order to generate cash flows on the basis of scenarios that the Company reasonably expects to occur. In order to perform the business model assessment the Company has grouped financial assets in portfolios of assets that are managed together.
Management Objective Measurement
Collect contractual payments over the life of the instrument Amortized cost
Collecting contractual cash flows and selling financial assets Fair value through other comprehensive
income
Held for trading or measured in a fair value basis Fair value through profit or loss
Contractual cash flow characteristics assessment The contractual cash flow characteristic assessment requires to determine whether the contractual cash flows of the assets consists solely of payment of principal or interest on the principal amount outstanding “SPPI”. When the asset cash flows consist solely of SPPI it will be subsequently measured following the result of the business model assessment. However when the asset cash flows do not consists solely of SPPI it will be measured at fair value through profit of loss irrespective of the result of the business model assessment. Subsequent measurement of the financial assets of the Company The criteria for subsequent measurement of the financial assets of the Company is presented below:

Azul S.A. Notes to consolidated financial statements June 30, 2018 (In thousands of Brazilian reais, except when otherwise indicated)
14
At amortized cost – Restricted investments, Trade and other receivables other than credit card receivables, receivables from related parties, security deposits and maintenance reserves;
At fair value through other comprehensive income - Credit card receivables; and
At fair value thorough profit of loss- Financial instruments, short-term investments and the TAP Convertible Bonds presented under long-term investments Method of adoption The Company has opted not to restate comparative information for periods before January 1, 2018. Financial assets for such comparative periods are recognized and measured following the criteria defined by IAS 39 and presented in Note 3.1 to the annual financial statements for the year ended December 31, 2017.
3.1.2.Non-derivative financial liabilities—initial recognition and subsequent measurement Initial recognition Non-derivative financial liabilities are measured at initial recognition at its fair value less transaction costs that are directly attributable to the acquisition of the financial asset. Subsequent measurement Non-derivative financial liabilities are subsequently measured at amortized cost unless they are held for trading or when they qualify for and are designated upon initial recognition to be recognized at fair value through profit or loss “fair value option”. Non-derivative interest-bearing financial liabilities are subsequently measured at amortized cost, using the effective interest rate method. Amortized cost is calculated by taking into account any discount or premium on acquisition and fees or costs that are an integral part of the effective interest rate. The effective interest rate amortization is included as finance expenses in the statement of operations. All non-derivative financial liabilities of the Company at the reporting date are measured at amortized cost and consists of loans and financings and accounts payable, except for those designated as hedge item in a fair value hedge. Classification and measurement until December 31, 2017 The Company has opted not to restate comparative information for periods before January 1, 2018. Financial liabilities for such comparative periods are recognized and measured following the criteria defined by IAS 39 and presented in Note 3.1 to the annual financial statements for the year ended December 31, 2017.

Azul S.A. Notes to consolidated financial statements June 30, 2018 (In thousands of Brazilian reais, except when otherwise indicated)
15
3.1.3.Financial instruments and hedge accounting– Initial recognition and subsequent measurement Initial recognition and subsequent measurement The Company uses financial instruments, such as currency forward contracts options and NDF to hedge itself against the currency risk, heating oil Swaps to hedge against the price risk and interest rate swaps to hedge against the interest risk. Iinancial instruments not designated as hedge instruments are recognized initially at fair value on the date when the derivative contract is entered into and are subsequently remeasured at fair value. The accounting for subsequent changes in fair value to derivatives that are hedge instruments in a hedge accounting depends of the nature of the item being hedged and the type of hedge relationship designated. Derivatives are presented as financial assets when the instrument's fair value is positive and as financial liabilities when fair value is negative. Any gains or losses from changes in the fair value of derivatives not designated to hedge accounting during the year are recorded directly in profit or loss. The accounting treatments for derivatives designated as hedge instruments are presented on the next topic.
These gains or losses are then recorded in profit or loss when the hedge item affects the profit or loss. Hedge accounting The following classifications are used for hedge accounting purposes:
Fair value hedge when hedging against exposure to changes in fair value of recognized assets or liabilities, or an unrecognized firm commitment.
Cash flow hedge when providing protection against changes in cash flows that is attributable to a particular risk associated with a recognized asset or liability or a highly probable forecast transaction which may affect the income or foreign currency risk in an unrecognized firm commitment.
On inception of a hedge relationship, the Company formally designates and documents the hedge relationship to which the Company wishes to apply hedge accounting, as well as the Company’s objective and risk management strategy for undertaking the hedge. The documentation includes identification of the hedge instrument and item or transaction being hedged, the nature of the risk being hedged and risks excluded, and effectiveness assessment approach proving the existence of economic relationship between the hedged item and hedge instrument, that credit risk does not dominate the value changes that results from that economic relationship and how the hedge ratio is determinated in a prospective basis, including possible sources of ineffectiveness by performing a qualitative (when the critical terms of hedged item and hedge instrument match or are closely aligned - as nominal amount, maturity and underlying) or quantitative.
Azul S.A. Notes to consolidated financial statements June 30, 2018 (In thousands of Brazilian reais, except when otherwise indicated)
16
Hedges that meet the criteria for hedge accounting are accounted for as follows: Fair value hedge The gain or loss resulting from changes in fair value of a hedge instrument (for derivative hedge instrument) or the foreign exchange component of its carrying amount measured in accordance with IAS 21 (for non-derivative hedge instrument) is recognized in profit or loss or other comprehensive income, if the hedging instruments hedges an equity instrument for which the Company has elected to present changes in fair value in other comprehensive income. The gain or loss on the hedged item shall adjust the carrying amount of the hedged item (for on-balance item) and be recognized in profit of loss. If the hedged item is derecognized, the unamortized fair value is recognized immediately in profit or loss.
When an unrecognized firm sales commitment is designated as a hedged item in a hedge relationship, the change in fair value of the firm sales commitment attributable to the hedge risk is recognized as a financial asset or as a financial liability, with the recognition of a corresponding gain or loss in the statements of operations. The accumulated balance in the statement of financial position resulting from successive changes in fair value of the firm sales commitment attributable to the hedged risk will be transferred to the balance of the hedged item upon its recognition (recognition of balance of accounts payable or accounts receivable). The Company holds interest rate swaps to hedge against its exposure to changes in fair value of some of its aircraft financing (Note 15). Cash flow hedge The effective portion of a gain or loss from the hedge instrument is recognized directly in other comprehensive income. When the hedge ratio is not aligned, giving rise to ineffectiveness, but the risk management strategy is the same the Company shall rebalance the hedge ratio in order to meet the hedge effectiveness requirements. Any gain or loss remaining from the hedge instrument (as result of the rebalancing) is a ineffectiveness and shall be recorded in profit or loss. The amounts recorded in other comprehensive loss are transferred to the statement of operations in tandem with the hedged transaction impact on profit or loss. For example, when a forecasted sale occurs or when the income or expense being hedged is recognized. When the hedged item is the cost of a non-financial asset or non-financial liability, the amounts recorded as other comprehensive loss are transferred to initial carrying amount of the non-financial assets or liability.

Azul S.A. Notes to consolidated financial statements June 30, 2018 (In thousands of Brazilian reais, except when otherwise indicated)
17
The Company shall discontinue hedge accounting prospectively only when the hedging relationship ceases to meet the qualifying criteria (after taking into account any rebalancing of the hedging relationship). If the occurrence of the forecast transaction or firm commitment is no longer likely, the amounts previously recognized in other comprehensive loss are transferred to the statement of operations. If the hedge instrument expires or is sold, terminated, exercised without replacement or rollover, or if its designation as a hedge is revoked, any cumulative gain or loss previously recognized in comprehensive loss remains deferred in other comprehensive loss until the forecast transaction or firm commitment affects profit or loss. The Company uses swap contracts to hedge against its exposure to the risk of changes in floating rates related to its finance lease transactions and currency option to hedge the notional amount of debt denominated in foreign currency. Current and non-current classification Derivative instruments that are not classified as effective hedge instruments are classified as current, non-current or segregated into current or non-current portions based on the underlying contractual cash flows.
When the Company expects to maintain a derivative as an economic hedge (and do not apply hedge accounting) for a period exceeding 12 months after the statement of financial position date, the derivative is classified as non-current (or segregated into current and non-current portions), consistent with the classification of the underlying item.
Embedded derivatives that are not closely related to the host contract are classified in a manner consistent with the cash flows of the host contract.
Derivative instruments that are designated as and are effective hedge instruments are classified consistently with the classification of the underlying hedged item. The derivative instrument is segregated into current and non-current portion only if a reliable allocation can be made.
3.1.4.Derecognition of financial assets and financial liabilities
Financial assets Financial assets, or where appropriate, part of a financial asset or part of a group of similar financial assets, are derecognized when:
The rights to receive cash flows from the assets have expired; or
The Company has transferred their rights to receive cash flows of the assets and (a) the Company has substantially transferred all the risks and benefits of the assets, or (b) the Company has not transferred or retained substantially all the risks and benefits related to the assets, but has transferred control of the assets.

Azul S.A. Notes to consolidated financial statements June 30, 2018 (In thousands of Brazilian reais, except when otherwise indicated)
18
When the Company has transferred their rights to receive cash flows from assets and has not transferred all the risks and rewards relating to an asset, that asset is recognized to the extent of the continuing involvement of the Company. In this situation, the Company also recognizes an associated liability. The transferred assets and associated liabilities are measured based on the rights and obligations that the Company has retained. Continuing involvement that takes the form of a guarantee on the assets transferred is measured by the original book value of the assets or the maximum payment that may be required from the Company, whichever is lower. Financial liabilities A financial liability is derecognized when the obligation under the liability is discharged, cancelled or expires. When an existing financial liability is replaced by another from the same lender with substantially different terms, or the terms of an existing liability are substantially modified, such an exchange or modification is treated as the derecognition of the original liability and the recognition of a new liability, with the difference in the corresponding book values recognized in the statements of operations.
3.1.5. Offsetting of financial instruments Financial assets and financial liabilities are offset and the net amount reported in the consolidated statement of financial position if there is a currently enforceable legal right to offset the recognized amounts and there is an intention to settle on a net basis, to realize the assets and settle the liability simultaneously.
3.1.6. Impairment of financial assets The Company recognizes an allowance for losses on financial assets for expected credit losses in line of IFRS 9 requirements. Trade receivables and contract assets The Company uses the simplified approach allowed by IFRS 9 to estimate the allowance for losses on trade receivables. Under the simplified approach the Company estimates expected credit losses over the life of the receivables at the reporting date (which in all cases have a contractual life shorter than 12 months) since they result from transactions with customers and do not have a significant financing component.

Azul S.A. Notes to consolidated financial statements June 30, 2018 (In thousands of Brazilian reais, except when otherwise indicated)
19
In estimating expected credit losses the Company considers credit card receivables as receivables with a low risk of default. Considering that it has a relevant history of no credit risk losses on such receivables and that it does not expect losses during the lifetime of those receivables no allowance has been recognized for those assets. In order to estimate expected credit losses for other trade receivables and contract assets the Company aggregates such assets in portfolios of receivables which share credit risk characteristics. The Company currently use portfolios to estimate credit losses. For each portfolio the Company measures the historic rate of losses (net of recoveries) on defaulted receivables over a relevant historic period considering that, generally, a receivable has defaulted when is more than 90 days overdue. Such historical default rate for the portfolio is subsequently adjusted to incorporate an estimate of the impact of future economic conditions on past historic rates. The estimate of the impact of future economic conditions is based on the observed correlation of defaults with macroeconomic indicators. The Company periodically reviews the historic period over which defaults are measured and, the relevant macroeconomic indicator to use and how the correlate with the experience of defaults. Other financial assets For other financial assets the Company assesses individually for each counterparty whether there has been a significant increase in the credit risk of the asset since initial recognition or not. Such determination is based on information already available to the Company. If and when credit risk ratings of the counterparty are publicly available such information is also taken into consideration. For financial assets with no significant increase in credit risk an estimate is made of expected credit losses that result from default events on a financial instrument that are possible within the 12 months after the reporting date while for those assets with a significant increase in credit risk the estimate is made of losses that result from default events that are possible over the lifetime of the asset. An allowance for loss is recognized when the Company estimates that the risk of credit losses during the period. In measuring the allowance the Company considers at least three scenarios (standard, optimistic and pessimistic) and for each an estimate of cash inflows (including cash inflows from collateral) is made. The resulting estimated cash flows for each scenario is discounted to present value to the reporting date and are probability-weighted based on a judgmental determination of the probability of each scenario.
3.1.7. Fair value of financial instruments
The fair value of financial instruments actively traded in organized financial markets is determined based on prices quoted in the market at close of business at the statement of financial position date, not including the deduction of transaction costs.

Azul S.A. Notes to consolidated financial statements June 30, 2018 (In thousands of Brazilian reais, except when otherwise indicated)
20
The fair value of financial instruments for which there is no active market is determined using valuation techniques. These techniques can include use of recent market transactions, references to the current fair value of other similar instruments, analysis of discounted cash flows, or other valuation models. An analysis of the fair value of financial instruments and more details about how they are calculated is described in Note 15.
3.2. Revenue from contracts with customers
Passenger tickets revenue is recognized upon effective rendering of the transportation service. Travel related services revenue is recognized when the related transportation service is provided being classified as passenger revenue. Travel related services include baggage fees, administrative charges, upgrades and other travel related charges. Tickets and related services sold and not used, corresponding to advanced ticket and related services sales (Air traffic liability) are recorded in current liabilities. Tickets expire in one year. The Company recognizes revenue for tickets and travel related services sold upon the departure of the related scheduled flight and for tickets and travel related services sold that are expected to expire unused (brakeage). The Company estimates the value of future refunds and exchanges, net of forfeitures for all unused tickets, once the flight date has already passed. These estimates are based on historical data and experience from past events. The estimated future refunds and exchanges included in the Air traffic liability are compared monthly to actual refunds and exchange activities in order to monitor if the estimated amount of future refunds and exchanges is reasonable. Revenue is segregated as follows:
For the three months ended For the six months ended
June 30, 2018
June 30, 2017 (Pro forma) June 30, 2018
June 30, 2017 (Pro forma)
Operating revenue Tickets revenue 1,689,239 1,484,309 3,591,184 3,084,786 Travel related services 216,484 147,844 426,342 337,221
Total passenger revenue 1,905,723 1,632,153 4,017,526 3,422,007
Other revenue 113,197 84,971 214,794 173,466
Total revenue 2,018,920 1,717,123 4,232,320 3,595,473
Azul S.A. Notes to consolidated financial statements June 30, 2018 (In thousands of Brazilian reais, except when otherwise indicated)
21
3.2.1. “TudoAzul” Program
Under the “TudoAzul” program customers accrue points based on the amount spent on tickets flown. The amount of points earned depends on TudoAzul membership status, market, flight, day-of-week, advance purchase, booking class and other factors, including promotional campaigns. The Company recognizes revenue on points that are estimated to expire unused. Points in general expire two years after the date earned regardless of activity in the account. Upon the sale of a ticket, the Company recognizes a portion of the ticket sales as revenue when the transportation service occurs and defers a portion corresponding to the points earned under the TudoAzul Program, in accordance with IFRIC 13, Customer Loyalty Programs in the account “Air Traffic Liabilities”. The Company determines the estimated selling price of the air transportation and points as if each element is sold on a separate basis. The total consideration from each ticket sale is then allocated to each of these elements individually on a pro rata basis. The estimated selling price of points is determined using an equivalent ticket value (“ETV”) approach which is based on the prior 12 months’ weighted average equivalent ticket value of similar fares as those used to settle award redemptions. We sell mileage credits to customers and also to business partners, including co-branded credit cards, financial institutions and other businesses. The related revenue is deferred and recognized as passenger revenue when points are redeemed and the related transportation service occurs, based on the weighted average price of the points sold. In instances where points are redeemed for products, revenue is recognized when products are delivered, net of the costs of the products. Sales of mileage credits are comprised of two components, transportation and marketing. Accordingly, we recognize the marketing component in “other revenue” based on contractual terms. Points awarded or sold and not used are recorded in “Air traffic liability”. The Company recognizes revenue for points sold and awarded that will never be redeemed by program members. The Company estimates such amounts annually based upon the latest available information regarding redemption and expiration patterns.
3.3. New and amended standards and interpretations
The Company applied for the first time certain standards and amendments, which are effective for annual periods beginning on or after 1 January 2018. The Company has not early adopted any other standard, interpretation or amendment that has been issued but is not yet effective.

Azul S.A. Notes to consolidated financial statements June 30, 2018 (In thousands of Brazilian reais, except when otherwise indicated)
22
The nature and the effect of these changes are disclosed below.
IFRS 9 – Financial instruments In July 2014, the IASB issued the final version of IFRS 9 – Financial Instruments, which superseded IAS 39 – Financial Instruments: Recognition and Measurement. IFRS 9 is applicable for annual periods beginning on or after January 1, 2018. Except for hedge accounting, retrospective application is required, but comparative information is not required. The Company adopted the new standard on January 1, 2018. The Company has opted not to present comparative information showing retroactively the results from the adoption of IFRS 9. Classification and measurement The new standard sets out new requirements for the classification and measurement of financial assets and liabilities as detailed in Note 3.1. The Company classified its financial assets and liabilities in accordance with the business models established in IFRS 9 and evaluated the contractual terms of those instruments not measured at fair value through profit or loss. As result of the new classification and measurement requirements credit card receivables previously measured at amortized cost are measured at fair value through comprehensive income. The following table presents for financial assets and liabilities at January 1, 2018 the original measurement category under IAS 39 and the current measurement category under IFRS 9.
Original under IAS 39 Current under IFRS 9
Measurement category
Assets
Short-term investments Held for trading Fair value through profit of loss
Restricted investments Fair value through profit of loss Amortized cost
Trade and other receivables Loans and receivables Amortized cost except for credit
card receivables which are
measured at fair value through
other comprehensive income
Financial instruments Held for trading except those
under cash flow hedge accounting
Fair value through profit of loss
except those under cash flow
hedge accounting
Non-current related parties Loans and receivables Amortized cost
Long-term investments (TAP Convertible
Bond)
Hybrid instrument recorded on its
entity at fair value through profit or
loss
Fair value through profit of loss
Non-current restricted investments Fair value through profit of loss Amortized cost
Security deposits and maintenance
reserves
Loans and receivables Amortized cost
Non-current Financial instruments Held for trading except those
under cash flow hedge accounting
Fair value through profit of loss
except those under cash flow
hedge accounting

Azul S.A. Notes to consolidated financial statements June 30, 2018 (In thousands of Brazilian reais, except when otherwise indicated)
23
Original under IAS 39 Current under IFRS 9
Liabilities
Loans and financings Amortized cost Amortized cost
Accounts payable Amortized cost Amortized cost
Financial instruments Held for trading except those
under cash flow hedge accounting
Fair value through profit of loss
except those under cash flow
hedge accounting
Non-current loans and financings Amortized cost Amortized cost
Non-current accounts payable Amortized cost Amortized cost
Non-current financial instruments Held for trading except those
under cash flow hedge accounting
Fair value through profit of loss
except those under cash flow
hedge accounting
All changes result exclusively from the change in measurement criteria on transition to IFRS 9. No financial asset or liability was designated as measured at fair value through profit or loss under IAS 39 and the Company did not make any such designation upon adoption of IFRS 9. Impairment As further detailed in Note 3.1 the new impairment model requires the recognition of allowance for credit losses on assets not measured at fair value through profit or loss based on expected credit losses (ECL) rather than only incurred credit losses as was the case under IAS 39.
The estimate of the expected loss is based on the Company’s historical credit losses, adjusted for management’s expectations about future economic conditions for the relevant period. The application of the requirements of impairment under IFRS 9 resulted in an increase in the allowance for doubtful accounts of R$631 at January 1, 2018 which corresponds on its entirety to trade receivables (other than credit card receivables) measured at amortized cost. Hedge accounting On Abril 1, 2018, the Company opted to apply the new requirements of IFRS 9 related to hedge accounting. These requirements require that hedge accounting relationships reflects the Company's risk management objectives and strategies, the effectiveness assessment has a qualitative and forward-looking approach and prohibit voluntary discontinuation of hedge accounting as well. The new standard allows the designation of net exposure related to group of similar instruments (not permitted on the previous standard IAS 39), separate the forward element of forward contracts as well as the foreign currency basis spread and temporal element of options to be recorded in other comprehensive income (when they are part of a hedge accounting relationship).

Azul S.A. Notes to consolidated financial statements June 30, 2018 (In thousands of Brazilian reais, except when otherwise indicated)
24
IFRS 15 – Revenue from Contracts with Customers IFRS 15, issued in May 2014, establishes a new constant five-step model, which will be applied to revenues from customer contracts. Under IFRS 15, revenues are recognized in an amount that reflects the consideration to which an entity expects to be entitled in exchange for the transfer of goods or services to a customer. The new revenue standard replaced all previous revenue recognition requirements under IFRS. The Company adopted the new standard on the effective date January 1, 2018, using the modified adoption method. The new standard requires the reclassification of ancillary revenues, such as baggage fees, administrative charges, upgrades and other travel related charges that were previously classified in other revenue, to passenger revenue. These ancillary fees are directly related to passenger travel and will no longer be considered distinct performance obligations separate from the passenger travel component. In this context, such ancillary revenues, which were previously recognized when sold, are now recognized when transportation is provided. In addition, the adoption of IFRS 15 slightly increases the rate used to account TudoAzul Program credits. We previously analyzed the market prices of airfares offered to travel agencies with high volumes of transactions to establish the selling price of our mileage credits. Considering the guidance in the new standard we adopted the Equivalent Ticket Price method as described on 3.2.1 above. In the tables below, we show the pro forma balances of prior periods to provide for the comparability of the balances, reflecting the adjustments of the impact of the adoption of IFRS 9 and IFRS 15 if the Company had previously adopted them.
Three months ended June 30, 2017
As Previously Reported Adjustments
Under new standards
Income Statement: Passenger Revenue 1,484,309 147,844 1,632,153 Other Revenue 238,947 (153,976) 84,971 Other Operating Expenses (122,793) (29) (122,822) Deferred income tax and social contribution 10,709 1,467 12,176 Net loss (33,947) (4,696) (38,643) Basic net loss per preferred share - R$ (0.10) (0.02) (0.12) Diluted net loss per preferred share - R$ (0.10) (0.01) (0.11)
Six months ended
June 30, 2017
As Previously Reported Adjustments
Under new standards
Income Statement: Passenger Revenue 3,084,786 337,221 3,422,007 Other Revenue 512,263 (338,797) 173,466 Other Operating Expenses (263,767) (572) (264,339) Deferred income tax and social contribution (2,958) 511 (2,447) Net Income 21,350 (1,637) 19,713 Basic net income per preferred share - R$ 0.07 - 0.07 Diluted net income per preferred share - R$ 0.06 - 0.06

Azul S.A. Notes to consolidated financial statements June 30, 2018 (In thousands of Brazilian reais, except when otherwise indicated)
25
December 31, 2017
As Previously Reported Adjustments
Under new standards
Balance Sheet: Trade and other receivables 914,428 631 915,059 Air traffic liability 1,287,434 62,603 1,350,037 Deferred income taxes 326,911 (21,499) 305,412 Accumulated losses (1,214,756) (41,735) (1,256,491)
Amendments to IAS 7 Statement of Cash Flows: Disclosure Initiative The amendments require entities to provide disclosure of changes in their liabilities arising from financing activities, including both changes arising from cash flows and non-cash changes (such as foreign exchange gains or losses). Amendments to IAS 12 Income Taxes: Recognition of Deferred Tax Assets for Unrealized Losses The amendments clarify that an entity needs to consider whether tax law restricts the sources of taxable profits against which it may make deductions on the reversal of deductible temporary difference related to unrealized losses. Furthermore, the amendments provide guidance on how an entity should determine future taxable profits and explain the circumstances in which taxable profit may include the recovery of some assets for more than their carrying amount.
Annual Improvements Cycle - 2014-2016 Amendments to IFRS 12 Disclosure of Interests in Other Entities: Clarification of the scope of disclosure requirements in IFRS 12 The amendments clarify that the disclosure requirements in IFRS 12, other than those in paragraphs B10–B16, apply to an entity’s interest in a subsidiary, a joint venture or an associate (or a portion of its interest in a joint venture or an associate) that is classified (or included in a disposal group that is classified) as held for sale.
3.4. Standards issued but not yet effective
IFRS 16 - Leases
IFRS 16 was issued in January 2016 and establishes the principles for the recognition, measurement, presentation and disclosure of leases and requires lessees to account for all leases under a single model in the balance sheet, similar to accounting for finance leases. IFRS 16 requires that, for the majority of leases, the lessor will record an asset related to the right of use of the leased item, and a liability related to the lease. It is expected that the adoption of this standard will have a material impact on the Company’s financial position, with the potential increase in assets representing the right of use of the leased item and a corresponding liability, since it has 118 aircraft, 16 engines and 3 simulators classified for as operating leases.

Azul S.A. Notes to consolidated financial statements June 30, 2018 (In thousands of Brazilian reais, except when otherwise indicated)
26
IFRS 16 is effective for annual periods beginning on or after January 1, 2019. IFRIC 23 – Uncertainty over income tax treatments In June 2017, the IASB issued IFRIC 23, which clarifies the application of requirements in IAS 12 “Income Taxes” when there is uncertainty over the acceptance of income tax treatments by the tax authority. The interpretation clarifies that, if it is not probable that the tax authority will accept the income tax treatments, the amounts of tax assets and liabilities shall be adjusted to reflect the best resolution of the uncertainty. IFRIC 23 will be effective for annual periods beginning on or after January 1, 2019, and the Company does not expect significant impacts from the adoption of this standard. The Company continue to evaluate this and the other impact to the financial statements due to the adoption of the new standard.
4. Financial risk management objectives and policies
The main financial liabilities of the Company, other than derivatives, are loans, debentures and accounts payable. The main purpose of these financial liabilities is to finance operations as well as finance the acquisition of aircraft. The Company has trade accounts receivable and other accounts receivable that result directly from its operations.
The Company also has investments available for trading and contracts derivative transactions such as currency forwards, options and swaps in order to reduce the exposure to foreign exchange fluctuations.
The Company's senior management supervises the management of market, credit and liquidity risks. All activities with derivatives for risk management purposes are carried out by experts with skills, experience and appropriate supervision. It is the Company’s policy not to enter in to derivatives transactions for speculative purposes.
a) Market risk
Market risk is the risk that the fair value of future cash flows of a financial instrument will fluctuate because of changes in market prices. Market risk consists of three types of risk: interest rate risk, currency risk and other price risk, such as equity price risk and commodity risk. Financial instruments exposed to market risk include loans payable, deposits, financial instruments measured at fair value through profit or loss and financial instruments.
Azul S.A. Notes to consolidated financial statements June 30, 2018 (In thousands of Brazilian reais, except when otherwise indicated)
27
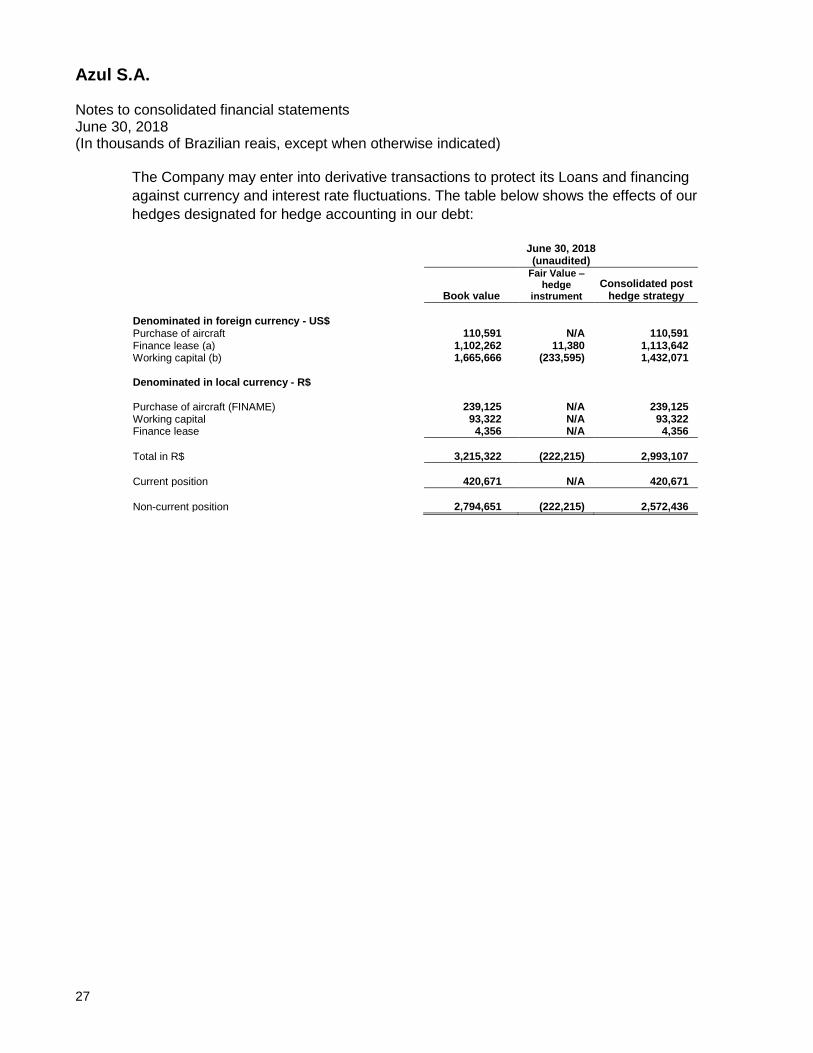
The Company may enter into derivative transactions to protect its Loans and financing
against currency and interest rate fluctuations. The table below shows the effects of our
hedges designated for hedge accounting in our debt:
June 30, 2018 (unaudited)
Book value
Fair Value – hedge
instrument Consolidated post
hedge strategy
Denominated in foreign currency - US$ Purchase of aircraft 110,591 N/A 110,591 Finance lease (a) 1,102,262 11,380 1,113,642 Working capital (b) 1,665,666 (233,595) 1,432,071 Denominated in local currency - R$ Purchase of aircraft (FINAME) 239,125 N/A 239,125 Working capital 93,322 N/A 93,322 Finance lease 4,356 N/A 4,356
Total in R$ 3,215,322 (222,215) 2,993,107
Current position 420,671 N/A 420,671
Non-current position 2,794,651 (222,215) 2,572,436

Azul S.A. Notes to consolidated financial statements June 30, 2018 (In thousands of Brazilian reais, except when otherwise indicated)
28
a) The table below shows the indebtedness related to finance lease denominated in foreign currency, designated as hedge accounting, considering the effects of the derivative instruments (exchanging the exposure for local currency) contracted by the Company:
Risk Type of hedge Hedged Item Nominal amount Hedge Instrument Nominal amount
June 30, 2018 (unaudited)
Carrying amount - hedge item
Fair Value – hedge instrument
Debt Considering
Hedge
Finance lease
Interest rate Cash Flow Hedge
Floating interest rate - US Libor6M US$ 83,5 million
Interest rate Swap (receives US Libor6M & pays fixed 6% to 6,5%) US$ 83,5 million 147,107 11,380 158,487
Foreign exchange and interest rate N/A N/A N/A N/A N/A 955,155 - 955,155
Total
1,102,262 11,380 1,113,642
b) The table below shows the indebtedness related to working capital denominated in foreign currency, designated as hedge accounting, considering the effects of
the derivative instruments (exchanging the exposure for local currency) contracted by the Company:
Risk Type of hedge Hedged Item Nominal amount Hedge Instrument Nominal amount
June 30, 2018 (unaudited)
Carrying amount - hedge item
Fair Value – hedge instrument
Debt Considering
Hedge
1) Senior Notes Azul LLP
Foreign exchange risk
Cash Flow Hedge
Principal US$ on Senior Notes Azul LLP US$ 400 million
Currency Options - Floor 3,2865 Cap 4,7500 US$ 400 million 1,529,909 (216,344) 1,313,565
2) Proceeds in foreign currency
Interest rate swap
Fair value hedge
Principal & Interest on 4.131 Transaction US$30 million
IRS - Interest Rate Swap (receives US Libor3M + spread 1,034% & pays 108% CDI) 98,940 116,289 (17,251) 99,038
3) Other
Foreign exchange risk N/A N/A US$5 million N/A N/A 19,468 - 19,468
Total
1,665,666 (233,595) 1,432,071

Azul S.A. Notes to consolidated financial statements June 30, 2018 (In thousands of Brazilian reais, except when otherwise indicated)
29
a.1) Interest rate risk Interest rate risk is the risk that the fair value of future results of a financial instrument fluctuates due to changes in market interest rates. The exposure of the Company to the risk of changes in market interest rates refers primarily to long-term obligations subject to variable interest rates.
The Company manages interest rate risk by monitoring the future projections of interest rates on its loans, financing and debentures as well as on its operating leases. To mitigate this risk, the Company has used derivative instruments aimed at minimizing any negative impact of variations in interest rates.
Sensitivity to interest rates
The table below shows the sensitivity to possible changes in interest rates, keeping all other variables constant in the Company’s income before taxes that are impacted by loans payable subject to variable interest rates. For the sensitivity analysis, the Company utilized the following assumptions:
LIBOR based debt: weighted average interest rate of 4.57%% p.a.
CDI based debt: weighted average interest rate of 6.87% p.a.
We estimated the impact on profit and loss and equity for the six months ended June 30, 2018 resulting from variation of 25% and 50% on the weighted average rates, as shown below: 25% -25% 50% -50%
Interest expense 22,931 (22,931) 45,862 (45,862)
a.2) Currency risk
Currency risk is the risk that the fair value of future dollar denominated commitments vary according to the fluctuation of the foreign exchange rate. The exposure of the Company to changes in exchange rates relates primarily to the U.S dollar denominated loans and financing, net of investments in the U.S. dollar, and also to operating expenses originated in U.S. dollar. The Company is also exposed to changes in the exchange rate of the Euro through its investment in the TAP Convertible Bonds (Note 15). The Company manages its currency risk by using financial instruments seeking to hedge up to twelve months of its projected non-operational activities.

Azul S.A. Notes to consolidated financial statements June 30, 2018 (In thousands of Brazilian reais, except when otherwise indicated)
30
The Company continuously monitors the net exposure in foreign currency and, when deemed appropriate, enters into arrangements to hedge the projected non-operating cash flow for up to 12 months to minimize its exposure. Adittionally, the Company may enter into longer than 12 months derivative financial instruments to protect itself against currency and/or interest rate risks related to “Loans and financing”
The Company's nominal foreign exchange exposure is shown below:
Exposure to U.S. dollar Exposure to Euro
June 30, 2018
(Unaudited) December 31, 2017
June 30, 2018
(Unaudited December 31, 2017
Assets Cash and cash equivalents and short-term
Investments 235,231 278,227 - - Security deposits and maintenance reserves 1,542,057 1,237,391 - - Long-term investments (Note 15) - - 1,090,710 835,957 Financial instruments 116,289 49,530 - - Other assets 399,001 314,609 - -
Total assets 2,292,578 1,879,757 1,090,710 835,957
Liabilities
Accounts payable (362,109) (255,646) - - Loans and financing (*) (2,878,519) (2,609,704) - - Other liabilities (192,384) (164,949) - -
Total liabilities (3,433,012) (3,030,299) - -
Derivatives (NDF) – notional 2,156,356 1,223,960 - -
Net exposure 1,015,922 73,418 1,090,710 835,957
(*) As of June 30, 2018, US dollar denominated working capital loans totaling R$1,646,198 were swapped to Brazilian Reais, resulting in
an total debt in Reais of R$2,602,101.
Sensitivity to exchange rates
At June 30, 2018, the Company used the closing exchange rate of R$3.8558/US$1.00 and R$4.5032/EUR1.00. We present below a sensitivity analysis considering a variation of 25% and 50% over the existing rates: Exposure in US$ 25% -25% 50% -50% R$4.8198/US$ R$2.8919/US$ R$5.7837/US$ R$1.9279/US$
Effect on exchange rate variation 253,980 (253,980) 507,961 (507,961)
Exposure in EUR 25% -25% 50% -50% R$5.6290/EUR R$3.3774/EUR R$6.7548/EUR R$2.2516/EUR
Effect on exchange rate variation 272,677 (272,677) 545,355 (545,355)
Azul S.A. Notes to consolidated financial statements June 30, 2018 (In thousands of Brazilian reais, except when otherwise indicated)
31
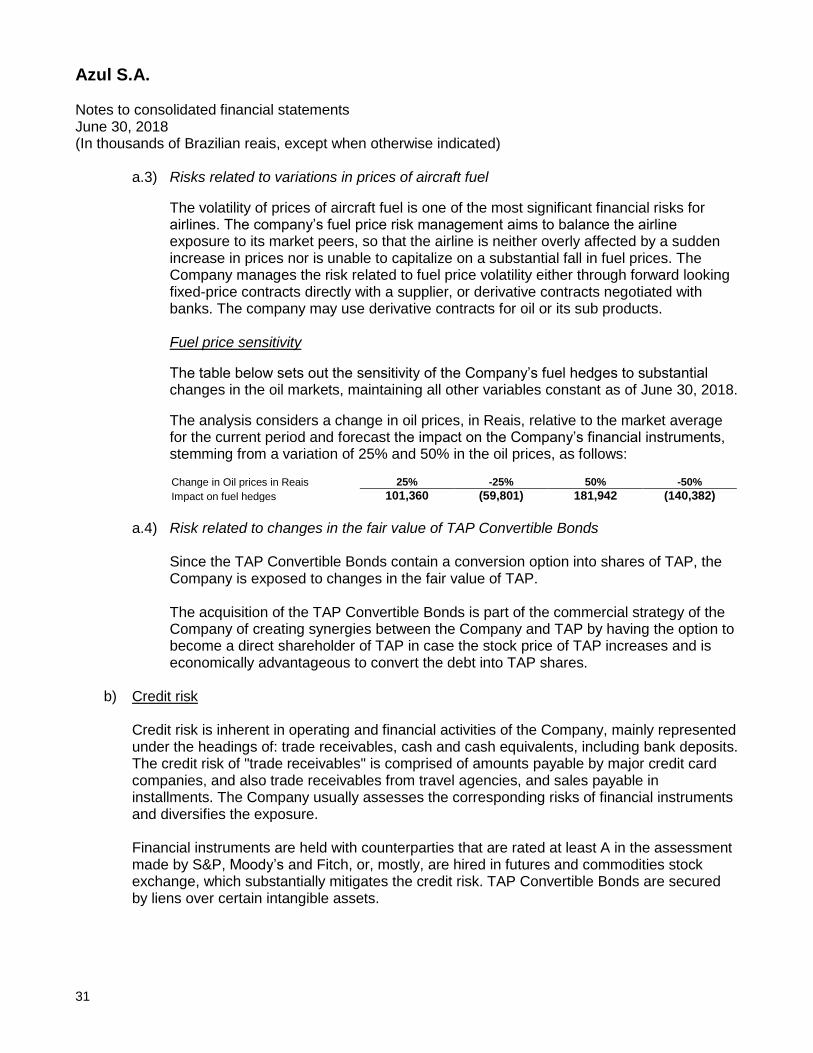
a.3) Risks related to variations in prices of aircraft fuel
The volatility of prices of aircraft fuel is one of the most significant financial risks for airlines. The company’s fuel price risk management aims to balance the airline exposure to its market peers, so that the airline is neither overly affected by a sudden increase in prices nor is unable to capitalize on a substantial fall in fuel prices. The Company manages the risk related to fuel price volatility either through forward looking fixed-price contracts directly with a supplier, or derivative contracts negotiated with banks. The company may use derivative contracts for oil or its sub products.
Fuel price sensitivity
The table below sets out the sensitivity of the Company’s fuel hedges to substantial changes in the oil markets, maintaining all other variables constant as of June 30, 2018.
The analysis considers a change in oil prices, in Reais, relative to the market average for the current period and forecast the impact on the Company’s financial instruments, stemming from a variation of 25% and 50% in the oil prices, as follows: Change in Oil prices in Reais 25% -25% 50% -50%
Impact on fuel hedges 101,360 (59,801) 181,942 (140,382)
a.4) Risk related to changes in the fair value of TAP Convertible Bonds
Since the TAP Convertible Bonds contain a conversion option into shares of TAP, the Company is exposed to changes in the fair value of TAP.
The acquisition of the TAP Convertible Bonds is part of the commercial strategy of the Company of creating synergies between the Company and TAP by having the option to become a direct shareholder of TAP in case the stock price of TAP increases and is economically advantageous to convert the debt into TAP shares.
b) Credit risk
Credit risk is inherent in operating and financial activities of the Company, mainly represented under the headings of: trade receivables, cash and cash equivalents, including bank deposits. The credit risk of "trade receivables" is comprised of amounts payable by major credit card companies, and also trade receivables from travel agencies, and sales payable in installments. The Company usually assesses the corresponding risks of financial instruments and diversifies the exposure.
Financial instruments are held with counterparties that are rated at least A in the assessment made by S&P, Moody’s and Fitch, or, mostly, are hired in futures and commodities stock exchange, which substantially mitigates the credit risk. TAP Convertible Bonds are secured by liens over certain intangible assets.

Azul S.A. Notes to consolidated financial statements June 30, 2018 (In thousands of Brazilian reais, except when otherwise indicated)
32
c) Liquidity risk Liquidity risk takes on two distinct forms: market and cash flow liquidity risk. The first is related to current market prices and varies in accordance with the type of asset and the markets where they are traded. Cash flow liquidity risk, however, is related to difficulties in meeting the contracted operating obligations at the agreed dates. As a way of managing the liquidity risk, the Company invests its funds in liquid assets (government bonds, CDBs, and investment funds with daily liquidity), and the Cash Management Policy establishes that the Company’s and its subsidiaries’ weighted average debt maturity should be higher than the weighted average maturity of the investment portfolio.
The schedule of financial liabilities held by the Company is as follows:
June 30, 2018 (Unaudited) Immediate
Until 6 months
7 to 12 months 1 to 5 years
More than 5 years Total
Loans and financing 187,711 187,250 167,343 1,501,453 1,790,760 3,834,517 Accounts payable 719,416 316,169 62,284 - - 1,097,869 Liabilities from derivative
transaction 12,444 - 29,168 322,580 (12,249) 351,943 Provisions - - - 80,530 9 80,539
919,571 503,419 258,795 1,904,563 1,778,520 5,364,868
Capital management The Company’s assets may be financed through equity or third-party financing. If the Company opts for equity capital it may use funds from contributions by shareholders or through selling its equity instruments.
The use of third-party financing is an option to be considered mainly when the Company believes that the cost would be less than the return generated by an acquired asset. It is important to ensure that the Company maintains an optimized capital structure, provides financial solidity while providing for the viability of its business plan. As a capital-intensive industry with considerable investment in assets with a high aggregated value, it is natural for companies in the aviation sector to report a high degree of leverage. The Company manages capital through leverage ratios, which is defined by the Company as net debt divided by the sum of net debt and total equity. Management seeks to maintain this ratio at levels equal to or lower than industry levels. Management includes in the net debt the loans and financing (includes debentures) less cash and cash equivalents, restricted cash, short and long-term investments and current and noncurrent restricted investments.

Azul S.A. Notes to consolidated financial statements June 30, 2018 (In thousands of Brazilian reais, except when otherwise indicated)
33
The Company’s capital structure is comprised of its net indebtedness defined as total loans and financing (includes debentures) and operating leases net of cash and cash equivalents, restricted cash, short and long-term investments and current and noncurrent restricted investments. Capital is defined as equity and net indebtedness. The Company is not subject to any externally imposed capital requirements.
The Company defines total capital as total net equity and net debt as detailed below:
June 30, 2018 (Unaudited)
December 31, 2017
Equity 2,865,365 2,833,610
Cash and cash equivalents (Note 5) (848,961) (762,319) Short-term investments (Note 6) (725,287) (1,036,148) Long-term investments (Note 15) (1,090,710) (835,957) Restricted financial investments (Note 7) (*) (548) (8,808) Loans and financing (Note 12) (*) 3,834,517 3,489,887
Net debt 1,169,011 846,655
Total capital 4,034,376 3,680,265
(*) Includes current and non-current.
5. Cash and cash equivalents Cash and cash equivalents are comprised of the following:
June 30, 2018
(Unaudited) December 31,
2017
Cash and bank deposits 239,763 160,429 Cash equivalents
Bank Deposit Certificate – CDB 202,838 290,829 Investments funds 406,360 311,061
848,961 762,319
The balances of cash and bank deposits represent amounts deposited in checking accounts with Brazilian and offshore banks. The CDB investments are indexed to the Brazilian Interbank Deposit Certificate (“CDI”) and are repayable on demand.
Investment funds are comprised of CDB’s investments and repurchase agreements, denominated in Reais, with financial institutions (deposit certificates).
Cash equivalents investments are classified as financial assets at fair value through profit or loss.

Azul S.A. Notes to consolidated financial statements June 30, 2018 (In thousands of Brazilian reais, except when otherwise indicated)
34
6. Short term investments Investments are comprised of:
June 30, 2018 (Unaudited)
December 31, 2017
Other short-term investments 99,421 57,363 Investment funds 625,866 978,785
725,287 1,036,148
Investment funds are comprised of Brazilian government bonds and bank notes, denominated in Reais, with financial institutions (deposit certificates) and debentures issued by B and BB+ risk rated companies bearing an accumulated average interest rate of 100% of CDI – Interbank Deposit Certificate rate. Brazilian government bonds are comprised of National Treasury Bills (“LTN”), National Financial Bills (“LFT”) and National Treasury Notes (“NTN”).
Short-term investments are classified as financial assets at fair value through profit or loss.
7. Restricted investments Restricted financial investments are comprised of deposits to guarantee some of our stand-by letters of credit for aircraft operating lease and are managed within the business model of receiving contractual payments over a life time, which is classified as cost amortized, which were invested in floating rate CDBs – Bank Certificate Deposits and DI – Investments linked to the Interbank Deposit interest rate. The return on these investments varies from 100% to 101% of the CDI rate.
8. Related parties a) Compensation of key management personnel
Key management personnel include board of director members, officers and executive committee members. The compensation paid or payable to officers and directors services is as follows:
For the three months
ended June 30, For the six months
ended June 30,
2018 2017 2018 2017
(Unaudited) (Unaudited)
Salaries and wages 4,611 5,139 8,585 8,882 Bonus 7,263 6,724 7,263 6,724 Share-based compensation and
restricted share units plans 5,126 5,875 11,161 9,426
17,000 17,738 27,009 25,032
Azul S.A. Notes to consolidated financial statements June 30, 2018 (In thousands of Brazilian reais, except when otherwise indicated)
35
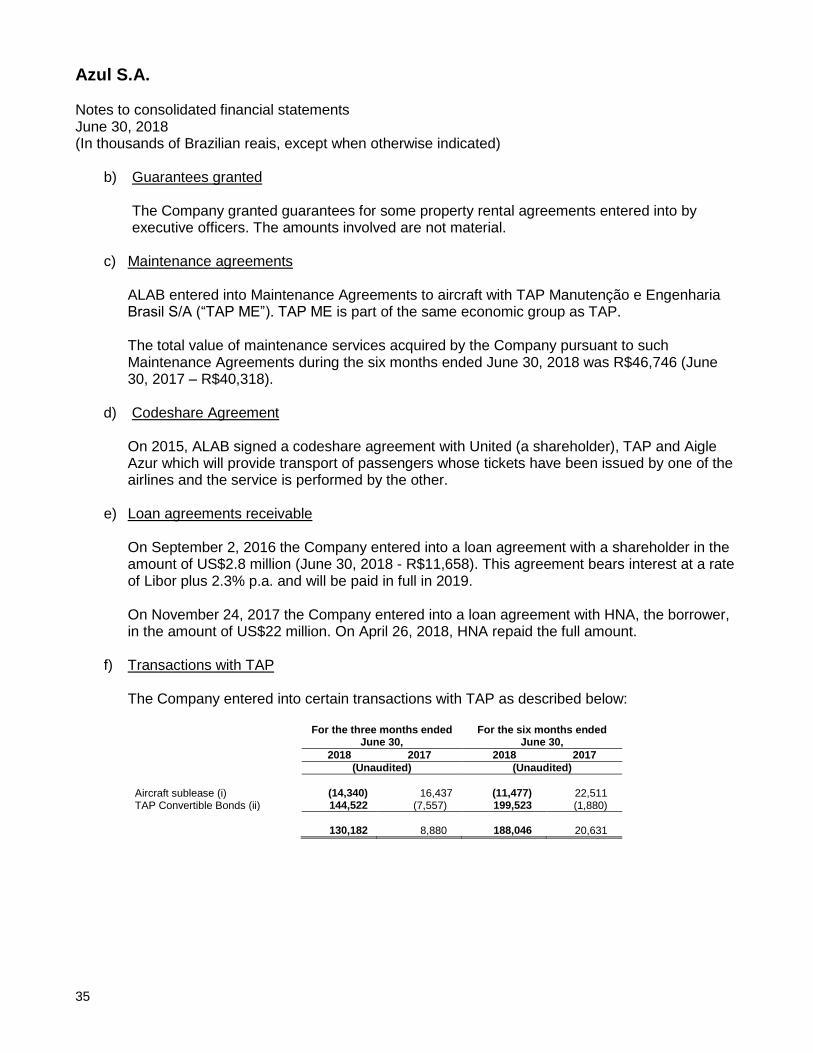
b) Guarantees granted The Company granted guarantees for some property rental agreements entered into by executive officers. The amounts involved are not material.
c) Maintenance agreements
ALAB entered into Maintenance Agreements to aircraft with TAP Manutenção e Engenharia Brasil S/A (“TAP ME”). TAP ME is part of the same economic group as TAP. The total value of maintenance services acquired by the Company pursuant to such Maintenance Agreements during the six months ended June 30, 2018 was R$46,746 (June 30, 2017 – R$40,318).
d) Codeshare Agreement
On 2015, ALAB signed a codeshare agreement with United (a shareholder), TAP and Aigle Azur which will provide transport of passengers whose tickets have been issued by one of the airlines and the service is performed by the other.
e) Loan agreements receivable
On September 2, 2016 the Company entered into a loan agreement with a shareholder in the amount of US$2.8 million (June 30, 2018 - R$11,658). This agreement bears interest at a rate of Libor plus 2.3% p.a. and will be paid in full in 2019. On November 24, 2017 the Company entered into a loan agreement with HNA, the borrower, in the amount of US$22 million. On April 26, 2018, HNA repaid the full amount.
f) Transactions with TAP The Company entered into certain transactions with TAP as described below:
For the three months ended June 30,
For the six months ended June 30,
2018 2017 2018 2017
(Unaudited) (Unaudited)
Aircraft sublease (i) (14,340) 16,437 (11,477) 22,511 TAP Convertible Bonds (ii) 144,522 (7,557) 199,523 (1,880)
130,182 8,880 188,046 20,631

Azul S.A. Notes to consolidated financial statements June 30, 2018 (In thousands of Brazilian reais, except when otherwise indicated)
36
i. Aircraft sublease In March 2016, the Company subleased fifteen aircraft to its related party TAP. Seven of the fifteen leases had been executed at a time when the market for regional aircraft was higher than when the related seven subleases were executed. As a result, although the Company believes that the rates in these seven subleases represented approximate market rates at the time of their execution, the Company will receive from TAP an amount lower than the amount that the Company has to pay under the related leases. This difference considering the total term of sublease contracts discounted to its net present value was R$144,715 in June 30, 2018 (December 31, 2017 – R$68,949) and recorded as a provision for the obligations under onerous leases, as required by IAS 37 “Provisions, Contingent Liabilities and Contingent Assets”, representing the remaining amount of the future unavoidable costs under the leases. The loss was recognized in the six months ended June 30, 2018 in the “result from related party transaction, net” line in the statement of operations due to assumptions at fair value.
In July 2017, the Company subleased two additional aircraft to TAP. These aircraft are owned by the Company and the rates in these leases represented market rates at the time of their execution. Additionally, two of the fifteen initially subleased aircraft were returned by TAP, resulting in a total of fifteen aircraft subleased to TAP as of June 30, 2018. For the fifteen subleases, over the six months ended June 30, 2018, amounts received from TAP from the subleases amounted to R$52,562 (June 30, 2017 – R$57,992), and amounts paid to the lessors of the related aircrafts totaled R$60,508 (June 30, 2017 – R$73,821).
ii. TAP Convertible Bonds
On March 14, 2016, the Company acquired series A convertible bonds issued by TAP (the
“TAP Convertible Bonds”) for an amount of €90 million. The TAP Convertible Bonds are
convertible, in whole or in part at, the option of Azul into new shares representing the
share capital of TAP benefiting from enhanced preferential economic rights (the “TAP
Shares”). Upon full conversion, the TAP Shares will represent 6.0% of the total and voting
capital of TAP, with the right to receive dividends or other distributions corresponding to
41.25% of distributable profits of TAP.
The option is exercisable starting in July 2016. The TAP Convertible Bonds mature 10
years from their issuance and bear interest at an annual rate of 3.75% until June 20, 2016
and at rate of 7.5% thereafter. Accrued interest remains unpaid until the earlier of the
maturity date or early redemption of the bonds.

Azul S.A. Notes to consolidated financial statements June 30, 2018 (In thousands of Brazilian reais, except when otherwise indicated)
37
TAP has the right to early redeem the TAP Convertible Bonds if not yet converted and upon the earlier of (i) occurrence of an IPO, or (ii) 4 years from issuance of the TAP Convertible Bonds provided that TAP should be in compliance with certain financial covenants. The TAP Convertible Bonds will be redeemed at their principal amount together with the accrued unpaid interest.
The TAP Convertible Bonds, as well as the option to convert them into TAP Shares, were classified as a single financial asset recorded at changes in the fair value through profit or loss, under “Result from related parties transactions, net”, classified in “Long term investments”. Until December 2017, HNA had an option to obtain 30% of the economic interest in the TAP bonds. In December 2017, the option expired unexercised thus the associated liability was reversed in December 2017.
9. Security deposits and maintenance reserves
June 30, 2018 (Unaudited)
December 31, 2017
Security deposits 221,534 180,992 Maintenance reserve deposits 1,347,847 1,078,135
1,569,381 1,259,127
Security deposits and maintenance reserve deposits are denominated in US dollars and adjusted for changes to foreign exchange rates. Security deposits are related to aircraft lease contracts and will be refunded to the Company when the aircraft is returned at the end of the lease agreement. Maintenance reserve deposits are paid under certain aircraft leases to be held as collateral in advance of the performance of major maintenance activities and are reimbursable upon completion of the related maintenance event, under certain conditions.
As of June 30, 2018 maintenance reserve deposits are likely to be recoverable as they are lower than the expected cost of the related next maintenance event that the reserves are intended to collateralize. During the six months ended June 30, 2018 the Company recognized a write-off of R$12,925 (December 31, 2017 - R$9,638) in the “Maintenance materials and repairs” in the income statements line item for maintenance reserve deposits that are not likely to be reimbursed in relation to aircraft that went through their last maintenance event prior to their return.
The Company replaced some of its security deposits and maintenance reserves deposits with bank guarantees, and was refunded an amount of R$6,151 and R$3,644, respectively as of June 30, 2018 (June 30, 2017 - R$1,562 and R$8,326 respectively).

Azul S.A. Notes to consolidated financial statements June 30, 2018 (In thousands of Brazilian reais, except when otherwise indicated)
38
Presented below are the changes in the security deposits and maintenance reserve deposits balance:
Maintenance
reserves deposits
Security deposits Total
Balance at December 31, 2016 858,233 219,772 1,078,005
Additions 291,429 25,815 317,244 Refunds from sublease (*) - 3,275 3,275 Write-offs (9,638) - (9,638) Refunds/returns (81,013) (69,441) (150,454) Foreign exchanges variations 19,124 1,571 20,695
Balance at December 31, 2017 1,078,135 180,992 1,259,127
Additions 140,055 21,972 162,027
Write-offs (12,925) - (12,925)
Refunds/returns (44,719) (8,888) (53,607)
Foreign exchanges variations 187,301 27,458 214,759
Balance at June 30, 2018 1,347,847 221,534 1,569,381
(*) refers to the net amount received and refunds from TAP in relation to security deposits of subleased aircraft.
10. Property and equipment
Property and equipment are mainly comprised of “aircraft and engines” and aircraft equipment. “Aircraft and engines” refers to owned aircraft and capitalized heavy maintenance and structural checks related to owned aircraft.
During the six months ended June 30, 2018, the Company entered into a sale and leaseback transaction on an owned engine. The loss associated with the sale and leaseback transactions which resulted in finance leases amounted to R$6,730 was recorded in “Other liabilities” and will be recognized in the statement of operations over the average lease term of 120 months. During the six months ended June 30, 2018, the Company entered into four aircraft sale transactions resulting in a net loss of R$79,312, recognized in “Other operating expenses, net”. Assets held for sale consists of three aircraft which carrying amount will be recovered principally through a sale transaction rather than through continuing use. These aircraft are being sold as part of the Company’s strategy to renew its fleet. The difference between the historical cost, net of depreciation and the net realizable value of these assets generated a loss in the amount of R$94,925 which was recognized under "Other operating expenses, net". During the six months ended June 30, 2017, the Company entered into a sale and leaseback transaction on owned aircraft. All aircraft was subsequently leased back by the Company under operating lease agreements. The gain associated with the sale and leaseback transaction of R$5,515 was recognized in “Other operating expenses, net”.

Azul S.A. Notes to consolidated financial statements June 30, 2018 (In thousands of Brazilian reais, except when otherwise indicated)
39
a) Breakdown
June 30,2018 (Unaudited
December 31, 2017
Cost Accumulated depreciation Net amount Net amount
Leasehold improvements 120,930 (55,240) 65,690 71,591 Equipment and facilities 120,397 (74,127) 46,270 45,722 Vehicles 1,085 (848) 237 297 Furniture and fixtures 18,079 (9,572) 8,507 8,473 Aircraft equipment 1,186,145 (296,820) 889,325 647,963 Aircraft and engines 2,293,640 (395,238) 1,898,402 2,356,880 Advance payments for acquisition of aircraft 148,903 - 148,903 148,903 Construction in progress 87,244 - 87,244 45,706
3,976,423 (831,845) 3,144,578 3,325,535
b) Changes in property and equipment balances are as follows
Cost
December 31,
2017 Acquisitions Disposals/ Write-offs Transfers June 30, 2018
Leasehold improvements 117,903 2,696 - 331 120,930 Equipment and facilities 112,800 7,807 (210) - 120,397 Vehicles 1,085 - - - 1,085 Furniture and fixtures 17,190 889 - - 18,079 Aircraft equipment 908,659 212,737 (29,077) 93,826 1,186,145 Aircraft and engines 2,770,171 100,698 (606,080) 28,851 2,293,640 Advance payments for acquisition of aircraft 148,903 - - - 148,903 Construction in progress 45,706 168,186 (3,640) (123,008) 87,244
4,122,417 493,013 (639,007) - 3,976,423
Accumulated depreciation
December 31,
2017 Depreciation for the period
Disposals/ Write-offs Transfers June 30, 2018
Leasehold improvements (46,312) (8,928) - (55,240) Equipment and facilities (67,078) (7,070) 21 - (74,127) Vehicles (788) (60) - (848) Furniture and fixtures (8,717) (855) - (9,572) Aircraft equipment (260,696) (42,397) 6,273 - (296,820) Aircraft and engines (413,291) (83,579) 101,632 - (395,238)
(796,882) (142,889) 107,926 - (831,845)
For owned aircraft, we employ the deferral method that results in the capitalization of heavy maintenance and structural checks. Under this method, the cost of major maintenance and structural checks are capitalized and amortized as a component of depreciation and amortization expense until the next major maintenance event. Heavy maintenance and structural checks on aircraft held under operating lease is expensed as incurred, and it is recorded in the “maintenance material and repair” line items.

Azul S.A. Notes to consolidated financial statements June 30, 2018 (In thousands of Brazilian reais, except when otherwise indicated)
40
The next major maintenance and structural check event is estimated based on the average maintenance costs and timing of the next scheduled maintenance event as suggested by the manufacturer and according to the fleet’s historical performance in the Company, and may change based on changes in aircraft utilization and changes in suggested manufacturer maintenance intervals. In addition, these assumptions can be affected by unplanned incidents that could damage a major component to the extent that would require a major maintenance event prior to a scheduled maintenance event. Based on technical analysis and to reflect the Company’s current outlook for the use of its assets, the average useful life of certain engine major maintenance events was extended from five to six years effective in July 1, 2017. The change in useful life was calculated prospectively.
The amortization of the costs of heavy maintenance and structural checks, accounted for under the deferred cost method and the expenses actually incurred, representing total maintenance and repair expenses, are as follows:
For the three months
ended June 30, For the six months ended
June 30,
2018 2017 2018 2017
(Unaudited) (Unaudited)
Amortization of capitalized maintenance costs (10,286) (16,882) (16,265) (31,426) Maintenance materials and repairs (146,499) (129,293) (269,802) (275,323)
(156,785) (146,175) (286,067) (306,749)
As of June 30, 2018, the Company reviewed the impairment indicators and no impairment of property and equipment was recognized as a result of such impairment analysis.
11. Income tax and social contribution
a) Income tax and social contribution (Unaudited)
For the three months
ended June 30, For the six months
ended June 30,
2018 2017 2018 2017
Income/(loss) before income tax and social contribution (19,081) (44,483) 251,004 16.015 Combined tax rate 34% 34% 34% 34%
Income tax and social contribution statutory rate 6,488 15,124 (85,341) (5.445) Adjustments to calculate the effective tax rate:
Exchange differences on foreign subsidiaries 1,847 9,262 (10,040) 7.277 Unrecorded deferred tax on tax loss and on temporary
differences (46,618) (61,490) (26,904) (50.053) Reversal of provisions for uncertain tax provisions (*) - (3,338) - 6.427 Deferred Income Tax on Tax Losses included in the PRT (**) - 52,457 - 52.457 Permanent differences 9,476 (1,862) 26,012 (5.603) Other 2,882 383 10,808 275
Total income tax and social contribution expenses (25,925) 10,536 (85,465) 5.335
Current income tax and social contribution 292 (173) (1,032) 8.293 Deferred income tax and social contribution (26,217) 10,709 (84,433) (2.958)
(25,925) 10,536 (85,465) 5.335

Azul S.A. Notes to consolidated financial statements June 30, 2018 (In thousands of Brazilian reais, except when otherwise indicated)
41
(*) Reversal of income tax provision prescribed considering the five-year statute of limitation (**) Tax Recovery Program (“PRT”)
b) Breakdown of deferred income tax and social contribution
June 30, 2018 (Unaudited)
December 31, 2017
Deferred taxes On temporary differences
Provision for tax, civil and labor risks 27,366 17,746 Deferred revenue of TudoAzul program (116,106) (109,698) Aircraft lease expense (166,334) (233,057) Depreciation of aircraft and engines (27,908) (55,258) Exchange rate (27,894) (11,338) Deferred gain related to aircraft sold 37,818 49,270 Cash flow hedge (*) 60,624 4,994 Fair value of TAP convertible bonds (210,436) (147,418) Provision for onerous contract 22,035 23,442 Financial instruments (107,335) (688) Fair value of aircraft (412) (428) Fair value of slots (27,947) (27,947) Other on business combination fair value adjustment (3,492) (4,276) Others 47,855 41,633
Net deferred tax (liabilities) (492,166) (453,023)
Deferred tax assets on net operating losses 140,235 126,112
Net deferred tax (liabilities) (351,931) (326,911)
(*) Deferred tax recorded in “Other comprehensive income (loss)”
The Company offsets tax assets and liabilities if and only if it has a legally enforceable right to offset current tax assets and current tax liabilities and the deferred tax assets and deferred tax liabilities related to income taxes levied by the same tax authority. The Company has income tax losses that are available indefinitely for offsetting against future taxable profits, as follows:
Deferred income tax assets on tax losses have not been recognized as there is no evidence of recoverability in the near future, except for R$140,235 related to 30% of the deferred tax liability balance as of June 30, 2018 in accordance to the limit provided by the tax law.
June 30, 2018 (Unaudited)
December 31, 2017
Net tax losses 1,937,101 1,940,059
Income tax loss carryforwards (25%) 484,275 485,015 Social contribution negative base tax carryforwards (9%) 174,339 174,605

Azul S.A. Notes to consolidated financial statements June 30, 2018 (In thousands of Brazilian reais, except when otherwise indicated)
42
12. Loans and financing
June 30, 2018 (Unaudited)
December 31, 2017
Loans 3,215,322 3,287,427 Debentures 619,195 202,460
3,834,517 3,489,887 Non-current 3,292,213 2,921,653
Current 542,304 568,234
Interest-bearing loans, financing and debentures are measured at amortized cost, using the effective interest rate method.

Azul S.A. Notes to consolidated financial statements June 30, 2018 (In thousands of Brazilian reais, except when otherwise indicated)
43
12.1. Loans
Consolidated
Fair value of designated
derivatives (*)
Guarantees Interest Final
maturity June 30, 2018 (Unaudited)
December 31, 2017
June 30, 2018
(Unaudited)
Denominated in foreign currency - US$ Purchase of aircraft Chattel mortgage LIBOR plus "spread" between 2.55% and 4.00% p.a. 03/2025 110,591 124,361 N/A
Finance lease (*) Chattel mortgage LIBOR plus spread between 2.05% and 5.96% p.a. 12/2027 1,102,262 1,108,265 11,380
Working capital (*) (a) Receivables of Azul
and cash collateral LIBOR plus fixed interest between 0.88% to 3.50%
p.a. and fixed of 5.90%p.a 04/2024 1,665,666 1,377,078
(233,595)
Denominated in local currency - R$
Purchase of aircraft (FINAME) (**)
Investments and chattel mortgage of aircraft Fixed between 3.50% to 6.50% p.a. 05/2025 239,125 258,432
N/A
Working capital Receivables of Azul 5.0% fixed p.a 07/2021 93,322 412,056 N/A
Finance lease Chattel mortgage CDI plus fixed spread between 1.88% p.a. and
4.91% p.a. 04/2019 4,356 7,235
N/A
Total in R$ 3,215,322 3,287,427 (222,215)
Current position 420,671 405,643 N/A
Non-current position 2,794,651 2,881,784 (222,215)
(*) Ilustrates the effect of hedges designated for hedge accounting, which are detailed in Note 15. The debt position considering the effects of the hedge can be seen on Note 4. (**) FINAME are a special credit line from BNDES (the Brazilian development bank).

Azul S.A. Notes to consolidated financial statements June 30, 2018 (In thousands of Brazilian reais, except when otherwise indicated)
44
a) Senior notes
The Company issued US$400 million in unsecured senior notes in October 2017 at 5.875% per year
and maturity on October 26, 2024. Interest on the notes will be payable semi-annually in arrears on
April 26 and October 26 of each year, beginning on April 26, 2018.
On December 14, 2017, the total amount referring to the Senior Notes was exchanged from Dollars
to Reais by means of swap derivative contracts and exchange options to protect interest expenses,
and through exchange options to protect the principal amount.
As a result of the implementation of this hedge structure, on April 1, 2018, the Senior Notes are protected against foreign currency fluctuations, up to an exchange rate of R$4.7500 for US$1.00, and above this level will be exposed only to the difference between the effective exchange rate and R$ 4.7500. In addition, the Company will benefit from any upside from the devaluation of the Brazilian real in case the exchange rate is bellow R$3.2865 for US$1.00. The options were financed, yielding a total hedging cost of 99.3% of CDI. The result of the hedge recognized in the “Financial instruments” asset and liability line itens and the consolidated debt position including the effect of the hedge is detailed in note 4. The details of this transaction is following:
Options Structure Coupon Payments Principal Payment
Period Apr/2018 to Apr/2019 Oct/2019 to Oct/2024 Oct/2024 Notional US$12 million US$12 million US$400 million Put option bought - 3.2865 N/A Call option bought N/A N/A 3.2865 Call option sold - 4.7500 4.7500
Senior notes Swap
Currency US$ R$
Amount US$400 million R$1,314,600
Interest Fixed Floating
Interest rate 5.875% 99.3% of CDI
b) Long term loans mature as follows:
June 30, 2018 (Unaudited)
December 31, 2017
2019 126,470 292,683 2020 360,999 434,707 2021 232,711 367,149 2022 214,233 195,236 After 2022 1,860,238 1,592,009
2,794,651 2,881,784

Azul S.A. Notes to consolidated financial statements June 30, 2018 (In thousands of Brazilian reais, except when otherwise indicated)
45
c) The following assets serve as guarantees to secure the financing agreements
June 30, 2018 (Unaudited)
December 31, 2017
Property and equipment (carrying value)
used as collateral (Note 10) 1,898,402 2,356,880
12.2. Debentures
Guarantees Interest Final
maturity
June 30, 2018
(Unaudited) December 31, 2017
Eight issue Credit cards receivable CDI + 1.50% p.a. 01/2019 121,267 202,460 Nine issue Credit cards receivable 122% of CDI 12/2021 497,928
Total 619,195 202,460
Current position 121,633 162,591
Non-current position 497,562 39,869
Long term debentures mature as follows:
June 30, 2018 (Unaudited)
December 31, 2017
2019 - 39.869 2020 248,537 - 2021 249,025 -
497,562 39.869
12.3. Finance leases
Future minimum lease payments under finance leases together (included in loans) with the present value of minimum lease payments are as follows:
June 30, 2018 (Unaudited)
December 31, 2017
2018 170,829 219,920 2019 178,214 206,091 2020 176,563 212,614 2021 179,358 159,015 After 2021 443,437 360,182
Total minimum lease payments 1,148,401 1,157,822 Less finance charges (41,783) (42,322)
Present value of minimum lease payments 1,106,618 1,115,500 Less short-term portion 251,350 211,852
Long-term portion 855,268 903,648

Azul S.A. Notes to consolidated financial statements June 30, 2018 (In thousands of Brazilian reais, except when otherwise indicated)
46
Lease agreements under which the Company has substantially all the risks and rewards of ownership were classified as finance leases. Finance leases were capitalized on lease inception at present value of the minimum lease payments. Some finance leases were designated as hedged objects in an effective cash flow hedging relationship. The Company used interest rate swaps to convert the floating US Libor rate to a fixed rate exposure, protecting the volatilities of its future cash flow. The interest rate swaps have the same maturity and common terms as the finance leases that they are hedging. See note 15 for more details.
13. Equity
a) Issued capital and authorized shares, all registered and without par value
Company´s
capital is - R$ Common shares
Preferred shares
At June 30, 2018 (unaudited) 2,204,884 928,965,058 325,992,745 At December 31, 2017 2.163.377 928.965.058 321.753.720
Conversion of shares Each common share entitles its holder to 1 (one) vote in the General Shareholders’ Meeting. Preferred shares of any class are not entitled to vote. Preferred shares have: i) priority of reimbursement of capital upon liquidation; ii) the right to be included in a public offering of the Company for a purchase of shares upon transfer of the Company’s control for the same conditions as the common shareholders and for a price per share equivalent to seventy-five (75) times the price per share paid to the controlling shareholder; iii) in case of the Company’s liquidation, the right to receive amounts equivalent to seventy-five (75) times the price per common share upon splitting of the remaining assets among the shareholders; and iv) the right to receive dividends in an amount equivalent to seventy-five (75) times the price paid per common share.
Issuance of shares and issued capital
i. IPO
On April 10, 2017, the Company approved a capital increase in the total amount of
R$1,323,000 for the subscription of 63,000,000 preferred shares of Azul.
On April 19, 2017, the Company concluded its global initial public offering (“IPO”) of 96,239,837 shares of preferred stock, of which 63,000,000 preferred shares were offered by Azul and 33,239,837 preferred shares were offered by selling shareholders, at an offering price of R$21.00 per preferred share and US$20.06 per ADS (each ADS represents three preferred shares).

Azul S.A. Notes to consolidated financial statements June 30, 2018 (In thousands of Brazilian reais, except when otherwise indicated)
47
ii. Exercise of stock options During the six months ended June 30, 2018, the Company issued shares in the amount of R$41, 507 comprised of 4,239,025 preferred shares in connection with the exercise of stock options.
b) Share issuance costs
As set forth Pronouncement CPC 08 – Costs of Transaction and Premium on the Issuance of Marketable Securities, the Company accounted for the underwriter fees and other offering costs directly attributable to the IPO as a deduction from equity, net of tax effects. The amounts recorded are as follows:
December 31,
2017
Shared issued costs 68,596
Tax credits from income tax and social contribution (23,320)
Shared issued costs, net 45,276
Additional share issuance costs of R$26,007 were recognized in 2017 in relation to the obligation to HNA arising from the capital contribution.
c) Capital reserve
i. The share-based payment reserve is used to recognize the value of equity-settled share-
based payments provided to employees, including key management personnel, as part of their compensation. For the six months ended June 30, 2018, the Company recognized compensation expense for an amount of R$12,779 (June 30, 2017 – R$6,497).
ii. As of April 10, 2017, the Company recognized the amount in excess of par value of the
shares issued at IPO in capital reserves in the total amount of R$646,479 net of foreign exchange loss of R$15,021.
iii. As of December 31, 2017, the Company recognized the amount in excess of par value of
the shares issued to exercise for stock options in capital reserves in the total amount of R$10,186.
iv. As of June 30, 2018, the Company realized the amount of R$16,185 related to 1,688,729
shares issued to the Company’s key management personnel, in connection with the share based option plan, not yet fully paid.

Azul S.A. Notes to consolidated financial statements June 30, 2018 (In thousands of Brazilian reais, except when otherwise indicated)
48
d) Dividends
According to the by-laws of the Company, unless the right is waived by all shareholders, the shareholders are guaranteed a minimum mandatory dividend equal to 0.1% of net income of the Company after the deduction of legal reserve, contingency reserves, and the adjustment prescribed by Law No. 6,404/76 (Brazilian Corporate Law). If the Company has accumulated losses, there will be no distribution of dividends. Interest paid on equity, which is deductible for income tax purposes, may be deducted from the minimum mandatory dividends to the extent that it has been paid or credited. Interest paid on equity is treated as dividend payments for accounting purposes. The Company has not distributed dividends for the six months ended June 30, 2018 or the year ended December 31, 2017.
e) Other comprehensive loss
Changes in fair value of derivative instruments designated as cash flow hedges are recognized in other comprehensive loss, net of tax effects, for a loss of R$135,869 and R$11,192, as of June 30, 2018 and December 31, 2017 (net of R$42,436 and R$3,486 tax effect) respectively.
f) Treasury shares
Number of
shares R$
At December 31, 2017 103,000 2,745 Purchased 397,000 11,036
At June 30, 2018 (Unaudited) 500,000 13,781
14. Income per share (Unaudited)
Basic earnings or loss per common share are calculated by dividing net income (loss) attributable to the equity holders of Azul by the weighted average number of common shares outstanding during the six months ended June 30, 2018 and 2017, including the conversion of the weighted average number of preferred shares outstanding during the six months ended into common shares.
Diluted earnings or loss per common share are calculated by dividing the net income (loss) attributable to the equity holders of Azul, by the weighted average number of common shares outstanding during the six months ended June 30, 2018 and 2017, including the conversion of the weighted average number of preferred shares outstanding during the years into common shares, plus the weighted average number of common shares that would be issued on conversion of all the dilutive potential common shares into common shares.

Azul S.A. Notes to consolidated financial statements June 30, 2018 (In thousands of Brazilian reais, except when otherwise indicated)
49
Basic earnings or loss per preferred share are calculated by dividing net income (loss) attributable to the equity holders of Azul by the weighted average number of preferred shares outstanding during the six months ended June 30, 2018 and 2017, including the conversion of the weighted average number of common shares outstanding during the years into preferred shares. Diluted earnings or loss per preferred share are calculated by dividing the net income (loss) attributable to the equity holders of Azul, by the weighted average number of preferred shares outstanding during the six months ended June 30, 2018 and 2017, including the conversion of the weighted average number of common shares outstanding during the years into preferred shares, plus the weighted average number of preferred shares that would be issued on conversion of all the dilutive potential preferred shares into preferred shares.
The following table shows the calculation of income or loss per common and preferred share in
thousands, except for values per share:
For the three months ended
June 30, For the six months ended
June 30,
2018 2017 2018 2017
Numerator Net income (45,006) (33,947) 165,539 21,350 Denominator Weighted average number of common shares 928,965,058 928,965,058 928,965,058 928,965,058 Weighted average number of preferred shares 325,363,676 317,571,266 324,408,753 286,071,266 75 preferred shares (*) 75 75,0 75 75,0 Weighted average number of preferred equivalent shares (*) 337,749,877 329,957,467 336,794,954 298,457,467 Weighted average number of common equivalent shares (**) 25,331,240,758 24,746,810,008 25,259,621,546 22,384,310,008 Weighted average number of shares based payment 13,371,677 17,040,111 14,366,100 17,040,111 Weighted average number of shares that would have been
issued at average market price 5,293,937 9,780,398 5,827,923 9,780,398 Basic net income per common share (0.00) (0.00) 0.01 0.00 Diluted net income per common share (0.00) (0.00) 0.01 0.00 Basic net income per preferred share (0.13) (0.10) 0.49 0.07 Diluted net income per preferred share (0.13) (0.10) 0.48 0.07
(*) Refers to a participation in the total equity value of the Company, calculated as if all 928,965,058 common shares outstanding had been converted into
12,386,200 preferred shares at the conversion ratio of 75 common shares to 1.0 preferred share.
(**) Refers to a participation in the total equity value of the Company, calculated as if the weighted average preferred shares outstanding had been converted into common shares at the conversion ratio of 75 common shares to 1.0 preferred share

Azul S.A. Notes to consolidated financial statements June 30, 2018 (In thousands of Brazilian reais, except when otherwise indicated)
50
15. Financial instruments The Company has the following financial instruments:
Book value Fair value
Level
June 30, 2018 (Unaudited)
December 31, 2017
June 30, 2018
(Unaudited) December 31, 2017
Assets:
Short-term investments 2 725,287 1,036,148 725,287 1,036,148 Long term investments 3 1,090,710 835,957 1,090,710 835,957 Restricted investments (*) 2 548 8,808 548 8,808 Financial instruments (*) 2 491,316 420,822 491,316 420,822 Liabilities: Loans and financing (*) (a) 2 3,834,517 3,489,887 3,844,812 3,461,008 Financial instruments (*) 2/3 351,943 426,937 351,943 426,937
(*) Includes current and non-current.
(a) The balance of loans and financing includes certain loans denominated in US Dollars that have been translated into Reais (% CDI) through derivative instruments "Cash flow swaps" and classified as fair value hedges. In this strategy, loans that were originally recognized at amortized cost in the income statement are recognized at fair value through profit or loss and swaps, eliminating volatility in the Company's results. On June 30, 2018, the Notional of these Swaps was R$151,729 and generated an unrealized gain of R$17,251. More details are presented in the topics "Fair value hedge" and "Interest rate swap".
The carrying value of cash equivalents, short and long-term investments, restricted investments, trade and other receivables and accounts payable approximate their fair value largely due to the short-term maturity of these instruments.
Financial instruments
June 30, 2018 (Unaudited) December 31, 2017
Assets Liabilities Assets Liabilities
Cash flow hedge
Interest rate swap contract - (11,380) - (14,755) Foreign currency options 216,344 -
Fair value hedge Interest rate swap contract 17,814 (563) 4,747 (24)
Derivatives not designated as hedge Interest rate swap contract 1,335 (282,358) 4,239 (385,185) Forward foreign currency contract 235,046 - 219,930 - Heating oil forward contracts 20,777 - 4,469 - Foreign currency options - (57,642) 187,437 (26,973)
491,316 (351,943) 420,822 (426,937)

Azul S.A. Notes to consolidated financial statements June 30, 2018 (In thousands of Brazilian reais, except when otherwise indicated)
51
The maturity of the financial instruments held by the Company is as follows:
June 30, 2018 (Unaudited) Immediate
Until 6 months
7 to 12 months
1 to 5 years
More than 5 years Total
Assets from derivative transactions 6,289 12,765 10,598 13,111 448,553 491,316
Liabilities from derivative transactions (12,444) - (29,168) (322,580) 12,249 (351,943)
Total financial instruments (6,155) 12,765 (18,570) (309,469) 460,802 139,373
Cash flow hedge
Definition Origin of Risk Risks
designated for hedge
Hedge instrument
Recognition
Hedge of exposure to variability in cash flows attributable to a particular risk associated with a recognized asset or liability or a highly probable forecasted transaction that could affect the Company's results.
Financial leasing of aircraft with post-fixed interest rates
Interest Rate
(Libor USD)
Cash Flow
Swap -
swapping
post-fixed
interest rate
to pre-fixed.
• Protected item: Amortized cost - Liabilities in
contra-entry result.
• Hedge instrument: Fair value - Assets / Liabilities (MtM) in contra-entry profit (accrual) and other comprehensive income (MtM).
Senior Notes
denominated in
foreign currency
Exchange
Variation of
dolar
Foreign
currency
options
• Protected item: Amortized cost - Liabilities in
contra-entry result.
• Hedge instrument: Fair value - Asset / Liability
(MtM), in income statement (Intrinsic Value),
offsetting the effect of the exchange variation on
debt and other comprehensive income in Equity
(Value in time)
As of June 30, 2018 and December 31, 2017, the Company had interest rate swaps designated as cash flow hedges to hedge against the effect of changes in the interest rate on a portion of the finance leases payments and forward foreign currency contract for the protection of the Senior Notes principal denominated in foreign currency in the next 12 months. The positions were:
June 30, 2018 (Unaudited)
Notional amount
Asset position
Liability position Fair value
Cash flow hedge:
Loans and financing 67,273 LIBOR US$ Fixed rate (11,380)
Foreign currency options 1,314,600 US$ R$ 216.344
1,381,873 204.964
December 31, 2017 Notional amount
Asset position
Liability position Fair value
Cash flow hedge:
Loans and financing 87,395 LIBOR Fixed rate (14,755)
87,395 (14,755)
The critical terms of the swap contracts matched with the terms of the hedged loans. Considering all transactions were deemed effective, the fair value changes on cash flow hedge were recorded in other comprehensive loss against financial instruments in liabilities or assets.
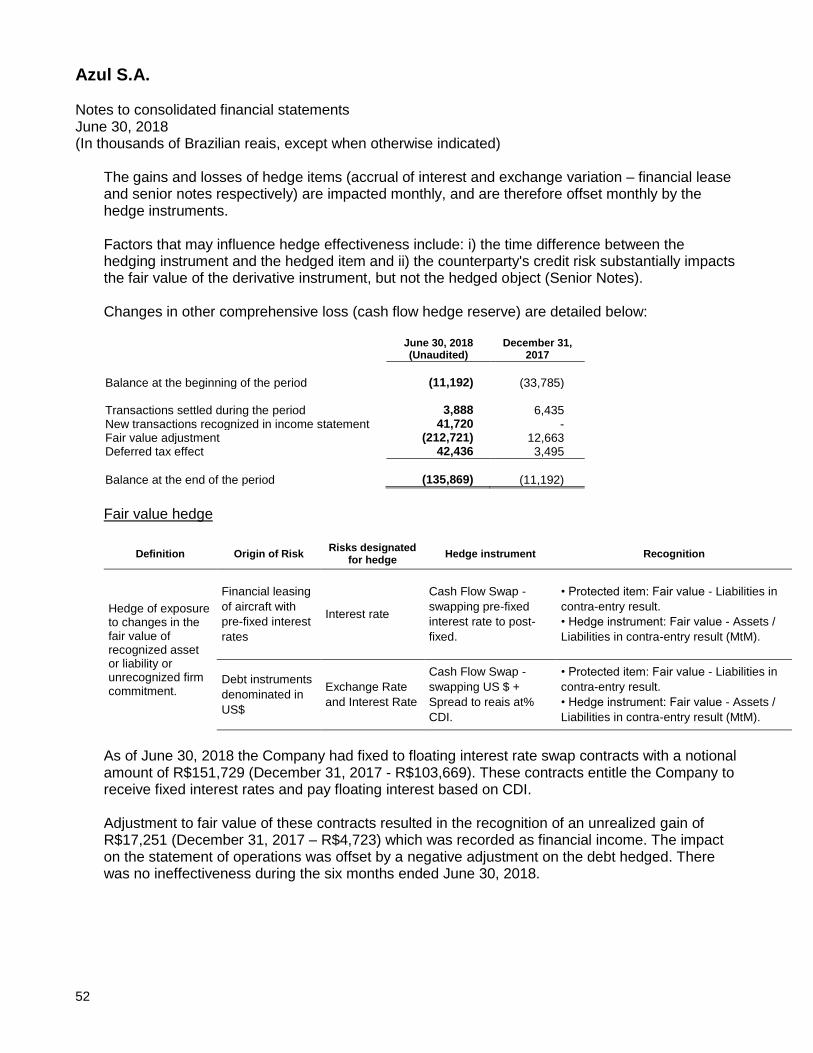
Azul S.A. Notes to consolidated financial statements June 30, 2018 (In thousands of Brazilian reais, except when otherwise indicated)
52
The gains and losses of hedge items (accrual of interest and exchange variation – financial lease and senior notes respectively) are impacted monthly, and are therefore offset monthly by the hedge instruments. Factors that may influence hedge effectiveness include: i) the time difference between the hedging instrument and the hedged item and ii) the counterparty's credit risk substantially impacts the fair value of the derivative instrument, but not the hedged object (Senior Notes). Changes in other comprehensive loss (cash flow hedge reserve) are detailed below:
June 30, 2018 (Unaudited)
December 31, 2017
Balance at the beginning of the period (11,192) (33,785) Transactions settled during the period 3,888 6,435 New transactions recognized in income statement 41,720 - Fair value adjustment (212,721) 12,663 Deferred tax effect 42,436 3,495
Balance at the end of the period (135,869) (11,192)
Fair value hedge
Definition Origin of Risk Risks designated
for hedge Hedge instrument Recognition
Hedge of exposure to changes in the fair value of recognized asset or liability or unrecognized firm commitment.
Financial leasing
of aircraft with
pre-fixed interest
rates
Interest rate
Cash Flow Swap -
swapping pre-fixed
interest rate to post-
fixed.
• Protected item: Fair value - Liabilities in
contra-entry result.
• Hedge instrument: Fair value - Assets /
Liabilities in contra-entry result (MtM).
Debt instruments
denominated in
US$
Exchange Rate
and Interest Rate
Cash Flow Swap -
swapping US $ +
Spread to reais at%
CDI.
• Protected item: Fair value - Liabilities in
contra-entry result.
• Hedge instrument: Fair value - Assets /
Liabilities in contra-entry result (MtM).
As of June 30, 2018 the Company had fixed to floating interest rate swap contracts with a notional amount of R$151,729 (December 31, 2017 - R$103,669). These contracts entitle the Company to receive fixed interest rates and pay floating interest based on CDI. Adjustment to fair value of these contracts resulted in the recognition of an unrealized gain of R$17,251 (December 31, 2017 – R$4,723) which was recorded as financial income. The impact on the statement of operations was offset by a negative adjustment on the debt hedged. There was no ineffectiveness during the six months ended June 30, 2018.

Azul S.A. Notes to consolidated financial statements June 30, 2018 (In thousands of Brazilian reais, except when otherwise indicated)
53
Derivatives not designated as hedge accounting
i) Forward foreign currency contract
The Company is exposed to the foreign currency risk, and therefore entered into currency forward contracts, options and foreign currency swaps. These currency forward contracts are not designated for hedge accounting.
During the six months ended June 30, 2018, the Company had entered into NDF contracts of US$400 million to protect itself from currency fluctuations (December 31, 2017 - US$370 million) that generated an unrealized gain of R$235,046 (December 31, 2017 – R$219,930).
ii) Foreign currency options The Company also has currency options with notional of US$559 million (December 31, 2017 – US$544 million), of which US$529 million are in connection with the Senior Notes hedge and US$30 million (December 31, 2017 - US$15 million) in connection to a dollar loan maturing in April, 2018. As of June 30, 2018, these options generated an unrealized gain of R$57,642 (December 31, 2017 – R$ 160,464). On April 1, 2018, the Company designated for cash flow hedge accounting options with notional in the amount of US$ 400 million contracted for the purpose of protecting the principal of Senior Notes (note 15).
iii) Interest rate swap contract As of June 30, 2018 the Company had interest rate swap contracts in connection with the Senior Notes. Changes in fair value of these instruments resulted in the recognition of an unrealized loss of R$281,023 (December 31, 2017 - R$380,946).
iv) Heating oil forward contracts
As of June 30, 2018, the Company also had average NDF contracts on over-the-counter (OTC) Market with three different counterparties on the local market indexed to Heating Oil forward contract traded on the NYMEX, on monthly tranches, with a notional value of R$306,425 (December 31, 2017 - R$15,495). The fair value of these instruments amounted to an unrealized gain of R$20,777 (December 31, 2017 – R$4,469).
Fair value of financial instruments The Company applies the following hierarchy to determine the fair value of financial instruments:
Level 1: quoted prices (unadjusted) in active markets for identical assets or liabilities;
Level 2: other techniques for which all data that have significant effect on the fair value recorded are observable, directly or indirectly;

Azul S.A. Notes to consolidated financial statements June 30, 2018 (In thousands of Brazilian reais, except when otherwise indicated)
54
Level 3: techniques that use data that have significant effect on fair value recorded that are not based on observable market data.
Assets measured at fair value
(Unaudited) June 30,
2018 Level 1 Level 2 Level 3
Financial assets at fair value
Short-term investments 725,287 - 725,287 -
Restricted investments (a) 548 - 548 -
Long-term investments (c) 1,090,710 - - 1,090,710
Interest rate swap contract - fair value hedge option (b) 17,814 - 17,814 -
Interest rate swap contract- not designated as hedge 1,335 - 1,335 -
Forward foreign currency contract 235,046 - 235,046 -
Foreign currency options 216,344 - 216,344 -
Heating oil forward contracts 20,777 - 20,777 -
Liabilities measured at fair value
(Unaudited) June 30,
2018 Level 1 Level 2 Level 3
Financial liabilities at fair value
Interest rate swap contract - cash flow hedge (11.380) - (11.380) -
Interest rate swap contract - fair value hedge option (b) (563) - (563) -
Interest rate swap contract- not designated as hedge (282.358) - (282.358) -
Forward foreign currency contract (57,642) - (57,642) -
Assets measured at fair value December 31, 2017 Level 1 Level 2 Level 3
Financial assets at fair value Short-term investments 1,036,148 - 1,036,148 - Restricted investments (a) 8,808 8,808 - Long-term investments (c) 835,957 - - 835,957 Interest rate swap contract - fair value hedge option (b) 4,747 - 4,747 - Interest rate swap contract- not designated as hedge 4,239 4,239 Forward foreign currency contract 219,930 - 219,930 - Foreign currency options 187,437 187,437 Heating oil forward contracts 4,469 - 4,469 -
Liabilities measured at fair value December 31, 2017 Level 1 Level 2 Level 3
Financial liabilities at fair value
Interest rate swap contract - cash flow hedge (14.755) - (14.755) - Interest rate swap contract - fair value hedge (b) (24) - (24) - Interest rate swap contract- not designated as hedge (385.185) - (385.185) - Foreign currency options (26.973) - (26.973) -
(a) Includes current and non-current. (b) Portion of the balances consist of loans from FINAME PSI, and standard FINAME presented at their value adjusted by the hedged risk, applying fair
value hedge accounting rules.
(c) The Company calculated the fair value of the call option based on a valuation for TAP and binomial model considering the term of option, discount rate and the market volatility of publicly traded comparable airlines, calculated on a 2 years average. The resulting amount of the binomial model calculated in Euros was converted into Reais using the period-end exchange rate. See Note 15
(d) The Company calculated the fair value of the put option by using the 12 months Libor rate as the coupon for the bond and applying it for the remaining time of the option.

Azul S.A. Notes to consolidated financial statements June 30, 2018 (In thousands of Brazilian reais, except when otherwise indicated)
55
Level 3 financial assets reconciliation Changes in the fair value of the TAP Convertible Bonds is detailed below:
June 30, 2018 (Unaudited)
December 31, 2017
Balance at the beginning of the period 835,957 752,095
Foreign currency exchange gain (loss) (*) 55,230 47,781 Interest accrual (8.f.ii) (**) 14,175 29,569 Net present value adjustment (8.f.ii) (**) (7,857) (11,844)
Fair value of call-option (8.f.ii) (**) 193,205 18,356
Balance at the end of the period 1,090,710 835,957 (*) recorded in the “Foreign currency exchange, net” in the income statements line item. (**) recorded in the “Result from related parties transactions, net” in the income statements line item.
16. Other operating expenses, net (Unaudited)
For the three months ended June 30,
For the six months ended
June 30,
2018 2017 2018 2017
Accommodation and meals (55,064) (48,482) (106,101) (91,765) IT services (48,366) (16,156) (93,697) (52,402) Professional services (21,469) (13,037) (41,283) (22,845) Taxes, civil and labor risks (20,421) (18,167) (32,561) (32,470) Aircraft insurance (5,968) (5,434) (11,399) (10,418) Flights interrupted (9,887) (11,283) (21,553) (21,533) Others (*) (243,099) (10,234) (265,203) (32,334)
(404,274) (122,793) (571,797) (263,767)
(*) The “Others” balance contains the recognition of the result in the sale of aircraft.
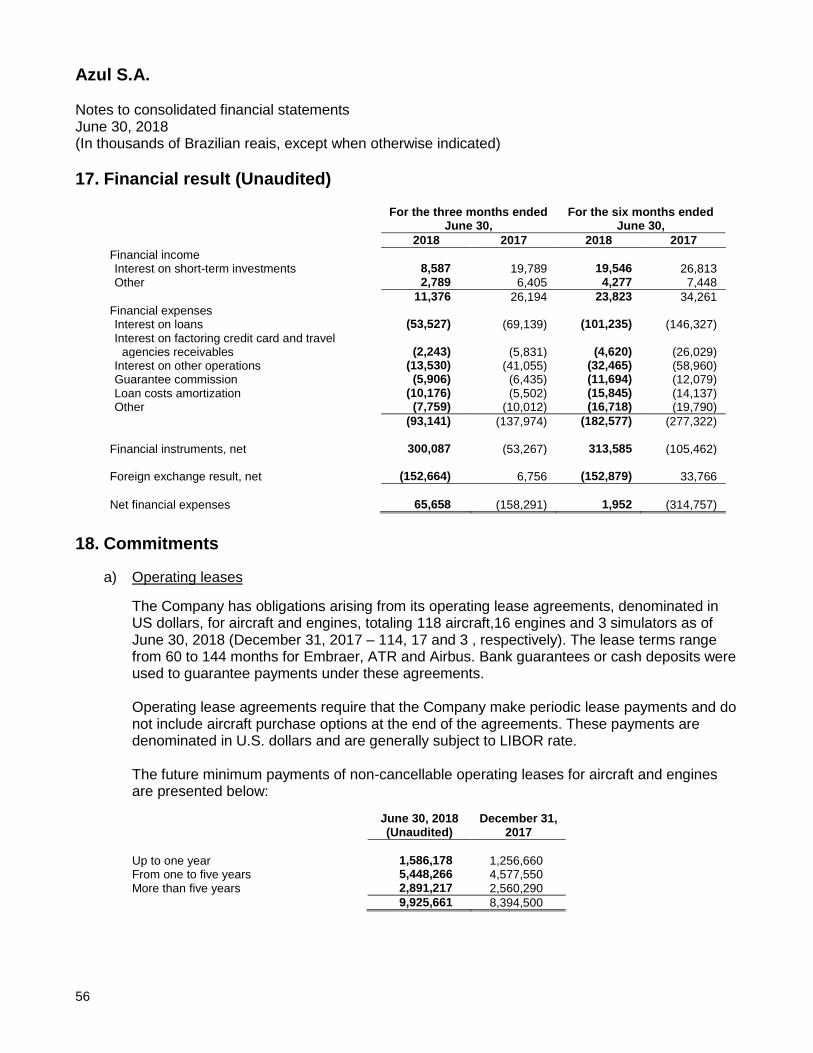
Azul S.A. Notes to consolidated financial statements June 30, 2018 (In thousands of Brazilian reais, except when otherwise indicated)
56
17. Financial result (Unaudited)
For the three months ended June 30,
For the six months ended June 30,
2018 2017 2018 2017
Financial income Interest on short-term investments 8,587 19,789 19,546 26,813 Other 2,789 6,405 4,277 7,448
11,376 26,194 23,823 34,261 Financial expenses Interest on loans (53,527) (69,139) (101,235) (146,327) Interest on factoring credit card and travel
agencies receivables (2,243) (5,831) (4,620) (26,029) Interest on other operations (13,530) (41,055) (32,465) (58,960) Guarantee commission (5,906) (6,435) (11,694) (12,079) Loan costs amortization (10,176) (5,502) (15,845) (14,137) Other (7,759) (10,012) (16,718) (19,790)
(93,141) (137,974) (182,577) (277,322) Financial instruments, net 300,087 (53,267) 313,585 (105,462) Foreign exchange result, net (152,664) 6,756 (152,879) 33,766
Net financial expenses 65,658 (158,291) 1,952 (314,757)
18. Commitments
a) Operating leases
The Company has obligations arising from its operating lease agreements, denominated in US dollars, for aircraft and engines, totaling 118 aircraft,16 engines and 3 simulators as of June 30, 2018 (December 31, 2017 – 114, 17 and 3 , respectively). The lease terms range from 60 to 144 months for Embraer, ATR and Airbus. Bank guarantees or cash deposits were used to guarantee payments under these agreements. Operating lease agreements require that the Company make periodic lease payments and do not include aircraft purchase options at the end of the agreements. These payments are denominated in U.S. dollars and are generally subject to LIBOR rate. The future minimum payments of non-cancellable operating leases for aircraft and engines are presented below:
June 30, 2018 (Unaudited)
December 31, 2017
Up to one year 1,586,178 1,256,660 From one to five years 5,448,266 4,577,550 More than five years 2,891,217 2,560,290
9,925,661 8,394,500

Azul S.A. Notes to consolidated financial statements June 30, 2018 (In thousands of Brazilian reais, except when otherwise indicated)
57
For the six months ended June 30, 2018 lease expense amounted to R$655,510 (June 30, 2017 - R$544,653) with a cash impact of R$700,565 (June 30, 2017 was R$611,213). The operating lease agreements do not have covenant restrictions.
b) Commitments for future acquisition of aircraft
The Company has purchase commitments for the acquisition of 73 aircraft (December 31, 2017 – 73), under which the following futures payments will be made:
June 30, 2018 (Unaudited)
December 31, 2017
Up to one year 81,258 - More than one year up to five years 15,851,178 11,769,181 More than five years 2,185,015 3,704,580
18,117,451 15,473,761
c) Letter of credits
As of June 30, 2018, the Company had issued letters of credit totaling US$186 million (December 31, 2017 - US$161 million) equivalent to R$717,639 (December 31, 2017 – R$533,201) and bank guarantees in the amount of R$47,541 in relation to security deposits, maintenance reserves and local sureties.
d) Guarantees ALAB entered into a Deed of Guarantee and Indemnity as of September 15, 2017, in connection with the obligations and liabilities related to the operating lease agreements of three A350-900XW aircraft entered into by Hong Kong Airlines and Beijing Capital Airlines, companies of the HNA Group, ex-shareholder of the Company, and Wilmington Trust SP Services (Dublin) Limited.
19. Share-based option plan
19.1. Equity-settled awards
19.1.1. First share option plan
The first share option plan (“First Option Plan”) of the Company was approved on a Shareholders’ Meeting held on December 11, 2009. The plan has a term of 10 years, and no option may be granted after this period. Exercise conditions of options issued under the First Option Plan require in addition to a vesting period of 4 years, the occurrence of an initial public offering (IPO) of the shares of the Company.

Azul S.A. Notes to consolidated financial statements June 30, 2018 (In thousands of Brazilian reais, except when otherwise indicated)
58
19.1.2. Second share option plan The second share option plan (“Second Option Plan”) was approved on a Shareholders’ Meeting held on June 30, 2014, as amended. Exercise conditions of options issued under the programs of the Second Option Plan, prior to Azul’s IPO, require in addition to a vesting period of 4 years, the occurrence of an initial public offering (IPO) of the shares of the Company. The options have an 8-year life. The options issued under the programs of the Second Option Plan, after Azul’s IPO, require a vesting period of 4 years. The options have a 10-year life and the exercise price shall equal to the lowest stock price traded in the stock market during the thirty (30) trading sessions prior to the options grant approved by the Board of Directors.
19.1.3. Third share option plan
The third share option plan (“Third Option Plan”) was approved on a Shareholders’ Meeting held on March 10, 2017.
Exercise conditions of options issued under the Third Option Plan require a vesting period of 5 years. The options have a 5-year life and options can only be exercised within15 days after each vesting anniversary.
19.1.4. Information about the fair value of share options and expense
The grant-date fair value of share options has been measured using the Black-Scholes model. Expected volatility has been calculated based on historical volatility of airline shares listed on stock exchanges in Brazil and Latin America. The inputs are mentioned below.
First Option Plan
1st program 2nd program 3rd program
Total options granted 5,032,800 1,572,000 656,000
Date of compensation committee Dec 11, 2009 Mar 24, 2011 April, 05, 2011
Total options outstanding 1,169,506 403,600 52,760
Option exercise price R$3.42 R$6.44 R$6.44
Option fair value as of grant date R$1.93 R$4.16 R$4.16
Estimated volatility of the share price 47.67% 54.77% 54.77%
Expected dividend 1.10% 1.10% 1.10%
Risk-free rate of return 8.75% 12.00% 12.00% Average remaining maturity (in years) - - -
Maximum life of the option 10 years 10 years 10 years
Expected term considered for valuation 7 years 7 years 7 years

Azul S.A. Notes to consolidated financial statements June 30, 2018 (In thousands of Brazilian reais, except when otherwise indicated)
59
Second Option Plan Third Option
Plan
1st program 2nd program 3rd program 4rd program 1st program
Total options granted 2,169,122 627,810 820,250 680,467 9,343,510
Date of compensation committee June 30, 2014 July 01, 2015 July 01, 2016 July 06, 2017 Mar 14, 2017
Total options outstanding 1,123,867 375,666 576,860 658,410 7,474,808
Option exercise price R$19.15 R$14.51 R$14.50 R$22.57 R$11.85
Option fair value as of grant date R$11.01 R$10.82 R$10.14 R$12.82 R$4.82
Estimated volatility of the share price 40.59% 40.59% 43.07% 43.35% 50.64%
Expected dividend 1.10% 1.10% 1.10% 1.10% 1.10%
Risk-free rate of return 12.46% 15.69% 12.21% 10.26% 11.32% Average remaining maturity (in years) 0.2 1.2 2.2 3.3 3.9
Maximum life of the option 8 years 8 years 8 years 10 years 5 years
Expected term considered for valuation 4.5 years 4.5 years 4.5 years 5.5 years 5 years
Changes in stock options are disclosed below:
Number of stock options
Weighted average exercise price
(in reais)
Balance as of December 31, 2016 10,877,982 R$8.38 Granted 10,023,977 R$12.58 Cancelled (468,818) R$8.19 Exercised (4,182,454) R$5.61
Balance as of December 31, 2017 16,250,687 R$11.69
Cancelled (176,185) R$19.13 Exercised (4,239,025) R$9.79
Balance as of June 30, 2018 (unaudited) 11,835,477 R$12.26
Number of options exercisable as of: June 30, 2018 (unaudited) 2,923,491 R$9.28 December 31, 2017 4,788,718 R$8.11
Share-based compensation expense recognized in the statement of operations during the six months ended June 30, 2018 with respect to the share options amounted to R$8,918 (June 30, 2017 - R$8,289) recognized in income statement.
19.2.Restricted share units
The Shareholders’ Meeting held on June 30, 2014 approved a restricted share units plan (“RSU Plan”). Under the terms of the RSU Plan participants were granted a fixed monetary amount (in Reais) which would be settled in a quantity of preferred shares determined by dividing the monetary amount by the price per share of the preferred shares at IPO.

Azul S.A. Notes to consolidated financial statements June 30, 2018 (In thousands of Brazilian reais, except when otherwise indicated)
60
Exercise conditions of RSUs require, in addition to a vesting period of four years, the occurrence of an IPO of the shares of the Company for the RSUs to become exercisable. The Company can settle the portion of the RSUs for which the vesting period was completed in cash or in shares. The fair value of the award, prior to the IPO, was determined at each statement of financial position date as the monetary amount of the awards in Reais discounted from the earliest date at which the Company could settle the amount in cash using the risk-free interest rate and the obligation was recorded as a liability. At the date of the IPO, the monetary amount of the awards was converted into units based on the IPO date fair value of the preferred shares. The related liability was reclassified to equity in line with the post IPO settlement method. Subsequent grants are measured based on the grant date fair value of the awards.
19.2.1.Information about the fair value of RSUs and expense
Date of compensation
committee Total shares
granted Total shares outstanding
Fair value as of grant date
(in reais)
1 st program June 30, 2014 487,670 106,473 R$21.00 2nd program July 01, 2015 294,286 127,597 R$21.00 3rd program July 01, 2016 367,184 240,340 R$21.00 4th program July 06, 2017 285,064 274,720 R$24.17
1,434,204 749,130
Changes in RSU are disclosed below:
Number of RSU
As of December 31, 2016 859,940 Granted 285,064 Cancelled (63,676) Paid (271,382)
As of December 31, 2017 809,946
Cancelled (60,816)
As of June 30, 2018 (unaudited) 749,130
Share-based compensation expensed recognized in the statement of operations during the six months ended June 30, 2018 with respect to the RSU amounted to R$3,391 (June 30, 2017 - R$2,319) recognized in income statement.
20. Provision for taxes, civil and labor risks
The Company is party to certain labor, civil and tax lawsuits for which appeals have been filed. Based on the Company’s external and internal legal counsels’ opinion, Management believes that the recorded provisions are sufficient to cover probable losses. In addition, the Company has made judicial deposits when required by court.

Azul S.A. Notes to consolidated financial statements June 30, 2018 (In thousands of Brazilian reais, except when otherwise indicated)
61
These provisions are as follows:
June 30, 2018 (Unaudited)
December 31, 2017
Taxes 1,929 1,896 Civil 51,459 48,751 Labor 27,151 22,551
80,539 73,198
Changes in these provisions are as follows:
Total
Balance at December 31, 2016 76,353
Provisions recognized 78,469 Utilized provisions (81,624)
Balance at December 31, 2017 73,198
Provisions recognized 37,415
Utilized provisions (30,074)
Balance at June 30, 2018 80,539
The total amount of claims, which according to management represent losses that are reasonably possible but not probable, for which no provision was recorded are as follow:
June 30, 2018 (Unaudited)
December 31, 2017
Taxes 82,482 80,648 Civil 40,130 23,304 Labor 127,652 133,283
250,264 237,235
The Company’s management, together with its legal counsel, analyzes the proceedings on a case-by-case basis and records the amount of the provision for labor, civil and tax risk based on the probable cash disbursement for the related proceedings. a) Tax proceedings: The Company has tax proceedings related to additional charge of 1% of
COFINS on imports of aircraft and engines, in accordance with the provisions of Law 10,865 / 04, the application of COFINS at a zero rate for imports of aircraft and parts and parts. Management believes that the chances of loss is possible and therefore no provision was recorded for such amounts.

Azul S.A. Notes to consolidated financial statements June 30, 2018 (In thousands of Brazilian reais, except when otherwise indicated)
62
b) Civil lawsuits: the Company is party to various types of civil lawsuits, for compensation claims in relation to flight delays, cancellations of flights, luggage and damage loss, and others.
c) Labor lawsuits: the Company is party to various types of labor lawsuits, related to overtime, additional remuneration for undertaking hazardous activities and safety related payments and others. The Labor Prosecution’s Office filed on February 22, 2017 a lawsuit against the Company claiming that it had violated certain labor regulations, including limitations on daily working hours and rest periods. The claim totals approximately R$66,000 in punitive damages. The lawsuit is currently suspended and the Company is negotiating a Conduct Adjustment Declaration (Termo de Ajuste de Conduta or “TAC”). The Company classifies the likelihood of loss as possible.