intergenerational family relations and support of elderly
TRANSCRIPT

1
Intergenerational Family Relations and Support of Elderly in India: A
Field-Based Study in Kerala State
Introduction
Last century witnessed a shift in fertility and mortality trends and the emergence of
population ageing worldwide. The world population is ageing with higher percent of
growth rate than the overall population. Until recently it is considered that population
ageing is a problem of only developed countries, but the recent trend shows that it is
more rapid in developing countries, including India. In more developed regions almost
one fifth of the population was aged 60 or older in the year 2000. By 2050 this proportion
is expected to reach one- third. On the other hand, ageing process is more rapid in the
developing countries. By the year 2025, nearly 75 percent and in 2050 around 85 percent
of world’s elderly population is likely to be found living in developing countries (United
Nations, 2002).
Even though the proportion of India’s elderly is small compared with that of developed
countries, still it is very large in terms of the absolute numbers. The Indian aged
population is currently the second largest in the world, the first being China with 150
million. The 1901 census showed there were only 12 million people above the age of 60
years in India. In the next fifty years the population of aged increased to 20 million. But
in the next fifty years it increased almost three times and reached around 77 million in
2001. The population projections show that by 2050 the elderly population in India will
surpass the population of children below 14 years.
2
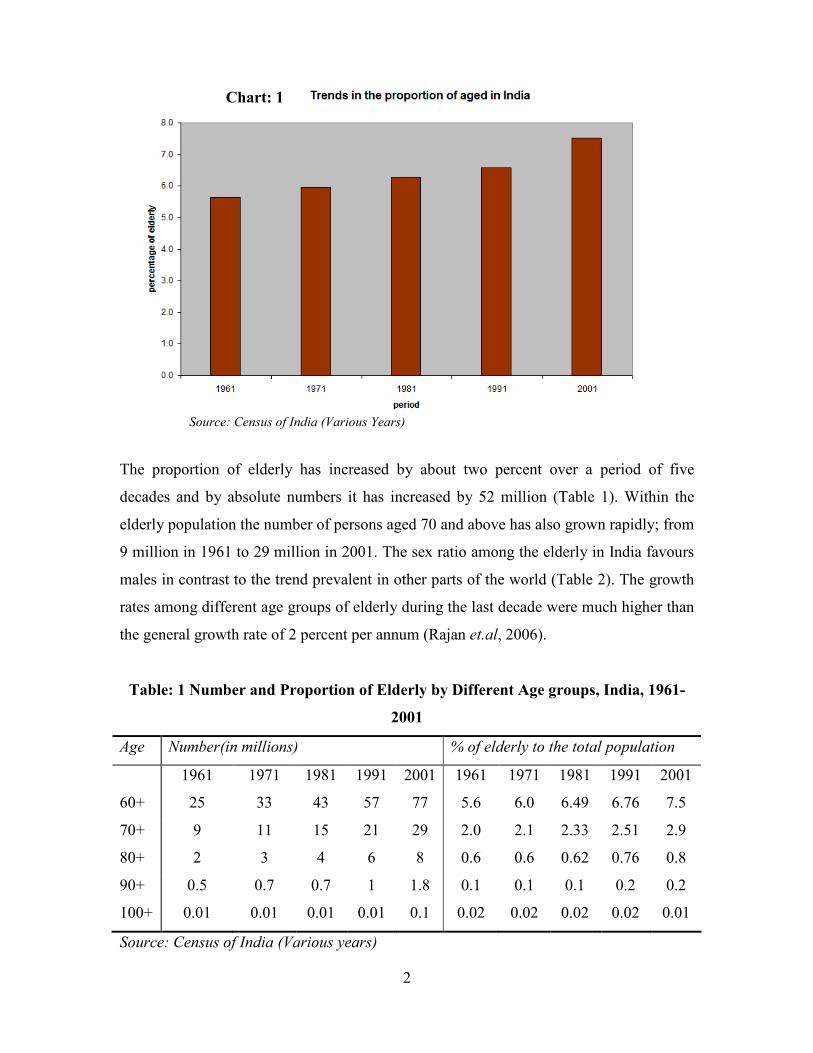
The proportion of elderly has increased by about two percent over a period of five
decades and by absolute numbers it has increased by 52 million (Table 1). Within the
elderly population the number of persons aged 70 and above has also grown rapidly; from
9 million in 1961 to 29 million in 2001. The sex ratio among the elderly in India favours
males in contrast to the trend prevalent in other parts of the world (Table 2). The growth
rates among different age groups of elderly during the last decade were much higher than
the general growth rate of 2 percent per annum (Rajan et.al, 2006).
Table: 1 Number and Proportion of Elderly by Different Age groups, India, 1961-
2001
Age Number(in millions) % of elderly to the total population
1961 1971 1981 1991 2001 1961 1971 1981 1991 2001
60+ 25 33 43 57 77 5.6 6.0 6.49 6.76 7.5
70+ 9 11 15 21 29 2.0 2.1 2.33 2.51 2.9
80+ 2 3 4 6 8 0.6 0.6 0.62 0.76 0.8
90+ 0.5 0.7 0.7 1 1.8 0.1 0.1 0.1 0.2 0.2
100+ 0.01 0.01 0.01 0.01 0.1 0.02 0.02 0.02 0.02 0.01
Source: Census of India (Various years)
Chart: 1
Source: Census of India (Various Years)

3
Table: 2 Sex ratio and Growth Rate among the Indian Elderly, 1971-2001
Age Sex ratio of Elderly
(males per 1000 females)
Growth of Elderly
(in Percent)
1971 1981 1991 2001 1971-81 1981-91 1991-2001
60+ 1066 1042 1075 1028 2.78 2.72 3.04
70+ 1030 1026 1084 991 3013 3.08 3.32
80+ 950 990 1090 1051 2.54 4.35 2.35
90+ 897 892 1019 1131 0.66 5.08 5.80
100+ 798 844 869 1782 0.19 0.44 na
Source: Census of India (Various years)
In India, the family is the most important institution for supporting aged persons in their
advanced age. The Indian family, like most families in oriental cultures, is considered to
be strong, well knit, resilient and enduring. However, heterogeneity and diversity are the
characteristics of Indian families. There are regional and cultural variations in family
structure and functioning. The norms and values related to family life vary according to
religion, caste, social class and residential patterns (Dhruvarajan, 1989). In traditional
Indian society, elder people lived within multi-generational extended families including
one or more adults, children, grand children and other kin. The aged in these societies
received unparalleled sense of honor, decision - making responsibilities in the economic,
political and social activities of the family. But in the last few decades, the researches
show that the traditional joint family has crumbled due to forces of urbanization and
modernization. The most prominent feature of the disintegration in joint family system is
the erosion of authority commanded by the elder members as they cease to be the
economic head of the family. Modernization has profoundly influenced the values like
interdependence, cooperation and self- sacrifice giving way to independence, personal
mobility and personal achievement. All these factors have contributed, to changes in the
structure and the functioning of the family system. Although at present the
intergenerational families are fewer, the interaction between the generations are mostly
based on affection bonds and characterized by unconditional mutual respect.

4
In India, still a higher proportion of elderly living with their families. There are changes
in both composition and quality of interactions among the members. The generation gap
is widening due to fast changing lifestyle, globalization, migration of young and
influence of diverse ideologies. There are evidences that inter- generational relations are
undergoing transitions due to social and cultural changes. Teenagers specially perceive
their grand parents in a different way (Gayatri Devi, 2004). The intergenerational
exchange includes various types of activities and support, including financial, emotional
and social. Simple issues like should the parents be consulted in job changes, marriage or
purchase of land or house or any property- do determine the warmth of intergenerational
relationship (Jamuna, 2007).
Batra and Bhaumik (2007) in their study on ‘intergenerational relationships’ based on 90
respondents (30 respondents each from first, second and third generations) at Delhi found
that around 53 percent were living in nuclear families. 27 percent of the first generation
was economically fully dependent on their children and 23 percent were partially
dependent. The study also shows that the perceived change in the status of elderly. 70
percent of the elderly reported that there was loss of position in the family after they
became old, and 63 percent felt loss of authority, 73 percent reported lack of support
from children and grand children, 80 percent admitted they are feeling isolated from the
family and 86 percent reported loss of respect from the young generation.
The elderly who have adequate financial resources and who took care of the family
affairs, who are productive and involved in income generation activities and contribute to
the family, are looked after well and held in good esteem by the young. On the contrary,
in many cases where the old are resource poor, the young neglect them intentionally or
unintentionally, and refuse or fail to fulfill a care taking obligation (WHO/INPEA, 2002).
Sonar et.al (2007), in their study in Karnataka, found that a significant proportion of
elderly have good intergenerational relationship with their children and grandchildren.
Those who do not have good relations with their young generation, reported that their
differences are due to opposing attitude of young (21 percent), not productive or useful
(19 percent), differences of opinion (2.7) and different life styles. The elderly who are
5
educated and have some source of income, are found to have good relations with the
young.
National Sample Survey Organization (NSSO) during January-June 2004 collected data
from a sample of 34,831 persons aged 60 and above. Information on various issues on
intergenerational support of elderly such as the persons who are providing financial
assistance to the elderly, living arrangement, support mechanism, etc. were gathered
through this nationally representative survey.
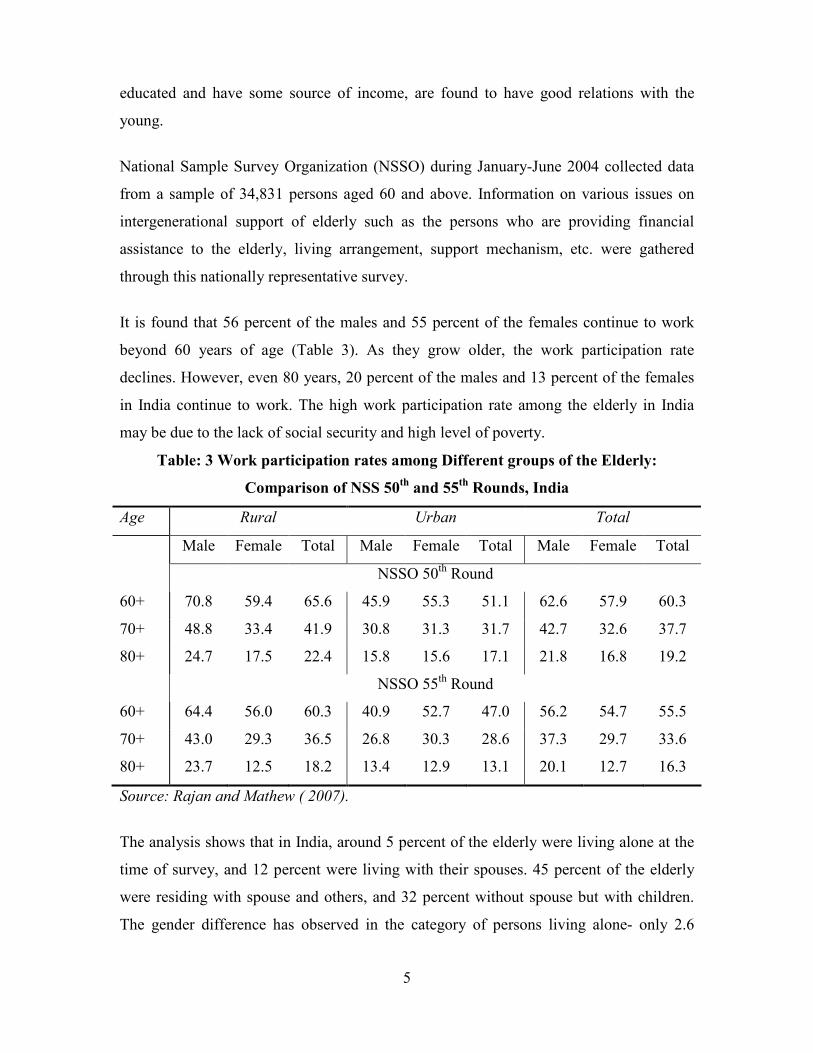
It is found that 56 percent of the males and 55 percent of the females continue to work
beyond 60 years of age (Table 3). As they grow older, the work participation rate
declines. However, even 80 years, 20 percent of the males and 13 percent of the females
in India continue to work. The high work participation rate among the elderly in India
may be due to the lack of social security and high level of poverty.
Table: 3 Work participation rates among Different groups of the Elderly:
Comparison of NSS 50th and 55
th Rounds, India
Age Rural Urban Total
Male Female Total Male Female Total Male Female Total
NSSO 50th Round
60+ 70.8 59.4 65.6 45.9 55.3 51.1 62.6 57.9 60.3
70+ 48.8 33.4 41.9 30.8 31.3 31.7 42.7 32.6 37.7
80+ 24.7 17.5 22.4 15.8 15.6 17.1 21.8 16.8 19.2
NSSO 55th Round
60+ 64.4 56.0 60.3 40.9 52.7 47.0 56.2 54.7 55.5
70+ 43.0 29.3 36.5 26.8 30.3 28.6 37.3 29.7 33.6
80+ 23.7 12.5 18.2 13.4 12.9 13.1 20.1 12.7 16.3
Source: Rajan and Mathew ( 2007).
The analysis shows that in India, around 5 percent of the elderly were living alone at the
time of survey, and 12 percent were living with their spouses. 45 percent of the elderly
were residing with spouse and others, and 32 percent without spouse but with children.
The gender difference has observed in the category of persons living alone- only 2.6

6
percent of the elderly males were living alone, whereas 8 percent of the females were
living alone. In the case of widows the percentage is again higher around 12 percent.
Table: 4 Living Arrangements of Elderly in India-2004
Living Arrangement Total Males Females Widows
Alone 5.1 2.6 7.8 11.8
With Spouse only 11.9 15.5 8.4
With spouse and others 44.7 60.0 29.4
Without spouse but with children 32.1 17.2 47.0 78.3
Others 6.1 4.7 7.5 10.6
Source: NSSO (2006)
It is clear from the analysis that still the intergenerational financial assistance is
prevailing in India; around 78 percent of the economically dependent elderly were
supported by their own children and 3 percent by the third generation (grand children).
In the case of widows, 87 percent of the elderly received financial assistance from their
children and 5 percent from their grand children.
Table: 5 Financial Supports for Dependent Elderly in India-2004
Person providing financial assistance to
the economically dependent elderly
Total Males Females Widows
Spouse 13.3 16.9 10.8
Own children 77.7 75.2 79.4 86.9
Grand children 2.7 2.0 3.2 4.7
Others 6.3 5.9 6.6 8.4
Source: NSSO (2006)
The intergenerational support is not only restricted with financial assistance. It includes
the physical care also. Around 84 percent of the physically immobile persons were cared
by their own family members, mostly by daughters- in -law. However, around 8 percent
of the elderly reported that nobody is there to help them. The proportion of males (11
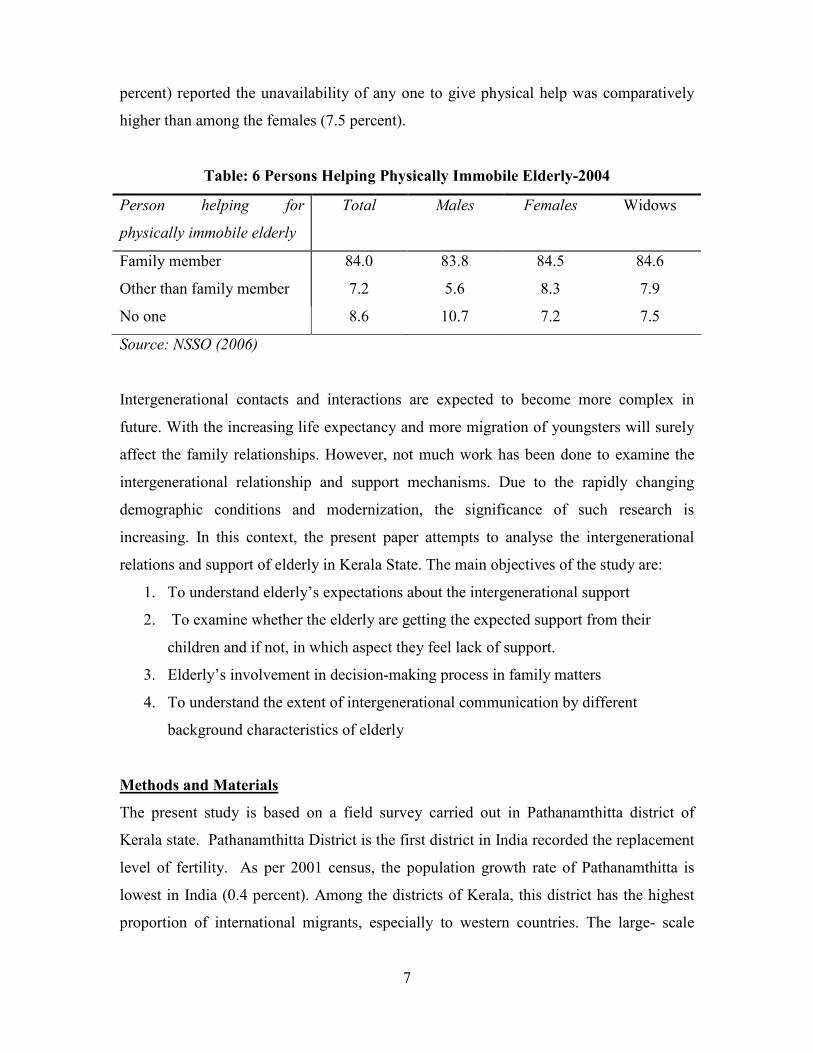
7
percent) reported the unavailability of any one to give physical help was comparatively
higher than among the females (7.5 percent).
Table: 6 Persons Helping Physically Immobile Elderly-2004
Person helping for
physically immobile elderly
Total Males Females Widows
Family member 84.0 83.8 84.5 84.6
Other than family member 7.2 5.6 8.3 7.9
No one 8.6 10.7 7.2 7.5
Source: NSSO (2006)
Intergenerational contacts and interactions are expected to become more complex in
future. With the increasing life expectancy and more migration of youngsters will surely
affect the family relationships. However, not much work has been done to examine the
intergenerational relationship and support mechanisms. Due to the rapidly changing
demographic conditions and modernization, the significance of such research is
increasing. In this context, the present paper attempts to analyse the intergenerational
relations and support of elderly in Kerala State. The main objectives of the study are:
1. To understand elderly’s expectations about the intergenerational support
2. To examine whether the elderly are getting the expected support from their
children and if not, in which aspect they feel lack of support.
3. Elderly’s involvement in decision-making process in family matters
4. To understand the extent of intergenerational communication by different
background characteristics of elderly
Methods and Materials
The present study is based on a field survey carried out in Pathanamthitta district of
Kerala state. Pathanamthitta District is the first district in India recorded the replacement
level of fertility. As per 2001 census, the population growth rate of Pathanamthitta is
lowest in India (0.4 percent). Among the districts of Kerala, this district has the highest
proportion of international migrants, especially to western countries. The large- scale
8
migration of young people can have many implications for the welfare of the elderly left
behind. A total of 300 elderly were interviewed from the sample households (184
women and 116 men). According to 2001 census the rural population constitutes 90
percent of the district and thus the survey focused only on rural areas. Among the five
talukas (sub-district level), two talukas have been randomly selected for the proposed
study. From each Taluka, 5 villages were randomly identified. In the next stage, from
each village (lowest administrative unit) one ward has been randomly selected, since the
village population size is very large in Kerala. Of these wards, the detail of households
having elderly has gathered from the electoral list which was prepared in 2006 and
available in Panchayat (local self-government body) office. In the final stage, 30
households of elderly from each ward were selected using systematic random sampling.
In this study, only one elderly from each of the selected household is considered as the
respondent. The information about living arrangements of elderly, economic dependency,
the persons providing financial assistance, and the elderly’s expectations about the
support from their children during old age, etc, was collected. The survey was carried
during March-July 2008
Findings
Out of the sample, 61.3 percent were women and 38.7 percent were men. Around 62
percent of the respondents were Hindus and 37 percent were Christians, only 1 percent of
the respondents were Muslims. 45 percent of the respondents belong to the general
category, and 30 percent were SC/ST, and 25 percent of the respondents from other
backward castes (OBC). Majority of the respondents were literate (83 percent) and
around 8.3 percent have education of higher secondary and above. With regard to marital
status, 48 percent of the respondents were currently married and 49 percent were
widowed. 31 percent of the elderly were unemployed and 34.7 percent were housewives.
However, around 25 percent of the respondents were engaged in economic activity and
9.3 percent were retired from the service. More than half of the respondents (53.3
percent) were economically fully dependent and around 14 percent were partially
dependent on others for their daily requirements. The living arrangements of elderly have
significant impact on the well being of elderly. 11 percent of the respondents were
9
staying alone and 16 percent were staying with their spouses. According to this survey,
around 71 percent of the elderly was living with their children.
Old age is the time of deteriorating health, both physical and psychological. It is the time
of support and security needed for the older persons. In India, family still continues to be
the primary institution where people find physical and psychological support and
security. Though majority still continues to live in families, there are changes in both
composition and quality of intergenerational relations and support. It is important to
know elderly’s expectations about the care and support from their children and grand
children. Almost all the respondents (98 percent) expect physical and medical care from
their children during old age and 88 percent expect financial support and 66 percent
expect emotional support from the children. Comparatively a higher proportion of
females expect care and support from their children than males. As age increases the
expectation of physical, medical and financial support from children also increases. As
the education increase the expectation of financial support from children reduces. The
educated elderly are, in general, economically independent during their old age.
However, the expectation of emotional support from children is interestingly high among
the higher educated people. Widows expect more physical and financial support from
their children than those who live with their spouse.
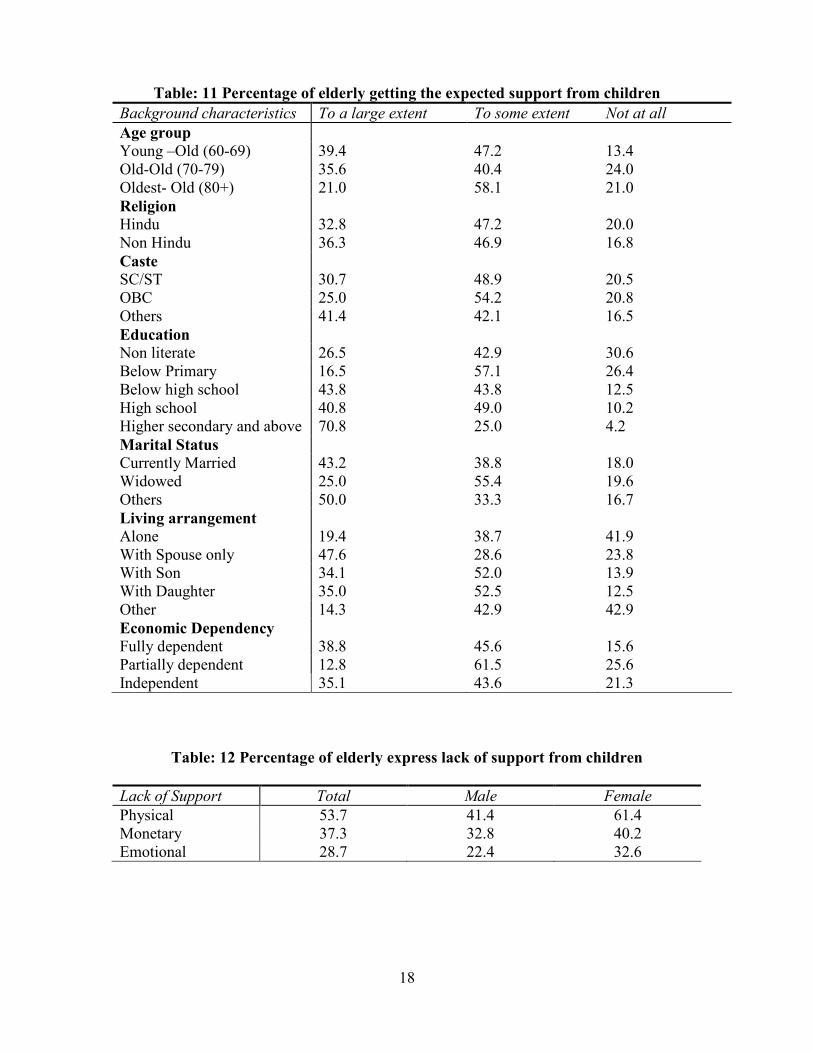
Around 34 percent of elderly stated that they are getting the expected support from their
children and 47 percent reported that they are getting the limited support. However, a
sizable proportion of elderly (19 percent) opined that they are not at all satisfied with the
support and care of their children. Comparatively higher percentages of females are not
receiving the expected support from their children. Considering the age group, around 40
percent of the young old (60-69 age group) respondents were getting the expected
support to a large extent, only 21 percent of the oldest – old (80+) reported they are
getting the expected support to a large extent from their children. Around 71 percent of
the elderly who have higher secondary and above education level reported that they are
getting the expected support from their children to a large extent. At the same time, only
26.5 percent of the non- literate and 16.5 percent of the respondents who are below
primary level of education were completely satisfied with the type of support they receive
10
from their children. Around 42 percent of the elderly living alone reported that they are
not at all getting the expected support from their children, while the corresponding figure
is only 14 percent among the elderly who are staying with son and 12.5 percent who are
staying with daughters. It is interesting to see that the percentages of elderly who are not
at all getting the expected support from their children are higher among economically
independent category than economically fully dependent elderly.
More than half of the respondents (54 percent) reported that they lack physical and
medical care from children and 37 percent reported lack of financial support. 29 percent
of the elderly express lack of emotional support from their children. Gender differences
were observed in lack of care in all aspects. Around 61 percent of elderly women
reported they felt the lack of physical and medical care while 41 percent of the males
reported lack of care. In the case of financial support the differences between sexes is
comparatively small, around 33 percent of the male respondents and 40 percent of the
female respondents reported lack of financial support from children. 22 percent of the
men and 33 percent of the women reported lack of emotional support. As age increases,
the percentage of elderly who reported lack of care and support from children also
increases; around 65 percent of oldest old reported lack of physical and medical support
compared to 45 percent in young old and 58 percent in old-old (70-79 age group). The
same trend has observed in financial support also. Around 74 percent of elderly who has
below primary school education reported lack of physical and medical care against 24
percent who completed higher secondary and above. Higher proportion of widows
reported lack of support from children than currently married respondents. The elderly
living alone or with others reported lack of support from children than the other
categories.
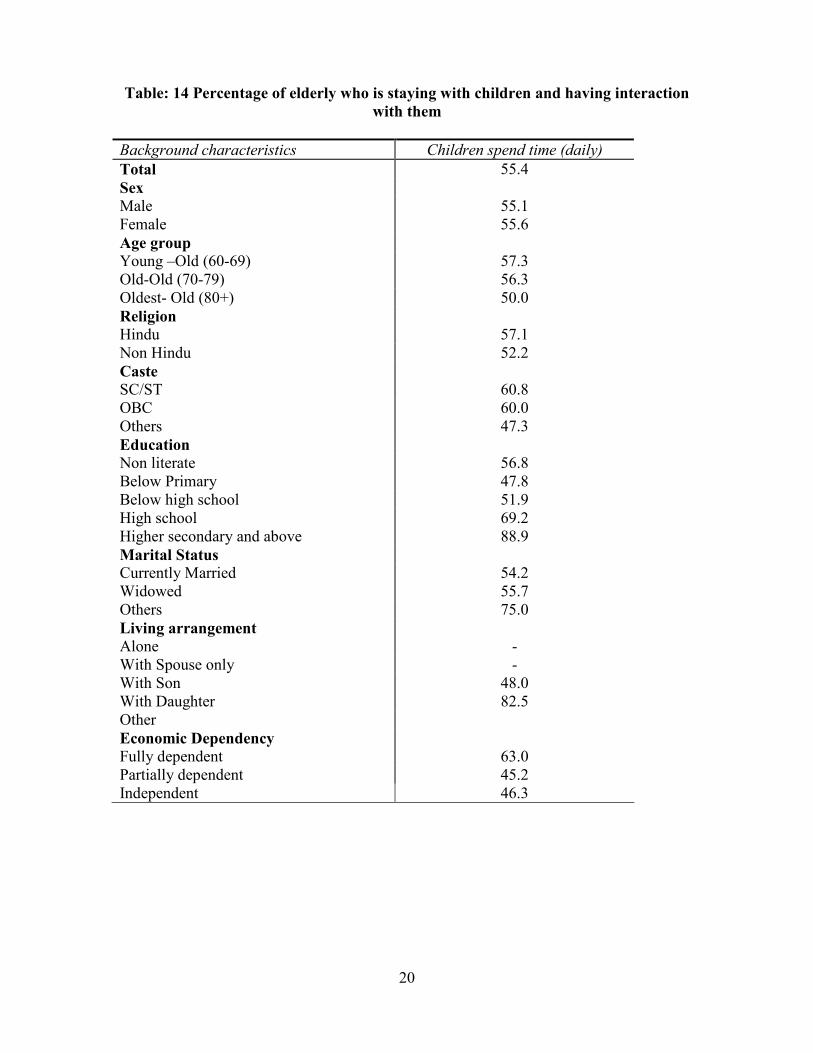
Intergenerational relationships are determined by a variety of factors and
intergenerational communication is one of the most important factors which determine
the quality of intergenerational relationship. More than half of the respondents (55.4
percent) reported that the son/daughter with whom they are staying with have
communication with them. There was not much variation observed between the sexes.
The elderly in young-old (57 percent) and old-old (56 percent) used to have more
11
communication with children than the oldest-old (50 percent). The analysis shows that
daughters used to spend more time with their parents than the sons. Among the elderly
who are staying with daughters around 83 percent have daily communication with their
children; while only 48 percent of elderly staying with sons reported that the sons used to
spend enough time with them. The economically dependent elderly have experienced
more intergenerational communication than the economically independent respondents.
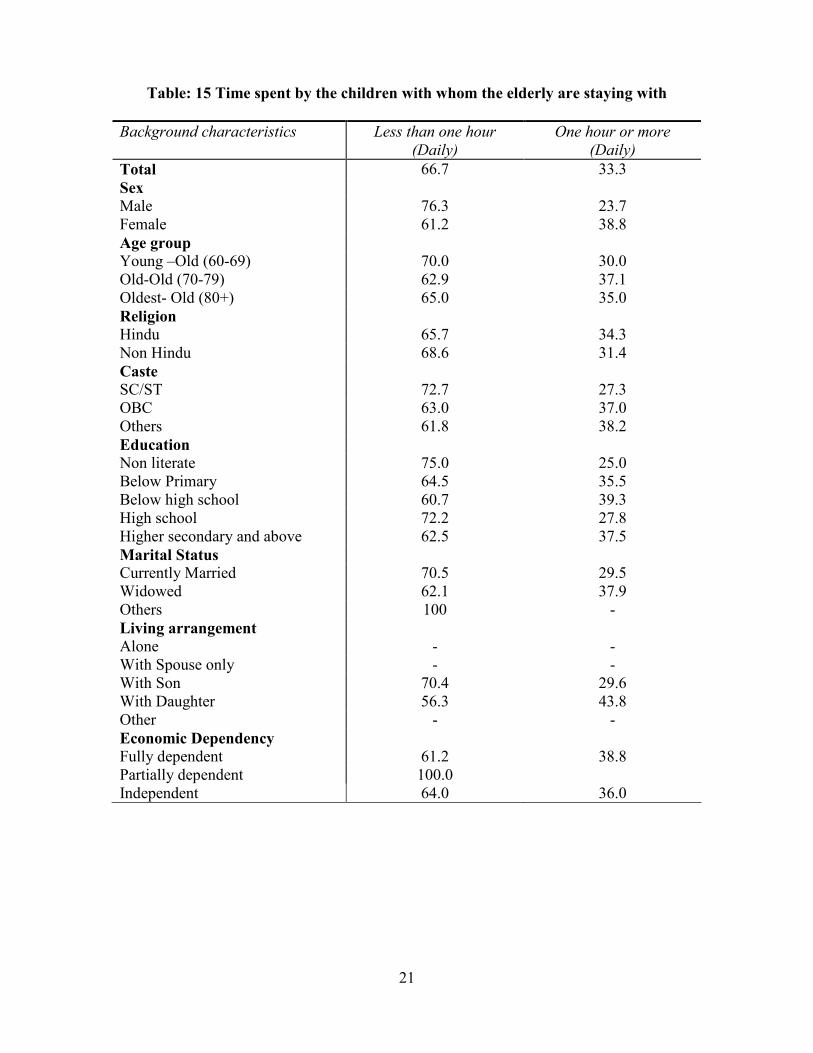
It is also observed that 33 percent of the elderly’s children used to spend one hour or
more daily with them. 39 percent of female elderly mentioned the interaction with child
is one hour or more compared to 24 percent of males. Among the elderly who are staying
with daughters 44 percent reported that daughters used to spend one hour or more with
them compared to 27 percent of the elderly who are staying with sons.
It is found that 53 percent of the elderly’s children used to communicate with them about
the day to day things and 36 percent used to communicate with them not for any special
purpose, and 10 percent used to communicate to enquire about their health. 58 percent of
the elderly males reported that the children used to talk about day- to-day things
compared to 51 percent of female elderly. Among the economically independent
respondents the intergenerational communication is mainly for day- to- day things (60
percent) or not for any special purpose (40 percent).
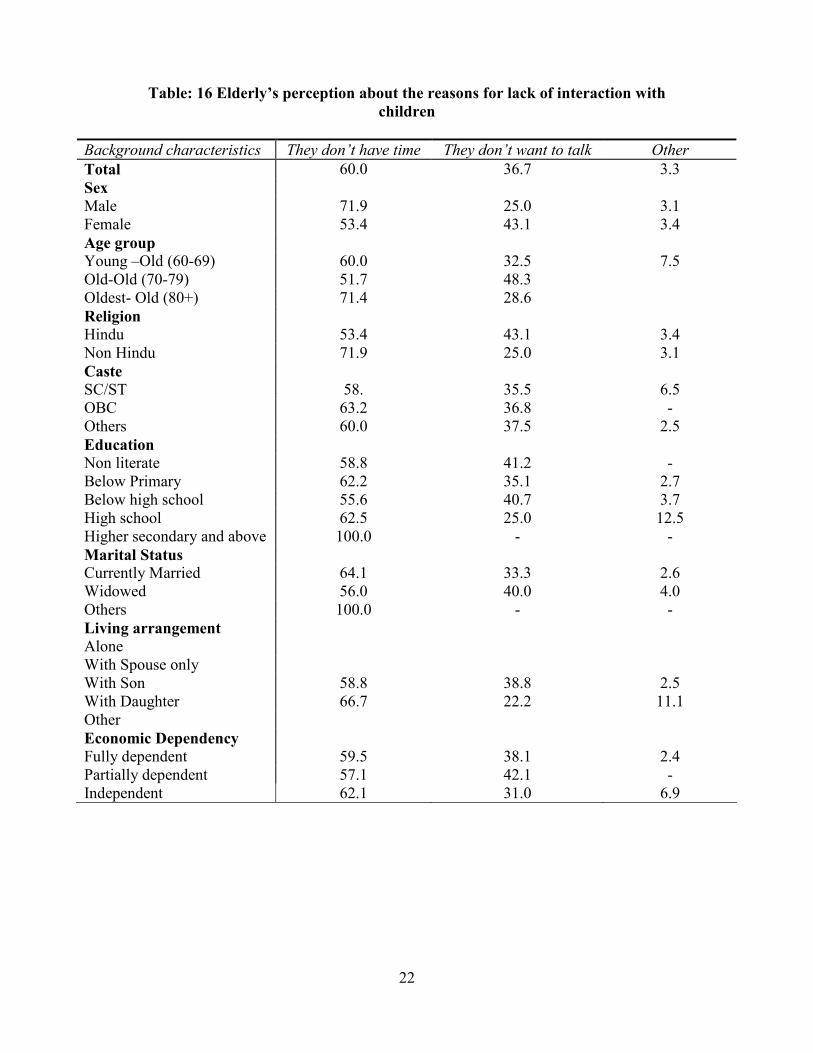
More than half (60 percent) of the elderly felt that the children (new generation) were
overburdened with other responsibilities, hence could not devote enough time with older
people. However, around 37 percent of the elderly reported that the children didn’t want
to talk with them. The gender difference was quite wide among the elderly about the
perception of children didn’t want to talk with them. Around 43 percent of the elderly
women express this as the reason for lack of intergenerational communication as against
25 percent of the males. With regard to the age group, a comparatively higher proportion
of elderly in old-old age group (48 percent) reported that children don’t want to talk with
them as the reason for lack of communication with the children with whom they are
staying with.
12
In the traditional Indian society, grand parents would play an important role in the rearing
and caring of the grand children. Due to modernization and industrialization not only the
joint family set- up is crumbling but also the intergenerational relationships also
undergoing a transition. The warmth grand parent-grand child relationship is also
deteriorating in our society as a result of breaking down of joint family system. However,
66 percent of the elderly reported that they have some interaction with their grand
children. It is interesting to see a comparatively higher proportion of males (70 percent)
reported the interaction with grand children than females (65 percent). As the age of the
grand parent increases the interaction with grand child reduces. More than 80 percent of
the elderly who have education of higher secondary or above reported that they used to
spend time with their grand children.
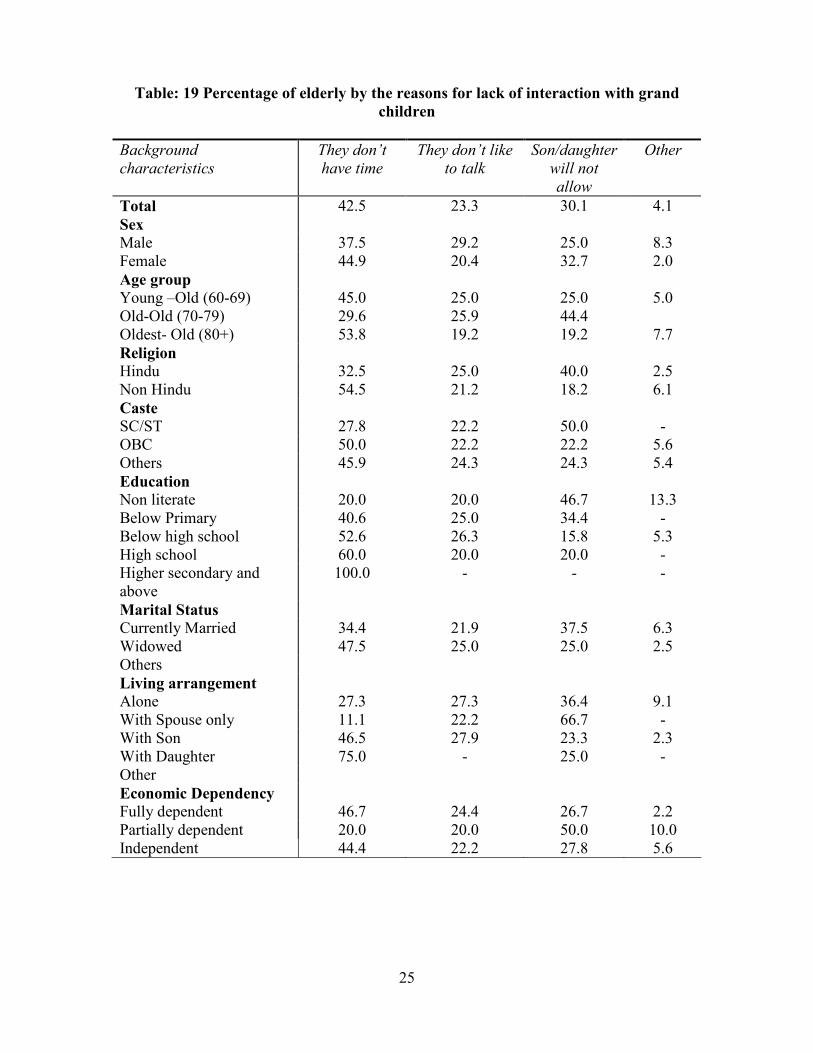
In order to understand the reasons for elderly not able to spend time with their grand
children, questions were asked to respondents. It is found that 42.5 percent of the
respondents feel the grand children don’t have time and 30 percent reported that the
son/daughter (son –in-law/daughter –in-law) were not allowing the children to spend time
with them and 23 percent feel the grand children don’t like to talk with them. Around 33
percent of the female respondents reported that their own children were not allowing the
grandchildren to interact with them, while 30 percent of the elderly men feel that the
grand children were not interested to interact with them.
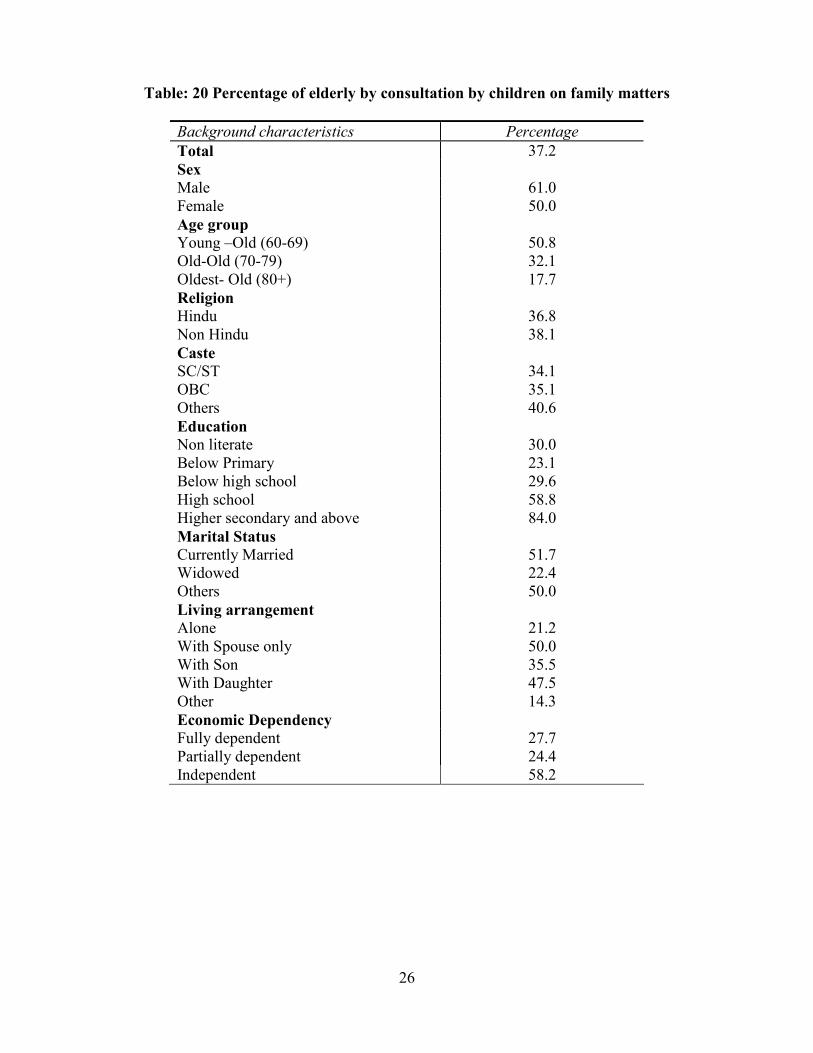
The children’s consultation with elderly about the family matters or the elderly’s
involvement in decision- making plays an important role to determine the
intergenerational amity. 37 percent of the elderly reported that they were consulted by the
children about family matters. Comparatively higher percent of the male respondents (61
percent) reported they were included in the decision- making process about the family
matters, like day- to -day expenses, decisions regarding the education of children,
marriage of children, etc. than the females (50 percent). As the age of the respondent
increase their involvement in consultation about family matters reduces. More than half
of the young – old respondents were included in the decision- making against 18 percent
of the oldest –old. Education of the elderly plays an important role to determine the
decision- making process. Around 84 percent of elderly who has education of higher

13
secondary and above were consulted in family matters, whereas only 23 percent
respondents were consulted by the children regarding family matters whose education is
below primary level. Economic independence and marital status has also positively
related with participation in decision- making. Half of the currently married elderly were
consulted by their children on family matters while only 22 percent of the widows were
consulted. 58 percent of the economically independent respondents participated in the
decision- making process compared to 28 percent of economically fully dependent.
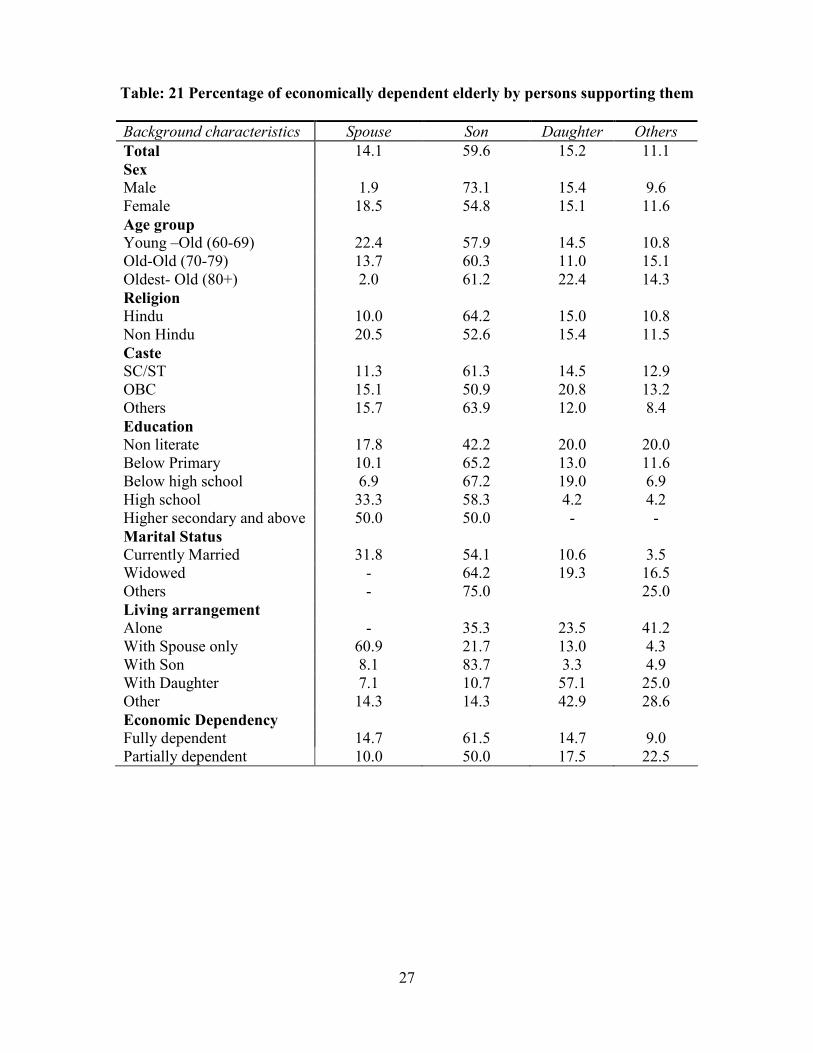
As mentioned earlier, the old age is the time of multiple illness and deterioration of one’s
financial status. The elderly are compelled to depend on their offspring for the support
and care during the advanced age. In India, still the family, especially sons, play an
important role in the care of elderly. The analysis shows that around 60 percent of the
economically dependent elderly were supported by the sons and 15 percent by the
daughters. Among the elderly in the oldest –old age group, 61 percent of the elderly get
economic support from their sons and 22 percent from their daughters. More elderly
males were supported by the sons than females. For female elderly the spousal support
also play an important role.
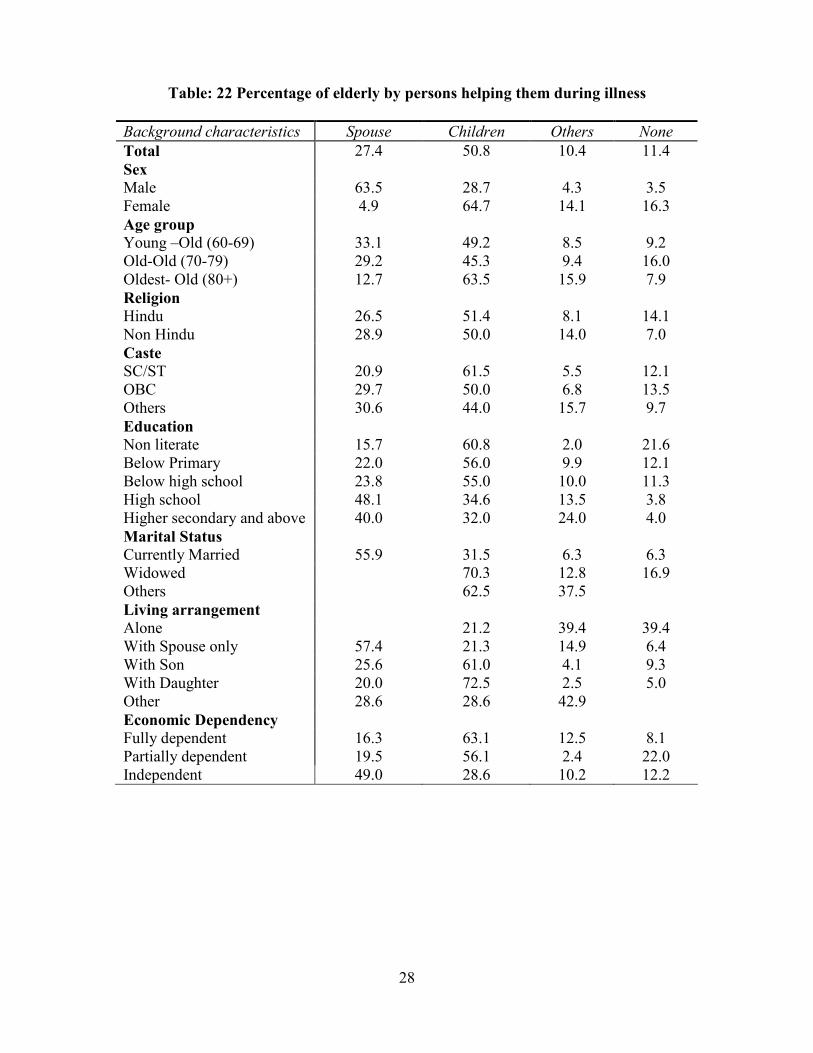
The analysis shows that, a little more than half (51 percent) of the elderly receive help
from their children at the time of illness. However, 11 percent of the respondents reported
that nobody there to help them even if they are sick. 16 percent of the female respondents
reported that nobody is there to take care of them during illness compared to 3.5 percent
of the males. With regard to the age, higher percent of respondents belong to the oldest –
old are receiving care from the children at the time of illness than others. Around 17
percent of the widows reported that there was nobody to help them during illness as
against 6.3 percent of the currently married elderly. Among the elderly who are living
alone 39 percent reported that nobody is available to support them during illness, while 9
percent of the elderly staying with sons and 5 percent of the elderly living with daughters
reported that nobody is there to support when they are sick.
Summary and Discussion
Ageing is not only an issue of concern of developed nations alone; it is also becoming an
issue of major concern in developing countries like India. Though it is only 7.5 percent of
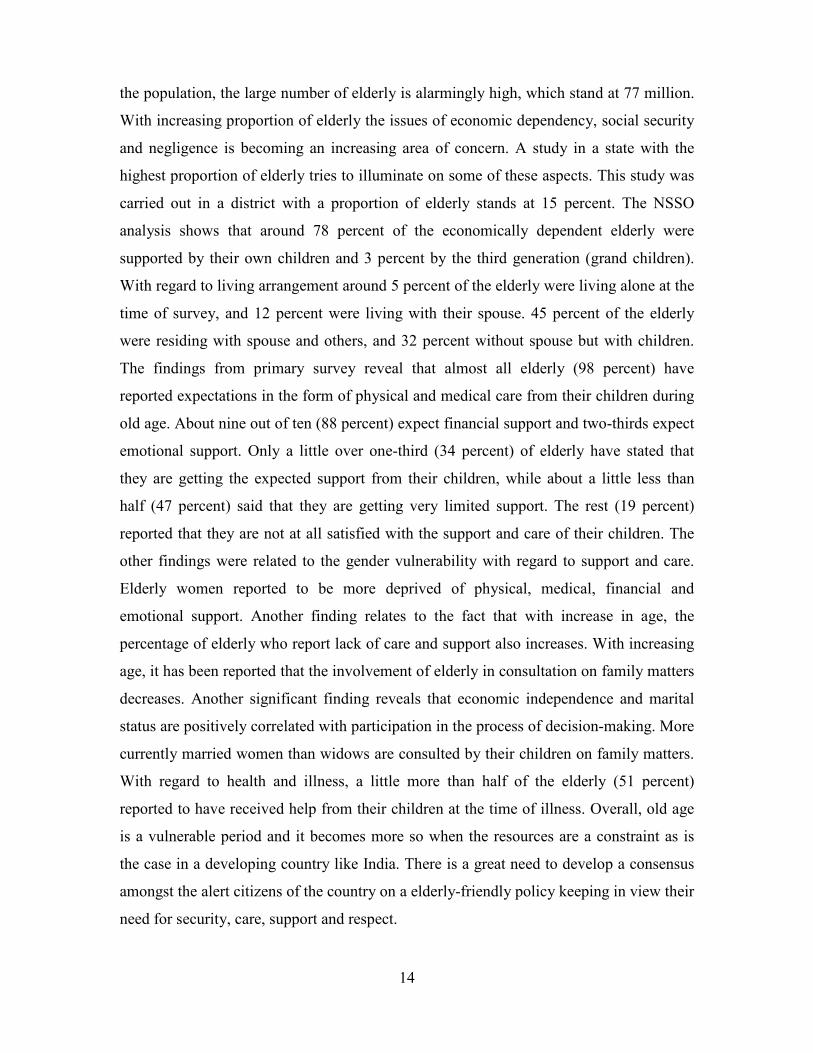
14
the population, the large number of elderly is alarmingly high, which stand at 77 million.
With increasing proportion of elderly the issues of economic dependency, social security
and negligence is becoming an increasing area of concern. A study in a state with the
highest proportion of elderly tries to illuminate on some of these aspects. This study was
carried out in a district with a proportion of elderly stands at 15 percent. The NSSO
analysis shows that around 78 percent of the economically dependent elderly were
supported by their own children and 3 percent by the third generation (grand children).
With regard to living arrangement around 5 percent of the elderly were living alone at the
time of survey, and 12 percent were living with their spouse. 45 percent of the elderly
were residing with spouse and others, and 32 percent without spouse but with children.
The findings from primary survey reveal that almost all elderly (98 percent) have
reported expectations in the form of physical and medical care from their children during
old age. About nine out of ten (88 percent) expect financial support and two-thirds expect
emotional support. Only a little over one-third (34 percent) of elderly have stated that
they are getting the expected support from their children, while about a little less than
half (47 percent) said that they are getting very limited support. The rest (19 percent)
reported that they are not at all satisfied with the support and care of their children. The
other findings were related to the gender vulnerability with regard to support and care.
Elderly women reported to be more deprived of physical, medical, financial and
emotional support. Another finding relates to the fact that with increase in age, the
percentage of elderly who report lack of care and support also increases. With increasing
age, it has been reported that the involvement of elderly in consultation on family matters
decreases. Another significant finding reveals that economic independence and marital
status are positively correlated with participation in the process of decision-making. More
currently married women than widows are consulted by their children on family matters.
With regard to health and illness, a little more than half of the elderly (51 percent)
reported to have received help from their children at the time of illness. Overall, old age
is a vulnerable period and it becomes more so when the resources are a constraint as is
the case in a developing country like India. There is a great need to develop a consensus
amongst the alert citizens of the country on a elderly-friendly policy keeping in view their
need for security, care, support and respect.
15
References
Batra, Sushma. and Bhaumik, Kakoli. 2007 “Intergenerational Relationships: A Study of
Three generations” in K.L Sharma (ed.) Studies in Gerontology-Intergenerational
Perspective. New Delhi. Rawat Publications,
Druvarajan.V. 1988. ”Religious Ideology and Inter-personal Relationship within the
Family”. Journal of comparative Family Studies, Vol (19) pp 273-285.
Gayatri Devi, B.P. 2004 “ Young and Old Judge One Another: Report of Focus Group
Discussions”in Indira Jai Prakash (ed.) Ageing: Search for New Paradigms.
Bangalore, University of Bangalore,
Jamuna. D. 2007 “Intergenerational Issues in Elder Care” in K.L Sharma (ed.) Studies in
Gerontology-Intergenerational Perspective. New Delhi. Rawat Publications,
National Sample Survey Organisation 2006. Morbidity, Health Care and the Condition of
the Aged, 60th round (2004), Ministry of Statistics and Programme
Implementation, New Delhi. Government of India.
Rajan, Irudaya. S and Mathew. E.T 2007. Social Security for the Elderly- Experiences
from South Asia, New Delhi, Routledge Publishers.
Sonar, B. Gangadhar and Siva Prasad.R 2007. “ Intergenerational Issues in Old Age: A
Study in Gulbarga District of Karnataka” in K.L Sharma (ed.) Studies in
Gerontology-Intergenerational Perspective. New Delhi , Rawat Publications.
United Nations, 2002. World Population Ageing 1950-2050, population division,
Department of Economic and Social Affairs, New York. United Nations.
WHO/INPEA 2002. Missing Voices: Views of Older Persons on Elder Abuse, Geneva.
World Health Organization.
16
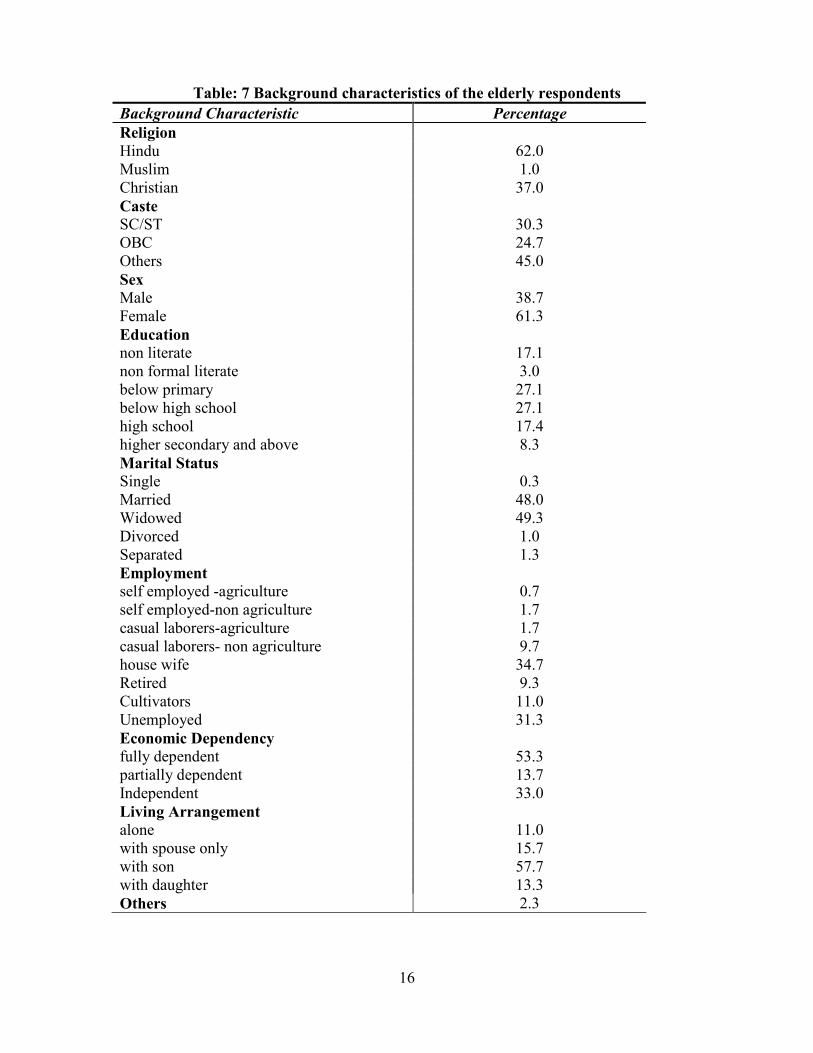
Table: 7 Background characteristics of the elderly respondents
Background Characteristic Percentage
Religion
Hindu 62.0
Muslim 1.0
Christian 37.0
Caste
SC/ST 30.3
OBC 24.7
Others 45.0
Sex
Male 38.7
Female 61.3
Education
non literate 17.1
non formal literate 3.0
below primary 27.1
below high school 27.1
high school 17.4
higher secondary and above 8.3
Marital Status
Single 0.3
Married 48.0
Widowed 49.3
Divorced 1.0
Separated 1.3
Employment
self employed -agriculture 0.7
self employed-non agriculture 1.7
casual laborers-agriculture 1.7
casual laborers- non agriculture 9.7
house wife 34.7
Retired 9.3
Cultivators 11.0
Unemployed 31.3
Economic Dependency
fully dependent 53.3
partially dependent 13.7
Independent 33.0
Living Arrangement
alone 11.0
with spouse only 15.7
with son 57.7
with daughter 13.3
Others 2.3
17
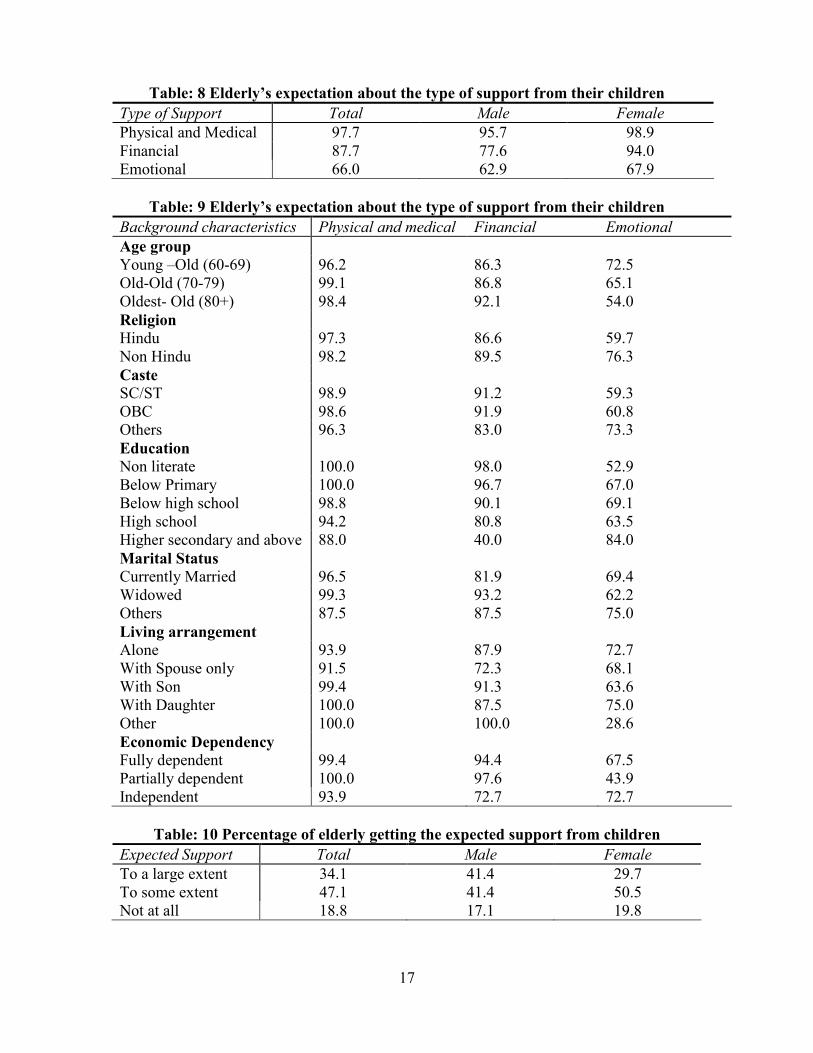
Table: 8 Elderly’s expectation about the type of support from their children
Type of Support Total Male Female
Physical and Medical 97.7 95.7 98.9
Financial 87.7 77.6 94.0
Emotional 66.0 62.9 67.9
Table: 9 Elderly’s expectation about the type of support from their children
Background characteristics Physical and medical Financial Emotional
Age group
Young –Old (60-69) 96.2 86.3 72.5
Old-Old (70-79) 99.1 86.8 65.1
Oldest- Old (80+) 98.4 92.1 54.0
Religion
Hindu 97.3 86.6 59.7
Non Hindu 98.2 89.5 76.3
Caste
SC/ST 98.9 91.2 59.3
OBC 98.6 91.9 60.8
Others 96.3 83.0 73.3
Education
Non literate 100.0 98.0 52.9
Below Primary 100.0 96.7 67.0
Below high school 98.8 90.1 69.1
High school 94.2 80.8 63.5
Higher secondary and above 88.0 40.0 84.0
Marital Status
Currently Married 96.5 81.9 69.4
Widowed 99.3 93.2 62.2
Others 87.5 87.5 75.0
Living arrangement
Alone 93.9 87.9 72.7
With Spouse only 91.5 72.3 68.1
With Son 99.4 91.3 63.6
With Daughter 100.0 87.5 75.0
Other 100.0 100.0 28.6
Economic Dependency
Fully dependent 99.4 94.4 67.5
Partially dependent 100.0 97.6 43.9
Independent 93.9 72.7 72.7
Table: 10 Percentage of elderly getting the expected support from children
Expected Support Total Male Female
To a large extent 34.1 41.4 29.7
To some extent 47.1 41.4 50.5
Not at all 18.8 17.1 19.8
18
Table: 11 Percentage of elderly getting the expected support from children
Background characteristics To a large extent To some extent Not at all
Age group
Young –Old (60-69) 39.4 47.2 13.4
Old-Old (70-79) 35.6 40.4 24.0
Oldest- Old (80+) 21.0 58.1 21.0
Religion
Hindu 32.8 47.2 20.0
Non Hindu 36.3 46.9 16.8
Caste
SC/ST 30.7 48.9 20.5
OBC 25.0 54.2 20.8
Others 41.4 42.1 16.5
Education
Non literate 26.5 42.9 30.6
Below Primary 16.5 57.1 26.4
Below high school 43.8 43.8 12.5
High school 40.8 49.0 10.2
Higher secondary and above 70.8 25.0 4.2
Marital Status
Currently Married 43.2 38.8 18.0
Widowed 25.0 55.4 19.6
Others 50.0 33.3 16.7
Living arrangement
Alone 19.4 38.7 41.9
With Spouse only 47.6 28.6 23.8
With Son 34.1 52.0 13.9
With Daughter 35.0 52.5 12.5
Other 14.3 42.9 42.9
Economic Dependency
Fully dependent 38.8 45.6 15.6
Partially dependent 12.8 61.5 25.6
Independent 35.1 43.6 21.3
Table: 12 Percentage of elderly express lack of support from children
Lack of Support Total Male Female
Physical 53.7 41.4 61.4
Monetary 37.3 32.8 40.2
Emotional 28.7 22.4 32.6

19
Table: 13 Percentage of elderly express lack of support from children
Background characteristics Physical financial Emotional
Age group
Young –Old (60-69) 45.0 32.8 28.2
Old-Old (70-79) 57.5 38.7 24.5
Oldest- Old (80+) 65.1 44.4 36.5
Religion
Hindu 55.4 41.4 27.4
Non Hindu 50.9 30.7 30.7
Caste
SC/ST 53.8 53.8 27.5
OBC 62.2 36.5 33.8
Others 48.9 26.7 26.7
Education
Non literate 60.8 62.7 21.6
Below Primary 73.6 50.5 36.3
Below high school 46.9 24.7 25.9
High school 36.5 25.0 30.8
Higher secondary and above 24.0 4.0 20.0
Marital Status
Currently Married 41.7 29.2 26.4
Widowed 66.2 45.3 30.4
Others 37.5 37.5 37.5
Living arrangement
Alone 66.7 45.5 54.5
With Spouse only 34.0 27.7 25.5
With Son 54.9 30.7 24.9
With Daughter 55.0 42.5 32.5
Other 85.7 42.9 -
Economic Dependency
Fully dependent 49.4 32.5 27.5
Partially dependent 82.9 65.9 24.4
Independent 48.5 33.3 32.3
20
Table: 14 Percentage of elderly who is staying with children and having interaction
with them
Background characteristics Children spend time (daily)
Total 55.4
Sex
Male 55.1
Female 55.6
Age group
Young –Old (60-69) 57.3
Old-Old (70-79) 56.3
Oldest- Old (80+) 50.0
Religion
Hindu 57.1
Non Hindu 52.2
Caste
SC/ST 60.8
OBC 60.0
Others 47.3
Education
Non literate 56.8
Below Primary 47.8
Below high school 51.9
High school 69.2
Higher secondary and above 88.9
Marital Status
Currently Married 54.2
Widowed 55.7
Others 75.0
Living arrangement
Alone -
With Spouse only -
With Son 48.0
With Daughter 82.5
Other
Economic Dependency
Fully dependent 63.0
Partially dependent 45.2
Independent 46.3
21
Table: 15 Time spent by the children with whom the elderly are staying with
Background characteristics Less than one hour
(Daily)
One hour or more
(Daily)
Total 66.7 33.3
Sex
Male 76.3 23.7
Female 61.2 38.8
Age group
Young –Old (60-69) 70.0 30.0
Old-Old (70-79) 62.9 37.1
Oldest- Old (80+) 65.0 35.0
Religion
Hindu 65.7 34.3
Non Hindu 68.6 31.4
Caste
SC/ST 72.7 27.3
OBC 63.0 37.0
Others 61.8 38.2
Education
Non literate 75.0 25.0
Below Primary 64.5 35.5
Below high school 60.7 39.3
High school 72.2 27.8
Higher secondary and above 62.5 37.5
Marital Status
Currently Married 70.5 29.5
Widowed 62.1 37.9
Others 100 -
Living arrangement
Alone - -
With Spouse only - -
With Son 70.4 29.6
With Daughter 56.3 43.8
Other - -
Economic Dependency
Fully dependent 61.2 38.8
Partially dependent 100.0
Independent 64.0 36.0
22
Table: 16 Elderly’s perception about the reasons for lack of interaction with
children
Background characteristics They don’t have time They don’t want to talk Other
Total 60.0 36.7 3.3
Sex
Male 71.9 25.0 3.1
Female 53.4 43.1 3.4
Age group
Young –Old (60-69) 60.0 32.5 7.5
Old-Old (70-79) 51.7 48.3
Oldest- Old (80+) 71.4 28.6
Religion
Hindu 53.4 43.1 3.4
Non Hindu 71.9 25.0 3.1
Caste
SC/ST 58. 35.5 6.5
OBC 63.2 36.8 -
Others 60.0 37.5 2.5
Education
Non literate 58.8 41.2 -
Below Primary 62.2 35.1 2.7
Below high school 55.6 40.7 3.7
High school 62.5 25.0 12.5
Higher secondary and above 100.0 - -
Marital Status
Currently Married 64.1 33.3 2.6
Widowed 56.0 40.0 4.0
Others 100.0 - -
Living arrangement
Alone
With Spouse only
With Son 58.8 38.8 2.5
With Daughter 66.7 22.2 11.1
Other
Economic Dependency
Fully dependent 59.5 38.1 2.4
Partially dependent 57.1 42.1 -
Independent 62.1 31.0 6.9

23
Table: 17 Percentage of Elderly with the purpose of interaction with children
Background characteristics Day to day things To enquire about the
health
Not for any
special purpose
Total 53.3 10.5 36.2
Sex
Male 57.9 10.5 31.6
Female 50.7 10.4 38.8
Age group
Young –Old (60-69) 52.0 8.0 40.0
Old-Old (70-79) 57.1 11.4 31.4
Oldest- Old (80+) 50.0 15.0 35.0
Religion
Hindu 58.6 10.0 31.4
Non Hindu 42.9 11.4 45.7
Caste
SC/ST 52.3 6.8 40.9
OBC 55.6 11.1 33.3
Others 52.9 14.7 32.4
Education
Non literate 45.0 5.0 50.0
Below Primary 51.6 6.5 41.9
Below high school 64.3 25.0 10.7
High school 61.1 5.6 33.3
Higher secondary and above 25.0 - 75.0
Marital Status
Currently Married 59.1 9.1 31.8
Widowed 51.7 12.1 36.2
Others - - 100.0
Living arrangement
Alone
With Spouse only
With Son 52.1 12.7 35.2
With Daughter 56.3 6.3 37.5
Other
Economic Dependency
Fully dependent 50.7 11.9 37.3
Partially dependent 53.8 23.1 23.1
Independent 60.0 - 40.0

24
Table: 18 Proportion of elderly who have interaction with grand children
Background characteristics Percentage
Total 66.5
Sex
Male 70.1
Female 64.6
Age group
Young –Old (60-69) 77.2
Old-Old (70-79) 63.6
Oldest- Old (80+) 51.9
Religion
Hindu 70.1
Non Hindu 60.9
Caste
SC/ST 74.6
OBC 64.8
Others 61.5
Education
Non literate 65.9
Below Primary 56.0
Below high school 68.9
High school 82.2
Higher secondary and above 83.3
Marital Status
Currently Married 67.6
Widowed 65.2
Others 75.0
Living arrangement
Alone 14.3
With Spouse only 52.6
With Son 72.4
With Daughter 74.2
Other 40.0
Economic Dependency
Fully dependent 64.3
Partially dependent 69.7
Independent 69.4
25
Table: 19 Percentage of elderly by the reasons for lack of interaction with grand
children
Background
characteristics
They don’t
have time
They don’t like
to talk
Son/daughter
will not
allow
Other
Total 42.5 23.3 30.1 4.1
Sex
Male 37.5 29.2 25.0 8.3
Female 44.9 20.4 32.7 2.0
Age group
Young –Old (60-69) 45.0 25.0 25.0 5.0
Old-Old (70-79) 29.6 25.9 44.4
Oldest- Old (80+) 53.8 19.2 19.2 7.7
Religion
Hindu 32.5 25.0 40.0 2.5
Non Hindu 54.5 21.2 18.2 6.1
Caste
SC/ST 27.8 22.2 50.0 -
OBC 50.0 22.2 22.2 5.6
Others 45.9 24.3 24.3 5.4
Education
Non literate 20.0 20.0 46.7 13.3
Below Primary 40.6 25.0 34.4 -
Below high school 52.6 26.3 15.8 5.3
High school 60.0 20.0 20.0 -
Higher secondary and
above
100.0 - - -
Marital Status
Currently Married 34.4 21.9 37.5 6.3
Widowed 47.5 25.0 25.0 2.5
Others
Living arrangement
Alone 27.3 27.3 36.4 9.1
With Spouse only 11.1 22.2 66.7 -
With Son 46.5 27.9 23.3 2.3
With Daughter 75.0 - 25.0 -
Other
Economic Dependency
Fully dependent 46.7 24.4 26.7 2.2
Partially dependent 20.0 20.0 50.0 10.0
Independent 44.4 22.2 27.8 5.6
26
Table: 20 Percentage of elderly by consultation by children on family matters
Background characteristics Percentage
Total 37.2
Sex
Male 61.0
Female 50.0
Age group
Young –Old (60-69) 50.8
Old-Old (70-79) 32.1
Oldest- Old (80+) 17.7
Religion
Hindu 36.8
Non Hindu 38.1
Caste
SC/ST 34.1
OBC 35.1
Others 40.6
Education
Non literate 30.0
Below Primary 23.1
Below high school 29.6
High school 58.8
Higher secondary and above 84.0
Marital Status
Currently Married 51.7
Widowed 22.4
Others 50.0
Living arrangement
Alone 21.2
With Spouse only 50.0
With Son 35.5
With Daughter 47.5
Other 14.3
Economic Dependency
Fully dependent 27.7
Partially dependent 24.4
Independent 58.2
27
Table: 21 Percentage of economically dependent elderly by persons supporting them
Background characteristics Spouse Son Daughter Others
Total 14.1 59.6 15.2 11.1
Sex
Male 1.9 73.1 15.4 9.6
Female 18.5 54.8 15.1 11.6
Age group
Young –Old (60-69) 22.4 57.9 14.5 10.8
Old-Old (70-79) 13.7 60.3 11.0 15.1
Oldest- Old (80+) 2.0 61.2 22.4 14.3
Religion
Hindu 10.0 64.2 15.0 10.8
Non Hindu 20.5 52.6 15.4 11.5
Caste
SC/ST 11.3 61.3 14.5 12.9
OBC 15.1 50.9 20.8 13.2
Others 15.7 63.9 12.0 8.4
Education
Non literate 17.8 42.2 20.0 20.0
Below Primary 10.1 65.2 13.0 11.6
Below high school 6.9 67.2 19.0 6.9
High school 33.3 58.3 4.2 4.2
Higher secondary and above 50.0 50.0 - -
Marital Status
Currently Married 31.8 54.1 10.6 3.5
Widowed - 64.2 19.3 16.5
Others - 75.0 25.0
Living arrangement
Alone - 35.3 23.5 41.2
With Spouse only 60.9 21.7 13.0 4.3
With Son 8.1 83.7 3.3 4.9
With Daughter 7.1 10.7 57.1 25.0
Other 14.3 14.3 42.9 28.6
Economic Dependency
Fully dependent 14.7 61.5 14.7 9.0
Partially dependent 10.0 50.0 17.5 22.5
28
Table: 22 Percentage of elderly by persons helping them during illness
Background characteristics Spouse Children Others None
Total 27.4 50.8 10.4 11.4
Sex
Male 63.5 28.7 4.3 3.5
Female 4.9 64.7 14.1 16.3
Age group
Young –Old (60-69) 33.1 49.2 8.5 9.2
Old-Old (70-79) 29.2 45.3 9.4 16.0
Oldest- Old (80+) 12.7 63.5 15.9 7.9
Religion
Hindu 26.5 51.4 8.1 14.1
Non Hindu 28.9 50.0 14.0 7.0
Caste
SC/ST 20.9 61.5 5.5 12.1
OBC 29.7 50.0 6.8 13.5
Others 30.6 44.0 15.7 9.7
Education
Non literate 15.7 60.8 2.0 21.6
Below Primary 22.0 56.0 9.9 12.1
Below high school 23.8 55.0 10.0 11.3
High school 48.1 34.6 13.5 3.8
Higher secondary and above 40.0 32.0 24.0 4.0
Marital Status
Currently Married 55.9 31.5 6.3 6.3
Widowed 70.3 12.8 16.9
Others 62.5 37.5
Living arrangement
Alone 21.2 39.4 39.4
With Spouse only 57.4 21.3 14.9 6.4
With Son 25.6 61.0 4.1 9.3
With Daughter 20.0 72.5 2.5 5.0
Other 28.6 28.6 42.9
Economic Dependency
Fully dependent 16.3 63.1 12.5 8.1
Partially dependent 19.5 56.1 2.4 22.0
Independent 49.0 28.6 10.2 12.2