interfor investor presentation august 2021 - final
TRANSCRIPT
INVESTOR PRESENTATION AUGUST 2021
2
FORWARD-LOOKING INFORMATION & NON-GAAP MEASURES
Forward-Looking Information: This release contains forward-looking information about Interfor Corporation’s (“Interfor” or the “Company”) business outlook, objectives, plans, strategic priorities and other information that is not historical fact. A statement contains forward-lookinginformation when the Company uses what it knows and expects today, to make a statement about the future. Statements containing forward-looking information in this release, include but are not limited to, statements regarding production capacity, facility restart plans and ramp-up timelines, pro-forma capacity, expected earnings and returns, pro-forma debt ratios, liquidity, borrowing capacity, regulatory approvals and the expected closing date, and other relevant factors. Readers are cautioned that actual results may vary from the forward-looking information in this release, and undue reliance should not be placed on such forward-looking information. Risk factors that could cause actual results to differ materially from the forward-looking information in this release are described in Interfor’s annual Management’s Discussion & Analysis under the heading “Risks and Uncertainties”, which is available on www.interfor.com and under Interfor’s profile on www.sedar.com. Material factors and assumptions used to develop the forward-looking information in this report include volatility in the selling prices for lumber, logs and wood chips; the Company’s ability to compete on a global basis; the availability and cost of log supply; natural or man-made disasters; currencyexchange rates; changes in government regulations; the availability of the Company’s allowable annual cut (“AAC”); claims by and treaty settlements with Indigenous peoples; the Company’s ability to export its products; the softwood lumber trade dispute between Canada and the U.S.; stumpage fees payable to the Province of British Columbia (“B.C.”); environmental impacts of the Company’s operations; labour disruptions; information systems security; and the existence of a public health crises (such as the current COVID-19 pandemic). Unless otherwise indicated, the forward-looking statements in this release are based on the Company’s expectations at the date of this release. Interfor undertakes no obligation to update such forward-looking information or statements, except as required by law.
Non-GAAP Measures:This presentation makes reference to certain non-GAAP measures, such as EBITDA, Adjusted EBITDA and Net debt to invested capital, which are used by the Company and certain investors to evaluate operating performance and financial position. These non-GAAP measures do not have any standardized meaning prescribed by IFRS and are therefore unlikely to be comparable to similar measures presented by other issuers. Definitions and reconciliations of terms can be found in Interfor’s annual and quarterly Management’s Discussion & Analysis which are available on www.interfor.com and under Interfor’s profile on www.sedar.com.
Currency: All financial references in this presentation are expressed in Canadian dollars, unless otherwise noted.
3
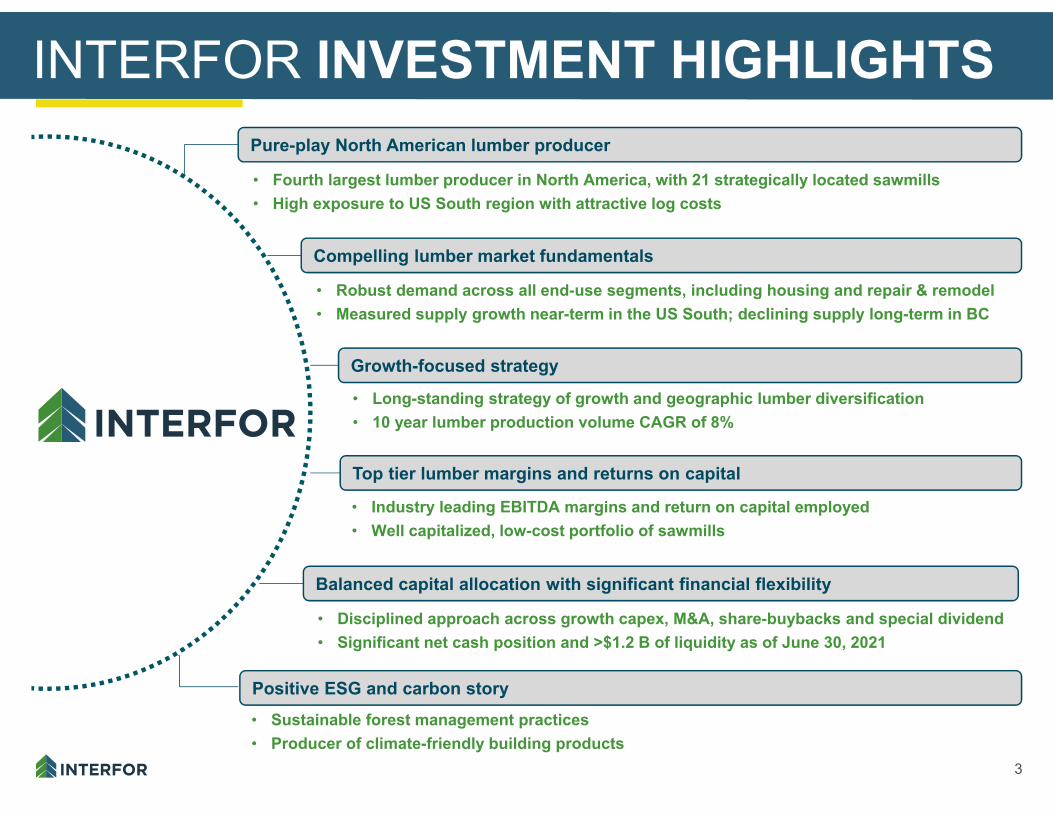
INTERFOR INVESTMENT HIGHLIGHTS Pure-play North American lumber producer
• Fourth largest lumber producer in North America, with 21 strategically located sawmills • High exposure to US South region with attractive log costs
Growth-focused strategy
• Long-standing strategy of growth and geographic lumber diversification • 10 year lumber production volume CAGR of 8%
Compelling lumber market fundamentals
• Robust demand across all end-use segments, including housing and repair & remodel• Measured supply growth near-term in the US South; declining supply long-term in BC
Top tier lumber margins and returns on capital
• Industry leading EBITDA margins and return on capital employed• Well capitalized, low-cost portfolio of sawmills
Positive ESG and carbon story• Sustainable forest management practices• Producer of climate-friendly building products
Balanced capital allocation with significant financial flexibility
• Disciplined approach across growth capex, M&A, share-buybacks and special dividend • Significant net cash position and >$1.2 B of liquidity as of June 30, 2021
4
-60%-50%-40%-30%-20%-10%0%10%20%30%40%50%
$0
$200
$400
$600
$800
$1,000
$1,200
$1,400
Q1 Q2 Q3 Q4 Q1 Q2 Q3 Q4 Q1 Q2 Q3 Q4 Q1 Q2 Q3 Q4 Q1 Q2 Q3 Q4 Q1 Q2
2016 2017 2018 2019 2020 2021
Available Liquidity ($MM)
Net Debt / Invested Capital Ratio (%)
$0$50
$100$150$200$250$300$350$400$450$500$550$600$650
Q1 Q2 Q3 Q4 Q1 Q2 Q3 Q4 Q1 Q2 Q3 Q4 Q1 Q2 Q3 Q4 Q1 Q2 Q3 Q4 Q1 Q2
2016 2017 2018 2019 2020 2021
400
450
500
550
600
650
700
750
Q1 Q2 Q3 Q4 Q1 Q2 Q3 Q4 Q1 Q2 Q3 Q4 Q1 Q2 Q3 Q4 Q1 Q2 Q3 Q4 Q1 Q2
2016 2017 2018 2019 2020 2021
$250
$450
$650
$850
$1,050
$1,250
$1,450
Q1 Q2 Q3 Q4 Q1 Q2 Q3 Q4 Q1 Q2 Q3 Q4 Q1 Q2 Q3 Q4 Q1 Q2 Q3 Q4 Q1 Q2
2016 2017 2018 2019 2020 2021
WSPF Composite (US$/Mbf)
SYP Composite (US$/Mbf)
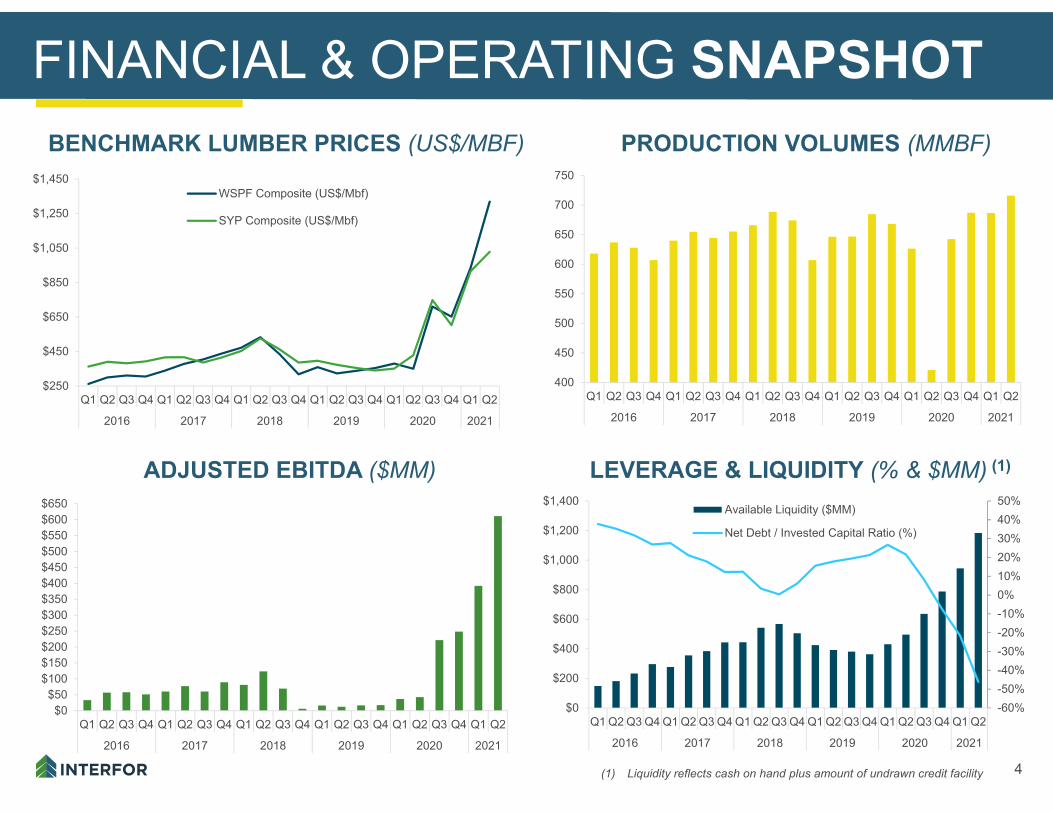
FINANCIAL & OPERATING SNAPSHOTBENCHMARK LUMBER PRICES (US$/MBF) PRODUCTION VOLUMES (MMBF)
LEVERAGE & LIQUIDITY (% & $MM) (1)ADJUSTED EBITDA ($MM)
(1) Liquidity reflects cash on hand plus amount of undrawn credit facility
PURE-PLAY NORTH AMERICAN LUMBER PRODUCER
6
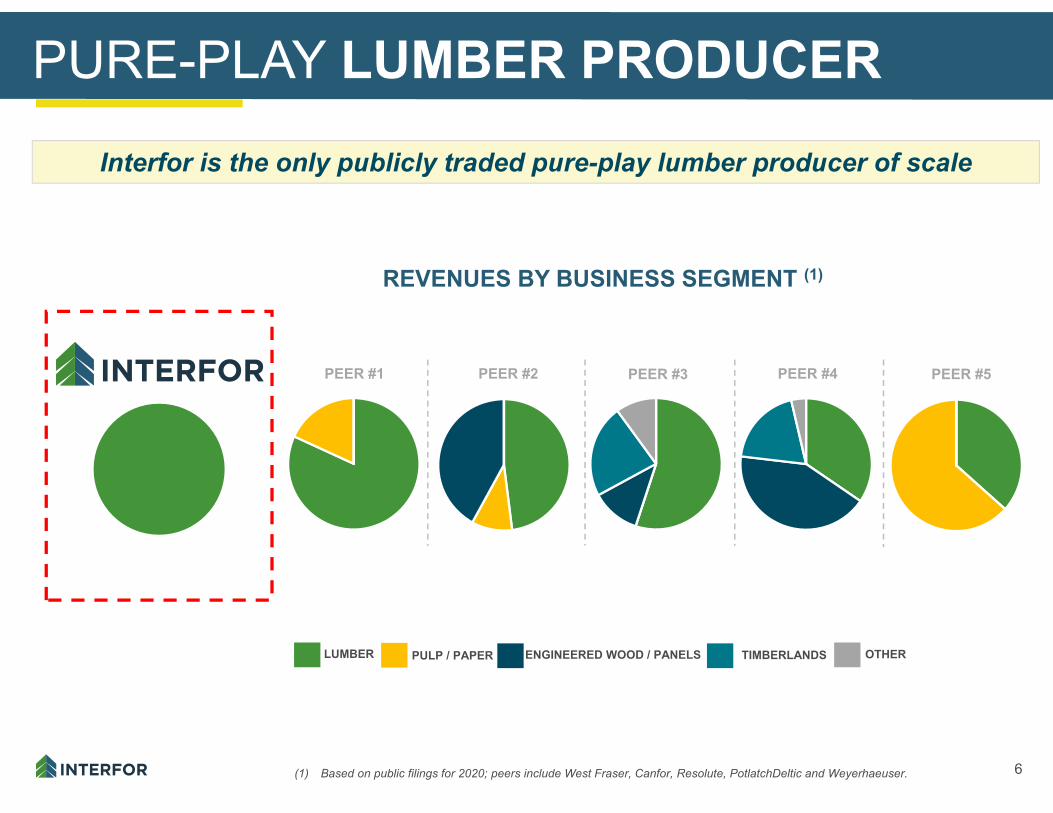
PURE-PLAY LUMBER PRODUCER
(1) Based on public filings for 2020; peers include West Fraser, Canfor, Resolute, PotlatchDeltic and Weyerhaeuser.
REVENUES BY BUSINESS SEGMENT (1)
PEER #1 PEER #2 PEER #3 PEER #4 PEER #5
LUMBER PULP / PAPER ENGINEERED WOOD / PANELS TIMBERLANDS OTHER
Interfor is the only publicly traded pure-play lumber producer of scale
7
-
1.0
2.0
3.0
4.0
5.0
6.0
7.0
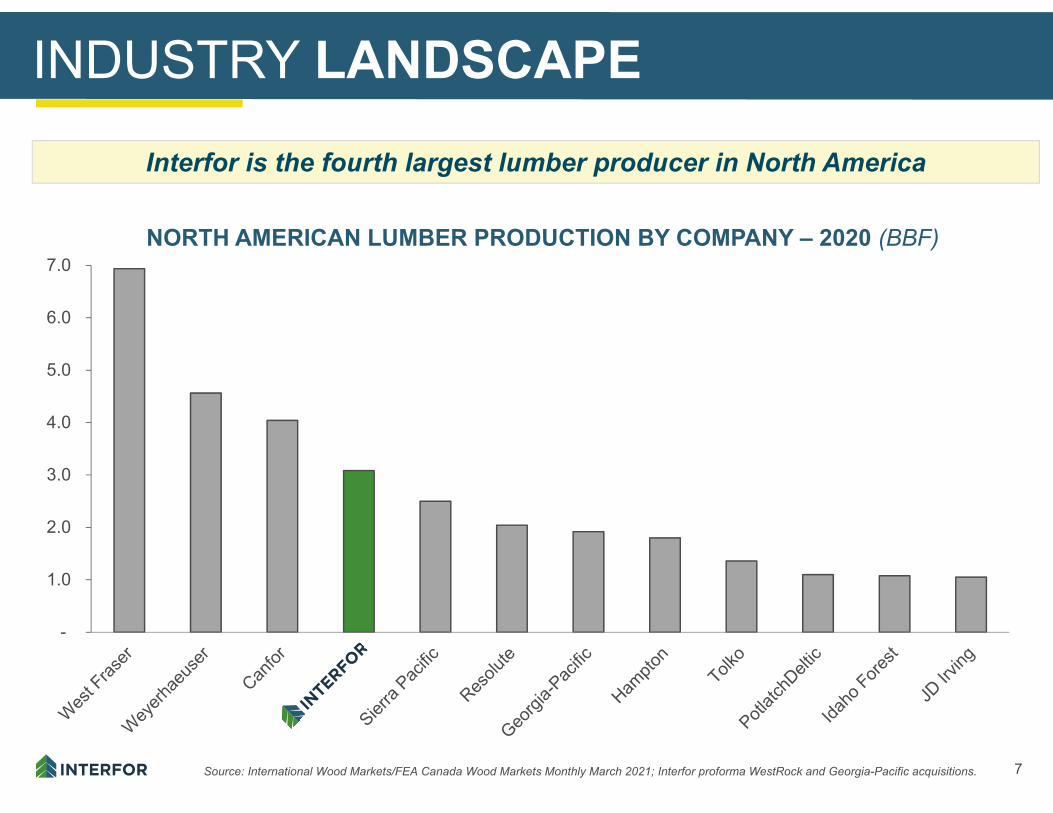
INDUSTRY LANDSCAPE
NORTH AMERICAN LUMBER PRODUCTION BY COMPANY – 2020 (BBF)
Source: International Wood Markets/FEA Canada Wood Markets Monthly March 2021; Interfor proforma WestRock and Georgia-Pacific acquisitions.
Interfor is the fourth largest lumber producer in North America
8
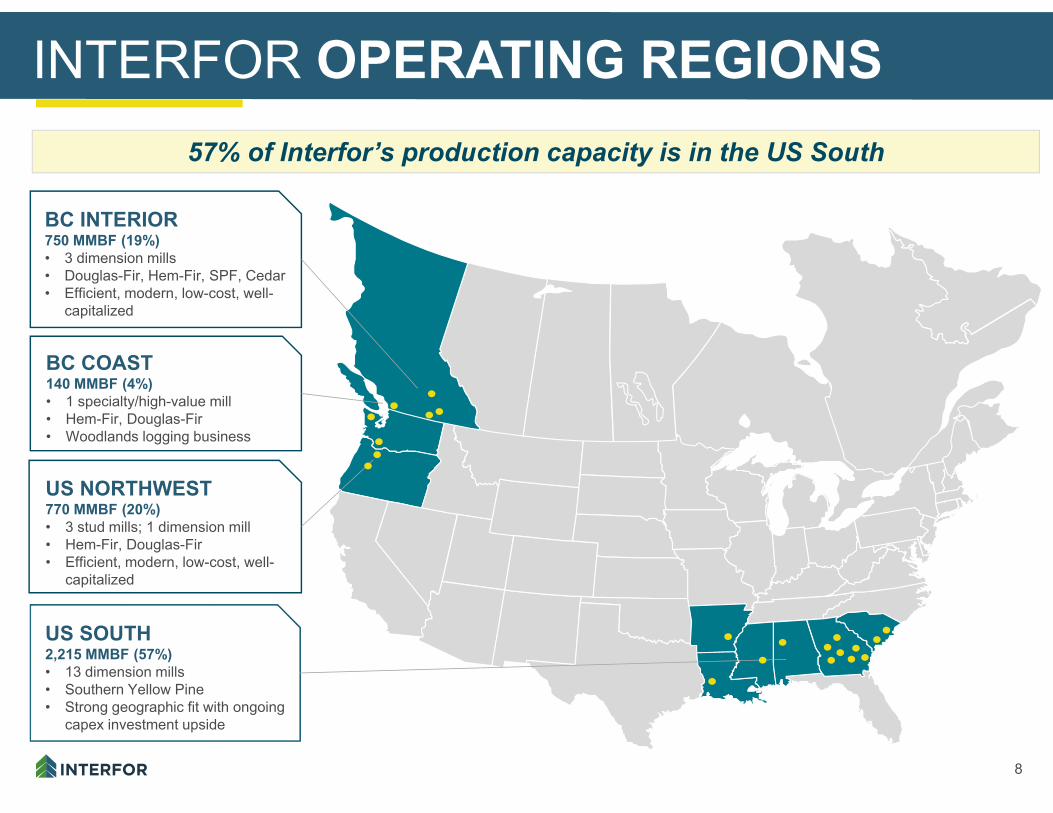
INTERFOR OPERATING REGIONS57% of Interfor’s production capacity is in the US South
BC COAST140 MMBF (4%)• 1 specialty/high-value mill• Hem-Fir, Douglas-Fir• Woodlands logging business dfdfd
US NORTHWEST770 MMBF (20%)• 3 stud mills; 1 dimension mill• Hem-Fir, Douglas-Fir• Efficient, modern, low-cost, well-
capitalized dddddd dfdf dfd hhjhjj
BC INTERIOR750 MMBF (19%)• 3 dimension mills• Douglas-Fir, Hem-Fir, SPF, Cedar• Efficient, modern, low-cost, well-
capitalized dfdffffffffffffffffffffff dfdfd
US SOUTH2,215 MMBF (57%)• 13 dimension mills• Southern Yellow Pine• Strong geographic fit with ongoing
capex investment upside d
9
‐20%
0%
20%
40%
60%
80%
100%
120%
140%
160%
180%
2013 2014 2015 2016 2017 2018 2019 2020 2021‐20%
0%
20%
40%
60%
80%
100%
120%
140%
160%
180%
2013 2014 2015 2016 2017 2018 2019 2020 2021‐20%
0%
20%
40%
60%
80%
100%
120%
140%
160%
180%
2013 2014 2015 2016 2017 2018 2019 2020 2021
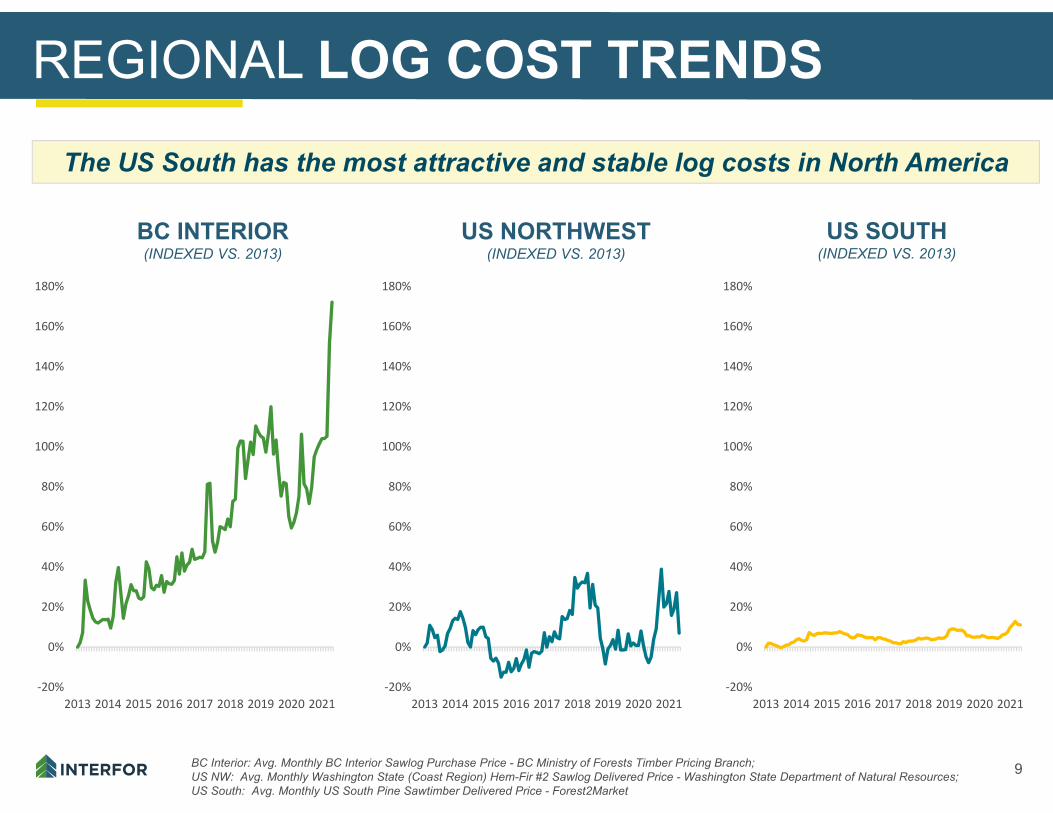
REGIONAL LOG COST TRENDS
BC INTERIOR(INDEXED VS. 2013)
US NORTHWEST(INDEXED VS. 2013)
US SOUTH(INDEXED VS. 2013)
BC Interior: Avg. Monthly BC Interior Sawlog Purchase Price - BC Ministry of Forests Timber Pricing Branch; US NW: Avg. Monthly Washington State (Coast Region) Hem-Fir #2 Sawlog Delivered Price - Washington State Department of Natural Resources;US South: Avg. Monthly US South Pine Sawtimber Delivered Price - Forest2Market
The US South has the most attractive and stable log costs in North America
10
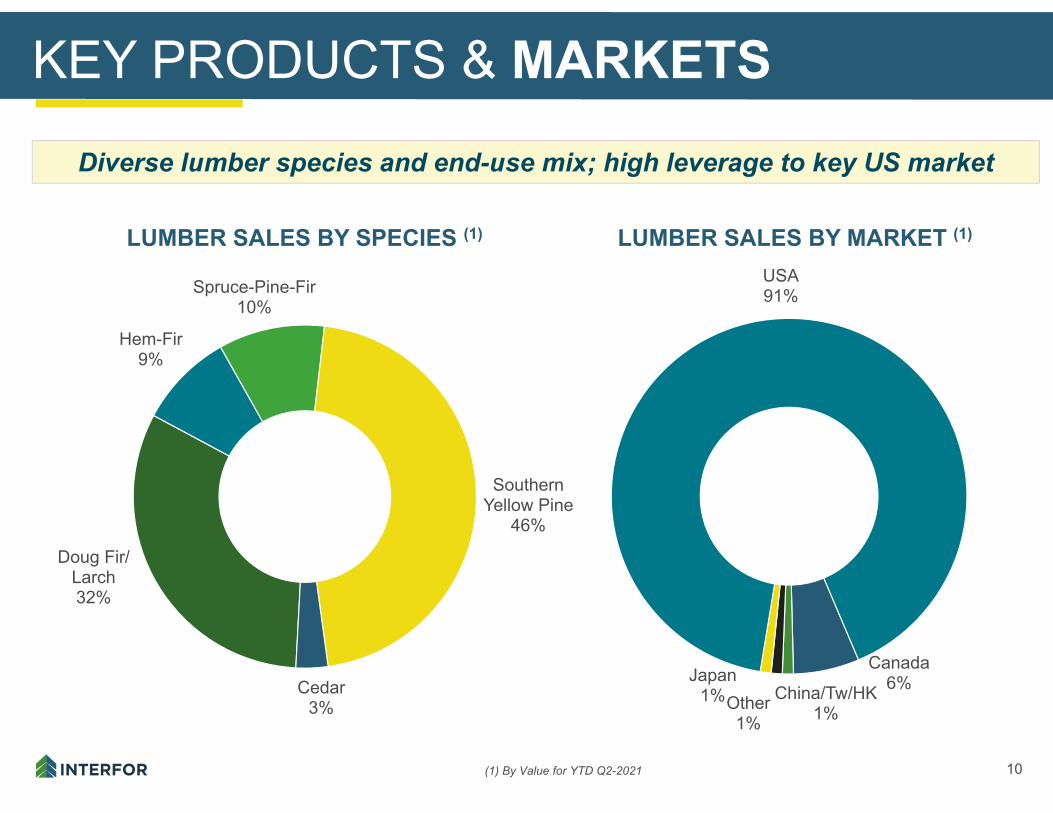
Canada6%China/Tw/HK
1%Other1%
Japan 1%
USA91%
Doug Fir/ Larch32%
Hem-Fir9%
Spruce-Pine-Fir10%
Southern Yellow Pine
46%
Cedar3%
KEY PRODUCTS & MARKETS
LUMBER SALES BY SPECIES (1)
(1) By Value for YTD Q2-2021
LUMBER SALES BY MARKET (1)
Diverse lumber species and end-use mix; high leverage to key US market
COMPELLING LUMBER MARKET FUNDAMENTALS
12
$200
$400
$600
$800
$1,000
$1,200
$1,400
$1,600
$1,800
SYP Composite
Hem-Fir Stud #2 2x4
WSPF Composite
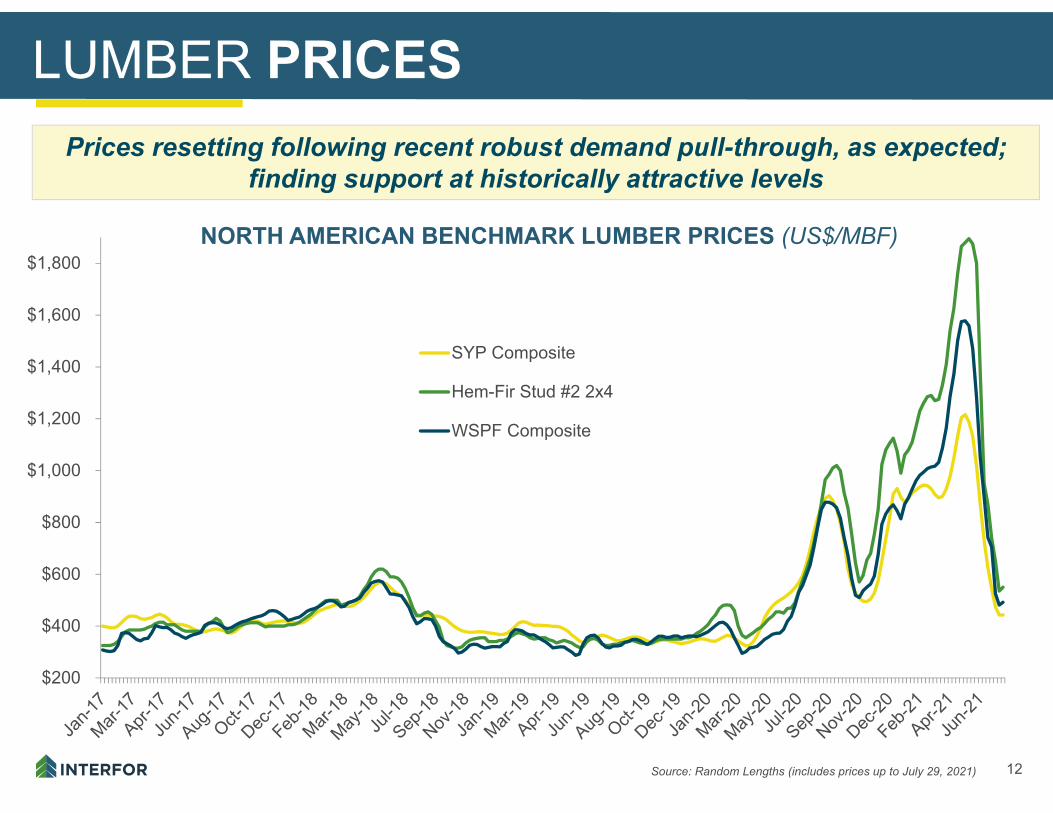
LUMBER PRICES
Source: Random Lengths (includes prices up to July 29, 2021)
NORTH AMERICAN BENCHMARK LUMBER PRICES (US$/MBF)
Prices resetting following recent robust demand pull-through, as expected; finding support at historically attractive levels
13
-
10
20
30
40
50
60
70
80
2005 2006 2007 2008 2009 2010 2011 2012 2013 2014 2015 2016 2017 2018 2019 2020 2021
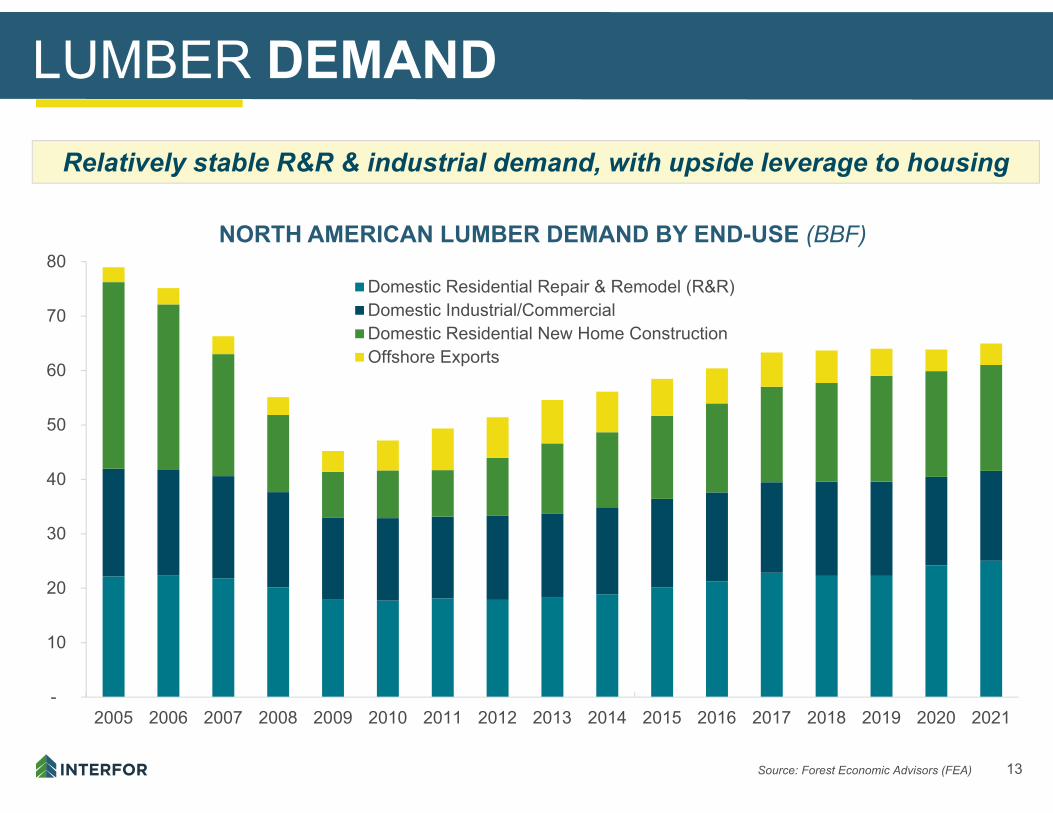
Domestic Residential Repair & Remodel (R&R)Domestic Industrial/CommercialDomestic Residential New Home ConstructionOffshore Exports
LUMBER DEMAND
Source: Forest Economic Advisors (FEA)
NORTH AMERICAN LUMBER DEMAND BY END-USE (BBF)
Relatively stable R&R & industrial demand, with upside leverage to housing
14
- 0.1 0.2 0.3 0.4 0.5 0.6 0.7 0.8 0.9 1.0 1.1 1.2 1.3 1.4 1.5 1.6 1.7
Jan
Apr
Jul
Oct
Jan
Apr
Jul
Oct
Jan
Apr
Jul
Oct
Jan
Apr
Jul
Oct
Jan
Apr
Jul
Oct
Jan
Apr
2016 2017 2018 2019 2020 2021
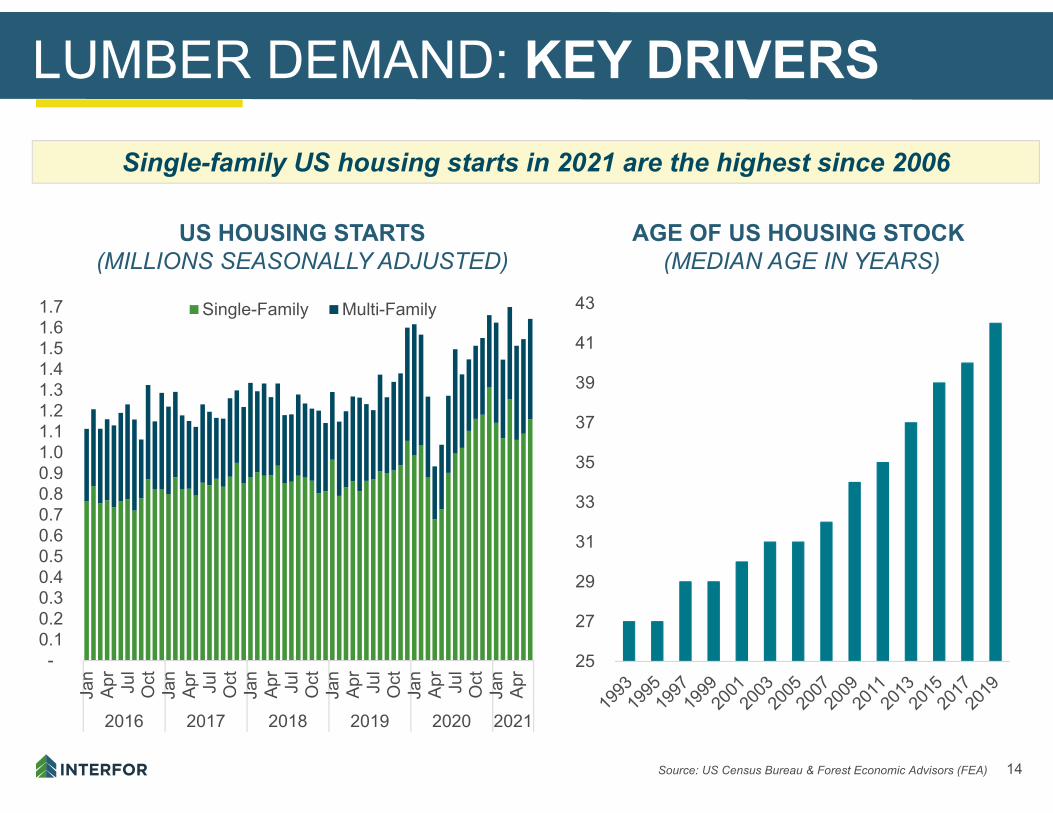
Single-Family Multi-Family
25
27
29
31
33
35
37
39
41
43
LUMBER DEMAND: KEY DRIVERS
Source: US Census Bureau & Forest Economic Advisors (FEA)
US HOUSING STARTS(MILLIONS SEASONALLY ADJUSTED)
AGE OF US HOUSING STOCK(MEDIAN AGE IN YEARS)
Single-family US housing starts in 2021 are the highest since 2006
15
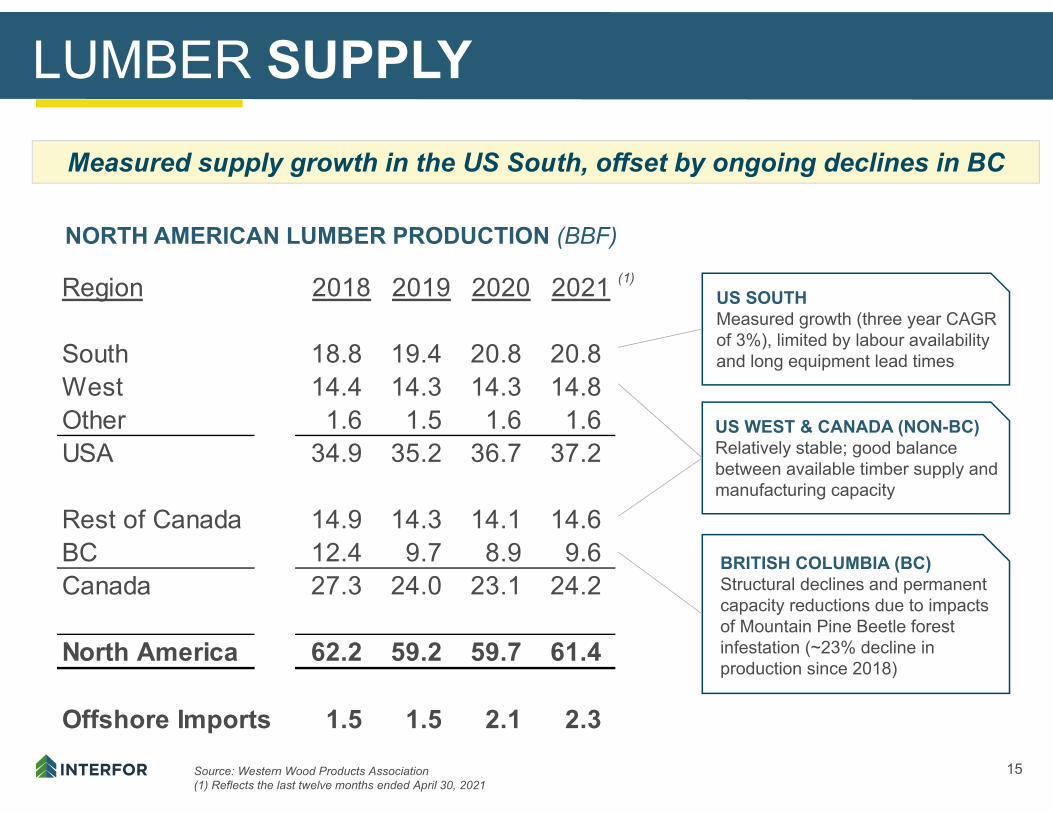
Region 2018 2019 2020 2021 (1)
South 18.8 19.4 20.8 20.8 West 14.4 14.3 14.3 14.8 Other 1.6 1.5 1.6 1.6 USA 34.9 35.2 36.7 37.2
Rest of Canada 14.9 14.3 14.1 14.6 BC 12.4 9.7 8.9 9.6 Canada 27.3 24.0 23.1 24.2
North America 62.2 59.2 59.7 61.4
Offshore Imports 1.5 1.5 2.1 2.3
LUMBER SUPPLY
NORTH AMERICAN LUMBER PRODUCTION (BBF)
Source: Western Wood Products Association(1) Reflects the last twelve months ended April 30, 2021
Measured supply growth in the US South, offset by ongoing declines in BC
US SOUTH Measured growth (three year CAGRof 3%), limited by labour availability and long equipment lead times
US WEST & CANADA (NON-BC)Relatively stable; good balance between available timber supply and manufacturing capacity
BRITISH COLUMBIA (BC)Structural declines and permanent capacity reductions due to impacts of Mountain Pine Beetle forest infestation (~23% decline in production since 2018)
16
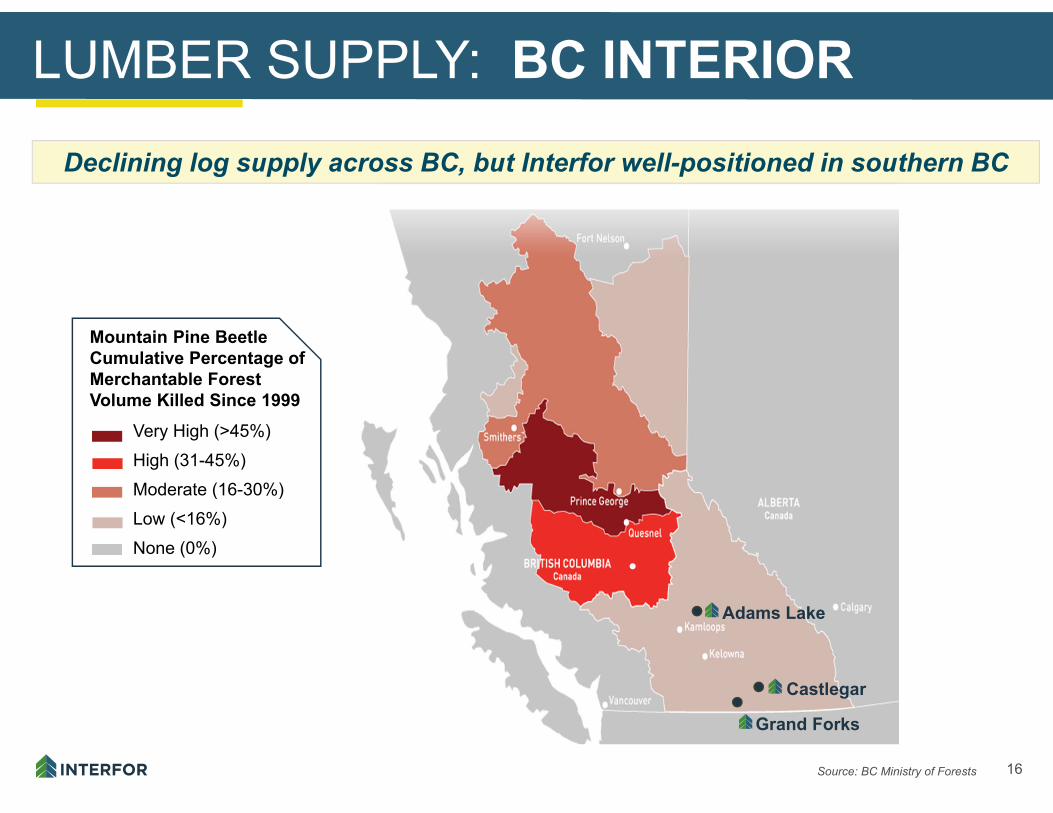
LUMBER SUPPLY: BC INTERIOR
Source: BC Ministry of Forests
Mountain Pine BeetleCumulative Percentage of Merchantable Forest Volume Killed Since 1999
Very High (>45%)High (31-45%)Moderate (16-30%)Low (<16%)None (0%)
Adams Lake
Castlegar
Grand Forks
Declining log supply across BC, but Interfor well-positioned in southern BC
17
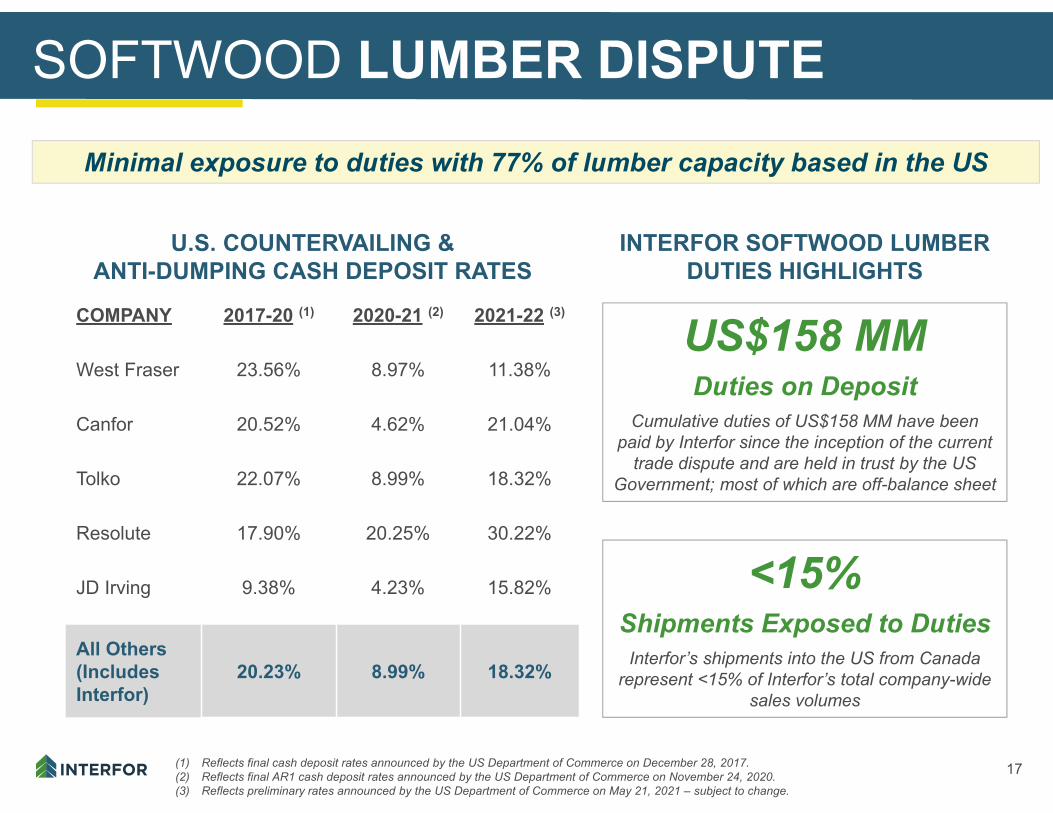
SOFTWOOD LUMBER DISPUTE
(1) Reflects final cash deposit rates announced by the US Department of Commerce on December 28, 2017.(2) Reflects final AR1 cash deposit rates announced by the US Department of Commerce on November 24, 2020.(3) Reflects preliminary rates announced by the US Department of Commerce on May 21, 2021 – subject to change.
COMPANY 2017-20 (1) 2020-21 (2) 2021-22 (3)
West Fraser 23.56% 8.97% 11.38%
Canfor 20.52% 4.62% 21.04%
Tolko 22.07% 8.99% 18.32%
Resolute 17.90% 20.25% 30.22%
JD Irving 9.38% 4.23% 15.82%
All Others(IncludesInterfor)
20.23% 8.99% 18.32%
U.S. COUNTERVAILING & ANTI-DUMPING CASH DEPOSIT RATES
Minimal exposure to duties with 77% of lumber capacity based in the US
<15%Shipments Exposed to Duties
Interfor’s shipments into the US from Canada represent <15% of Interfor’s total company-wide
sales volumes
INTERFOR SOFTWOOD LUMBER DUTIES HIGHLIGHTS
US$158 MMDuties on Deposit
Cumulative duties of US$158 MM have been paid by Interfor since the inception of the current
trade dispute and are held in trust by the US Government; most of which are off-balance sheet
GROWTH-FOCUSED STRATEGY
19
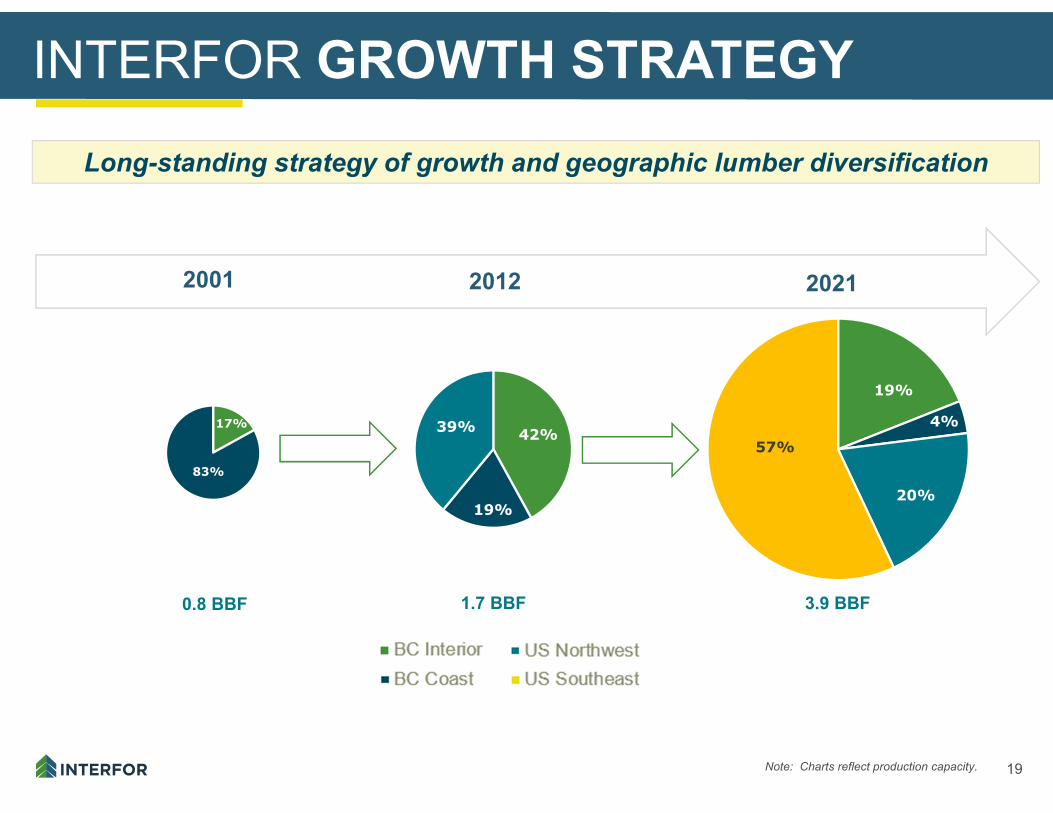
INTERFOR GROWTH STRATEGY
2001 2012
17%
83%
39%
19%
42%57%
19%
20%
4%
0.8 BBF 1.7 BBF 3.9 BBF
2021
Note: Charts reflect production capacity.
Long-standing strategy of growth and geographic lumber diversification
20
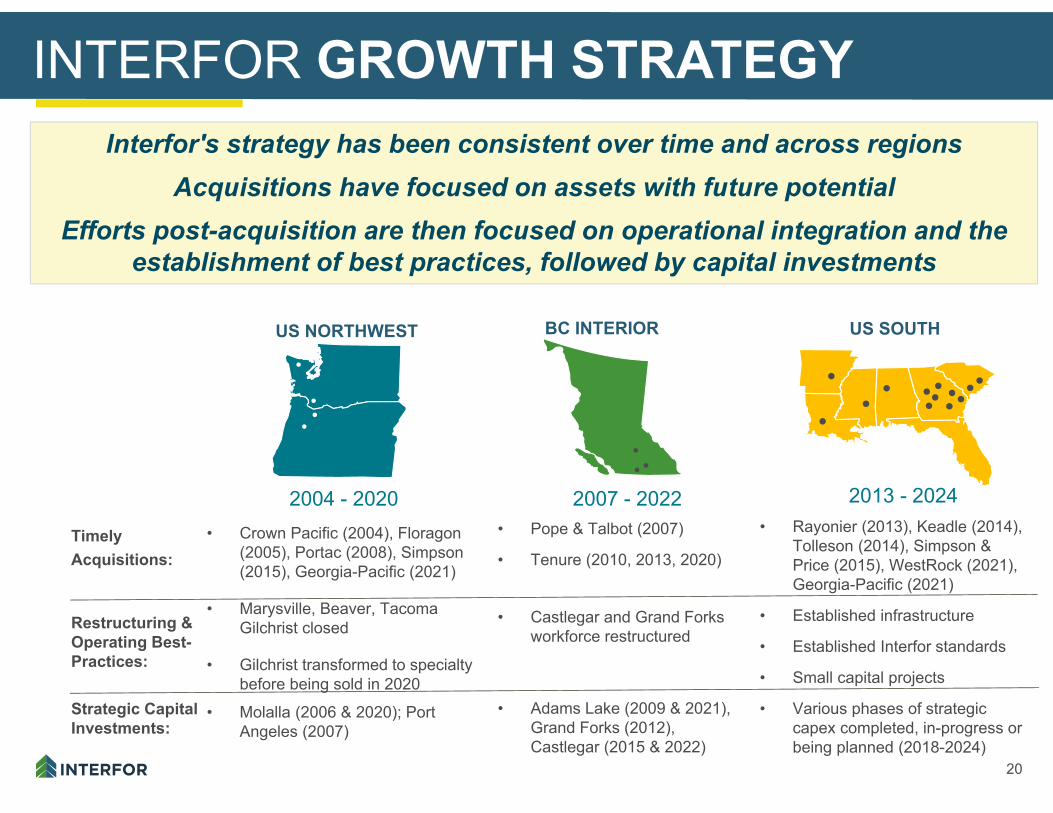
BC INTERIOR
2007 - 2022
US NORTHWEST
2004 - 2020• Pope & Talbot (2007)
• Tenure (2010, 2013, 2020)
• Castlegar and Grand Forks workforce restructured
• Adams Lake (2009 & 2021), Grand Forks (2012), Castlegar (2015 & 2022)
• Crown Pacific (2004), Floragon(2005), Portac (2008), Simpson (2015), Georgia-Pacific (2021)
• Marysville, Beaver, Tacoma Gilchrist closed
• Gilchrist transformed to specialty before being sold in 2020
• Molalla (2006 & 2020); Port Angeles (2007)
TimelyAcquisitions:
Restructuring & Operating Best-Practices:
Strategic Capital Investments:
US SOUTH
2013 - 2024• Rayonier (2013), Keadle (2014),
Tolleson (2014), Simpson & Price (2015), WestRock (2021), Georgia-Pacific (2021)
• Established infrastructure
• Established Interfor standards
• Small capital projects
• Various phases of strategic capex completed, in-progress or being planned (2018-2024)
INTERFOR GROWTH STRATEGYInterfor's strategy has been consistent over time and across regions
Acquisitions have focused on assets with future potential Efforts post-acquisition are then focused on operational integration and the
establishment of best practices, followed by capital investments
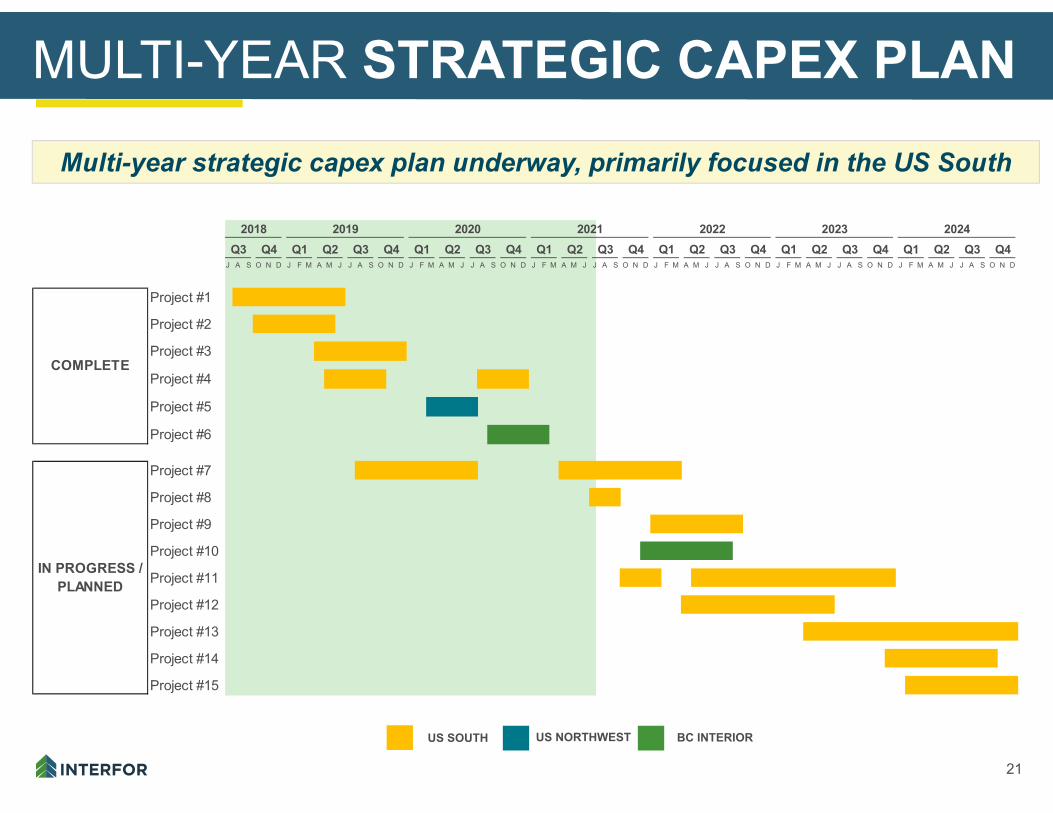
21
J A S O N D J F M A M J J A S O N D J F M A M J J A S O N D J F M A M J J A S O N D J F M A M J J A S O N D J F M A M J J A S O N D J F M A M J J A S O N D
Project #1
Project #2
Project #3
Project #4
Project #5
Project #6
Project #7
Project #8
Project #9
Project #10
Project #11
Project #12
Project #13
Project #14
Project #15
2024Q1 Q2 Q3 Q4Q2 Q3 Q4
2023
COMPLETE
Q4 Q1 Q2
IN PROGRESS / PLANNED
Q3 Q4 Q1Q2 Q3 Q4 Q1 Q2 Q3Q3 Q4 Q1 Q2 Q3 Q4 Q12018 2019 2020 2021 2022
MULTI-YEAR STRATEGIC CAPEX PLAN
US SOUTH US NORTHWEST BC INTERIOR
Multi-year strategic capex plan underway, primarily focused in the US South
22
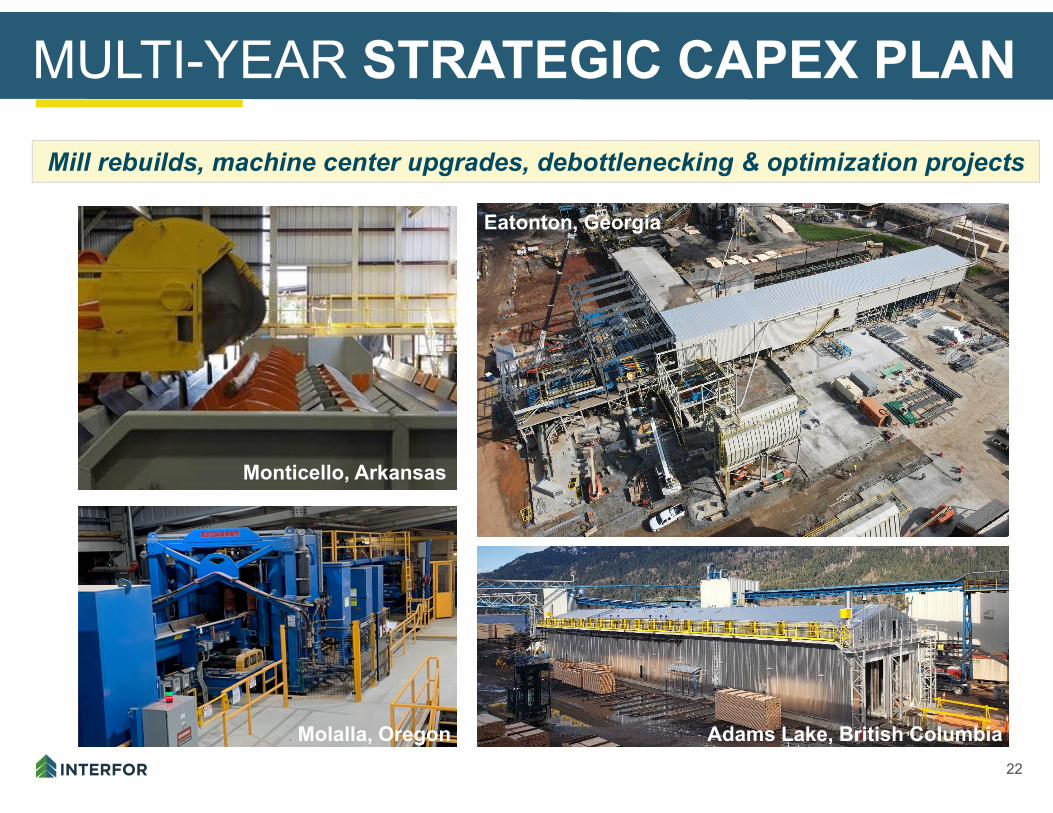
MULTI-YEAR STRATEGIC CAPEX PLAN
Canter Lines Continuous KilnsAdams Lake, British Columbia
Eatonton, Georgia
Molalla, Oregon
Monticello, Arkansas
Mill rebuilds, machine center upgrades, debottlenecking & optimization projects
23
$0
$25
$50
$75
$100
$125
$150
$175
$200
$225
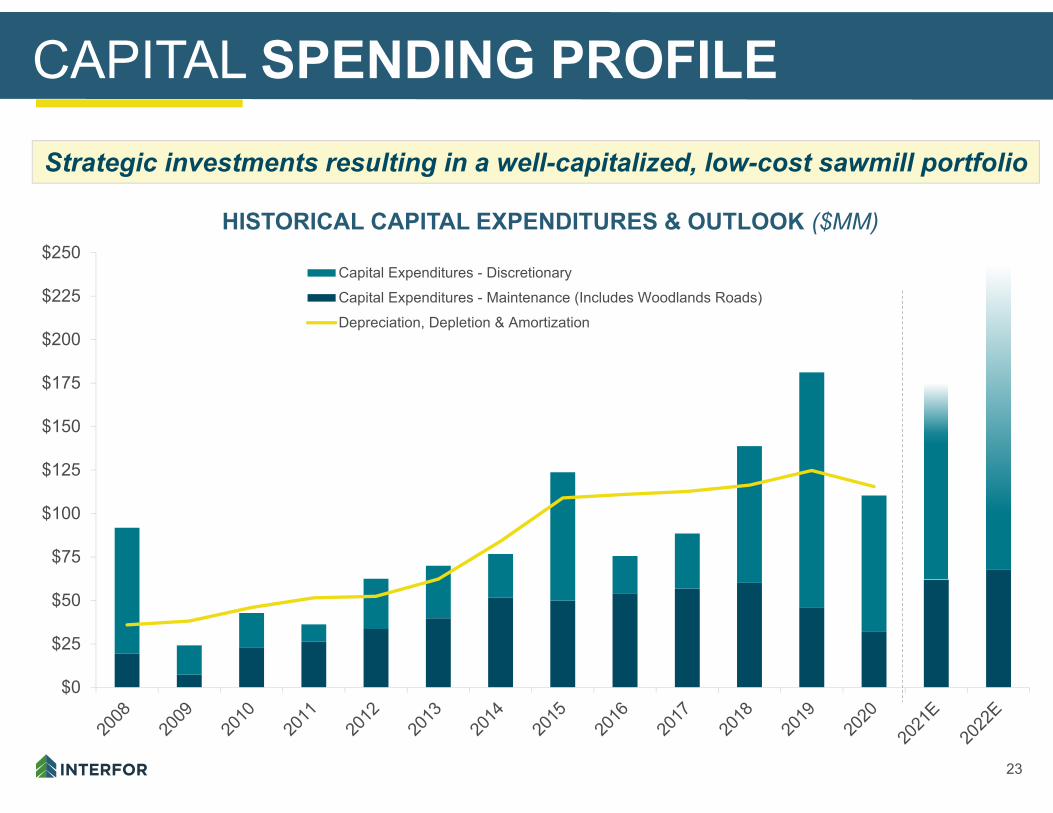
$250Capital Expenditures - DiscretionaryCapital Expenditures - Maintenance (Includes Woodlands Roads)Depreciation, Depletion & Amortization
CAPITAL SPENDING PROFILE
HISTORICAL CAPITAL EXPENDITURES & OUTLOOK ($MM)
Strategic investments resulting in a well-capitalized, low-cost sawmill portfolio
TOP TIER LUMBER MARGINS & RETURNS
25
$(125)
$(25)
$75
$175
$275
$375
$475
$575
$675
$775
$875
$975
$1,075
Q1 Q2 Q3 Q4 Q1 Q2 Q3 Q4 Q1 Q2
2019 2020 2021
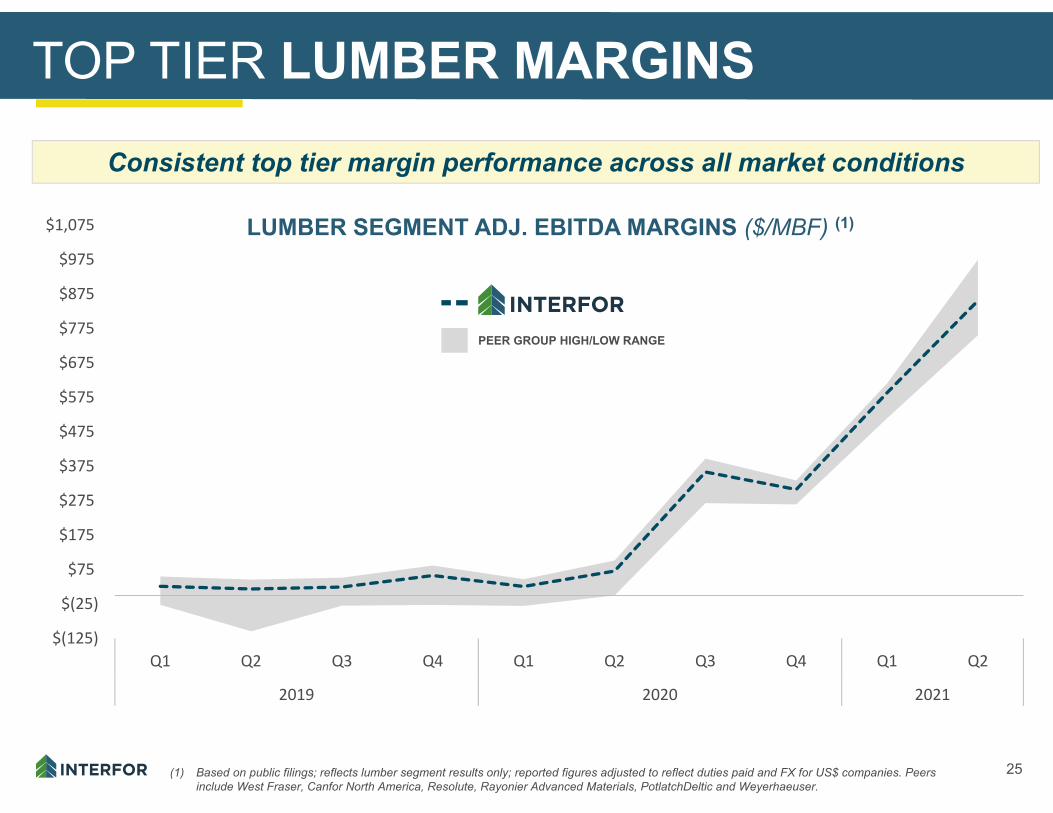
TOP TIER LUMBER MARGINS
Consistent top tier margin performance across all market conditions
PEER GROUP HIGH/LOW RANGE
LUMBER SEGMENT ADJ. EBITDA MARGINS ($/MBF) (1)
(1) Based on public filings; reflects lumber segment results only; reported figures adjusted to reflect duties paid and FX for US$ companies. Peers include West Fraser, Canfor North America, Resolute, Rayonier Advanced Materials, PotlatchDeltic and Weyerhaeuser.
26
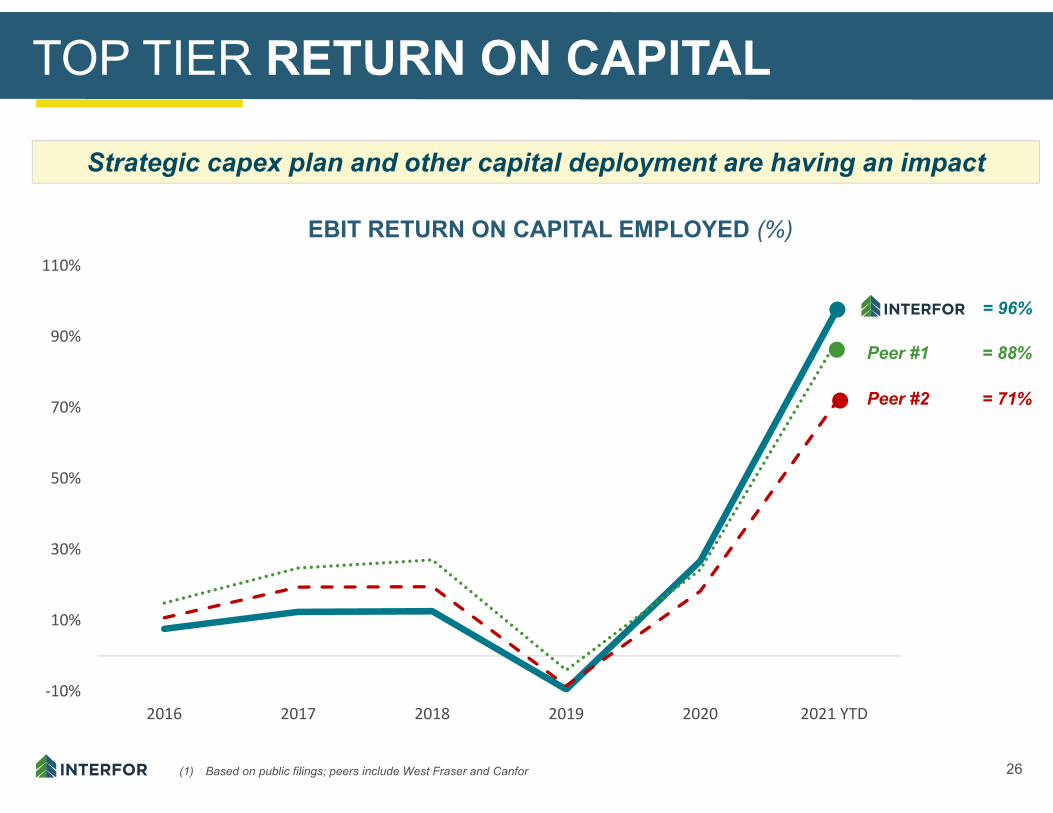
TOP TIER RETURN ON CAPITAL
Strategic capex plan and other capital deployment are having an impact
EBIT RETURN ON CAPITAL EMPLOYED (%)
(1) Based on public filings; peers include West Fraser and Canfor
‐10%
10%
30%
50%
70%
90%
110%
2016 2017 2018 2019 2020 2021 YTD
Peer #1 = 88%
Peer #2 = 71%
= 96%
BALANCED CAPITAL ALLOCATION WITH SIGNIFICANT FINANCIAL FLEXIBILITY
28
$‐
$100
$200
$300
$400
$500
$600
$700
$800
$900
2012 2013 2014 2015 2016 2017 2018 2019 2020 YTD 2021
Capex M&A Share Buy‐Backs Special Dividend
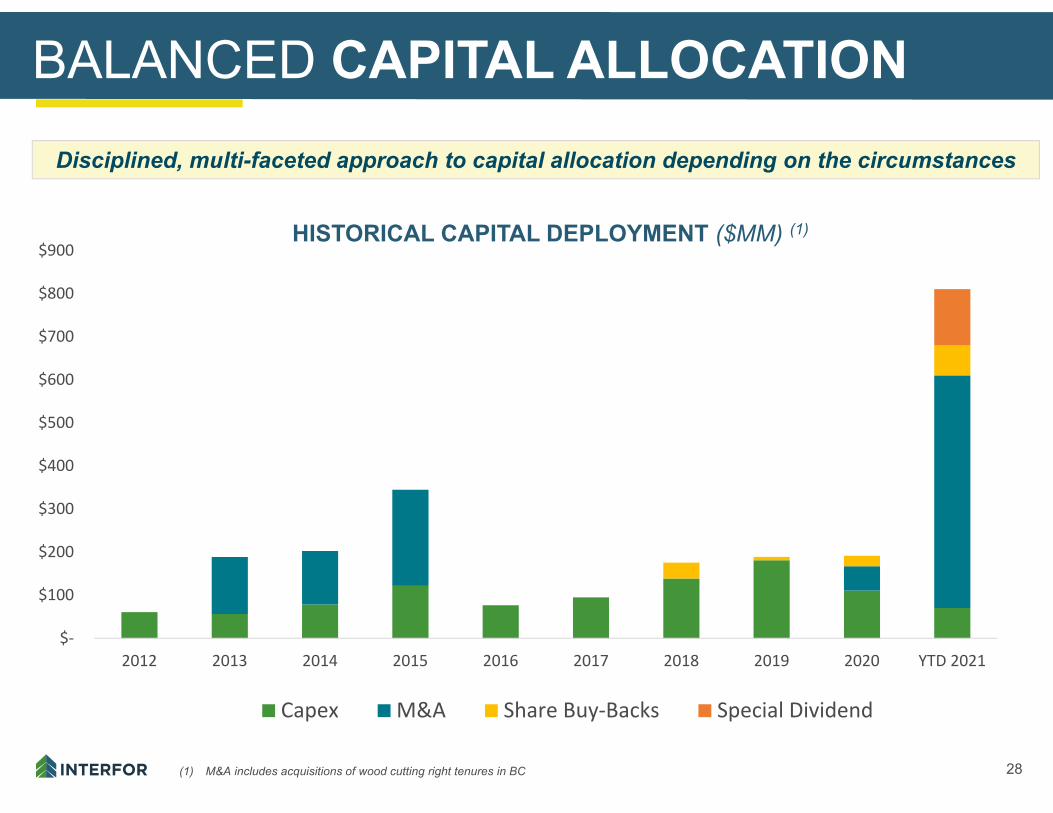
BALANCED CAPITAL ALLOCATIONDisciplined, multi-faceted approach to capital allocation depending on the circumstances
HISTORICAL CAPITAL DEPLOYMENT ($MM) (1)
(1) M&A includes acquisitions of wood cutting right tenures in BC
29
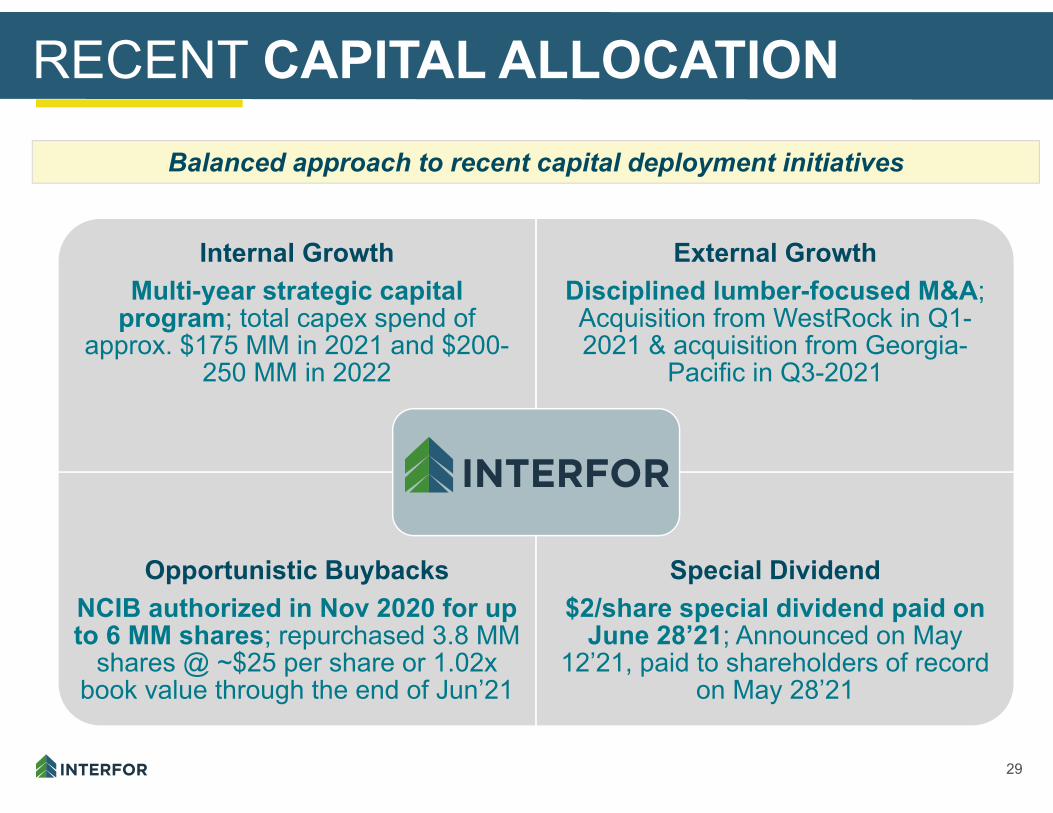
RECENT CAPITAL ALLOCATION
Internal Growth Multi-year strategic capital
program; total capex spend of approx. $175 MM in 2021 and $200-
250 MM in 2022
External Growth Disciplined lumber-focused M&A;Acquisition from WestRock in Q1-2021 & acquisition from Georgia-
Pacific in Q3-2021
Opportunistic Buybacks NCIB authorized in Nov 2020 for up to 6 MM shares; repurchased 3.8 MM
shares @ ~$25 per share or 1.02xbook value through the end of Jun’21
Special Dividend$2/share special dividend paid on
June 28’21; Announced on May 12’21, paid to shareholders of record
on May 28’21
Balanced approach to recent capital deployment initiatives
30
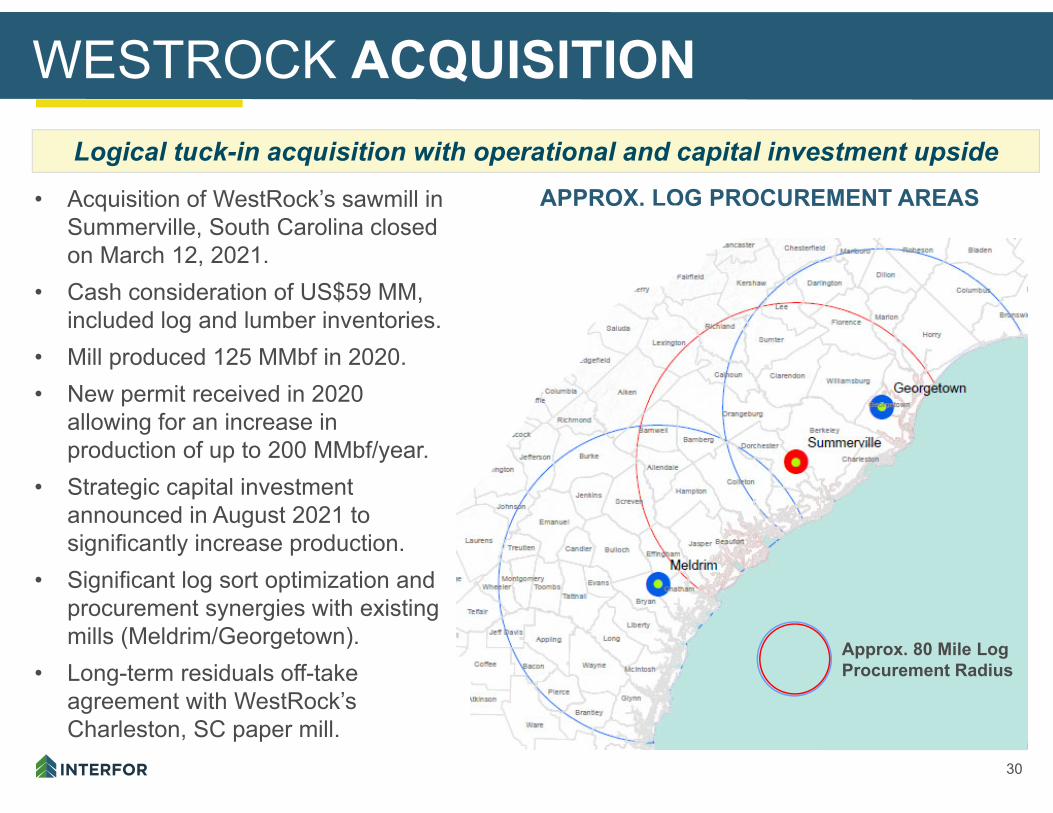
WESTROCK ACQUISITION
APPROX. LOG PROCUREMENT AREAS
Approx. 80 Mile Log Procurement Radius
Logical tuck-in acquisition with operational and capital investment upside
• Acquisition of WestRock’s sawmill in Summerville, South Carolina closed on March 12, 2021.
• Cash consideration of US$59 MM, included log and lumber inventories.
• Mill produced 125 MMbf in 2020. • New permit received in 2020
allowing for an increase in production of up to 200 MMbf/year.
• Strategic capital investment announced in August 2021 to significantly increase production.
• Significant log sort optimization and procurement synergies with existing mills (Meldrim/Georgetown).
• Long-term residuals off-take agreement with WestRock’sCharleston, SC paper mill.
31
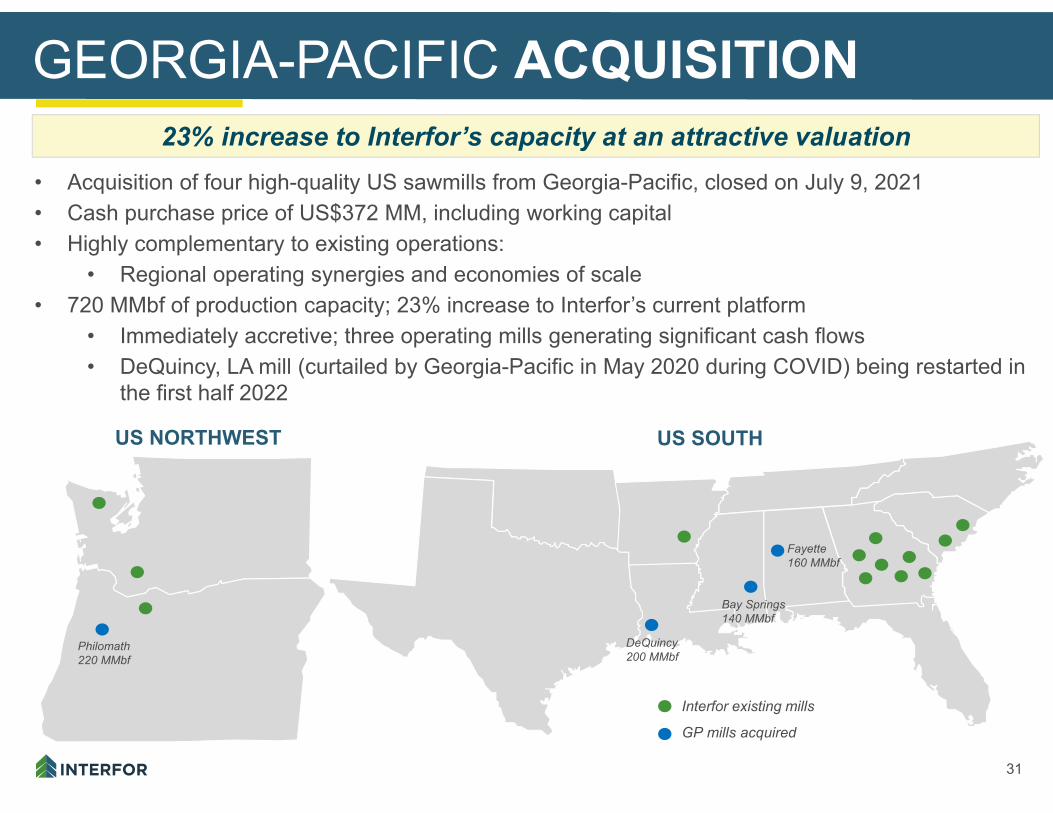
• Acquisition of four high-quality US sawmills from Georgia-Pacific, closed on July 9, 2021• Cash purchase price of US$372 MM, including working capital• Highly complementary to existing operations:
• Regional operating synergies and economies of scale• 720 MMbf of production capacity; 23% increase to Interfor’s current platform
• Immediately accretive; three operating mills generating significant cash flows• DeQuincy, LA mill (curtailed by Georgia-Pacific in May 2020 during COVID) being restarted in
the first half 2022
Interfor existing mills
GP mills acquired
US NORTHWEST US SOUTH
DeQuincy200 MMbf
Bay Springs 140 MMbf
Fayette 160 MMbf
Philomath 220 MMbf
GEORGIA-PACIFIC ACQUISITION23% increase to Interfor’s capacity at an attractive valuation
32
$0$20$40$60$80
$100$120$140
-50%
-30%
-10%
10%
30%
50%
2008 2009 2010 2011 2012 2013 2014 2015 2016 2017 2018 2019 2020 2021
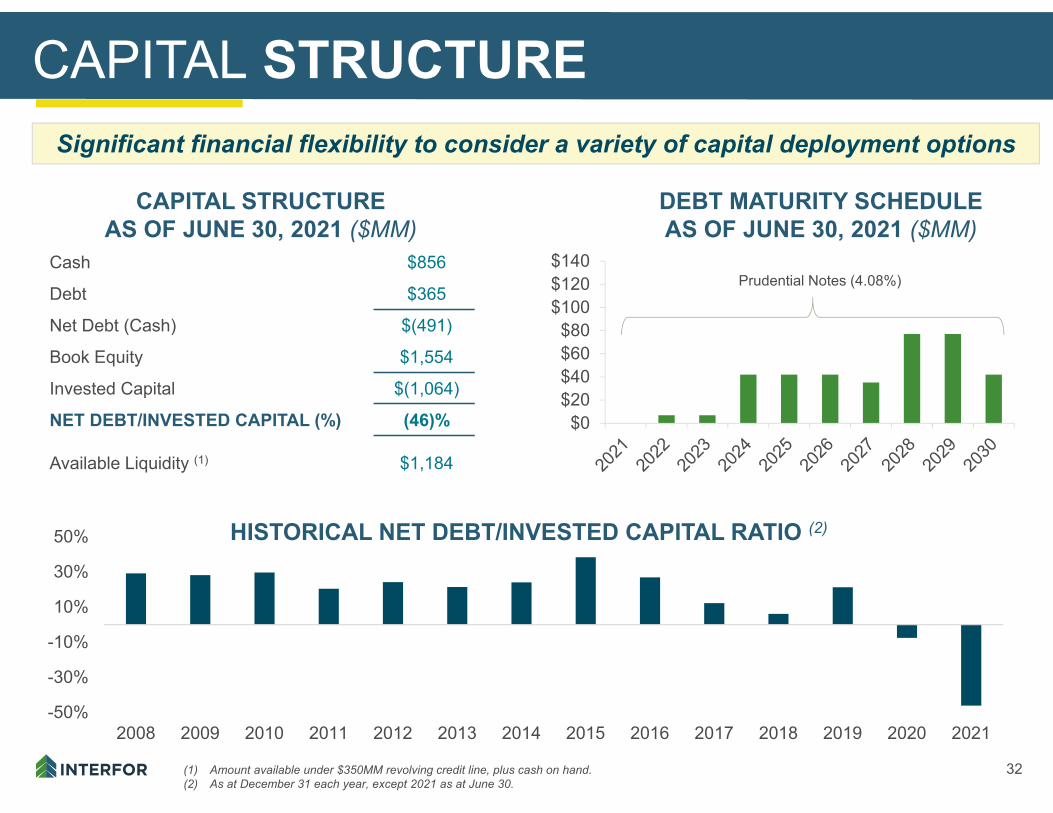
CAPITAL STRUCTURE
Cash $856
Debt $365
Net Debt (Cash) $(491)
Book Equity $1,554
Invested Capital $(1,064)
NET DEBT/INVESTED CAPITAL (%) (46)%
Available Liquidity (1) $1,184
CAPITAL STRUCTURE AS OF JUNE 30, 2021 ($MM)
DEBT MATURITY SCHEDULEAS OF JUNE 30, 2021 ($MM)
Prudential Notes (4.08%)
(1) Amount available under $350MM revolving credit line, plus cash on hand. (2) As at December 31 each year, except 2021 as at June 30.
HISTORICAL NET DEBT/INVESTED CAPITAL RATIO (2)
Significant financial flexibility to consider a variety of capital deployment options
POSITIVE ESG & CARBON STORY
34
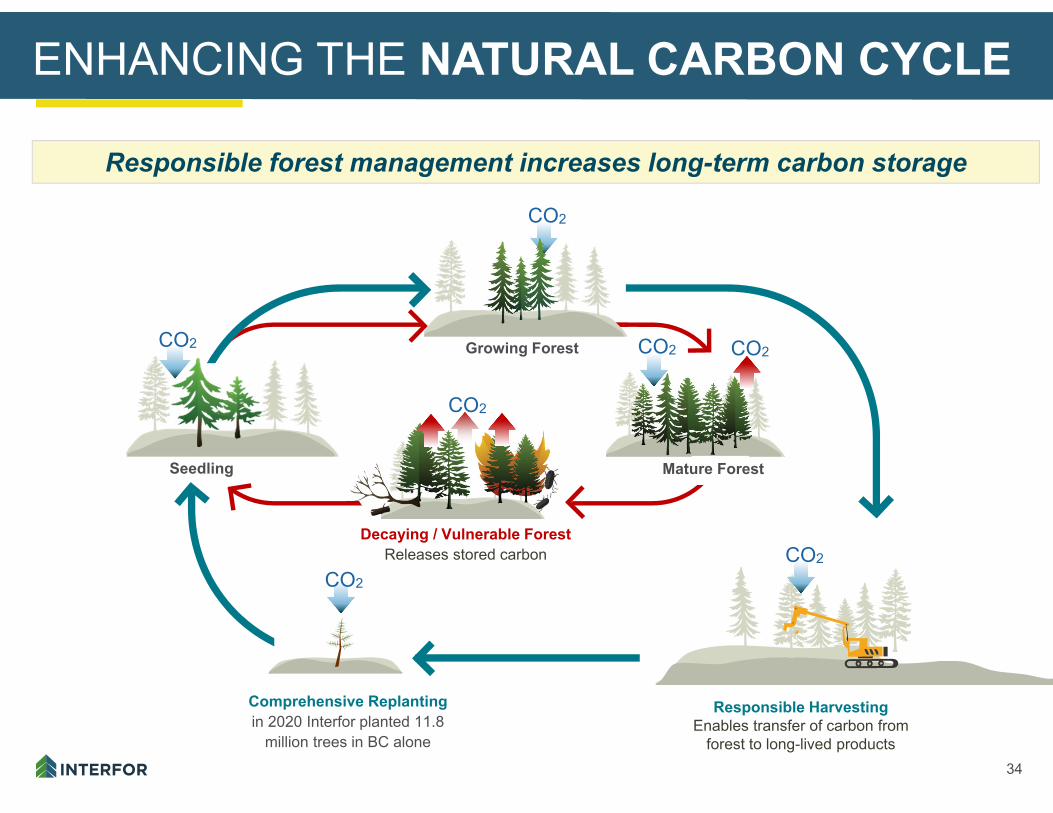
ENHANCING THE NATURAL CARBON CYCLE
CO2
Growing Forest
Responsible Harvesting Enables transfer of carbon from
forest to long-lived products
CO2
CO2
Decaying / Vulnerable Forest Releases stored carbon
Comprehensive Replanting in 2020 Interfor planted 11.8
million trees in BC alone
Mature Forest
CO2
Seedling
CO2
CO2
CO2
Responsible forest management increases long-term carbon storage
35
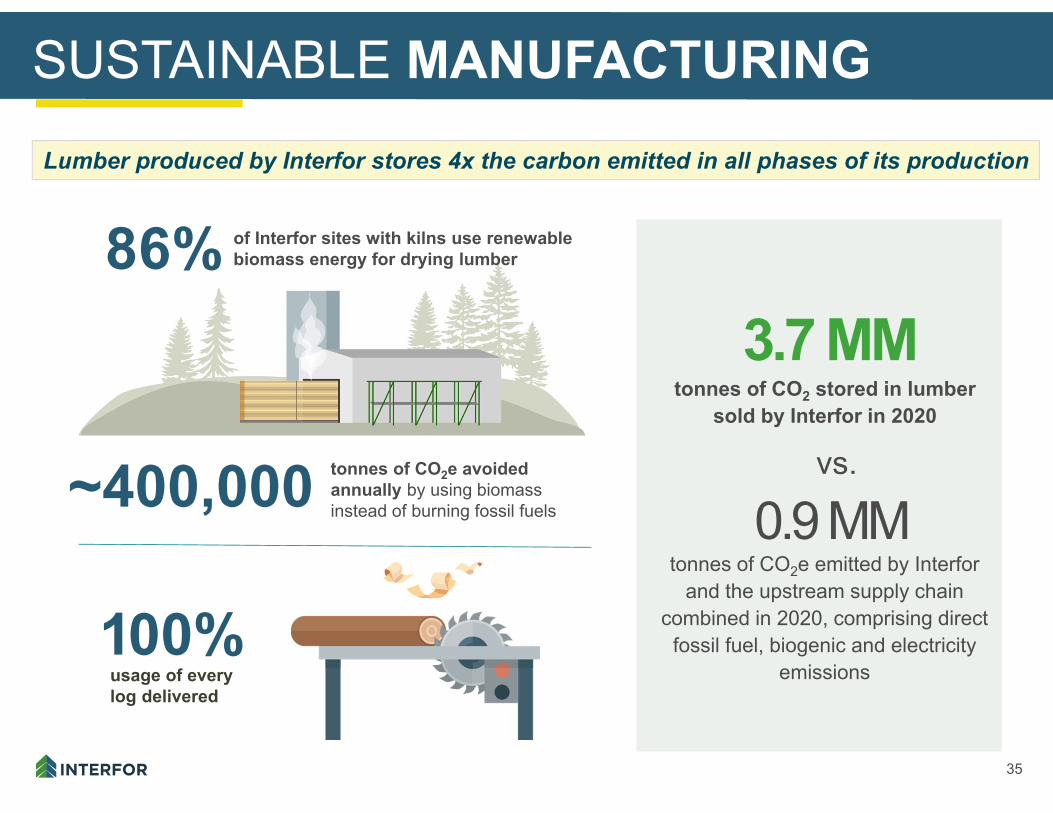
SUSTAINABLE MANUFACTURING
~400,000
100%usage of every log delivered
86%
tonnes of CO2e avoided annually by using biomass instead of burning fossil fuels
of Interfor sites with kilns use renewable biomass energy for drying lumber
3.7 MMtonnes of CO2 stored in lumber
sold by Interfor in 2020
Lumber produced by Interfor stores 4x the carbon emitted in all phases of its production
0.9 MMtonnes of CO2e emitted by Interfor
and the upstream supply chain combined in 2020, comprising direct
fossil fuel, biogenic and electricity emissions
vs.
36
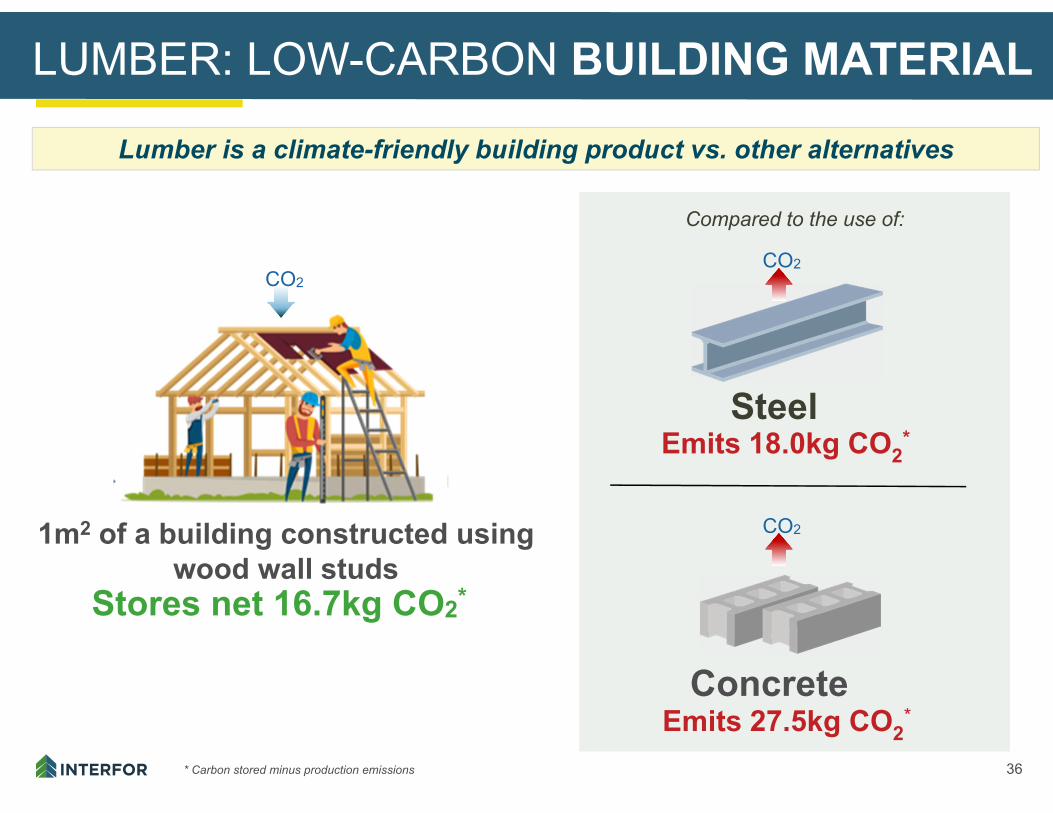
LUMBER: LOW-CARBON BUILDING MATERIAL
Emits 27.5kg CO2*
Compared to the use of:
Emits 18.0kg CO2*
1m2 of a building constructed using wood wall studs
Stores net 16.7kg CO2*
Steel
Concrete
CO2CO2
CO2
Lumber is a climate-friendly building product vs. other alternatives
* Carbon stored minus production emissions
37
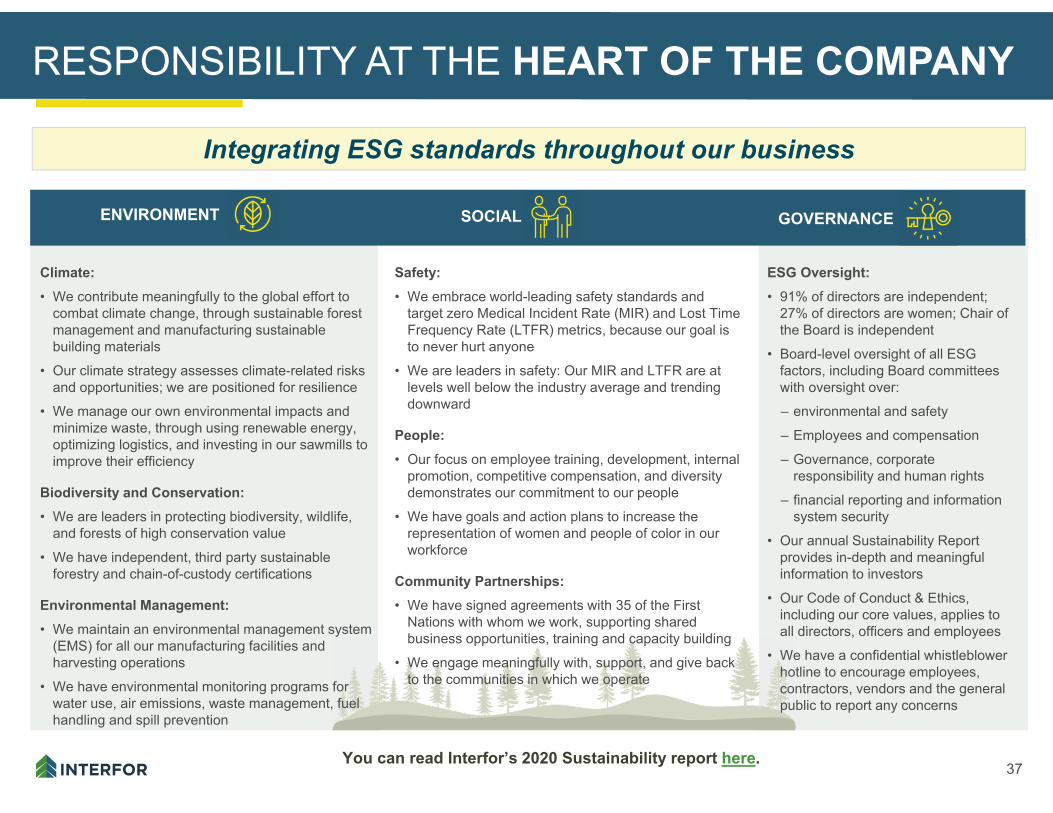
Safety:• We embrace world-leading safety standards and
target zero Medical Incident Rate (MIR) and Lost Time Frequency Rate (LTFR) metrics, because our goal is to never hurt anyone
• We are leaders in safety: Our MIR and LTFR are at levels well below the industry average and trending downward
People: • Our focus on employee training, development, internal
promotion, competitive compensation, and diversity demonstrates our commitment to our people
• We have goals and action plans to increase the representation of women and people of color in our workforce
Community Partnerships:• We have signed agreements with 35 of the First
Nations with whom we work, supporting shared business opportunities, training and capacity building
• We engage meaningfully with, support, and give back to the communities in which we operate
ESG Oversight:• 91% of directors are independent;
27% of directors are women; Chair of the Board is independent
• Board-level oversight of all ESGfactors, including Board committees with oversight over:
– environmental and safety
– Employees and compensation
– Governance, corporate responsibility and human rights
– financial reporting and information system security
• Our annual Sustainability Report provides in-depth and meaningful information to investors
• Our Code of Conduct & Ethics, including our core values, applies to all directors, officers and employees
• We have a confidential whistleblower hotline to encourage employees, contractors, vendors and the general public to report any concerns
Climate:• We contribute meaningfully to the global effort to
combat climate change, through sustainable forest management and manufacturing sustainable building materials
• Our climate strategy assesses climate-related risks and opportunities; we are positioned for resilience
• We manage our own environmental impacts and minimize waste, through using renewable energy, optimizing logistics, and investing in our sawmills to improve their efficiency
Biodiversity and Conservation:• We are leaders in protecting biodiversity, wildlife,
and forests of high conservation value
• We have independent, third party sustainable forestry and chain-of-custody certifications
Environmental Management:• We maintain an environmental management system
(EMS) for all our manufacturing facilities and harvesting operations
• We have environmental monitoring programs for water use, air emissions, waste management, fuel handling and spill prevention
RESPONSIBILITY AT THE HEART OF THE COMPANY
ENVIRONMENT SOCIAL GOVERNANCE
You can read Interfor’s 2020 Sustainability report here.
Integrating ESG standards throughout our business
CONTACT INFORMATION
39
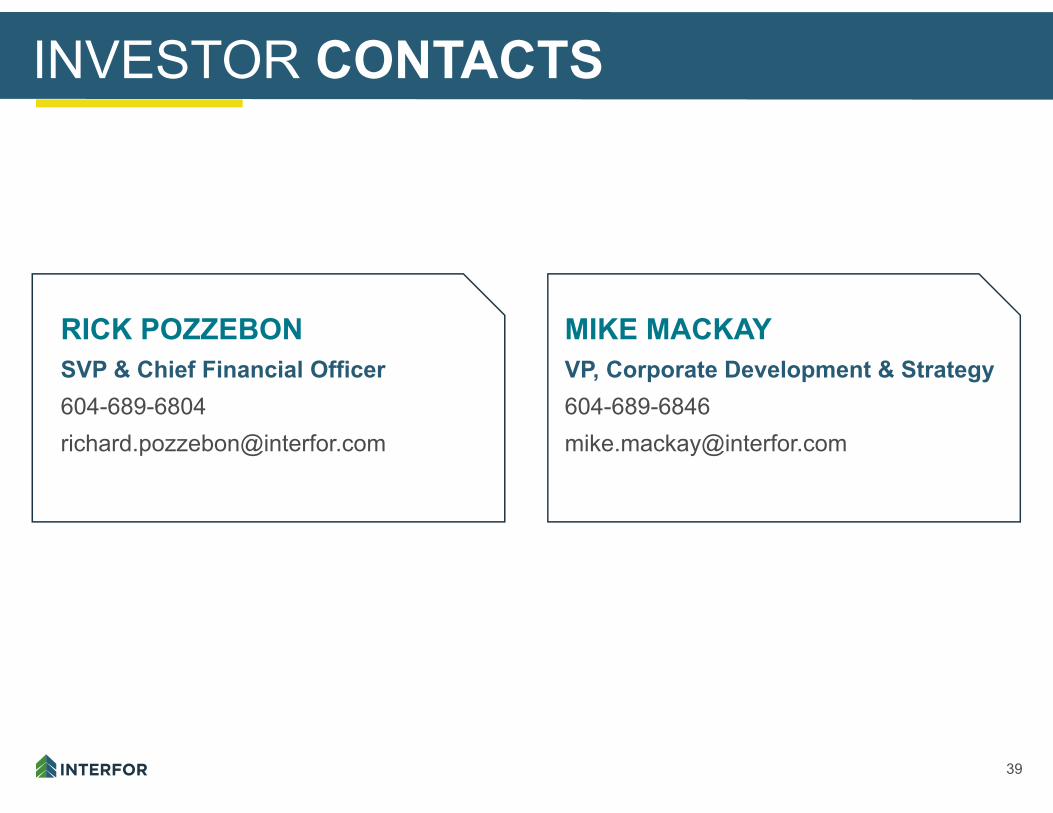
INVESTOR CONTACTS
RICK POZZEBONSVP & Chief Financial [email protected]
MIKE MACKAYVP, Corporate Development & [email protected]
40
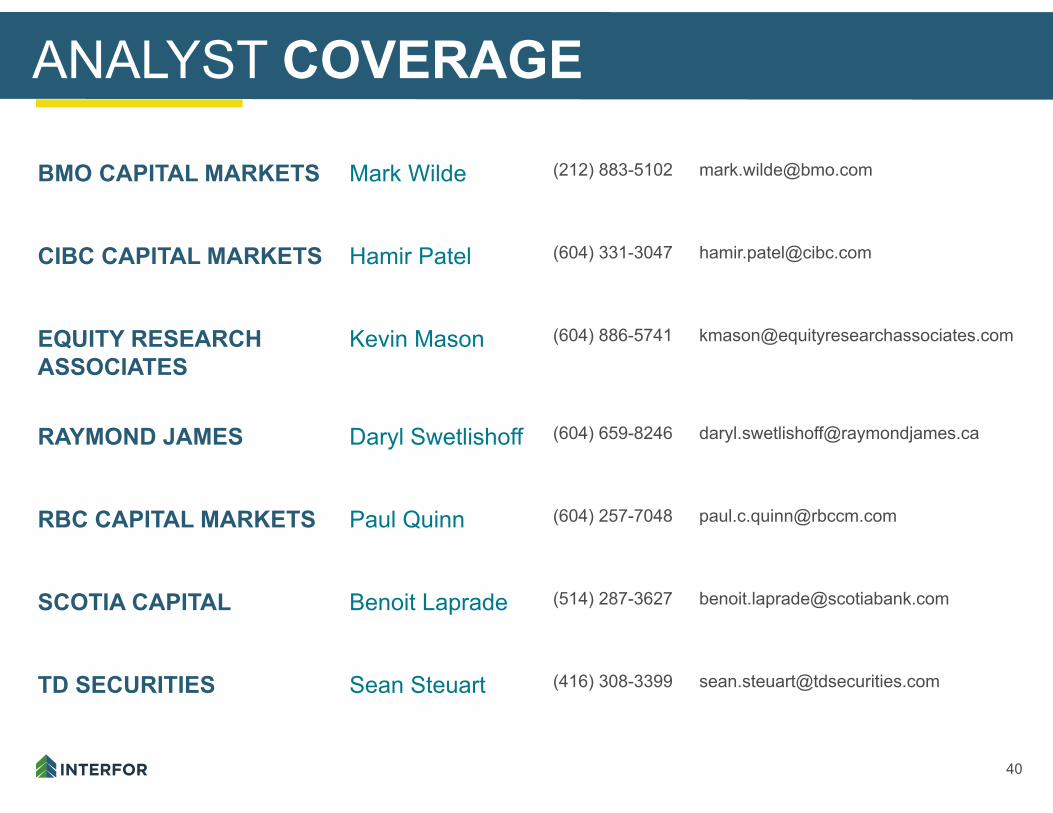
ANALYST COVERAGE
BMO CAPITAL MARKETS Mark Wilde (212) 883-5102 [email protected]
CIBC CAPITAL MARKETS Hamir Patel (604) 331-3047 [email protected]
EQUITY RESEARCH ASSOCIATES
Kevin Mason (604) 886-5741 [email protected]
RAYMOND JAMES Daryl Swetlishoff (604) 659-8246 [email protected]
RBC CAPITAL MARKETS Paul Quinn (604) 257-7048 [email protected]
SCOTIA CAPITAL Benoit Laprade (514) 287-3627 [email protected]
TD SECURITIES Sean Steuart (416) 308-3399 [email protected]