interference effect of two closely spaced …igs/ldh/files/igc 2015 pune/theme 3 design of... ·...
TRANSCRIPT

50
th
IG
C
50th
INDIAN GEOTECHNICAL CONFERENCE
17th
– 19th
DECEMBER 2015, Pune, Maharashtra, India
Venue: College of Engineering (Estd. 1854), Pune, India
INTERFERENCE EFFECT OF TWO CLOSELY SPACED FOOTINGS ON
BIO-SILICIFIED SAND
C.J. Ragiya1, K. Salinitha
2
ABSTRACT
Industrialization and urbanization has led to situations where footings of same or adjacent structures come
closer. This will lead to change in the bearing capacity and load settlement behaviour of the isolated
footings due to interference of influence zone of footings. The designer should be aware of this
interference effect on the load settlement behavior of footing. Therefore, the problem of interaction
between adjacent footings is of great practical significance. The conventional solutions of bearing
capacity and settlement of soil under shallow foundations do not consider footings interactions.
In this paper, laboratory model tests were conducted to study the effect of interference on the load
settlement behaviour of two closely spaced strip footings resting on medium dense sand subjected to
static load. The influence of spacing between the footings on their load settlement characteristics was
investigated by varying the spacing as 0.14B, 1B, 2B, 4B and 6B (B is width of the strip footing).
Effectiveness of ground improvement technique to reduce the interference effect of such closely spaced
footing was also studied. Experimental setup with small scale steel strip footings of size 36cm x 7cm x
2cm was used for the studies. Footings were carrying exactly equal loads applied through hydraulic jack
under a reaction beam. Ground improvement technique chosen for the study was a new method of
grouting called biologically inspired silicification process. This process offers environmental and physical
advantages over traditional sodium silicate grout.
To determine the concentration of sodium silicate at which the dense sand obtained the maximum
compressive strength, unconfined compressive strength tests were carried out on sand treated with
different concentrations of sodium silicate (0%, 10%, 20%, 30%, 40%, 50% and 60%). It was seen that
40% of sodium silicate concentration gave the maximum compressive strength to the dense sand. Tests
were conducted on using 3 types of cationic polyelectrolyte (Floquat 3249, Floquat 4440 and Floquat
4420) at different concentrations (0%, 5%, 15%, 25%, 35%, and 45%) in combination with the optimum
concentration of sodium silicate. Influence of bio-silicification on medium dense sand on the interference

C.J. Ragiya1, K. Salinitha2
effect of strip footings placed at optimum spacing was studied by comparing its load settlement
characteristics with that of strip footings placed un-grouted sand.
From the study, it was found that bearing capacity of un-grouted sand is maximum at a clear spacing of
1B between the footings. It was also seen that interference effect causes a 37.5% percentage increase in
bearing capacity of the two closely spaced footings as compared with bearing capacity of isolated footing.
Settlement behavior of the footing was also influenced by the interference effect. Sand pretreated with
25% solution of cationic polyelectrolyte (Floquat) and followed by 40% solution of sodium silicate
grouting shows 100 to 520% increase in compressive strength than the traditional sodium silicate grout
mixtures without any pretreatments. Sand pretreated with Floquat 4440 and Floquat 4420 have more
compressive strength than Floquat 3249. Sand pretreated with Floquat 3249 has only slight increase in
compressive strength than traditional sodium silicate grouting. Interference effect is less significant on
sodium silicate grouted sand.
Keywords: Ground improvement, Floquat, Footings, Interference effect, Bio-silicification, Sodium
silicate grouting.
C. J. Ragiya, M.Tech. Student, Civil Engg. Dept., IES College of Engg., Thrissur, Kerala, [email protected]
K. Salinitha, Asst. Professor, Civil Engg. Dept., IES College of Engg., Thrissur, Kerala, [email protected].

50
th
IG
C
50th
INDIAN GEOTECHNICAL CONFERENCE
17th
– 19th
DECEMBER 2015, Pune, Maharashtra, India
Venue: College of Engineering (Estd. 1854), Pune, India
INTERFERENCE EFFECT OF TWO CLOSELY SPACED FOOTINGS ON
BIO-SILICIFIED SAND
C. J. Ragiya, M.Tech. Student, IES College of Engg., Thrissur, Kerala, [email protected]
K. Salinitha, Asst. Professor, IES College of Engg., Thrissur, Kerala, [email protected] ABSTRACT: Laboratory model tests were conducted to study the interference effect of two strip footings resting
on medium dense sand subjected to static load. The influence of spacing between footings and effectiveness of grouting were studied. Ground improvement technique chosen was a new method of grouting called bio-
silicification process. From the study, it was found that load carrying capacity of interfering footing is higher than
that of isolated footing and is maximum at a clear spacing of 1B between footings. Bio-silicification process for grouting shows large increase in strength than the control sodium silicate grouting. Interference effect is less
significant on grouted sand.
INTRODUCTION
Thickly populated urban areas compel the
buildings to be placed very close to each other.
Design of foundation of structures is made with
due care of the loads coming in the building. But
there could be variation in the load carrying
capacity of the closely situated footings of adjacent
buildings. Engineers have to consider footing
interactions in such situations. The problem of
interaction between adjacent footings is of great
practical significance. According to the footing
failure mechanism given by Terzaghi, the passive
zone extends laterally to three to five times the
footing width. So the footing will behave as an
individual single footing only beyond this lateral
distance. If footings are placed within this lateral
distance, then its load carrying capacity, failure and
slip mechanism will no longer be that of a single
footing [12,10]. These changes are due to
interference of failure zone of loaded footings.
Interference effect of strip footing is more
dominant than other types of footings and this is
more significant in sandy soil than clay soil [14, 3].
The conventional solutions of bearing capacity and
settlement of soil under shallow foundations did
not consider footings interaction. The famous
equations of bearing capacity by Terzaghi (1943)
and Meyerhof (1951) also did not consider the
effect of interference between adjacent footings [4,
17]. In this paper, laboratory model tests were
conducted to study the interference effect of two
strip footings resting on medium dense sand
subjected to static load.
Biologically inspired silicification process is a new
kind of cementation method used to improve the
strength of the soil [8]. In this method, soil is pre-
treated with a commercially available cationic
poly-electrolyte before sodium silicate grouting.
Bio-silicified sand shows more strength and
stiffness and it has environmental and physical
advantages over traditional sodium silicate grout
mixtures.
Most earth materials have a negative charge on
their surface. In biologically inspired silicification
process, saturated soil is pre-treating with cationic
poly-electrolyte. This compound should offer a
positively charged surface to the grains by putting
a high concentration of positive charges on to it.
Poly electrolytes are members of a broad class of
organic compounds that can serve as growth
factors. This sets the stage for extensive silica

C.J. Ragiya1, K. Salinitha2
nucleation and polymerization. Physical model of
silicification process can be made using a simple
sand assemblage as shown in the schematic
representation given in the figure 1 below.
Fig. 1 Schematic representation of silicification
process (a) sand particles with negative surface
charges (b) pretreatment creates coating on sand
grains and creates positively charged environment
(c) silicates polymerize with grain to grain bonding
(d) broken sample showing void filling
Sodium silicate is introduced in specific
concentrations to cause grain to grain silica
polymerizations after pre-treatment. This will
produce a strengthened material and resulting in
cement filling the voids and coating the grains.
Interference effect of footings on grouted sand is
also studied in this paper by conducting a series of
laboratory model tests.
PROBLEM DEFINITION
Schematic diagram of laboratory test setup is
shown in the figure 2 given below.
Fig. 2 Schematic representation of test setup
Equal load, „Pu‟ is applied symmetrically over strip
footings. „B‟ is the width of the footings and „S‟ is
the clear spacing between footings. Footings were
placed over sand mass of depth, „d‟.
MATERIALS AND PROPERTIES
In this experimental work, a rectangular steel tank
of size 1.65 m (length) x 0.37 m (width) x 0.65 m
(depth) was used. Steel tank is properly stiffened
using steel angles to withstand the loads without
bending. Dimensions of strip footings were fixed
by reviewing the research papers. Two steel
footings of size 36 cm (length) x 7 cm (width) x 2
cm (thickness) were used as model strip footings.
Sand was collected from Pattambi region of
Palakkad district in Kerala. Dry sieve analysis was
conducted as per IS 2720: Part 4: 1985 and the
grain size distribution curve for the soil were
plotted as shown in figure 3 given below.
Fig.3 Particle size distribution curve
From the graph, it can be seen that the gradation of
the soil is Poorly Graded (SP). The uniformity
coefficient and coefficient of curvature was found
out from the D30 and D60 values obtained from the
particle size distribution curve.
The properties of sand obtained by conducting
various laboratory tests confirming to the
corresponding IS codes are given in the table 1
given below.
0
20
40
60
80
100
120
0.0001 0.001 0.01 0.1 1
Per
cen
tage
fin
er (
% N
)
Particle size (mm )

50
th
IG
C
50th
INDIAN GEOTECHNICAL CONFERENCE
17th
– 19th
DECEMBER 2015, Pune, Maharashtra, India
Venue: College of Engineering (Estd. 1854), Pune, India
Table 1 Basic properties of sand
Properties Value
Uniformity coefficient
(Cu) 2.8
Coefficient of
curvature (Cc) 0.914
Effective size, D10
(mm) 0.25
Specific gravity, Gs 2.67
Maximum dry density,
γmax(kN/m3)
18.06
Minimum dry density,
γmin(kN/m3)
14.91
Maximum void ratio,
emax 0.663
Minimum void ratio,
emin
Relative density
Dr (%)
0.500
67
Density of sand
(kN/m3)
16.91
Angle of internal
friction (ϕ) 40
The obtained values of coefficient of curvature and
uniformity coefficient confirm the gradation of soil
as poorly graded.
Sodium silicate for chemical grouting has a weight
ratio of 3.22:1(SiO2: Na2O) and specific gravity of
2.61. It is white to greenish aqueous solution that is
readily soluble in water. It is basically an alkaline
solution and on acidification it will start
polymerization to form a silica gel which is hard
and glossy.
Three types of cationic poly-electrolytes (Floquat
4440, Floquat 4420, and Floquat 3249) were used
in this study. The basic properties as given by the
manufacturer are given in the table 2 given below.
Table 2 Properties of Floquats from manufactures
Name Monomer
type
Concent
ration in
water
Viscosity
(m2/s)
Fl
4420
Medium
molecular
weight
polydadmac
20% 80-180
Fl
4440
Medium
molecular
weight
polydadmac
40% 1000 -
3000
Fl
3249
High
molecular
weight
epiDMA
copolymer
(polyamine)
20% 4000 -
9000
Each compound is made of different monomers
and they show different viscosities. Buffer solution
of citric acid of pH 4 was purchased from E. Merck
Limited. Sodium silicate is basically alkaline in
nature. Small quantity of buffer solution will
acidify the sodium silicate to weak acidic level and
enhance polymerization of the sodium silicate
grout.
METHODOLOGY
Experimental Modelling
Sand was filled in the tank in 10 layers of equal
thickness to a height of 50 cm. Quantity of sand in
each layer, corresponding to the required relative
density chosen for the study was calculated. Each
layer of sand was filled in the tank carefully by
compacting so as to achieve the required density.
Footings were placed over sand in the tank as
shown in the schematic diagram given in Fig.2. It
was placed at proper locations using plumb bob
and levelled using spirit levels to avoid eccentric
loading. Hydraulic jack was installed vertically
C.J. Ragiya1, K. Salinitha2
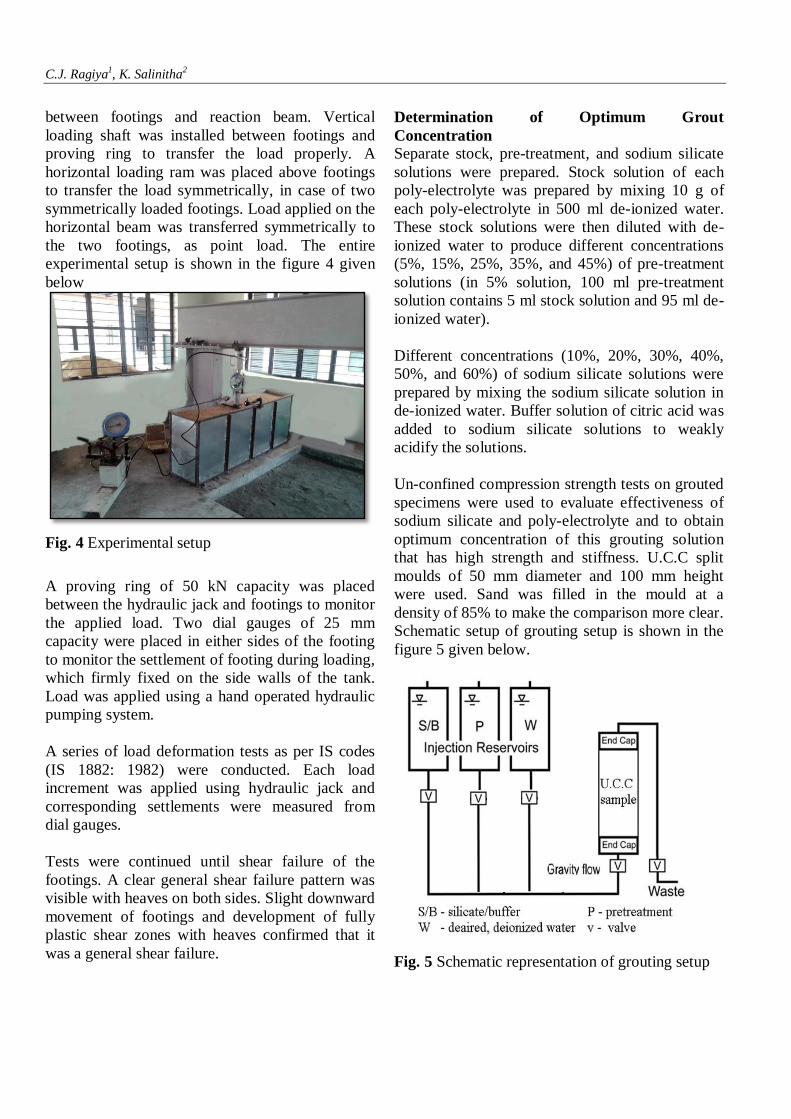
between footings and reaction beam. Vertical
loading shaft was installed between footings and
proving ring to transfer the load properly. A
horizontal loading ram was placed above footings
to transfer the load symmetrically, in case of two
symmetrically loaded footings. Load applied on the
horizontal beam was transferred symmetrically to
the two footings, as point load. The entire
experimental setup is shown in the figure 4 given
below
Fig. 4 Experimental setup
A proving ring of 50 kN capacity was placed
between the hydraulic jack and footings to monitor
the applied load. Two dial gauges of 25 mm
capacity were placed in either sides of the footing
to monitor the settlement of footing during loading,
which firmly fixed on the side walls of the tank.
Load was applied using a hand operated hydraulic
pumping system.
A series of load deformation tests as per IS codes
(IS 1882: 1982) were conducted. Each load
increment was applied using hydraulic jack and
corresponding settlements were measured from
dial gauges.
Tests were continued until shear failure of the
footings. A clear general shear failure pattern was
visible with heaves on both sides. Slight downward
movement of footings and development of fully
plastic shear zones with heaves confirmed that it
was a general shear failure.
Determination of Optimum Grout
Concentration
Separate stock, pre-treatment, and sodium silicate
solutions were prepared. Stock solution of each
poly-electrolyte was prepared by mixing 10 g of
each poly-electrolyte in 500 ml de-ionized water.
These stock solutions were then diluted with de-
ionized water to produce different concentrations
(5%, 15%, 25%, 35%, and 45%) of pre-treatment
solutions (in 5% solution, 100 ml pre-treatment
solution contains 5 ml stock solution and 95 ml de-
ionized water).
Different concentrations (10%, 20%, 30%, 40%,
50%, and 60%) of sodium silicate solutions were
prepared by mixing the sodium silicate solution in
de-ionized water. Buffer solution of citric acid was
added to sodium silicate solutions to weakly
acidify the solutions.
Un-confined compression strength tests on grouted
specimens were used to evaluate effectiveness of
sodium silicate and poly-electrolyte and to obtain
optimum concentration of this grouting solution
that has high strength and stiffness. U.C.C split
moulds of 50 mm diameter and 100 mm height
were used. Sand was filled in the mould at a
density of 85% to make the comparison more clear.
Schematic setup of grouting setup is shown in the
figure 5 given below.
Fig. 5 Schematic representation of grouting setup
50
th
IG
C
50th
INDIAN GEOTECHNICAL CONFERENCE
17th
– 19th
DECEMBER 2015, Pune, Maharashtra, India
Venue: College of Engineering (Estd. 1854), Pune, India
Sodium silicate solution, pre-treatment solution
and de-ionized water were kept in three different
reservoirs. Solutions were injected under gravity
without any external pressure one by one.
Tubes were connected from the bottom of
reservoirs to the bottom end cap of U. C.C mould.
Flow of solutions was upward from the bottom of
the mould to top of the mould to get a uniformly
grouted sand specimen. A waste line was
connected at the top. The head difference rapidly
decreased from a maximum of approximately 0.3
m at the start of injection to zero at the end of the
injection. Specimen was saturated subsequently
with de-ionized water, pre-treatment solution and
sodium silicate – buffer solution. Samples were
allowed to air dry for 7 days. Unconfined
compression tests were conducted on these
prepared specimens as per IS code provisions.The
specimen was compressed until the failure surface
was definitely developed.
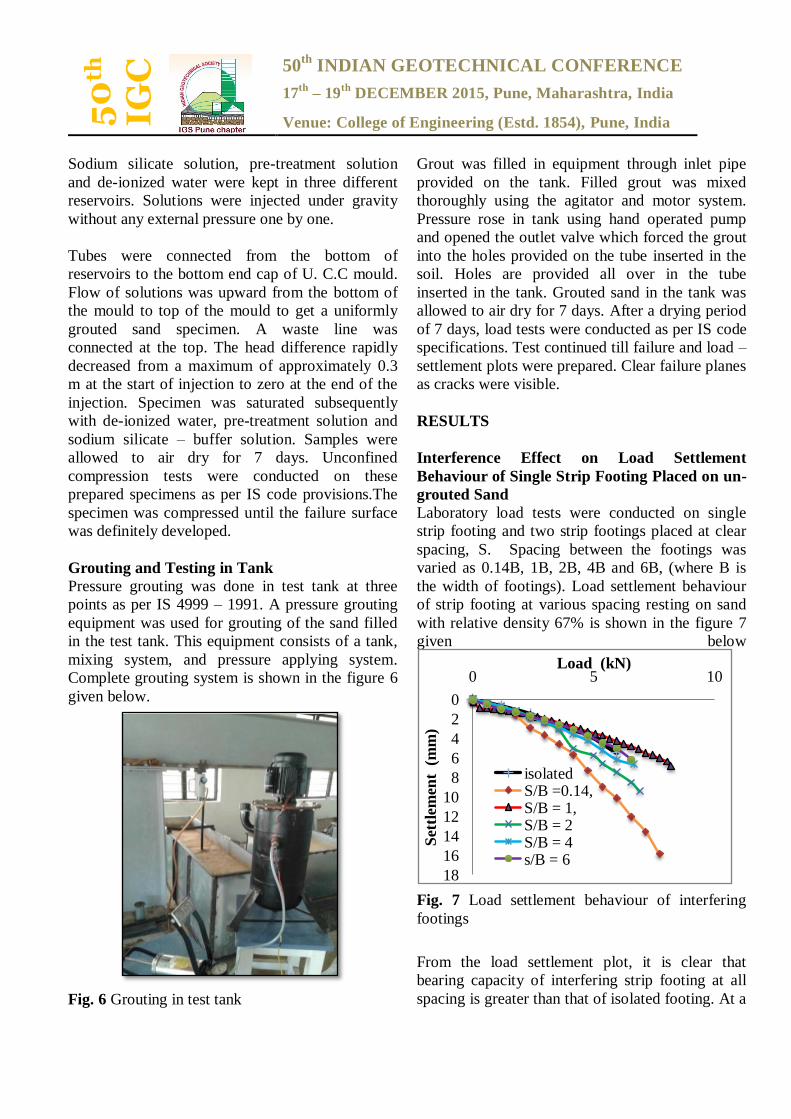
Grouting and Testing in Tank
Pressure grouting was done in test tank at three
points as per IS 4999 – 1991. A pressure grouting
equipment was used for grouting of the sand filled
in the test tank. This equipment consists of a tank,
mixing system, and pressure applying system.
Complete grouting system is shown in the figure 6
given below.
Fig. 6 Grouting in test tank
Grout was filled in equipment through inlet pipe
provided on the tank. Filled grout was mixed
thoroughly using the agitator and motor system.
Pressure rose in tank using hand operated pump
and opened the outlet valve which forced the grout
into the holes provided on the tube inserted in the
soil. Holes are provided all over in the tube
inserted in the tank. Grouted sand in the tank was
allowed to air dry for 7 days. After a drying period
of 7 days, load tests were conducted as per IS code
specifications. Test continued till failure and load –
settlement plots were prepared. Clear failure planes
as cracks were visible.
RESULTS
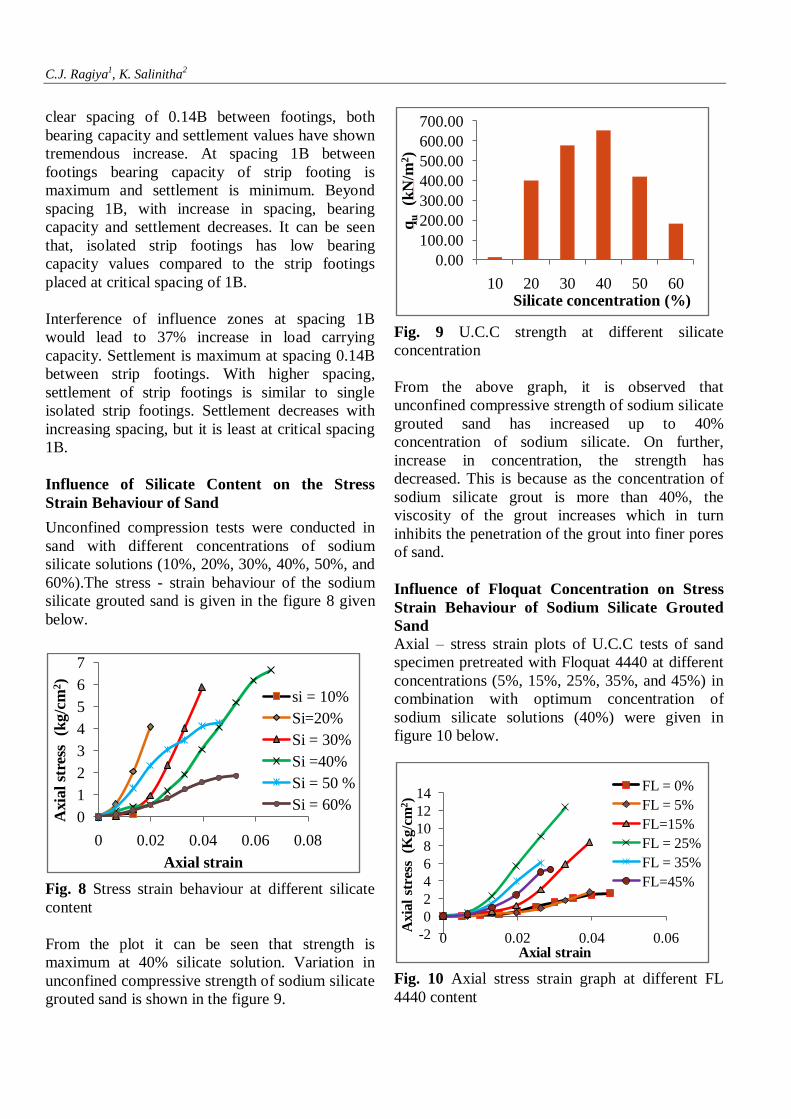
Interference Effect on Load Settlement
Behaviour of Single Strip Footing Placed on un-
grouted Sand
Laboratory load tests were conducted on single
strip footing and two strip footings placed at clear
spacing, S. Spacing between the footings was
varied as 0.14B, 1B, 2B, 4B and 6B, (where B is
the width of footings). Load settlement behaviour
of strip footing at various spacing resting on sand
with relative density 67% is shown in the figure 7
given below
Fig. 7 Load settlement behaviour of interfering
footings
From the load settlement plot, it is clear that
bearing capacity of interfering strip footing at all
spacing is greater than that of isolated footing. At a
0
2
4
6
8
10
12
14
16
18
0 5 10
Set
tlem
ent
(m
m)
Load (kN)
isolatedS/B =0.14, S/B = 1, S/B = 2S/B = 4s/B = 6
C.J. Ragiya1, K. Salinitha2
clear spacing of 0.14B between footings, both
bearing capacity and settlement values have shown
tremendous increase. At spacing 1B between
footings bearing capacity of strip footing is
maximum and settlement is minimum. Beyond
spacing 1B, with increase in spacing, bearing
capacity and settlement decreases. It can be seen
that, isolated strip footings has low bearing
capacity values compared to the strip footings
placed at critical spacing of 1B.
Interference of influence zones at spacing 1B
would lead to 37% increase in load carrying
capacity. Settlement is maximum at spacing 0.14B
between strip footings. With higher spacing,
settlement of strip footings is similar to single
isolated strip footings. Settlement decreases with
increasing spacing, but it is least at critical spacing
1B.
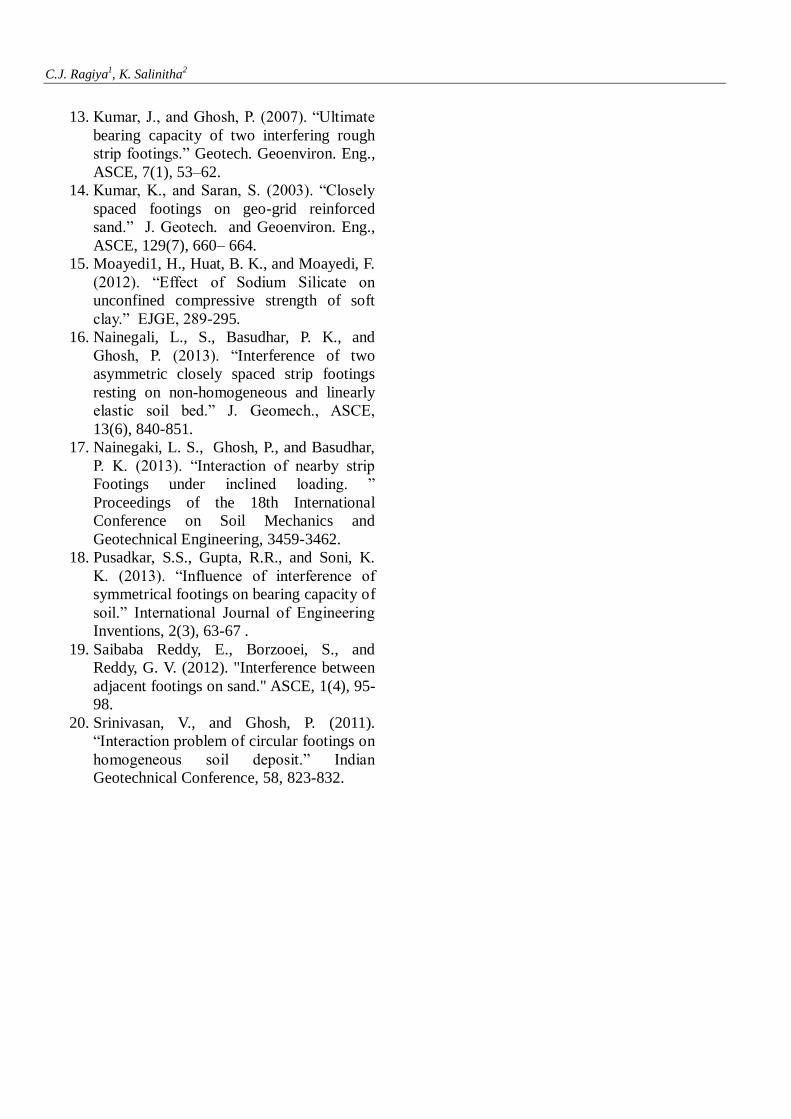
Influence of Silicate Content on the Stress
Strain Behaviour of Sand
Unconfined compression tests were conducted in
sand with different concentrations of sodium
silicate solutions (10%, 20%, 30%, 40%, 50%, and
60%).The stress - strain behaviour of the sodium
silicate grouted sand is given in the figure 8 given
below.
Fig. 8 Stress strain behaviour at different silicate
content
From the plot it can be seen that strength is
maximum at 40% silicate solution. Variation in
unconfined compressive strength of sodium silicate
grouted sand is shown in the figure 9.
Fig. 9 U.C.C strength at different silicate
concentration
From the above graph, it is observed that
unconfined compressive strength of sodium silicate
grouted sand has increased up to 40%
concentration of sodium silicate. On further,
increase in concentration, the strength has
decreased. This is because as the concentration of
sodium silicate grout is more than 40%, the
viscosity of the grout increases which in turn
inhibits the penetration of the grout into finer pores
of sand.
Influence of Floquat Concentration on Stress
Strain Behaviour of Sodium Silicate Grouted
Sand
Axial – stress strain plots of U.C.C tests of sand
specimen pretreated with Floquat 4440 at different
concentrations (5%, 15%, 25%, 35%, and 45%) in
combination with optimum concentration of
sodium silicate solutions (40%) were given in
figure 10 below.
Fig. 10 Axial stress strain graph at different FL
4440 content
0
1
2
3
4
5
6
7
0 0.02 0.04 0.06 0.08
Axia
l st
ress
(k
g/c
m2)
Axial strain
si = 10%
Si=20%
Si = 30%
Si =40%
Si = 50 %
Si = 60%
0.00
100.00
200.00
300.00
400.00
500.00
600.00
700.00
10 20 30 40 50 60
qu
(kN
/m2)
Silicate concentration (%)
-2
0
2
4
6
8
10
12
14
0 0.02 0.04 0.06
Axia
l st
ress
(K
g/c
m2)
Axial strain
FL = 0%
FL = 5%
FL=15%
FL = 25%
FL = 35%
FL=45%

50
th
IG
C
50th
INDIAN GEOTECHNICAL CONFERENCE
17th
– 19th
DECEMBER 2015, Pune, Maharashtra, India
Venue: College of Engineering (Estd. 1854), Pune, India
From the graph, it can be seen that sample pre-
treated with 25% concentration of Floquat 4440
and 40% sodium silicate solution has maximum
strength. Results of the unconfined compression
strength tests conducted using different percentage
of Floquat 4420 in combination with 40% sodium
silicate is shown in the figure 11 given below.
Fig. 11 Axial stress strain graph at different FL
4420 content
From the graph it can be seen that FL 4420„s
concentration of 25 % in combination with 40%
sodium silicate achieves maximum strength.
Behaviour is similar to that using FL 4440. Stress
strain behaviour of sand treated with different
concentrations of FL 3249 in combination with
40% sodium silicate solution is shown in figure 12
given below.
Fig. 12 Axial stress strain graph at different
FL3249 content
From the graph given in figure 11, it can be seen
that 15% of FL 3249 in combination with 40%
sodium silicate has maximum strength.
Lower concentrations of polyelectrolyte improve
cementation whereas high levels of polyelectrolyte
appear to remove silica from solution by
adsorption which reduces the amount of silica
available for grain to grain bonding. Un-confined
compressive strength values obtained for all types
of floquats at different concentrations, in
combination with 40% sodium silicate is shown in
the figure 13 given below.
Fig. 13 U.C.C Strengths at different FL
concentrations
At all Floquat concentrations, strength of sand due
to pre-treatment using Floquat is more than the
strength of sand with sodium silicate grouting
without pre-treatment. From the graph given in the
figure 12, it can be seen that the type and
concentration of polyelectrolyte influenced the
mechanical performance of the cemented sand.
Floquat 4420 has maximum increase of 519%
when pre-treated with 25% solution of Floquat.
And Floquat 4440 has a maximum increase of
376% when pre-treating with 25% solution of
Floquat. Whereas Floquat 3249 has a maximum
increase of 106% only, when pre-treating with 15%
solution of Floquat.
Sand pretreated with Floquat 3249 has only slight
increase in compressive strength than traditional
sodium silicate grouting. Sand pretreated with
0
5
10
15
0 0.02 0.04 0.06 0.08
Axia
l st
ress
(K
g/c
m2)
Axial strain
FL = 0%
FL = 5%
FL=15%
FL = 25%
FL = 35%
FL=45%
0
1
2
3
4
5
6
0 0.02 0.04 0.06
Axia
l st
ress
(K
g/c
m2)
Axial strain
FL = 0%
FL = 5%
FL = 15%
FL = 25%
FL = 35%
FL=45%
0
200
400
600
800
1000
1200
1400
1600
0 5 15 25 35 45
qu
(kN
/m2)
FL concentration (%)
FL 4440
FL 4420
FL 3249

C.J. Ragiya1, K. Salinitha2
Floquat 4440 and Floquat 4420 have more
compressive strength than Floquat 3249. Pre-
treating with cationic poly-electrolyte has
increased the strength than conventional grouting.
Increase in strength is maximum for Floquat 4420
at 25% solution.
It can be concluded that optimum concentration for
bio-silicification process is pre-treating sand with
25% solution of FL 4420 followed by grouting
with 40% sodium silicate and buffer solution.
Effect of Spacing between Footings on Load
Settlement Behaviour of Interfering Footings,
Placed on Reinforced Soil
Obtained load deformation behaviour of interfering
strip footings (placed at critical spacing) and single
strip footing placed on grouted sand was compared
and that is shown in the figure 14 given below.
Fig. 14 Behaviour of interfering strip footing at
clear spacing of 1B on grouted sand
There is a 5.77% increase in load carrying capacity
of interfering strip footings placed on grouted sand
than that of isolated strip footing on grouted sand.
But this increase in load carrying capacity due to
interference effect is less than that of footings
placed on non-grouted sand.
Load carrying capacity of single strip footing is
increased by 139.9% through grouting using bio-
silicification process. Slight increase in settlement
was also observed in grouted sand. Load carrying
capacity of interfering strip footing placed at
critical spacing was increased by 84.5% through
grouting using bio-silicification process.
Interference effect has less influence on sodium
silicate grouted sand.
CONCLUSIONS
Major conclusions that obtained through discussing
the results of the thesis work are given below
1. If the passive shear zones of adjacent
footings interfere with each other then the
load settlement behaviour of footing will
change due to interference effect.
2. Load settlement behaviour of interfering
footing depends on the spacing between the
footings. Load carrying capacity of
interfering footing attains a peak maximum
value at a clear spacing 1B. Load carrying
capacity of interfering footings is always
higher than that of single isolated footing.
Footings which are placed at a clear
spacing of 1B on sand of 67%
density, shows 37.5% increase in
load carrying capacity when
compared with the single isolated
footing.
3. When clear spacing between footings is
more than 1B, load carrying capacity of
interfering footing decreases. It behaves
like a single isolated footing at a clear
spacing of 6B, because there is no
interaction of shear zones of footings.
4. Settlement at failure of interfering footing
is maximum when footings are closer (that
is S = 0.14B).
5. Strength of sodium silicate grouted sand is
maximum at 40% solution because more
sodium silicate content will increase the
viscosity of grout and inhibits the
penetration of the grout into finer pores.
6. Introduction of Floquat before sodium
silicate grouting will lead to increase the
unconfined compressive strength of grouted
sand. And un-confined compressive
strength of grouted sand depends on type
and concentration of Floquat (FL).
FL 4440 shows maximum increase
in strength of 375%, at 25%
solution of Floquat in combination
0
5
10
15
20
25
30
0 5 10 15 20
Set
tlem
ent
(m
m)
Load (kN)
single footing, grouted
S/B = 1, Grouted sand

50
th
IG
C
50th
INDIAN GEOTECHNICAL CONFERENCE
17th
– 19th
DECEMBER 2015, Pune, Maharashtra, India
Venue: College of Engineering (Estd. 1854), Pune, India
with 40% solution of sodium
silicate.
FL 4420 shows maximum increase
in strength of 519.4%, at 25%
solution of Floquat in combination
with 40% solution of sodium
silicate.
FL 3249 shows maximum increase
in strength of 106.1%, at 25%
solution of Floquat in combination
with 40% solution of sodium
silicate.
7. Optimum concentration of grout that has
maximum strength can be obtained by pre-
treating the 40% solution of sodium silicate
grouted sand with 25% solution of FL
4420.
8. Low concentrations of polyelectrolyte
improve cementation whereas high levels
of polyelectrolyte appear to remove silica
from solution by adsorption which reduces
the amount of silica available for grain to
grain bonding.
9. Load carrying capacity of single isolated
footing was found to be increased by
139.9% after grouting the soil. Interfering
footing placed at critical spacing of 1B
between footings shows 84.5% increase in
load carrying capacity after grouting.
10. Footings placed at critical spacing on
grouted sand shows 5.76% increase in load
carrying capacity due to interference effect.
Whereas footings placed at critical spacing
on un-grouted sand shows 37.5% increase
in load carrying capacity due to interference
effect. That is interference effect of
footings on grouted sand is less significant
than that of on un-grouted sand.
REFERENCES
1. Adams, M. T., and Collin, J. G. (1997).
“Large model spread footing load tests on
geo-synthetic reinforced soil foundations.”
ASCE, 123(1), 66-72.
2. Alaa Ata. et. al. (1999). “Factors affecting
mechanical and creep properties of silicate
grouted sands”, Geotech. Geoenviron.Eng.,
ASCE, 125(10), 868-876.
3. Amer, A. A., and Romi, E. A. (2012).
“Settlement and tilt of two interfering
footings on clay”.
4. Awad, M. A., and Mezaini, N. S. (2001).
“Effect of footings interaction on bearing
capacity and settlement of sandy soil.”
Journal of the Islamic University of Gaza,
9(1), 43-51.
5. Bolisetti, T., Reitsma, S., and Balachandar,
R. (2009). “Experimental investigations of
colloidal silica grouting in porous media.”
J. Geotech. and Geoenviron., ASCE,
135(5), 697-700.
6. Dano, C., et.al. (2004). “Engineering
properties of grouted sand” ASCE, 130(3),
328-338.
7. Daud, K., A. (2012). “Interference of
shallow multiple strip footings on sand.”
The Iraqi Journal for Mechanical and
Material Engineering, 12(3), 492-507.
8. Dove, J. D., et. al. (2011). “Biologically
inspired silicification process for improving
mechanical properties of sand” Geotech.
Geoenviron.Eng., ASCE, 137(3), 949-957.
9. Ghosh, P., and Kumar, P. (2009).
"Interference effect of two nearby strip
footings on reinforced sand", Contemporary
Engineering Science, 2(12), 577-592.
10. Ghosh, P., and Sharma, A. (2010).
“Interference effect of two nearby square
and rectangular footings” Indian
Geotechnical Conference, 799-802.
11. Griffiths, D. V., Fenton, G. A., and
Manoharan, N. (2006). “Undrained bearing
capacity of two strip footings on spatially
random soil.” J. Geotmech., ASCE, 6(6),
421-427.
12. Kumar, J., and Bhoi, M. K. (2009).
“Interference of two closely spaced strip
footings on sand using model test.”
Geotech. Geoenviron. Eng., ASCE, 135(4),
595-604.
C.J. Ragiya1, K. Salinitha2
13. Kumar, J., and Ghosh, P. (2007). “Ultimate
bearing capacity of two interfering rough
strip footings.” Geotech. Geoenviron. Eng.,
ASCE, 7(1), 53–62.
14. Kumar, K., and Saran, S. (2003). “Closely
spaced footings on geo-grid reinforced
sand.” J. Geotech. and Geoenviron. Eng.,
ASCE, 129(7), 660– 664.
15. Moayedi1, H., Huat, B. K., and Moayedi, F.
(2012). “Effect of Sodium Silicate on
unconfined compressive strength of soft
clay.” EJGE, 289-295.
16. Nainegali, L., S., Basudhar, P. K., and
Ghosh, P. (2013). “Interference of two
asymmetric closely spaced strip footings
resting on non-homogeneous and linearly
elastic soil bed.” J. Geomech., ASCE,
13(6), 840-851.
17. Nainegaki, L. S., Ghosh, P., and Basudhar,
P. K. (2013). “Interaction of nearby strip
Footings under inclined loading. ”
Proceedings of the 18th International
Conference on Soil Mechanics and
Geotechnical Engineering, 3459-3462.
18. Pusadkar, S.S., Gupta, R.R., and Soni, K.
K. (2013). “Influence of interference of
symmetrical footings on bearing capacity of
soil.” International Journal of Engineering
Inventions, 2(3), 63-67 .
19. Saibaba Reddy, E., Borzooei, S., and
Reddy, G. V. (2012). "Interference between
adjacent footings on sand." ASCE, 1(4), 95-
98.
20. Srinivasan, V., and Ghosh, P. (2011).
“Interaction problem of circular footings on
homogeneous soil deposit.” Indian
Geotechnical Conference, 58, 823-832.