interfacial molecular organization at aqueous solution ... · containing aerosols play an important...
TRANSCRIPT
Interfacial Molecular Organization at Aqueous Solution Surfaces of AtmosphericallyRelevant Dimethyl Sulfoxide and Methanesulfonic Acid Using Sum Frequency Spectroscopyand Molecular Dynamics Simulation
Xiangke Chen,† Babak Minofar,‡ Pavel Jungwirth,§ and Heather C. Allen*,†
Department of Chemistry, The Ohio State UniVersity, 100 West 18th AVenue, Columbus, Ohio 43210,United States; Institute of Systems Biology and Ecology of the Academy of Sciences of the Czech Republic, andInstitute of Physical Biology, UniVersity of South Bohemia, Zamek 136, NoVe Hrady, Czech Republic; andInstitute of Organic Chemistry and Biochemistry, Academy of Sciences of the Czech Republic, and Center forBiomolecules and Complex Molecular Systems, FlemingoVo nam. 2, 16610 Prague 6, Czech Republic
ReceiVed: August 18, 2010; ReVised Manuscript ReceiVed: October 14, 2010
The molecular organization at the aqueous dimethyl sulfoxide (DMSO) and methanesulfonic acid (MSA)surfaces was investigated using vibrational sum frequency generation (VSFG) spectroscopy and moleculardynamics (MD) simulation. The molecular orientation of surface DMSO and MSA is deduced based on theVSFG spectra of both C-H stretch and S-O stretch regions. The S-O stretch region was studied for thefirst time and is shown to be critical in molecular orientation determination. On average, the CH3 groups ofDMSO and MSA are preferentially pointing outward into the air. However, the DMSO SdO group pointsslightly inward away from the surface, while the SO3 vector of dissociated MSA points nearly straight down.In addition, MD simulations reveal that the orientation distribution of surface DMSO is relatively broad incontrast with a narrow distribution of surface MSA, which agrees with the experiment findings.
Introduction
Organosulfur compounds of both natural and anthropogenicorigin have been found to be involved in many reactions takingplace at the aerosol surface.1 In the marine boundary layer(MBL), the sulfur cycle dominates in the gas to particle conversionprocess and in the growth of aerosols.2 Tropospheric sulfur-containing aerosols play an important role in climate as well as inrelated heterogeneous atmospheric chemical processes.3,4 Asignificant sulfur source in the MBL is the biogenic dimethylsulfide (DMS) produced by metabolic processes of algae.5,6
Because of its high volatility and reactivity, DMS is easilyoxidized in the atmosphere and produces many stable intermedi-ates such as dimethyl sulfoxide (DMSO, (CH3)2SdO) andmethanesulfonic acid (MSA, CH3-SO2-OH).7,8 Oxidation ofDMSO, MSA, and other intermediates can take place at theaerosol surface and in the bulk of the aerosol through reactionswith OH radicals, which eventually leads to the formation ofH2SO4.9 The sulfur-containing aerosols serve as cloud condensa-tion nuclei, influencing the formation of clouds and therebymodifying the earth’s albedo.3,4,10 Therefore, the uptake oforganosulfur species and the molecular organization at theaerosol surface are of great interest in atmospheric chemistry.
Besides the important atmospheric implications, DMSO,MSA, and their aqueous solutions also have a wide range ofapplications in other chemical processes. In organic chemistry,DMSO is among the most widely used solvents.11 Biologicalproperties of DMSO are also important. Due to its amphiphilic
nature, DMSO interacts strongly with molecules in cell mem-branes, which promotes membrane permeability12,13 and inducescell differentiation14 and fusion.15 Because of its strong interac-tion with water, aqueous DMSO solutions display strongnonideal behavior. For example, they can reach freezing pointsnear the temperature of liquid nitrogen, and, therefore, can beused as a cryoprotectant for biological structures such as tissuesand proteins.16 Methanesulfonic acid, similar to DMSO, iscompletely miscible with water at any concentration. Moreover,MSA is a strong acid (pKa ) -1.9) and is widely used as anacid electrolyte in many electrochemical processes.17
Extensive efforts have been made to elucidate molecularorganization in the bulk solutions of aqueous DMSO andMSA.18-23 In particular, DMSO-water mixtures have beeninvestigated by a wide variety of experimental techniques suchas X-ray and neutron diffraction,21,24 infrared (IR) and Ramanspectroscopy,25,26 nuclear magnetic resonance (NMR),27,28 andacoustic spectroscopy29 as well as computer simulations.18-20,30
These studies led to the conclusion that DMSO as a hydrogenbond acceptor forms strong hydrogen bonds with water mol-ecules. The hydrogen bond between DMSO and water is evenmore pronounced than that between water molecules.21 Themethyl groups of DMSO, although hydrophobic, are looselyhydrated by surrounding water molecules.27 Similar hydrogen-bonding ability of MSA with water is observed due to the S-Omoieties.22
Because of the noticeable surface preference of DMSO andMSA,31-33 the structure and properties of the surface of theiraqueous solutions are also of interest. In contrast with therelatively abundant bulk information, the molecular organizationat the surface is still not well understood due to limited surface-specific techniques for aqueous media. Only nonlinear spectro-scopic methods such as second harmonic generation (SHG)34
and vibrational sum frequency generation (VSFG) have beenutilized to study the surface of aqueous solutions of DMSO and
* To whom correspondence should be addressed.† The Ohio State University.‡ Institute of Systems Biology and Ecology of the Academy of Sciences
of the Czech Republic, and Institute of Physical Biology, University ofSouth Bohemia.
§ Institute of Organic Chemistry and Biochemistry, Academy of Sciencesof the Czech Republic, and Center for Biomolecules and Complex MolecularSystems.
J. Phys. Chem. B 2010, 114, 15546–1555315546
10.1021/jp1078339 2010 American Chemical SocietyPublished on Web 11/09/2010
MSA.31-33,35 A concentration VSFG study of aqueous DMSOshowed that the square root of the CH3 intensity was propor-tional to the determined surface DMSO number density, whichsuggested that the average orientation of DMSO CH3 groupsremains unchanged with different mixing ratios with water.However, the actual orientation of DMSO at the surface hasnot been reported.35 In addition, a VSFG study calculated theMSA orientation based on the CH3 symmetric stretch intensitiesin ssp and sps polarizations. Due to the near-zero CH3 intensityin sps polarization, the determined orientation angle of MSAhad a large uncertainty range of 0-60°.33 Computationalsimulations focused solely on DMSO, showing that thismolecule is surface active and oriented at the water surface.36-38
Thus, a general but not complete picture of the surface ofaqueous solutions of DMSO and MSA including the surfaceconcentration, molecular interactions and orientation, andinterfacial water structure has been presented.
In this paper, the VSFG technique with complementaryinfrared (IR) and Raman spectroscopies are employed to presenta comprehensive study of the liquid/vapor interface of aqueoussolutions of DMSO and MSA to elucidate the molecularorganization and orientation, and intermolecular interactions.Taking advantage of the ability to probe in the low-frequencyvibrational region (fingerprint region), the S-O moieties inDMSO and MSA are investigated here for the first time forthese molecules. In concert, molecular dynamics (MD) simula-tions are performed to gain more insight on the experimentalresults.
Experimental Section
Materials. DMSO and methanesulfonic acid (>99% purity)were purchased from Fisher. 1,2-Dipalmitoyl-sn-glycero-3-phosphate (DPPA) was obtained from Avanti Polar Lipids(Alabaster, AL). Deionized water (not purged of CO2) with aresistivity of 18.2 MΩ · cm and a measured pH of 5.5 was froma Barnstead Nanopure system. Concentrations are reported inunits of mole fraction denoted as x.
VSFG Spectroscopy. The broad bandwidth VSFG system39,40
consists of two 1 kHz repetition rate regenerative amplifiers(Spectra-Physics Spitfire, femtosecond and picosecond versions),both of which are seeded by sub-50 fs 792 nm pulses (thewavelength is tuned for system optimization) from a Ti:sapphireoscillator (Spectra-Physics, Tsunami) and pumped by a 527 nmbeam from an all solid-state Nd:YLF laser (Spectra-Physics,Evolution 30). The two regenerative amplifiers provide 85fs pulses and 2 ps pulses at 792 nm. The spectrally broadfemtosecond pulses are used to drive the infrared generationin an OPA (optical parametric amplifier; TOPAS, Quantronix)and then produce broad bandwidth infrared pulses (∼200 cm-1
fwhm). Stable infrared pulses are tunable in various wavelengthregions ranging from 1000 to 3800 cm-1. At the sample stage,the incident angles of visible and IR are 53° and 68°,respectively, the energy of the 792 nm picosecond pulse wasset to 300 µJ, and the IR femtosecond pulse was ∼9 µJ in theC-H stretching region and ∼3 µJ in the S-O stretching region.
The intensity of the reflected sum frequency signal, ISF, isproportional to the absolute square of the effective second-ordersusceptibility, eff
(2), and to the visible and IR pulse intensities asshown in eq 1:41
VSFG experiments can be conducted with a variety ofpolarization combinations of incident visible and IR pulses such
as ssp, sps, pss, and ppp, where the three polarizations refer tothe polarization of sum frequency light, visible light, and IRlight in order. For instance, ssp means s-polarized output sumfrequency signal with s-polarized incident visible and p-polarized incident IR pulses.
In different polarization combinations the effective second-order susceptibility, eff
(2) is related to the macroscopic second-order susceptibility ijk
(2) as shown in eqs 2 and 3:41
where θi is the angle of the indicated light to the surface normaland L(ω) is the Fresnel factor (see Supporting Information).
Molecular Orientational Analysis. The capability of quan-titative determination of molecular orientation is a significantadvantage of VSFG technique compared to other spectroscopicmethods. The macroscopic second-order susceptibility ijk
(2) isrelated to the microscopic molecular hyperpolarizability (2)
through average molecular orientation. For the symmetric stretch(SS) of C3V groups discussed in this paper, the nonvanishing(2) are aac ) bbc and ccc.42 The relationship between ijk
(2) and(2) through can be expressed as shown in eqs 4-6:41-43
where θ is the tilt angle of the C3V groups to the surface normaland R ) aac/ccc is the hyperpolarizability ratio which can bedetermined experimentally from polarized Raman spectra.
Combining the relevant equations above could allow tomeasure the ratio of effective second-order susceptibilities eff
(2)
from the VSFG intensity ratio of different polarization combina-tions, i.e., Issp/Ippp, and then retrieve the orientation angle ofC3V groups. The retrieved orientational parameter D, definedas ⟨cos θ⟩/⟨cos3 θ⟩, is based on the known values of the Fresnelfactors, the experiment geometry, and the hyperpolarizabilityratio R. In this work, a δ-distribution of the orientation angle isassumed so that ⟨cos θ⟩ ) cos θ. However, changing thedistribution width of θ will result in change of the retrievedaverage orientation accordingly. Especially, as shown in previ-ous SHG study, the retrieved orientation angle and the distribu-tion width are subjected to a very large uncertainty if the valueof the orientational parameter D is close to 1.66. In that case,the apparent orientation angle retrieved is ∼39°, which is theso-called “magic angle”.44
For C3V symmetry groups the value of hyperpolarizability ratioR is related to the Raman depolarization ratio F by eq 7:43,45
ISFG ∝ |eff(2)|2IvisIIR (1)
eff,ssp(2) ) Lyy(ωSF)Lyy(ωvis)Lzz(ωIR) sin θIR yyz (2)
eff,ppp(2) ) - Lxx(ωSF)Lxx(ωvis)Lzz(ωIR) cos θSF cos θvis sin θIR xxz
- Lxx(ωSF)Lzz(ωvis)Lxx(ωIR) cos θSF sin θvis cos θIR xzx
+ Lzz(ωSF)Lxx(ωvis)Lxx(ωIR) sin θSF cos θvis cos θIR zxx
+ Lzz(ωSF)Lzz(ωvis)Lzz(ωIR) sin θSF sin θvis sin θIR zzz
(3)
xxzSS ) yyz
SS
) 12
Nsccc[⟨cos θ⟩(1 + R) - ⟨cos3 θ⟩(1 + R)](4)
xzxSS ) zxx
SS ) yzySS ) zyy
SS
) 12
Nsccc(⟨cos θ⟩ - ⟨cos3 θ⟩)(1 - R)
(5)
zzzSS ) Nsccc[⟨cos θ⟩R + ⟨cos3 θ⟩(1 - R)] (6)
Liquid/Vapor Interface of Solutions of DMSO and MSA J. Phys. Chem. B, Vol. 114, No. 47, 2010 15547
where F is the ratio of the Raman intensities with polarizationperpendicular and parallel to the excitation light. This ismeasured by the polarized Raman experiment shown in eq 8:
Only one of the retrieved R values from solving the quadraticequation is physically correct,46 which can be validated from apolarized VSFG experiment. For molecular groups with C3Vsymmetry, the value of R > 1 is a simple check from the bondadditive model.42
However, sometimes the VSFG intensity of a specificpolarization combination could be very low (for example, theppp spectrum of DMSO CH3 is more than 10-fold lower inintensity than the ssp spectrum), which as a result leads to largeexperimental errors in orientation analysis from a quantitativeaspect. The polarization null angle method, as shown in theliterature,43,47 can improve the accuracy of the measured ratioof effective second-order susceptibilities eff
(2) and hence accuracyof the determined orientation angle. A detailed description ofthe polarization null angle method is in the Supporting Informa-tion.
Computer Simulations. MD simulations of DMSO or MSAin an aqueous slab were performed. We used a unit cellcontaining 863 water molecules and 16 DMSO or MSAmolecules (corresponding roughly to 1 M (0.02 x)). The sizeof the prismatic unit cell was 30 × 30 × 100 Å and 3D periodicboundary conditions were applied.48 We used a 12 Å cutoff forintermolecular interactions. Long-range Coulomb interactionswere accounted for using the particle mesh Ewald procedure.49
Simulations were run in the NTV canonical ensemble at 300K. A time step of 1 fs was employed, and all bonds involvinghydrogen atoms were constrained using the SHAKE algorithm.50
All systems were first equilibrated for 500 ps, after which a 1ns production run followed.
A polarizable force field was employed. For water, we usedthe POL351 water model. For DMSO or MSA we used thegeneral amber force field parameter set.52 Partial charges wereevaluated using the standard RESP procedure employing theGaussian 03 program53 and all MD simulations were performedusing the Amber 8 program.54
Results and Discussion
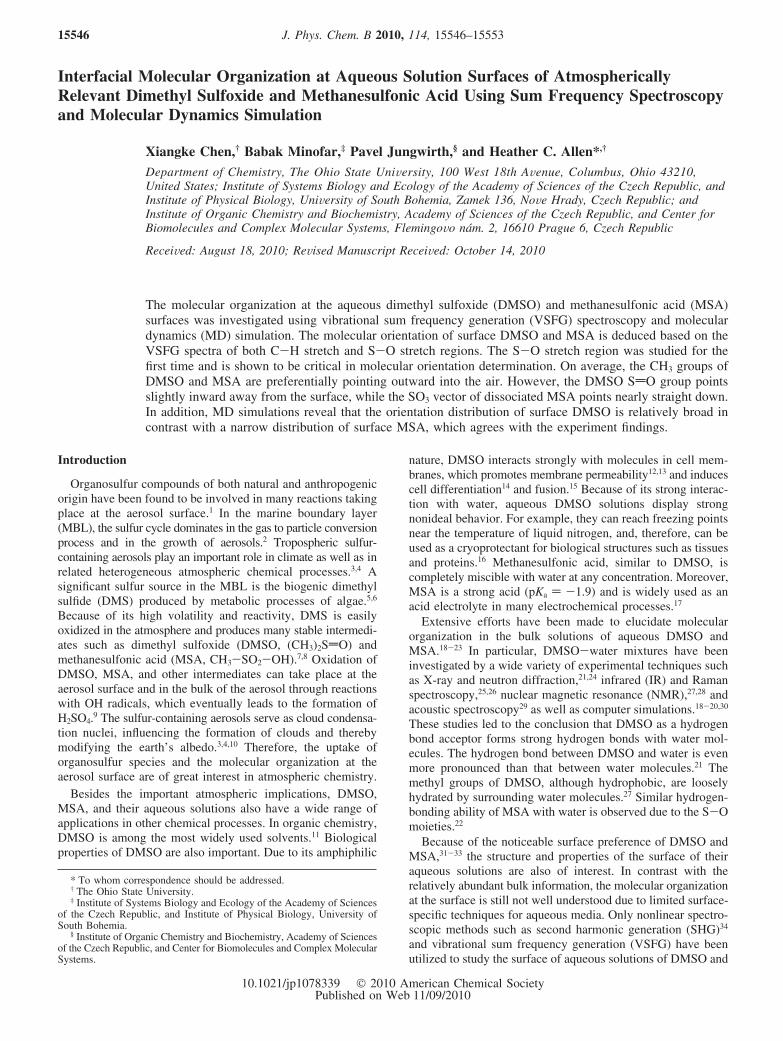
DMSO at the Surface. DMSO-water mixtures have beeninvestigated by various spectroscopic methods including IR,Raman, and VSFG. The SdO moiety is the key part whichaccounts for the dipolar interactions of DMSO. Figure 1 showsthe Raman spectra in the SdO stretch region of a series ofDMSO-water mixtures. The peak near 950 cm-1 is assignedto a rocking mode of DMSO CH3.55 For pure DMSO, a broadband peaked at 1043 cm-1 is observed for the SdO stretchmode.26 The asymmetric band shape ranges from 1000 to 1100cm-1 and has a shoulder at ∼1055 cm-1. This broad shape ofSdO stretch shows the existence of different aggregates in pureDMSO. The SdO frequency of DMSO monomer as diluted incarbon tetrachloride was found to be around 1070 cm-1.55
Because of the negligible interaction between CCl4 and the
DMSO SdO group, this frequency is considered to be unper-turbed. In pure DMSO, a strong dipolar interaction wasidentified between DMSO molecules, leading to formation ofDMSO dimers and chain aggregates.26,38 Therefore, the peak at1043 cm-1 is assigned to the symmetric stretch of the cyclicDMSO dimer.26 As the water content increases in theDMSO-water mixtures, a clear red shift in the SdO stretchfrequency is observed, which is generally attributed to theDMSO-water interaction. The concentration dependence of theSdO frequency red shift was proposed to be correlated with acluster model (DMSO)x(H2O)y. When x . y, as in nearly pureDMSO, the dipolar interaction between DMSO moleculesdominates. On the other hand, hydrogen bonding betweenDMSO and water molecules is more pronounced when y . x.At 0.66 x DMSO the peak intensity at 1030 cm-1 is about thesame as that at 1043 cm-1, which indicates the coexistence ofDMSO in different chemical environments. Previous MDsimulation also suggested the tendency of DMSO and water topreserve their own structural order upon mixing.18 In ratherdilute DMSO solutions (<0.33 x) the width of the SdO stretchband becomes narrower, suggesting a more similar or homo-geneous environment for DMSO. No significant red shift isfound between the 0.1 x and 0.02 x DMSO solution spectra,both showing the SdO frequency centered at 1012 cm-1.
Although IR activity of the DMSO SdO stretch is alsoobserved (data not shown), VSFG of the DMSO SdO stretchhas not been reported so far. Indeed no VSFG intensity in theSdO stretch region is detected for the 0.1 x DMSO in the ssppolarization combination as shown in Figure 2. VSFG intensitynot only relates to the molecular hyperpolarizability but also tothe molecular orientation at the surface and therefore lack ofssp polarization signal could indicate surface disordered DMSOmolecules or orientation of the SdO near the plane of thesurface. However, the significant VSFG intensity of DMSOmethyl groups, discussed below, indicates that disorder is notthe reason for lack of VSFG signal. Previous MD simulationshave predicted the orientation of the S-O vector at the surfaceof both neat DMSO38 and aqueous DMSO solutions.36 The S-Ovector orientation of the top layer of molecules was found tobe parallel to the surface of neat DMSO, while at the aqueousDMSO (<0.2 x) surface, the average S-O vector orientationwas predicted to be ∼30° away from the surface plane. Boththeoretical results suggest that the S-O vector in DMSO prefersto orient close to the surface, which as a consequence, leads toa vanishing of the ssp VSFG intensity.
F ) 3
4 + 5(2R + 1R - 1 )2
(7)
F )I⊥
I||(8)
Figure 1. SdO stretch region Raman spectra of a series ofDMSO-water mixtures. Structure of DMSO is shown in the graph.
15548 J. Phys. Chem. B, Vol. 114, No. 47, 2010 Chen et al.

After spreading of negatively charged phospholipid DPPAonto the 0.1 x DMSO solution, two broad peaks centered at∼1012 and ∼1120 cm-1 are observed. The higher frequencypeak is the DPPA PO2
- stretch as shown in Figure 2. Theagreement of the 1012 cm-1 DMSO peak position with Ramanspectra further proves that the lower frequency 1012 cm-1 peakis the SdO stretch of DMSO. This result clearly shows thatthe S-O vector orientation is affected by the local electric fieldcreated by the negative charge of the DPPA headgroup atsurface; namely, the S-O vector is more perpendicular to thesurface with the oxygen pointing to the bulk as shown in Scheme1. This result indicates that an applied field can orient the SdOand that this orientation can be detected. This result still doesnot clarify the SdO orientation at the surface of an aqueoussolution, but at the least, it excludes the possibility of a ratherstraight down conformation of the SdO bond.
For DMSO, the two CH3 groups are in a fixed moleculargeometry, ∠C-S-C ) 97.4°, and the angle between the SdObond and the C-S-C plane is 64°.36 However, the tilt anglesof the CH3 groups to the surface normal are determined by theangle between the surface normal and the C-S-C plane.Without knowing the angle between the surface normal and theC-S-C plane, retrieval of DMSO CH3 orientation angle is notunique.43 Here we assume the C-S-C plane of DMSO to beperpendicular to the liquid surface, which leaves the S-O vectorto be ∼26° buried close to the surface as suggested by the MDsimulation and our VSFG SdO result. The VSFG spectra inthe C-H stretch region of 0.2 x DMSO is shown in Figure 3.In ssp polarization the peak centered at 2913 cm-1 is the CH3
symmetric stretch.31 This single peak has contribution from bothCH3 groups. The VSFG frequency of the DMSO CH3 symmetricstretch blue shifts as the DMSO concentration decreases (datano shown) which is in accordance with previous literature.31
This blue shift is also observed in a bulk infrared study and isattributed to the effect of the hydration of the CH3 groups asexplained by the pushball mechanism.27 In addition, a previousVSFG concentration study on aqueous DMSO suggested thatthe orientation of DMSO methyl groups remains relativelyunchanged at all mixing ratios with water although no orientationvalue was given.35 Based on this, only one aqueous DMSOconcentration is used to investigate the DMSO orientation atthe air/water interface in the present study.
Usually, the VSFG intensity ratios of different polarizationcombinations, i.e., ssp, ppp, or sps, are used to determine theaverage orientation of the specified group. This method isconvenient when appreciable VSFG intensities can be measuredin these polarization combinations. For the DMSO CH3 groups,although there is decent intensity in ssp polarization, intensityin ppp polarization (data not shown) is more than 1 order ofmagnitude less than in ssp polarization. Using the VSFGintensity ratio to determine the DMSO CH3 orientation couldtherefore be subject to a relatively large error. In this case, theCH3 orientation can be more accurately determined throughpolarization null angle analysis as demonstrated in previousstudies.43,47 In our experiment, the polarization of IR is fixed atp while the polarization of visible is set to -45° (equal mixingof s and p), so that both ssp and ppp VSFG signals can bedetected. If the detection polarization angle for VSFG is set tos, only half of the intensity will be observed as shown in Figure3. A certain detection polarization angle (so-called null angle)
Figure 2. VSFG spectra in SdO region of 0.1 x aqueous DMSO. Theimpact of DPPA on DMSO orientation is shown.
SCHEME 1: Influence of DPPA on DMSO Orientationat the Interface
Figure 3. Polarization null angle study of 0.2 x aqueous DMSO CH3
group. The null angle is shown in the inset.
Liquid/Vapor Interface of Solutions of DMSO and MSA J. Phys. Chem. B, Vol. 114, No. 47, 2010 15549
can be measured at which the total output VSFG intensityvanishes. For 0.2 x DMSO CH3 groups, the null angle isdetermined to be -10.8° ( 2.0° as shown in the inset of Figure3, which corresponds to the eff,ppp
(2) /eff,ssp(2) of -0.191 ( 0.036.
In addition, the value of the hyperpolarizability ratio (R) ofDMSO CH3 groups is required. Because the CH3 groups arelinked to sulfur atoms in DMSO, this R value is different fromthe terminal CH3 group in an alkyl chain. One way toexperimentally determine the value of R is from the Ramandepolarization ratio (F), which is 0.03 for DMSO CH3.55 As aresult, R(CH3) is calculated using eq 7 to be 2.26.
The two CH3 groups could have different tilt angles, whichcan be related through the assumed molecular geometry: θ1 )97.4° - θ2. Similar treatment was also employed in previousVSFG study of acetone CH3 groups at the vapor/acetoneinterface.56 Using the values above, the two tilt angles aredetermined from eqs 2-6 to be 27.0° ( 4.0° and 70.4° ( 4.0°,respectively. This indicates that,on average, while assuming thatthe two CH3 group point toward the air phase, DMSO moleculesare only slightly tilted from the surface normal at the surface.However, the above tilt angles of DMSO CH3 groups are theaverage values retrieved using a δ-distribution assumption.The orientation parameter D retrieved in our experiment is 1.65(the value at the magic angle is 1.66), which indicates that theDMSO CH3 groups could orientate at other average tilt angles,but with relatively broad distributions,44 although from therelatively strong CH3 VSFG signal, at least the partial orderingof DMSO molecules at the surface is anticipated.
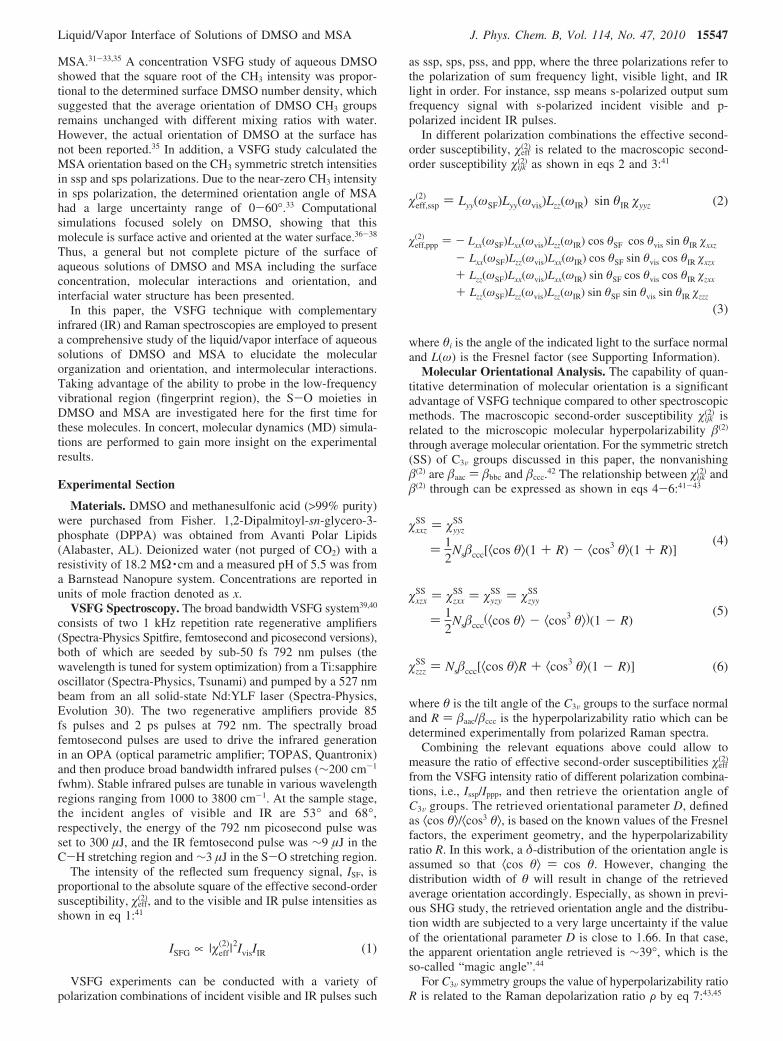
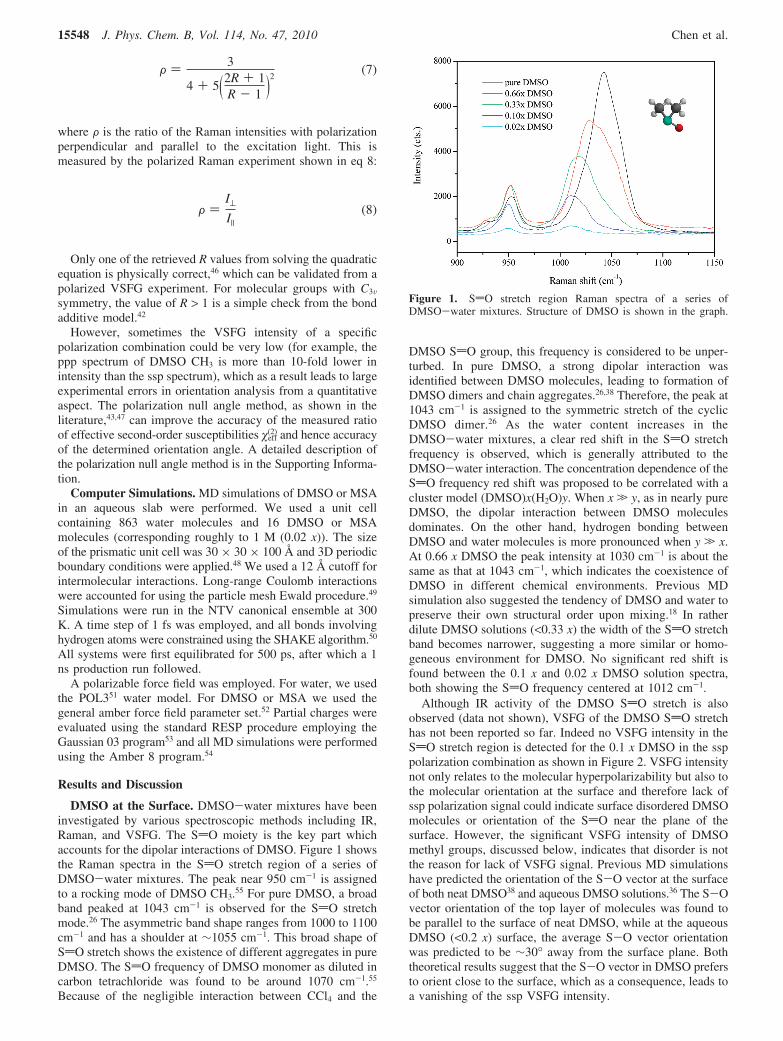
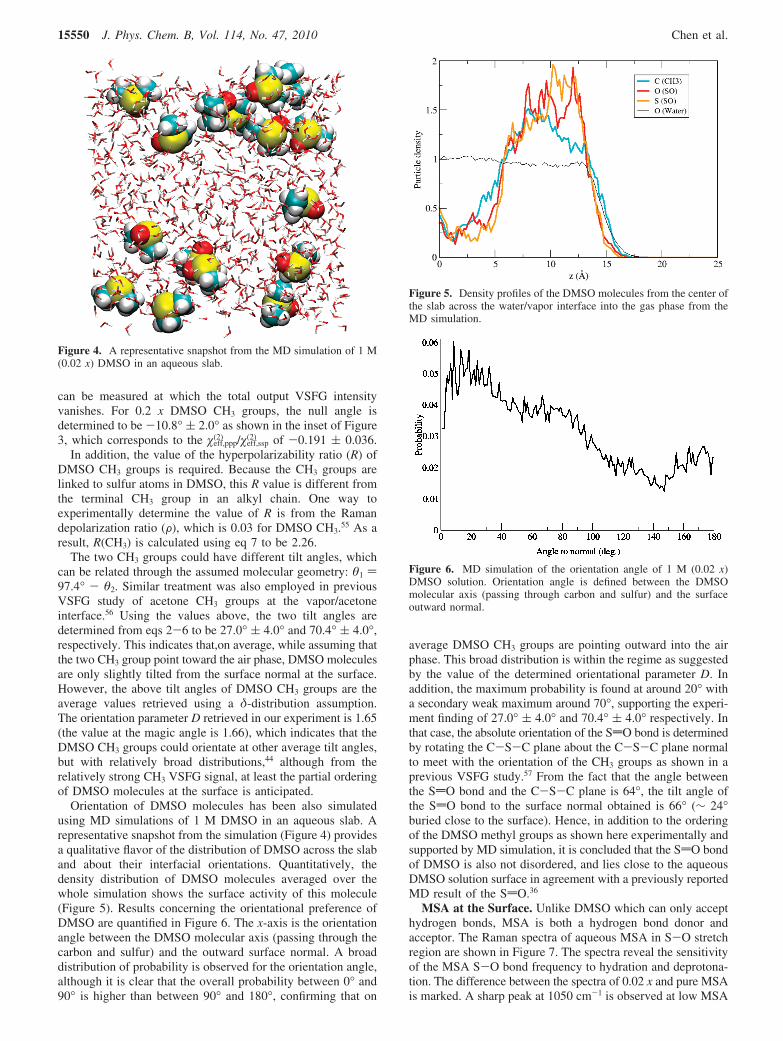
Orientation of DMSO molecules has been also simulatedusing MD simulations of 1 M DMSO in an aqueous slab. Arepresentative snapshot from the simulation (Figure 4) providesa qualitative flavor of the distribution of DMSO across the slaband about their interfacial orientations. Quantitatively, thedensity distribution of DMSO molecules averaged over thewhole simulation shows the surface activity of this molecule(Figure 5). Results concerning the orientational preference ofDMSO are quantified in Figure 6. The x-axis is the orientationangle between the DMSO molecular axis (passing through thecarbon and sulfur) and the outward surface normal. A broaddistribution of probability is observed for the orientation angle,although it is clear that the overall probability between 0° and90° is higher than between 90° and 180°, confirming that on
average DMSO CH3 groups are pointing outward into the airphase. This broad distribution is within the regime as suggestedby the value of the determined orientational parameter D. Inaddition, the maximum probability is found at around 20° witha secondary weak maximum around 70°, supporting the experi-ment finding of 27.0° ( 4.0° and 70.4° ( 4.0° respectively. Inthat case, the absolute orientation of the SdO bond is determinedby rotating the C-S-C plane about the C-S-C plane normalto meet with the orientation of the CH3 groups as shown in aprevious VSFG study.57 From the fact that the angle betweenthe SdO bond and the C-S-C plane is 64°, the tilt angle ofthe SdO bond to the surface normal obtained is 66° (∼ 24°buried close to the surface). Hence, in addition to the orderingof the DMSO methyl groups as shown here experimentally andsupported by MD simulation, it is concluded that the SdO bondof DMSO is also not disordered, and lies close to the aqueousDMSO solution surface in agreement with a previously reportedMD result of the SdO.36
MSA at the Surface. Unlike DMSO which can only accepthydrogen bonds, MSA is both a hydrogen bond donor andacceptor. The Raman spectra of aqueous MSA in S-O stretchregion are shown in Figure 7. The spectra reveal the sensitivityof the MSA S-O bond frequency to hydration and deprotona-tion. The difference between the spectra of 0.02 x and pure MSAis marked. A sharp peak at 1050 cm-1 is observed at low MSA
Figure 4. A representative snapshot from the MD simulation of 1 M(0.02 x) DMSO in an aqueous slab.
Figure 5. Density profiles of the DMSO molecules from the center ofthe slab across the water/vapor interface into the gas phase from theMD simulation.
Figure 6. MD simulation of the orientation angle of 1 M (0.02 x)DMSO solution. Orientation angle is defined between the DMSOmolecular axis (passing through carbon and sulfur) and the surfaceoutward normal.
15550 J. Phys. Chem. B, Vol. 114, No. 47, 2010 Chen et al.
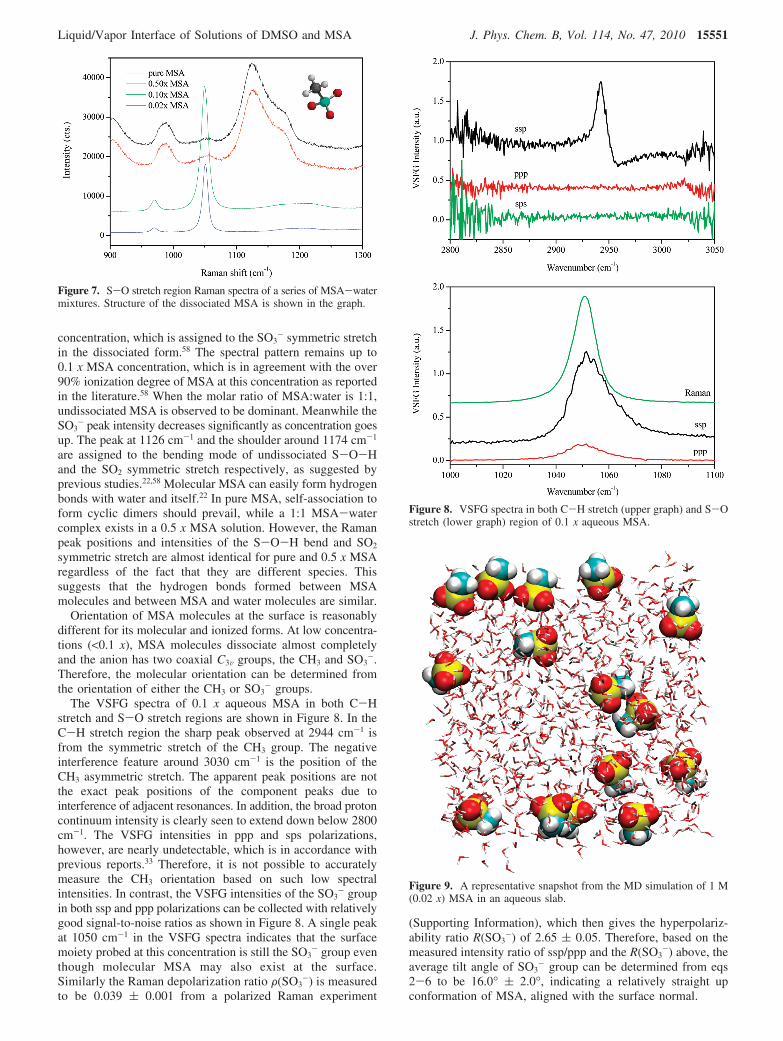
concentration, which is assigned to the SO3- symmetric stretch
in the dissociated form.58 The spectral pattern remains up to0.1 x MSA concentration, which is in agreement with the over90% ionization degree of MSA at this concentration as reportedin the literature.58 When the molar ratio of MSA:water is 1:1,undissociated MSA is observed to be dominant. Meanwhile theSO3
- peak intensity decreases significantly as concentration goesup. The peak at 1126 cm-1 and the shoulder around 1174 cm-1
are assigned to the bending mode of undissociated S-O-Hand the SO2 symmetric stretch respectively, as suggested byprevious studies.22,58 Molecular MSA can easily form hydrogenbonds with water and itself.22 In pure MSA, self-association toform cyclic dimers should prevail, while a 1:1 MSA-watercomplex exists in a 0.5 x MSA solution. However, the Ramanpeak positions and intensities of the S-O-H bend and SO2
symmetric stretch are almost identical for pure and 0.5 x MSAregardless of the fact that they are different species. Thissuggests that the hydrogen bonds formed between MSAmolecules and between MSA and water molecules are similar.
Orientation of MSA molecules at the surface is reasonablydifferent for its molecular and ionized forms. At low concentra-tions (<0.1 x), MSA molecules dissociate almost completelyand the anion has two coaxial C3V groups, the CH3 and SO3
-.Therefore, the molecular orientation can be determined fromthe orientation of either the CH3 or SO3
- groups.The VSFG spectra of 0.1 x aqueous MSA in both C-H
stretch and S-O stretch regions are shown in Figure 8. In theC-H stretch region the sharp peak observed at 2944 cm-1 isfrom the symmetric stretch of the CH3 group. The negativeinterference feature around 3030 cm-1 is the position of theCH3 asymmetric stretch. The apparent peak positions are notthe exact peak positions of the component peaks due tointerference of adjacent resonances. In addition, the broad protoncontinuum intensity is clearly seen to extend down below 2800cm-1. The VSFG intensities in ppp and sps polarizations,however, are nearly undetectable, which is in accordance withprevious reports.33 Therefore, it is not possible to accuratelymeasure the CH3 orientation based on such low spectralintensities. In contrast, the VSFG intensities of the SO3
- groupin both ssp and ppp polarizations can be collected with relativelygood signal-to-noise ratios as shown in Figure 8. A single peakat 1050 cm-1 in the VSFG spectra indicates that the surfacemoiety probed at this concentration is still the SO3
- group eventhough molecular MSA may also exist at the surface.Similarly the Raman depolarization ratio F(SO3
-) is measuredto be 0.039 ( 0.001 from a polarized Raman experiment
(Supporting Information), which then gives the hyperpolariz-ability ratio R(SO3
-) of 2.65 ( 0.05. Therefore, based on themeasured intensity ratio of ssp/ppp and the R(SO3
-) above, theaverage tilt angle of SO3
- group can be determined from eqs2-6 to be 16.0° ( 2.0°, indicating a relatively straight upconformation of MSA, aligned with the surface normal.
Figure 8. VSFG spectra in both C-H stretch (upper graph) and S-Ostretch (lower graph) region of 0.1 x aqueous MSA.
Figure 9. A representative snapshot from the MD simulation of 1 M(0.02 x) MSA in an aqueous slab.
Figure 7. S-O stretch region Raman spectra of a series of MSA-watermixtures. Structure of the dissociated MSA is shown in the graph.
Liquid/Vapor Interface of Solutions of DMSO and MSA J. Phys. Chem. B, Vol. 114, No. 47, 2010 15551

To check the validity of the orientation angle of SO3- group,
one can back out this value with the measured C-H stretchintensities. The tilt angle of CH3 group is the same as the SO3
-
group in dissociated MSA, and as determined here, it is 16°. Inaddition, the Raman depolarization ratio and the hyperpo-larizability ratio of the MSA CH3 group are determined tobe 0.009 ( 0.001 and 1.49 ( 0.03 (Supporting Information). Itis noticeably different between the R value of the CH3 groupsin DMSO and MSA which arises from different molecularstructure and electron density. The deduced VSFG intensity ratioof ssp/ppp from the values above is ∼20 at the 16° tilt angle,which in agreement with the fact that the ppp and sps intensitiesare almost undetectable.
A representative snapshot from the MD simulation result of1 M (0.02 x) MSA solution is shown in Figure 9. MSA isassumed in its deprotonated (anionic) form. The correspondingdensity profiles, demonstrating the surface activity of MSA, areshown in Figure 10. Finally, the orientational profile of MSAis depicted in Figure 11. The orientation angle of MSA (anglebetween the sulfur-carbon axis and the outward surface normal)shows an obvious preference between 0° and 90°, indicatingthat the CH3 group of MSA molecules is pointing outward witha preference to be aligned near to the surface normal. Moreover,the orientation probability increases continuously from 90° toa plateau near 20°. The most probable region occurs below 20°
where the probability value peaks at 5°, which is in accordancewith the straight up conformation deduced from experimentresults despite that the concentrations in experiment andsimulation are slightly different (although both are performedin water-rich solutions).
Conclusions
A comprehensive investigation of the molecular organizationat aqueous DMSO and MSA surfaces has been completed usingVSFG spectroscopy and MD simulations. For DMSO moleculesat the aqueous surface, the orientation has a relatively broaddistribution, but preferentially with the two CH3 groups pointingoutward into the air. On average, the two DMSO CH3 groupsare tilted at the surface, with tilt angles of ∼27° and ∼70°,respectively. The SdO group is hydrated by the aqueous phaseand points only slightly inward to the interior of the solution.MSA molecules completely dissociate into hydrated ions at lowconcentrations (<0.1 x). Deprotonated MSA (methanesulfonateanions) reside at the surface in a relatively straight up conforma-tion with their SO3 vector pointing inward and their CH3 vectorpointing outward, with both moieties oriented ∼16° from thesurface normal in their residing phase, aqueous and gas,respectively.
Acknowledgment. X.C. and H.C.A acknowledge supportfrom the National Science Foundation (NSF-CHE0749807) forthe completion of this work. Support to P.J. from the Academyof Sciences (Praemium Academie), the Czech Ministry ofEducation (grants LC512), and the US-NSF (grant CHE0909227)is gratefully acknowledged.
Supporting Information Available: Description of thepolarization null angle mathematics, Fresnel coefficients, refrac-tive indices used for SFG orientation calculations, and Ramanpolarized spectra for MSA CH3 and SO3
- modes. This materialis available free of charge via the Internet at http://pubs.acs.org.
References and Notes
(1) Ellison, G. B.; Tuck, A. F.; Vaida, V. J. Geophys. Res.sAtmos.1999, 104, 11633–11641.
(2) Debruyn, W. J.; Shorter, J. A.; Davidovits, P.; Worsnop, D. R.;Zahniser, M. S.; Kolb, C. E. J. Geophys. Res.sAtmos. 1994, 99, 16927–16932.
(3) Charlson, R. J.; Lovelock, J. E.; Andreae, M. O.; Warren, S. G.Nature 1987, 326, 655–661.
(4) von Glasow, R.; von Kuhlmann, R.; Lawrence, M. G.; Platt, U.;Crutzen, P. J. Atmos. Chem. Phys. 2004, 4, 2481–2497.
(5) Schwartz, S. E. Nature 1988, 336, 441–445.(6) Wakeham, S. G.; Dacey, J. W. H. ACS Symp. Ser. 1989, 393, 152–
166.(7) Yin, F. D.; Grosjean, D.; Seinfeld, J. H. J. Atmos. Chem. 1990, 11,
309–364.(8) Barone, S. B.; Turnipseed, A. A.; Ravishankara, A. R. Faraday
Discuss. 1995, 100, 39–54.(9) Schweitzer, F.; Magi, L.; Mirabel, P.; George, C. J. Phys. Chem.
A 1998, 102, 593–600.(10) Charlson, R. J.; Schwartz, S. E.; Hales, J. M.; Cess, R. D.; Coakley,
J. A.; Hansen, J. E.; Hofmann, D. J. Science 1992, 255, 423–430.(11) Martin, D.; Weise, A.; Niclas, H. J. Angew. Chem., Int. Ed. 1967,
6, 318–334.(12) Anchordoguy, T. J.; Carpenter, J. F.; Crowe, J. H.; Crowe, L. M.
Biochim. Biophys. Acta 1992, 1104, 117–122.(13) Barry, B. W. Nat. Biotechnol. 2004, 22, 165–167.(14) Lyman, G. H.; Preisler, H. D.; Papahadjopoulos, D. Nature 1976,
262, 360–363.(15) Ahkong, Q. F.; Fisher, D.; Tampion, W.; Lucy, J. A. Nature 1975,
253, 194–195.(16) Rall, W. F.; Fahy, G. M. Nature 1985, 313, 573–575.(17) Gernon, M. D.; Wu, M.; Buszta, T.; Janney, P. Green Chem. 1999,
1, 127–140.
Figure 10. Density profiles of the MSA molecules from the center ofthe slab across the water/vapor interface into the gas phase from theMD simulation.
Figure 11. MD simulation of the orientation angle of 1 M (0.02 x)MSA solution. Orientation angle is defined between the MSA molecularaxis (passing through the sulfur and the carbon of methyl group) andthe surface outward normal.
15552 J. Phys. Chem. B, Vol. 114, No. 47, 2010 Chen et al.
(18) Vaisman, I. I.; Berkowitz, M. L. J. Am. Chem. Soc. 1992, 114,7889–7896.
(19) Soper, A. K.; Luzar, A. J. Chem. Phys. 1992, 97, 1320–1331.(20) Luzar, A.; Chandler, D. J. Chem. Phys. 1993, 98, 8160–8173.(21) Soper, A. K.; Luzar, A. J. Phys. Chem. 1996, 100, 1357–1367.(22) Givan, A.; Loewenschuss, A.; Nielsen, C. J. J. Mol. Struct. 2005,
748, 77–90.(23) Li, S. J.; Qian, W.; Tao, F. M. Chem. Phys. Lett. 2007, 438, 190–
195.(24) Bertagnolli, H.; Schultz, E. Ber. Bunsen-Ges. Phys. Chem. Chem.
Phys. 1989, 93, 88–95.(25) Brink, G.; Falk, M. J. Mol. Struct. 1970, 5, 27–30.(26) Bertoluzza, A.; Bonora, S.; Battaglia, M. A.; Monti, P. J. Raman
Spectrosc. 1979, 8, 231–235.(27) Mizuno, K.; Imafuji, S.; Ochi, T.; Ohta, T.; Maeda, S. J. Phys.
Chem. B 2000, 104, 11001–11005.(28) Catalan, J.; Diaz, C.; Garcia-Blanco, F. J. Org. Chem. 2001, 66,
5846–5852.(29) Kaatze, U.; Brai, M.; Scholle, F. D.; Pottel, R. J. Mol. Liq. 1990,
44, 197–209.(30) Kirchner, B.; Hutter, J. Chem. Phys. Lett. 2002, 364, 497–502.(31) Allen, H. C.; Gragson, D. E.; Richmond, G. L. J. Phys. Chem. B
1999, 103, 660–666.(32) Allen, H. C.; Raymond, E., A.; Richmond, G. L. Curr. Opin. Colloid
Interface Sci. 2000, 5, 74–80.(33) Allen, H. C.; Raymond, E. A.; Richmond, G. L. J. Phys. Chem. A
2001, 105, 1649–1655.(34) Karpovich, D. S.; Ray, D. J. Phys. Chem. B 1998, 102, 649–652.(35) Tarbuck, T. L.; Richmond, G. L. J. Phys. Chem. B 2005, 109,
20868–20877.(36) Benjamin, I. J. Chem. Phys. 1999, 110, 8070–8079.(37) Senapati, S. J. Chem. Phys. 2002, 117, 1812–1816.(38) Darvas, M.; Pojjak, K.; Horvai, G.; Jedlovszky, P. J. Chem. Phys.
2010, 132, 134701.(39) Hommel, E. L.; Allen, H. C. Anal. Sci. 2001, 17, 137–139.(40) Tang, C. Y.; Allen, H. C. J. Phys. Chem. A 2009, 113, 7383–7393.(41) Zhuang, X.; Miranda, P. B.; Kim, D.; Shen, Y. R. Phys. ReV. B
1999, 59, 12632–12640.(42) Hirose, C.; Akamatsu, N.; Domen, K. J. Chem. Phys. 1992, 96,
997–1004.(43) Wang, H. F.; Gan, W.; Lu, R.; Rao, Y.; Wu, B. H. Int. ReV. Phys.
Chem. 2005, 24, 191–256.(44) Simpson, G. J.; Rowlen, K. L. J. Am. Chem. Soc. 1999, 121, 2635–
2636.(45) Long, D. A. The Raman effect: A unified treatment of the theory of
Raman scattering by molecules; John Wiley and Sons: New York, 2002.
(46) Zhang, D.; Gutow, J.; Eisenthal, K. B. J. Phys. Chem. 1994, 98,13729–13734.
(47) Groenzin, H.; Li, I.; Shultz, M. J. J. Chem. Phys. 2008, 128, 214510.(48) Allen, M. P.; Tildesley, D. J. Computer Simulatons of Liquids;
Clarendon: Oxford, UK, 1987.(49) Essmann, U.; Perera, L.; Berkowitz, M. L.; Darden, T.; Lee, H.;
Pedersen, L. G. J. Chem. Phys. 1995, 103, 8577–8593.(50) Ryckaert, J. P.; Ciccotti, G.; Berendsen, H. J. C. J. Comput. Phys.
1977, 23, 327–341.(51) Caldwell, J. W.; Kollman, P. A. J. Phys. Chem. 1995, 99, 6208–
6219.(52) Wang, J. M.; Wolf, R. M.; Caldwell, J. W.; Kollman, P. A.; Case,
D. A. J. Comput. Chem. 2004, 25, 1157–1174.(53) Frisch, M. J.; Trucks, G. W.; Schlegel, H. B.; Scuseria, G. E.; Robb,
M. A.; Cheeseman, J. R.; Montgomery, J. J. A.; Vreven, T.; Kudin, K. N.;Burant, J. C.; Millam, J. M.; Iyengar, S. S.; Tomasi, J.; Barone, V.;Mennucci, B.; Cossi, M.; Scalmani, G.; Rega, N.; Petersson, G. A.;Nakatsuji, H.; Hada, M.; Ehara, M.; Toyota, K.; Fukuda, R.; Hasegawa, J.;Ishida, M.; Nakajima, T.; Honda, Y.; Kitao, O.; Nakai, H.; Klene, M.; Li,X.; Knox, J. E.; Hratchian, H. P.; Cross, J. B.; Bakken, V.; Adamo, C.;Jaramillo, J.; Gomperts, R.; Stratmann, R. E.; Yazyev, O.; Austin, A. J.;Cammi, R.; Pomelli, C.; Ochterski, J. W.; Ayala, P. Y.; Morokuma, K.;Voth, G. A.; Salvador, P.; Dannenberg, J. J.; Zakrzewski, V. G.; Dapprich,S.; Daniels, A. D.; Strain, M. C.; Farkas, O.; Malick, D. K.; Rabuck, A. D.;Raghavachari, K.; Foresman, J. B.; Ortiz, J. V.; Cui, Q.; Baboul, A. G.;Clifford, S.; Cioslowski, J.; Stefanov, B. B.; Liu, G.; Liashenko, A.; Piskorz,P.; Komaromi, I.; Martin, R. L.; Fox, D. J.; Keith, T.; Al-Laham, M. A.;Peng, C. Y.; Nanayakkara, A.; Challacombe, M.; Gill, P. M. W.; Johnson,B.; Chen, W.; Wong, M. W.; Gonzalez, C.; Pople, J. A. Gaussian 03;Gaussian, Inc.:Wallingford, CT, 2004.
(54) Case, D. A.; Darden, T. A.; Cheatham, I., T. E.; Simmerling, C. L.;Wang, J.; Duke, R. E.; Luo, R.; Merz, K. M.; Wang, B.; Pearlman, D. A.;Crowley, M.; Brozell, S.; Tsui, V.; Gohlke, H.; Mongan, J.; Hornak, V.;Cui, G.; Beroza, P.; Schafmeister, C.; Caldwell, J. W.; Ross, W. S.; Kollman,P. A. AMBER 8; University of California: San Francisco, 2004.
(55) Forel, M. T.; Tranquil, M. Spectrochim. Acta Part A: Mol.Spectrosc. 1970, A 26, 1023–1034.
(56) Chen, H.; Gan, W.; Wu, B.-h.; Wu, D.; Zhang, Z.; Wang, H.-f.Chem. Phys. Lett. 2005, 408, 284–289.
(57) Rao, Y.; Comstock, M.; Eisenthal, K. B. J. Phys. Chem. B 2006,110, 1727–1732.
(58) Covington, A. K.; Thompson, R. J. Solution Chem. 1974, 3,603–617.
JP1078339
Liquid/Vapor Interface of Solutions of DMSO and MSA J. Phys. Chem. B, Vol. 114, No. 47, 2010 15553