interest rates and commercial bank profitability in kenya
TRANSCRIPT
i
INTEREST RATES AND COMMERCIAL BANK PROFITABILITY IN KENYA.
BY
MUGABI SIMON PETER
D61/64055/2013
A RESEARCH PROJECT SUBMITTED IN PARTIAL FULFILMENT OF THE
REQUIREMENT OF THE AWARD OF THE DEGREE OF
MASTER OF BUSINESS ADMINISTRATION OF THE UNIVERSITY OF NAIROBI
NOVEMBER, 2017

ii
DECLARATION
This research project is my original work and has not been presented to any other institution or
university.
Sign_________________ Date _______________
Simon Peter Mugabi
D61/64055/2013
This research project has been submitted for examination with our approval as the university
supervisor.
Sign_________________ Date _______________
Dr. Lishenga Josephat
Department of Accounting and Finance,
School of Business,
University of Nairobi

iii
ACKNOWLEDGEMENTS
I thank God for granting me the wisdom and courage to successfully complete this work. My
special thanks go to my supervisor, Mr. Dr. Josephat Lishenga, for his effort, support, great advice
and guidance that has enabled me to shape this research project to the product it is now.
I wish to thank my family for the support and valuable time they offered to me in this project.
Finally, I owe gratitude to a number of who in one way contributed towards my completion of this
project especially my fellow colleagues at work and school.

iv
DEDICATION
This project is dedicated to my family especially my mother Irene Kato for the love, patience,
support and faith she has had in me throughout the entire study period. I also dedicate this work to
my brother Moses, to Elizabeth Ajema and to everyone else who in one way or another has helped
guide me to this level in my education. I will always appreciate all they have done.
v
ABSTRACT
The main purpose of the research was to investigate the effect of interest rates on commercial
banks profitability and performance in Kenya. Recent movements in interest rates, inflation and
exchange rates present real dangers to economic stability. Between 2011 and 2015, commercial
banks in Kenya continued to report increases in profit and incidentally, this coincided with the
increase interest rates. The study that was done was descriptive in nature and was based on
historical data from commercial bank annual financial reports, central bank reports and
information provided on the Kenya bankers association website. The research was done using
statistical methods and testing techniques like correlation and regression analysis. The finds were
that indeed interest rates had a positive correlation with bank performance in Kenya. Basically all
other factors remaining constant, the higher the interest rates, the better the financial performance
of commercial banks.

vi
TABLE OF CONTENTS
DECLARATION………………………………………………………………………ii
ACKNOWLEDGEMENTS…………………………………………………..………iii
DEDICATION…………………………………………………………………….…..iv
ABSTRACT……………………………………………………………………………v
LIST OF TABLES……………………………………………………………………x
LIST OF FIGURES & GRAPHS……………………………………………………xi
LIST OF ABBREVIATIONS……………………………………………………….xii
CHAPTER ONE……………………………………………………………………….1
Introduction…………………………………………………………………………......1
1.1 Background of the study…………………………………………………………….1
1.1.1 Market interest rates…………………………………………………………......1
1.1.2 Commercial bank profitability…………………………………………………...2
1.1.3 Relationship between interest rates and profitability…………………………….3
1.1.4 The banking sector in Kenya…………………………………………………….4
1.2 Research problem………………………………...…………………………………4
1.3 Objective of the research…………………………………………………………….4
1.4 Value of the study……………………………………………………………………5
CHAPTER TWO………………………………………………………………………6
2.1 Introduction…………………………………………………………………………6
2.2 Theoretic review……………………………………………………………………..6
2.2.1 Expectations theory……………………………………………………………….6
vii
2.2.2 Liquidity premium theory…………………………………………………………7
2.2.3 Irving fisher’s theory of interest…………………………………………………..8
2.2.4 Liquidity preference theory………………………………………………………..9
2.2.5 Loanable funds theory……………………………………………………………..10
2.3 Determinants of commercial bank profitability………………………….………….11
2.4 Empirical evidence…………………………………………………………………..13
2.4.1 International evidence……………………………………………………….…….13
2.4.2 Local evidence…………………………………………………………………..…14
2.5 Conceptual framework……………………………………………………………….15
2.6 Summary of literature review………………………………………………………..16
CHAPTER THREE…………………………………………………………………....17
3.1 Introduction………………………………………………………………………....17
3.2 Research design……………………………………………………………………...17
3.3 Target population…………………………………………………………………....17
3.4 Data collection………………………………………………………………………18
3.5 Data analysis………………………………………………………………………...18
3.5.1 Analytical model………………………………………………………………….18
3.5.2 Test of significance………………………………………………………………..19
viii
CHAPTER FOUR……………………………………………………………………..20
4.1 Introduction…………………………………………………………………..…...20
4.2 Descriptive statistics……………………………………………………………...20
4.2 Inferential statistics……………………………………………………………….24
4.3.1 Correlation Analysis…………………………………………………………….24
4.3.2 Regression Analysis…………………………………………………………….26
4.3.3 Analysis of Variance…………………………………………………………....27
4.4 Interpretation of Findings…………………………………………………………27
CHAPTER FIVE…………………………………………………………………….29
5.1 Introduction……………………………………………………………………….29
5.2 Summary………………………………………………………………………….29
5.3 Conclusion…………………………………………………………………………29
5.4 Policy Recommendation………………………………………………………….30
5.5 Limitations of the study…………………………………………………………..31
5.6 Suggestions for further Research………………………………………………....31
REFERRENCES…………………………………………………………………….33
APPENDICES……………………………………………………………………….36
Appendix I: List of 16 Commercial Banks in Kenya in the study…………................36

ix
Appendix II: Commercial Banks ROA for Year 2010 To 2015 ...................................37
Appendix II1: Raw data for year 2015 .......................................................................... 38

x
LIST OF TABLES
Table 4.1: Summary of Descriptive Statistics .................................................................. 20
Table 4.2: Correlation Matrix ........................................................................................... 25
Table 4.3: Correlation Statistics ........................................................................................ 25
Table 4.4: Regression Analysis ......................................................................................... 26
Table4.5: ANOVA ............................................................................................................ 27

xi
LIST OF FIGURES & GRAPHS
Graph 4.1: Trend Analysis of Commercial Bank lending interest rates movement ......... 21
Figure 4.1.1 Average return on Assets Years 2010 to 2015……………………………...22
Figure 4.1.2 Comparative Commercial Banks Profitability Year 2010-2015 ROA ..........22
Graph 4.2: Trend Analysis of Commercial Bank Performance ........................................ 30

xii
LIST OF ABBREVIATIONS
ANOVA - Analysis of Variation
CBK – Central Bank of Kenya
HHI – Herfindhal-Hirschman Index
KBA – Kenya Bankers Association
NPLR – Non Performing Loan Ratio
NSE – Nairobi Securities Exchange
ROA – Return on Assets
ROE – Return on Equity
SPSS - Statistical Package for Social Sciences
1
CHAPTER ONE
INTRODUCTION
1.1 background of the study
From an economic point of view, interest maybe looked at as either the compensation received for
deferring consumption, for example money put in a savings account instead of spending it, or the
expense related to consuming when resources are not available, like making a purchase using a
credit card instead of saving the money first (Bean, 2017). Bean continues to explain that at any
given time, anyone who has money, has two main choices. One is to spend that money immediately
and the other is to save for later use.
A decision to either save or spend immediately is usually a complex one and it in many cases
requires incentive. In order for a person to defer expenditure and choose to save, there must be
some gain from it. In the same spirit a person who needs money but doesn’t have also needs some
incentive to borrow that money. With the former, high compensation is more attractive while for
the later a lower compensation rate is definitely preferred.
There is a monetary amount charged on a borrower for the consumption of another individual’s
funds and it’s called interest. The lender receives it when they lend out funds and the borrower
pays it when they borrow money. When the borrower repays the borrowed funds, they have to
return the principal value of funds borrowed and an amount of additional funds as interest that has
accrued on the principle borrowed over and beyond the principal. It is imperative to note, that
when someone foregoes their right spend their money, a reward is received and serves as
compensation and it is called interest. Without that extra consideration, investors would perhaps
have no good reason to forego their expenditure currently and instead do it in the future. Abdul
(2014)
1.1.1 market interest rates.
The banking sector in Kenya, has a very important position in the sector of finance, especially
when it comes to the service of deposit taking and collection and providing funds for borrowers.
2
Analyzing the bank spreads of rates of interest is thereby at the center of understanding the process
of finance intermediation and the macroeconomic environment in which operations of banks take
place. Were & Wambua (2014)
CBK records show that in 2010, interest rates were between a high of 14.98% and a low of 13.85%.
In 2011, there was a sharp rise to between a high of 20.04% and a low of 13.88. In 2012, the rates
were between 20.34% and 17.78% indicating an increase in the lowest rates offered between 2011
and 2012 of 3.9%. In 2013, rates were at their highest in January at 18.13% and lowest in
September at 16.86%. According to CBK records, the average interest rate for lending in Kenya
has been 16.5% for the period between January 2010 and December 2015. During this same period,
the lending rate oscillated between a low of 13.85% to a high of 20.34%.
1.1.2 commercial banks profitability.
Costs associated with transactions from agent to agent and information failure lead to rise of
intermediation in finance. The intermediaries assist in solving the challenges created from
transaction related costs and information asymmetry. They make diversification, deposit
mobilization, allocation of resources and risks associated with borrowing and lending of money
smooth. Ngugi (2001). Ngugi goes on to explain that the receipts of deposits and loans do not
come in at equal levels, therefore go-betweens for example commercial banks have expenses to
deal with. A charge is then levied for the mediation extended without certainty, and the levels of
interest for deposits received and credit extended are set.
The difference in charge between what a borrower pays to access funds that they do not have and
what the banks pay to the customer/investor, whose funds have been lent out is the commission
that goes to the bank in form of earnings. This is one of the biggest components to a commercial
bank’s earnings in any given financial year. Fry (1995) suggests that when there are no fully
fledged and developed financial markets, bonds or even equity markets, the amount of risk
absorbed by banks simply is too much because investment will depend quite heavily on financing
through debt. This goes on to explain why there is a lot of demand for borrowed funds from bank
to finance business, development activities by individuals, businesses and government through
treasury bills.
3
There are various ways to measure this profitability and according to European central bank
publication of 2010, the most common ones are: -
The return on assets (RoA) which is the ratio of the net income for the year to the assets in total.
Usually this is the average value throughout the entire year. This format of measuring profitability
enables a company to know how to employ the assets at its disposal in order to generate maximum
profits. This method measures and shows just how profitable those assets that belong to the
company are.
Return on Equity (RoE) measures internal performance of shareholder value, it seeks to find out
the capacity of a company to generate profits from the investments of shareholders in the company
and it is a very popular measure of performance.ROE seeks to ascertain the actual return gained
from what an investor puts in the company; it is readily usable for analytical purposes, only
dependent on information that is available publicly; and it is also instrumental when carrying out
company to company or sector to sector comparisons.
1.1.3 the relationship between market interest rates and commercial bank profitability.
Among all factors that can have a great impact on a financial institution’s return on its stock and
profits made, rate of interest is the most significant. Income earned from interest is a great source
of money for financial institutions. Cai & Wang, (2006). Cai & Wang (2006) continue to explain
that commercial banks are continually exposed to interest rate risk. it therefore goes without saying
that interest rate changes affect a bank’s profitably essentially thruogh increase in the cost of
funding, also by reduction in the returns on assets and lowering the value of the bank’s equity.
According to Ci and Wang (2006), changes in the net income and net interest income plus notional
amounts of interest rate derivatives are viewed as what the interest rate risk of a bank is conditioned
to. They serve to highlight the sensitivity of the performance of the bank to risk associated with
interest rates.
Amit & Chowdhry (2010) assert that the profit of a bank emanates from the difference between
the interest paid for the deposit and interest rate it charges by lending. Therefore, if bank is not
lending then there is no likelihood that any profits will be realized from the deposits. As a result,
high lending rates can have far reaching implications for financial intermediation as they can lead
4
to a high cost of capital and thereby limiting financial resources availability to would-be borrowers
becomes limited hence reduction in the volume of investment opportunities to sub optimal level.
also a wider spread might reflect a number of problems such as bank moral hazard and
unsoundness.
1.1.4 the banking sector in Kenya
According to the CBK website, The Central Bank of Kenya is a public institution established under
Article 231 of the Constitution of Kenya, 2010. The Bank is charged with the responsibility of
monetary policy formulation to bring about and keep price stability and issuing currency. Pursuant
to the CBK Act, the Central Bank promotes financial stability through regulation, supervision and
licensing of all financial institutions under its mandate.
As of august 2017, there are 42 licensed commercial banks in the Kenyan market. Of these, 15
banks are foreign owned (foreign shareholding of more than 50%), 3 are publicly owned and 24
are locally privately owned.
1.2 Research problem
A high volatility in the world economy has been witnesses mainly because of Significant
liberalization and integration of financial markets worldwide. Many policy makers and economists
are interested in the impact of market rate fluctuations on bank profitability. Armed with this
knowledge, the trade-off that comes from rate of interest stability and other policies will be easily
evaluated. Dahlia & Dianna (2012)
Work has been done on the effect/impact of market interest rates on profitability of commercial
banks in developed countries however only limited work has been done on the same in the
developing countries especially in sub-Saharan Africa.
1.2 Research objectives.
One of the major objectives will be to determine if there is a relationship between market interest
rates and commercial bank profitability.

5
One of the objectives of the project will also be to determine the effect if any of market interest
rates on the profitability of commercial banks whether negative or positive.
1.4 value of the study
This study will be instrumental in identifying the negative attributes of bank profitability being
mainly dependent on lending. After identifying these negative attributes, remedies can be
formulated to combat the negative attributes. Also, this study will help to progress the discussion
about alternative business channels through which bank can increase their profitability without
necessarily relying on credit to borrowers and whether there will be difficulties in repayment or
not.
This study is also important because it will lead to formulation of policies by bank governing
bodies in Kenya i.e. (KBA & CBK) that will help curb the constant oscillation of market interest
rates which can cause uncertainty for both borrowers and lenders which can also derail the course
of project development that is being financed through borrowing.
6
CHAPTER TWO
LITERETURE REVIEW
In this part, we are going to look at some of the work done by different scholars about market
interest rates and performance of commercial banks. We shall look at different theories which have
been advanced by the same scholars on the same topic as well.
2.1 introduction.
Many researchers have come to the conclusion that the relationship which exists between returns
on stock and the fluctuations in the rates of interest is largely negative in nature and others have
come to the conclusion that in fact there exists no relationship between these two variables that is
worth noting.
Spread that is small is usually associated with the operations of risk averse financial institutions
compared to those which are risk neutral. This is because the rate of interest of a bank that is risk
averse is higher and this significantly undermines the level of credit given out. The actual spread
is an incorporation of the pure spread, and this is influenced by macroeconomic variables like
fiscal policy activities. Emmanuelle (2003).
2.2 theoretic review
2.2.1 expectations theory.
This theory proposes that yields coming from financial assets, each with its own maturity, have a
relationship underscored by the expectations of the market in regard to yields of the future. This
theory has a big place theoretically and policy wise at several times during debates. Tease (1986).
The expectations hypothesis asserts that except for a risk premium, bonds which have independent
maturities ought to have the same holding period of return. Combined with the rational
expectations hypothesis, this hypothesis has several important implications for the relationships
between bond oscillation with time and yields. Specifically, the hypothesis states that the expected
n-period return on an investment in a series of one-period bonds should be equal to the (certain)
n-period return on an n-period bond. This means that an average of the expected short yield over

7
the following n periods, plus a constant risk premium should be the n-period long yield. Bulkley,
Harris & Nawosa (2008).
According to Tease (1986), accordingly, if one is looking at the expected return coming from a
y-period bond investment, it should equate to that return expected to result from an investment in
a one period bond throughout y-successive periods. Therefore, after linearization, the rate of
interest over the long term can be expressed as the expected and current short-term rates’
weighted average. Bearing in mind that we are dealing with two periods, linear relation can be
used to come to an approximation of the rate of interest on a bond that no default but has pure
discount.
2.2.2 liquidity premium theory
This theory proposes that the rate of interest associated with a bond of long term is equivalent to
the average of the rates of interest in a short period throughout the duration of the long term bond.
This will complement a premium of liquidity that is responsive to that bond’s conditions of supply
and demand. Mishkin (2009)
The liquidity premium and the solidarity premium are aspects of the interest rates term structure
as related to interest rate expectations under uncertainty. The liquidity premium comes from the
diversion between forward short-term rate of interest, implicit in the current term structure of rates
in the short and long term, and the future short term interest rate that one expects. Woodward
(1980). Woodward goes on to explain that the liquidity premium and the solidarity premium are
both determined by the interaction of interest rates and incomes at earlier and later dates.
Assumption is that rates that are long term in nature are essentially in communion with terms that
are short in nature and based on this, one can expect that rates of interest that are for different
maturities will move together. The volatility of rates that are long term in nature is also likely to
be diminished owing to the assumption that part of the long term rate is but the average of rates
that are short term nature. This will make rates that are short term in nature that much less
volatile. Lastly, the theory assets that the yield curve is upward sloping and only rarely does it
slope downwards or remain flat because with increase in time to maturity comes a rise in the
premium of risk.

8
Under normal circumstances, investors will have preference or bonds that are short in nature as
they bear less risk in regards to interest rate. Therefore, investors have to be rewarded with a
positive liquidity premium so as to convince them to put money in bonds that are longer term in
nature. Mishkin (2009)
2.2.3 Irving fisher’s theory of interest.
According to Professor Fisher, theory of interest is an enlargement and synthesis of already
existing partial theories, and is based on investment opportunity, human impatience and market
exchange (buying and selling). While discussing the interest rate theory, Irving fisher looks at the
aspect of human impatience and time preference. About this, fisher states that This is that extra
desire for an extra unit of current goods presently over that marginal desire for an extra unit of
goods in the future. This explains the level time preference or the degree of impatience shown
for goods that are currently available over goods that will be available in the future of the same
composition can be easily gotten from that extra want exhibited for goods at preset and in the
future respectively.
Fisher’s theory of interest explains that it is indeed true that present cash flows, property and goods
are preferred to future cash flows, property and goods. Generally, there is a preference for present
enjoyment of income to deferred/future income enjoyment. Fisher further states that What a lender
gets after giving out a loan isn’t payment rather a promise for payments to be made, and since
there is no certainty about the future, requirement is that there be assurance that these payments
will in fact be made. In the market, any person may give out part of their income to someone else
provided they will receive it back during a certain period with a top up over and above their own
income during some other period of time.
Irving Fisher brings the nominal interest rate i and the "real" interest rate r and the rate of inflation
π into relation. After adjustment for inflation, interest rate r is the Real interest rate. For lenders to
be convinced to lend out money, this is the interest rate which must be offered to them. The Fisher
effect asserts that the real rate of interest is the contrast between the expected inflation rate and the
nominal rate of interest. Therefore, real interest rates reduce as inflation rises, unless nominal rates
rise at the same inflation rate.

9
It however is imperative to note that the fisher theory has limitations as mentioned below by some
scholars. The Fisher Effect does not hold for private debt. Theoretically, the interest rate on private
debt is shown to increase with inflation, but less than the “one-for-one” relationship predicted by
Fisher. Boyd & Jalal (2012)
2.2.4 liquidity preference theory
A famous English economist called john Maynard Keynes attempted to explain the considerations
that go on in any person’s mind when they are in the process of deciding whether to spend their
money immediately or defer that expenditure to the future. He proposed the “liquidity preference
theory”
This theory seems to suggest that investors will demand higher premiums or interest rates, on long-
term maturity securities, that carry more risk, since all other factors remaining constant, investors
would rather have other holdings that are extremely liquid or cash. Liquid Investments are better
when it comes to selling quickly and getting full value. Accordingly, this theory suggests that,
short-term securities have lower rates of interest due to investors sacrificing less liquidity
compared to when they invest in long term or medium term securities.
Therefore, the rate of interest at any time, is the compensation for foregoing liquidity and also a
measure of how unwilling people who possess money are to part with the liquid control over that
money. The interest rate isn’t the 'price' which puts into equilibrium the readiness to refrain from
present consumption and the demand for resources to invest. Keynes (1936)
According to Keynes, the guiding principles for liquidity preference are the transactions-motive
for example Liquid money is needed for carrying out transactions which are business or even
personal in nature presently, as a consideration for safety for example when it comes to dealing
with security in terms of future value of money as a portion of total resources. the speculative
motive for example with the aim of making profits because of having knowledge about the future
better than the market.

10
2.2.5 loanable funds theory
The loanable funds theory has been put forward as the long run theory of rate of interest
determination and is most applicable for explaining long term rates of interest. This theory gives
an attempt at trying to identify the approximate causes of the rate of interest variations by analyzing
the demand for and supply of credit. The theory comes from the belief that those who save decide
between consumption in the future or now. Accordingly, in this theory, the interest rate is
determined at that point at which it equates the demand for them of securities their supply them,
otherwise stated differently, the factors determining the rate of interest are real saving and real
investment demand. Froyen (1996)
According to Evans (1999) Borrowers include businesses of all kinds (trade credit, farm credit,
corporate borrowing etc.), consumer borrowers (auto loans, installment credit, home mortgages,
credit cards etc.), and governments can use credit for all manner of reasons. Much of the borrowing
which takes place in the economy of the United States gets financed by selling interest bearing
financial assets e.g. corporate bonds. In otherwise put, the demand for credit is in effect when for
example a company borrows funds through the selling corporate bonds.
Evans goes on to explain that when a government of a state is financing a capital intensive project,
such as building of a school, by selling of municipal bonds, this is also an example of demand for
credit. Also, when the Government of the United States runs a deficit of the budget and finances
it by selling Notes, U.S. Treasury Bills, or Bonds, this also counts as credit demand for credit. In
brief, credit demand consists of two components, one being selling of all classes of assets that bear
interest as a means of raising money and the other being the direct credit demand by way of
applying for loans.
The category, which includes all classes of notes, bonds, and bills, doesn’t include selling of equity
or (stocks) by a corporation in order to raise money. Selling of stock by corporations technically
is the sale of some portion of ownership corporations. The buyers of this stock are not extending
a loan or making credit - the buyers of this stock are buying some portion of the corporation.
The Loanable Funds Model is a comparative statics equilibrium model which uses demand and
supply curves to get a location of an equilibrium price market-clearing. This special price in the
model is the credit cost - the interest rate which is represented by the variable r. the quantity axis
of the loanable funds model is labeled with the variable volume, v.

11
2.3 Determinants of commercial bank profitability.
Some of the other aspects other than market interest rates that could affect the profitability of a
commercial bank may include the following.
The size of a bank can be measured as the log of total bank’s assets. With that in mind, it would
be expected that larger banks would offer lower rates of interest because they enjoy bigger
economies of scale Were & Wambua (2014). This can also be explained in the sense that
generally, larger banks in the Kenyan market like Equity bank, KCB and CO-OP bank have better
access to funds from customers and investors alike and so they are capable of lending to a larger
percentage of borrowers and still keep making big profits even with reduced interest rates unlike
smaller banks like jamii bora and trans-national bank.
Operating costs have also been advanced as having a major effect ton commercial bank
profitability. Usually, they are computed and presented as a ratio in comparison to the total of the
net operating income. The process of financial intermediation subjects banks to expenses for
example screening loan applications in a bid to get to know the risk profile of people who want to
borrow money and also inspection of the work being done with the funds advanced. Were &
Wambua (2014). Simply put, the higher the operating costs involved with provision of credit to
borrowers, the higher the interest rate is likely to be. The reverse is also likely to apply.
Were & Wambua, also propose Market concentration as a determinant of market interest rates.
They continue to explain that Herfindahl-Hirschman Index is the commonly used measure of
market concentration. HHI usually is calculated based on where advances and loans are
concentrated. Market concentration can establish the degree of the level of competitiveness in the
market faced by each bank.
Loosely explained, higher competition between banks is likely to lead to more efficient and
effective mechanisms of loan pricing so that they can retain a certain level of competitiveness in
the market place. On the other hand, however, in case a bank finds out the it has negligible
competition they may decide to take advantage and raise the interest rates.
Simply put, risk associated with credit is the likelihood of a person who has been advanced funds
to fail to repay the loan advanced as per agreed terms. Non-performing loans to total loans ratio
(NPLR) is used to calculate the risk associated with credit or loan quality. When there is a high

12
loan loss provision, it means that the expense associated with writing off bad debts is high Were
& Wambua (2014.) Ideally if the credit risk is high, it means that banks will have a great provision
for bad debt and also this means that in order for the banks to justify lending under such
circumstances, they will demand higher compensation thus an increase in interest rates.
Liquidity risk is the comparison between the liquid assets of the bank and the assets in total.
(LQDR). The severity of exposure to this kind of risk different for each bank. A financial
institution which has a high liquidity level, faces a low level of liquidity risk and therefore is
capable of having reduced spreads because a low premium on liquidity is charged on loans. Were
& Wambua (2014). Banks which have heightened risk are usual borrowers of funds for emergency
at inflated rates and therefore are associated with much higher spreads. Ahokpossi (2013).
Macroeconomic conditions affect the banking sector performance. This in turn affects repayment
of money that has been borrowed. The demand for credit and the unpredictability of returns out of
investments and collateral quality dictate the kind of premium that will be incurred by the
borrower. This therefore shows the value that has been attached by the investors to the funds that
have been borrowed. A macroeconomic environment that is unstable coupled with reduced growth
economically, causes investors to be uncertain about the return on investment and this raises the
rates of lending leading to an increase in the level of nonperforming loans. This completely
undermines the margin of the bank. For instance, reduced prices of output do decrease profits of a
firm and on the other hand decreased prices of assets undermine the asset value of collateral
reduces the chances of the borrower being able to access funds. The outcome is that there is a
reduction in investment return, financial intermediaries the charge high-risk premiums to cover
their default risk and this drives up the number of loans that are either in default or are not being
paid regularly. Ngugi (2001)
13
2.4 empirical evidence
2.4.1 international evidence
According to the European parliament policy document “monetary dialogue 2016”, the impact of
low interest rates on bank profits is a priori ambiguous. It depends on the business model of the
bank, the strength of the competition and the general economic environment. Most of the more
recent empirical studies tend to find a positive relationship between interest rates (or the yield
curve) and bank profits.
The document goes on to explain that the interest margins of banks have somewhat declined, but
it is difficult to say whether this was due to lower rates. Bank profitability does not seem to have
been adversely affected in those countries that adopted negative rates before the European Central
Bank followed suit (Switzerland, Denmark and Sweden). Low/negative interest rates might be
associated with low bank profitability because the same factors that induce central banks to push
their policy rates negative, namely a weak economy, are typically present when the economy is
weak. This overall weakness of the economy then leads to lower credit demand and also to lower
bank profits. The banks in countries with negative rates, but stronger growth (like Denmark and
Sweden, mentioned above) might thus continue to make profits in spite of negative rates. The
presumption that ultra-low interest rates have a negative impact on bank profitability has arisen
most strongly in the context of negative (short-term) rates. The very short-term rates in the money
market are a direct consequence of the negative deposit rate adopted by the European Central Bank
(ECB).
Demirguc-Kunt and Huizinga (1999) find that high real rates of interest are associated with
increased net profitability and interest margins, mainly in developing countries.
While studying the determinants of interest rate spread on the Mauritian banking sector, Ramful
(2001) came to the conclusion that indeed interest rates do affect profitability of commercial banks
and that they also play the role of generating finances for the operations of banks and also cover
risks associated with loans that have been given out.
While studying the impact of a low interest rate environment on bank profitability, Podjasek &
Genay (2014) stated that their analysis suggests that low short-term interest rates and a flat yield
curve can compress bank earnings.
14
2.4.2 local evidence
Wambari & Mwangi (2017), in their study of the effects of rates of interest and financial
performance of Kenyan financial institutions came to the conclusion that the ratio of lending rate
influences the financial performance of Kenyan commercial banks positively. Deposit interest
ratios however, affect performance of Kenyan commercial banks negatively. Management of
liquidity influences performance. The study came to the conclusion that there is a significant
positive relationship between financial performance of commercial banks and the ratio of the
lending rate. They also concluded that the ratio of interest charged on deposits affects bank
performance negatively.
In their study of the effect of macroeconomic variables on financial profitability of listed
commercial banks in the Nairobi Securities Exchange (NSE) for years 2001 to 2012. Simiyu and
Ngile (2015) employed Panel data analysis using Fixed Effects model. This was applied on the
data to examine the effects of three major macroeconomic variables which included: (GDP),
Exchange rates, and interest rates on profitability of the listed commercial banks. The study found
that real GDP growth rate had positive but insignificant effect to profitability of commercial banks
as measured through ROA. Further, real interest rates had a significant negative influence on
profitability of listed commercial banks in Kenya. While the exchange rate had a positive
significant effect on the profitability of listed commercial banks on Nairobi
Securities Exchange.
While studying the effect of the capping of interest rates shareholding of banks that are listed on
the NSE, Mbua (2017) found that Analysis of the importance of bank interest rates as a factor to
consider when making the decision to invest in bank shares showed that an increase in lending
rates led to an increase in share prices while a decrease in the lending rates led to a decrease in the
share prices. For most banks in the year 2016, there was a sharp decline in the share prices when
lending rates were lowered. Some Banks’s share prices lost almost half their values while the
majority had more than 11% decline in the share price. An analysis on the attractiveness of the
bank share prices after the capping of interest rates in September 2016 showed that a decrease in
the lending rates led to many investors selling the bank shares in their portfolios and probably
opting for other investment alternatives. This is because lower interest rates are associated with
lower potential returns to investments. Investors therefore limit their investments which
investments are used by banks to advance loans from which profit is made.
15
Langat (2013) while studying the effect of interest rates spread on the performance of banking
industry in Kenya found that interest rates spread, to a large extent, affect the performance of
commercial banks in Kenya. The major factors that influenced the extent of interest rates spread
and eventually banks’ performance were Central Bank’s regulations and macro-economic
variables (inflation, exchange rates, credit risk and competition). The study also concludes that
credit risk have an impact on interest rates spread and in the long run the commercial bank’s
performance in the banking industry.
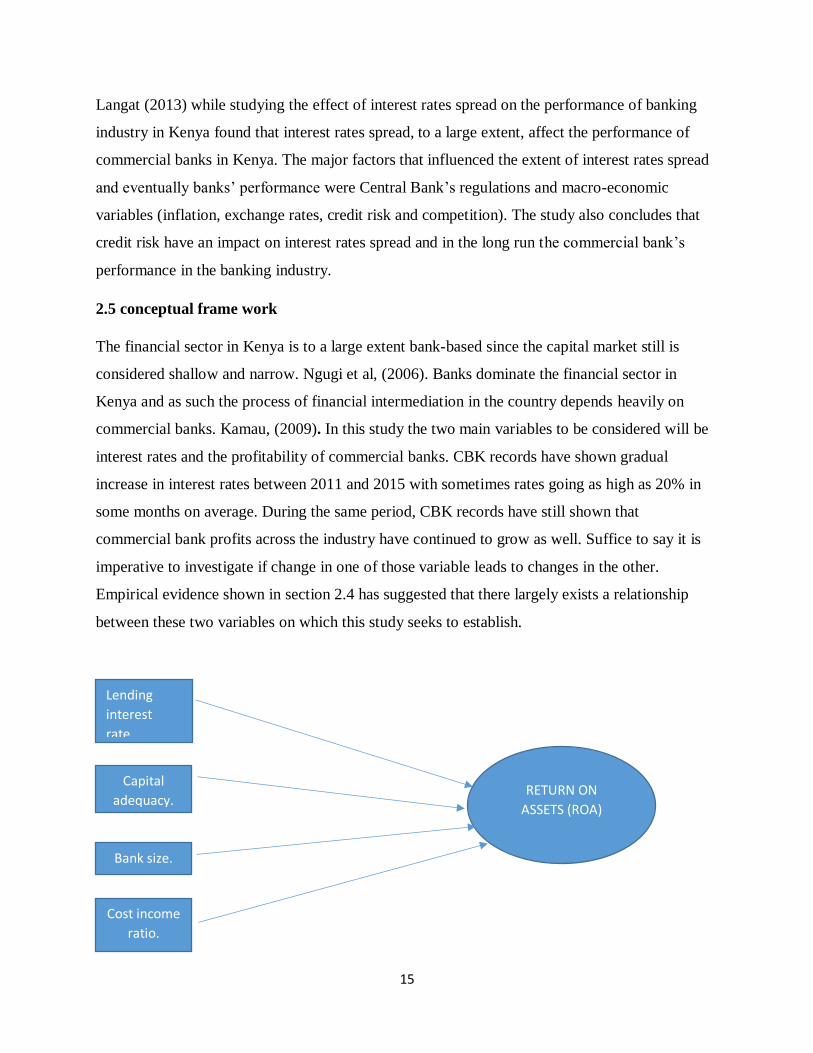
2.5 conceptual frame work
The financial sector in Kenya is to a large extent bank-based since the capital market still is
considered shallow and narrow. Ngugi et al, (2006). Banks dominate the financial sector in
Kenya and as such the process of financial intermediation in the country depends heavily on
commercial banks. Kamau, (2009). In this study the two main variables to be considered will be
interest rates and the profitability of commercial banks. CBK records have shown gradual
increase in interest rates between 2011 and 2015 with sometimes rates going as high as 20% in
some months on average. During the same period, CBK records have still shown that
commercial bank profits across the industry have continued to grow as well. Suffice to say it is
imperative to investigate if change in one of those variable leads to changes in the other.
Empirical evidence shown in section 2.4 has suggested that there largely exists a relationship
between these two variables on which this study seeks to establish.
Lending
interest
rate.
Capital
adequacy.
Bank size.
Cost income
ratio.
RETURN ON
ASSETS (ROA)

16
2.6 summary of literature review
It is clear that a clear amount of work has been done on similar topics like this by different
researchers both locally and internationally. In most of the conclusions, there seems to be a general
agreement that indeed interest rates do affect the profitability in the financial sector albeit on
different levels and at different rates. Many note that other factor such as bank size and
macroeconomic factors affect financial sector performance. It however is important to find out just
how much the interest rates affect profitability of commercial banks in Kenya because so much of
the business done in Kenya is to a large extent dependent on loans. This also means that general
development undertaken by businesses and governments as well is dependent on debt and so in it
very important to know how interest rates affect lenders’ profitability and by extension access to
funds for borrowing for would be developers/borrowers.

17
CHAPTER THREE
RESEARCH METHODOLOGY
3.1 introduction
This chapter describes the research methodology that was used to meet the objectives of the study.
It also describes the different inputs and the preparation that went into completing the project.
Further; the chapter describes the study design, the targeted population, collection methods for the
data and subsequent data analysis in order to produce the desired information for the research
project.
3.2 research design
The design of the research design was descriptive in nature. Descriptive design according to Polit
and Beck (2003), is described as a study that has as its main objective, the portrayal of the
characteristics of situations or the frequency with which certain phenomena occur accurately. This
method was used because it addresses the objective of the study in investigating the relationship
between the variables of the study. The design took into consideration aspects like the sample size
in relation to the population targeted, the variables under the study, the approach to the research,
and the methods that were employed in collection of data.
3.3 target population
Ngechu (2004), claims that a population is a clearly defined group of persons, elements, services,
events or household that were investigated. The intended population of the study was some of the
42 Commercial Banks in Kenya, which were registered and were in operation as at 01st August,
2017 and had license to carry out banking business in Kenya under the banking Act Cap
488.Central Bank is also involved as the industry regulator and therefore has significant influence
on the lending interest rates and subsequent operations and strategies of the banks. These banks
included co-operative bank of Kenya, equity bank, family bank, Barclays bank, Kenya commercial
bank, national bank and diamond trust bank and others.
18
3.4 data collection
The secondary data was obtained from the financial reports of some of the 43 banks in Kenya for
period of six years from 2010 to 2015.The reports included audited annual financial statements of
commercial banks and supervisory reports obtained from Central bank of Kenya website from
2010 to 2015 regarding banking sector performance as well as prevailing lending interest rates
from commercial banks.
3.5 data analysis
Regression analysis and SPSS version 2.0 are the tools that were used to analyze the data.
According to Mugenda and Mugenda (2003) proposes that when one is analyzing data, the starting
point is collecting that data ending with interpreting and processing that data. Therefore, the
regression models were employed to come up with a model expressing the relationship between
the lending interest rates and profitability of commercial banks in Kenya.
3.5.1 analytical model
Regression analysis was used to find out whether a control variable predicted a given dependent
variable, t-statistic was employed to know the relative importance of each control variable in
influencing probability. The data to be analyzed came from financial statements of selected banks
in Kenya and also the central bank of Kenya in the period from 2011 to 2015.The regression
analysis model is shown on equation below;
Y = α¡ + β₁X₁ +β₂X₂+β₃X₃+ β₄X₄ +𝜀
Y = Financial Performance which was measured as ROA
X₁= Interest Rate –This is measured as the average rate charged by banks on loans to customers
per year.
X₂ = Capital Adequacy – This is measured by dividing the total equity by the total assets
X₃= Bank size – This is measured as the natural log of total assets.
X₄ = cost income ratio – This is measured by dividing the net operating costs by the amount of a
bank’s operating income.

19
α¡ = value of the intercept
βi = the coefficient of the explanatory i variables which measures the sensitivity of Y changes in
i
𝜀 = Error term
3.5.2 test of significance
A Pearson coefficient analysis (R) was used in the study to establish the linear relationship that
existed between the lending interest rates and profitability of commercial banks. The coefficient
of determination (R2) was used to show the percentage for which each independent variable
explaining the change in dependent variable. Analysis of variance (ANOVA) was employed to test
the significance of the model at 95% significance level.

20
CHAPTER FOUR
DATA ANALYSIS, RESULTS AND INTERPRETATIONS
4.1 Introduction
This chapter presents the data analysis, interpretation and discussion of the research findings. The
collected data from secondary sources was analyzed and interpreted in line with the objective of
the study which was to determine the effect of lending interest rates on Profitability of commercial
banks in Kenya. While carrying out the data collection, the target population was the 43 banks in
Kenya and the sample size was 18 banks that mainly belong the first and second tier segments of
the banking sector in Kenya. The chapter is divided into section 4.2 on descriptive statistics, section
4.3 on inferential statistics, section 4.4 on interpretation of the findings.
4.2 Descriptive statistics
in this section, we shall discuss the results obtained from the descriptive statistical models that
have been used to analyze the data collected. ANOVA and regression analysis were used to
establish the fitness of the model and also to show the link that exists between interest rates and
the performance of financial institutions in Kenya.
Table 4.1: Summary of Descriptive Statistics
Source: - research findings.
ROA INTEREST RATE CAPITAL ADEQUACY BANK SIZE COST INCOME RATIO
MEAN 0.0362 16.5060 0.1462 18.4217 0.6825
STANDARD ERROR 0.0049 0.0053 0.0004 0.0063 0.2788
MEDIAN 0.0322 16.3350 0.1474 18.4097 0.6737
STANDARD DEVIATION 0.0118 1.8640 0.0839 0.2897 0.0327
KURTOSIS 5.5323 0.9209 1.2513 -1.1909 2.3949
SKEWNESS 2.3167 0.8577 -0.7787 0.1437 1.4959
RANGE 0.0321 5.2892 0.0206 0.7710 0.0908
MINIMUM 0.0282 14.3592 0.1345 18.0505 0.6516
MAXIMUM 0.0602 19.6483 0.1551 18.8215 0.7424
21
The table 4.1 above shows ROA –return on assets and the four independent variables namely
interest rate, capital adequacy, bank size and cost income ratio. The table above, interest rate has
SD-1.8640, M-16.5060, Capital adequacy has SD-0.0839, M-0.1462, Bank-size stands at SD-
0.2897, M-18.4217 and finally cost-income ratio SD-0.0327, M-0.6825. The data above indicates
that bank size has the biggest value of mean at 18.42. The data shown in the table 4.1 above is
centered on the mean and this makes it much more reliable data.
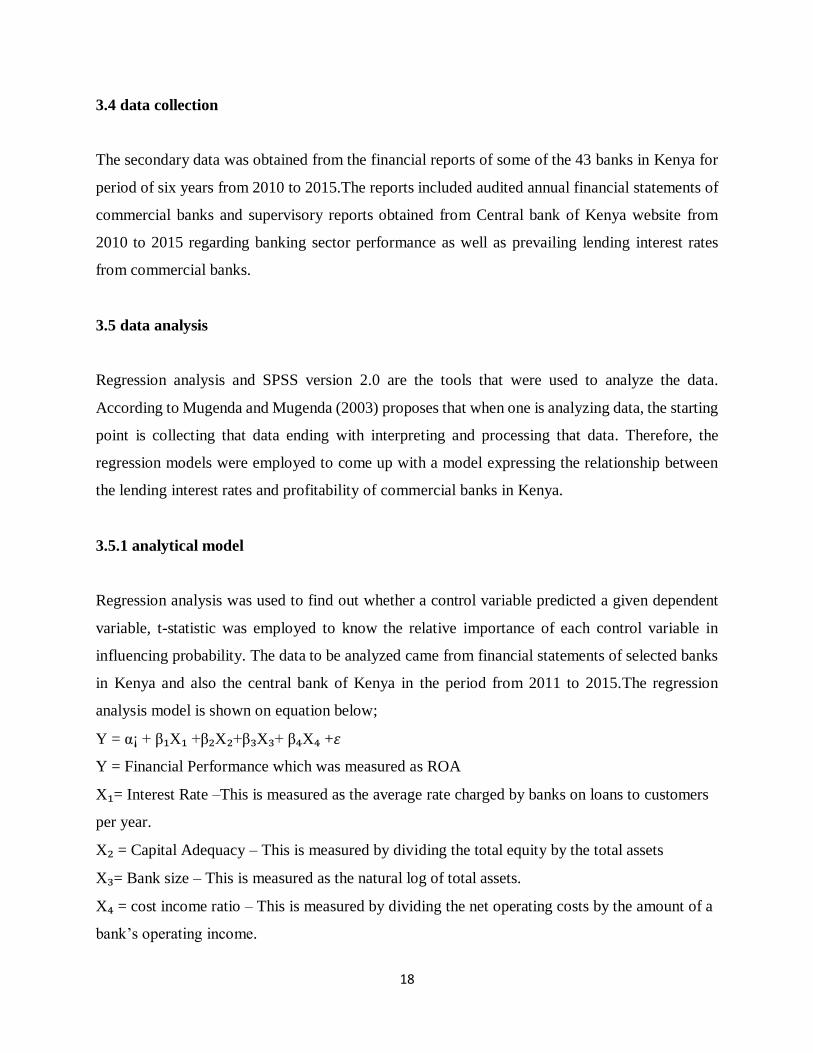
Graph 4.1: Trend Analysis of Commercial Bank lending interest rates movement
Source; - Research findings.
According to Graph 4.1 above, interest rates between the month of January 2010 and December
2015 hit a low of 13.85% in March 2010 and a high of 20.34% in March 2012. This represented
an increment of 46.9% in interest rates in 24 months. For most of 2010 and 2011, the interest rate
averaged at about 14.28%. 2012 was characterized by higher interest rates averaging at 19.64%
representing an increment of 37.5% in interest rates from the previous two years. For the next two
years, 2013 and 2014 there was a slight reduction in interest rates averaging at 16.9% representing
a 13.9 percentage reduction. In 2015, data in graph 4.1 shows that there was a further general
decrease interest rates averaging at 16.2%, just slightly below the previous two years’ average.
0
5
10
15
20
25
2010
JA
N
2010
MA
R
2010
MA
Y
2010
JU
L
2010
SEP
2010
NO
V
2011
Jan
uar
y
20
11
Mar
ch
2011
May
2011
Ju
ly
20
11
Sep
tem
be
r
2011
Nov
emb
er
2012
Jan
uar
y
20
12
Mar
ch
2012
May
2012
Ju
ly
20
12
Sep
tem
be
r
2012
Nov
emb
er
2013
Jan
uar
y
20
13
Mar
ch
2013
May
2013
Ju
ly
20
13
Sep
tem
be
r
2013
Nov
emb
er
2014
Jan
uar
y
20
14
Mar
ch
2014
May
2014
Ju
ly
20
14
Sep
tem
be
r
2014
Nov
emb
er
2015
Jan
uar
y
20
15
Mar
ch
2015
May
2015
Ju
ly
20
15
Sep
tem
be
r
2015
Nov
emb
er
22
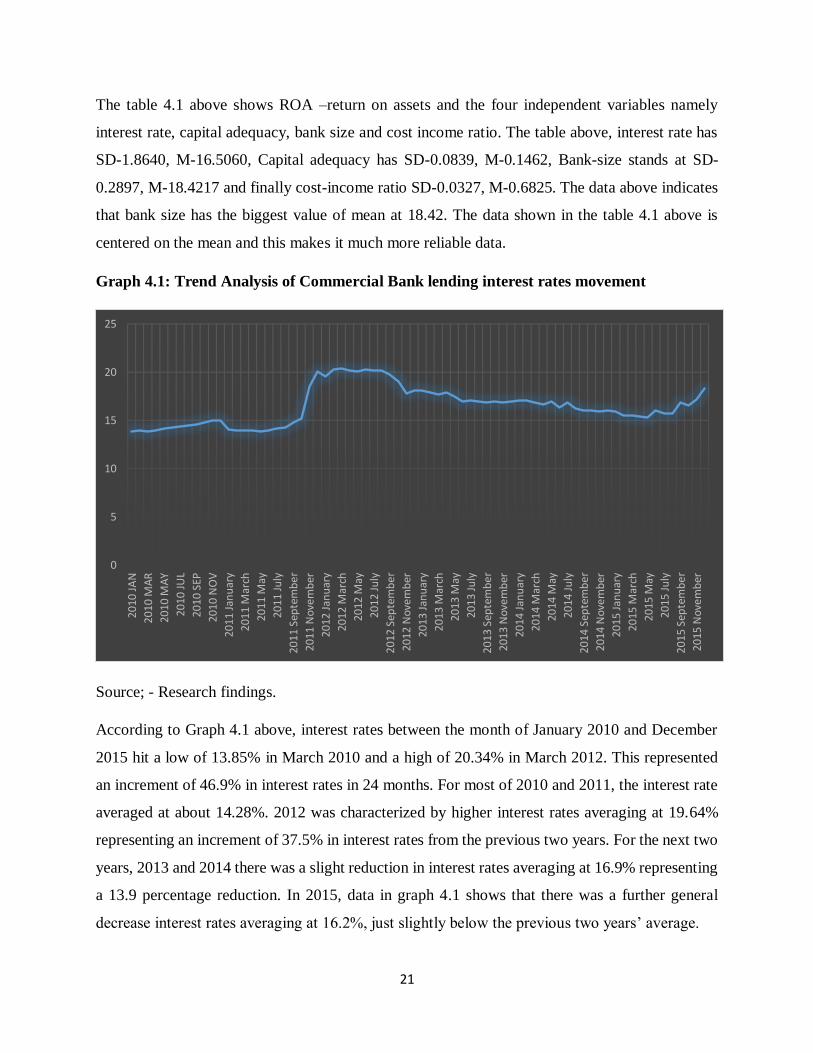
In Figure 4.1.1 below, we can see the trend of the average return on asset for those banks whose
data was used in the research. In 2010 the average ROA stood at approximately 3.4% and then in
2011 it dropped to approximately 3.2%. A further slight drop was experienced during 2012 to
3.1%. However, in 2013, there was a sharp increase in the ROA to 6% representing a percentage
increase of 93.6% of the previous year’
Figure 4.1.1: Average return on assets Years 2010 to 2015
Source; - Research findings
Figure 4.1.2: Comparative Commercial Banks ROA Years 2010 TO 2015
Source; - Research findings
0.0000%
1.0000%
2.0000%
3.0000%
4.0000%
5.0000%
6.0000%
7.0000%
2010 2011 2012 2013 2014 2015
AVERAGE ROA
-6.0000%
-4.0000%
-2.0000%
0.0000%
2.0000%
4.0000%
6.0000%
8.0000%
10.0000%
12.0000%
2010 2011 2012 2013 2014 2015

23
In figure 4.1.2 the ROA in 2010 had an average of 3.35%. The highest ROA in the year was 6.7%
and the lowest was 0.6%. 43.8% of all banks among those sampled had ROA that was above the
average for that year and 56.2% ROA below the average. Only one bank had ROA that was below
1.0%. 37.5% of the banks sampled had ROA that was between 1.0% and 3.0%, another 37.5% had
ROA between 3.0% and 5.0% and only 18.8% had ROA that was 6.0% and above.
In 2011, the average ROA was 3.17% and here, observation was that 50% of the banks sampled
had ROA that was above the average for the year, representing a slight improvement of 6.2%.
Those that had ROA below the average for the year were also 50%. In this year, the highest ROA
was 7.12% and the lowest was 0.75%. Here still, there was only one bank that had ROA of less
than 1%. 43.8% of the sampled banks had ROA that was between 1.0% and 3.0% representing an
increase of 16.8% from the previous year (2010). Those with ROA of between 3.0% and 5.0%
remained constant at 37.5% and those that had above 6.0% were 12.5%.
In 2012 the average ROA was 3.11%. The lowest ROA was for the first time a negative at -3.6%
and the highest was 7.4%, biggest experienced so far. 56.2% of the sampled banks were above the
average for the year. 43.8% had ROA below the average. The increase in those banks that were
above the average for the year was 6.2% just like in 2011. 37.5% of the banks sampled in this
particular year had ROA between 1.0% and 3.0% representing a reduction of 14.4% from the
previous year. 50% of the banks this year had ROA between 3.0% and 5.0%. Only 6.2% had ROA
above 6.0%
In 2013 the average ROA was 6.02%, the highest since 2010 representing an increment of 93.6%
from the average ROA of 2012. In this year, the lowest ROA was -5.0% and the highest was 9.87%
also the highest since 2010. In this year, there were only two banks in that sample that had ROA
between 2.0% and 4.50%. 31.2% of the banks had ROA between 5.0% and 7.0%. Those between
7.0% and 10% were 50% of those sampled this year. This demonstrates strong representative
performance in the banking sector this particular year. 37.5% of the banks in this year were below
the average ROA and 62.5% were above. Those above the average ROA represented and increment
of 11.2%.
In 2014, there was a drop in the performance reflected in the average ROA that stood at 3.25% of
the sampled banks. This dip in performance was a 46-percentage drop. The highest ROA also
suffered a 32.14% drop from 9.87% to 6.67%. On the side of the lowest ROA however, there was

24
an improvement of 84.6% from -5.0% to -0.77%. In this year, there were two banks that had ROA
below 1.0%. One bank had ROA between 1.0% and 2.0%. 56.2% of the banks sampled had ROA
of between 2.0% and 4.0%. 18.8% of the banks have ROA between 4.0% and 5.0%. No bank had
ROA of between 5.0% and 6.0% and one bank with ROA above 6.0%.
In 2015 the average ROA was 2.82%. This was a dip of 3.2% in the performance compared to the
previous year. The highest ROA was 5.36% and the lowest was -1.56%. 50% of the banks had
ROA that was below the average and the other half were above. Only two banks had ROA that
was below 1.50%. 31.2% of the banks had ROA between 2.0% and 3.0%. 37.5% had ROA that
was between 3.0% and 4.0%. No bank among those sampled had ROA between 4.0% and 5.0%.
Only two banks had ROA that was above 5.0%.
The comparative statistics are generally from the sampled banks which belong to the first and
second tier of the banking industry and they show generally positive return on investment
throughout the entire period of 2010 to 2015. The peak of performance during this period for most
of the sample size seems to have been reached in 2013 with also happens to have been the year
that proceeded that when the highest average of interest rate was witnessed.
4.3 Inferential statistics
To develop the variables for analytical modelling discussed in topic three, Microsoft excel was
used by applying multiple linear regression technique.
4.3.1 Correlation analysis
After the descriptive analysis, a Pearson correlation analysis was conducted to indicate a linear
association between the predicted and explanatory variables and also further analysis was
conducted to find out the correlation between the explanatory variables themselves. This in turn
helped in determining the strengths of association in the model, that is, which variable best
explained the relationship between lending rate and financial performance as measured ROA.
25
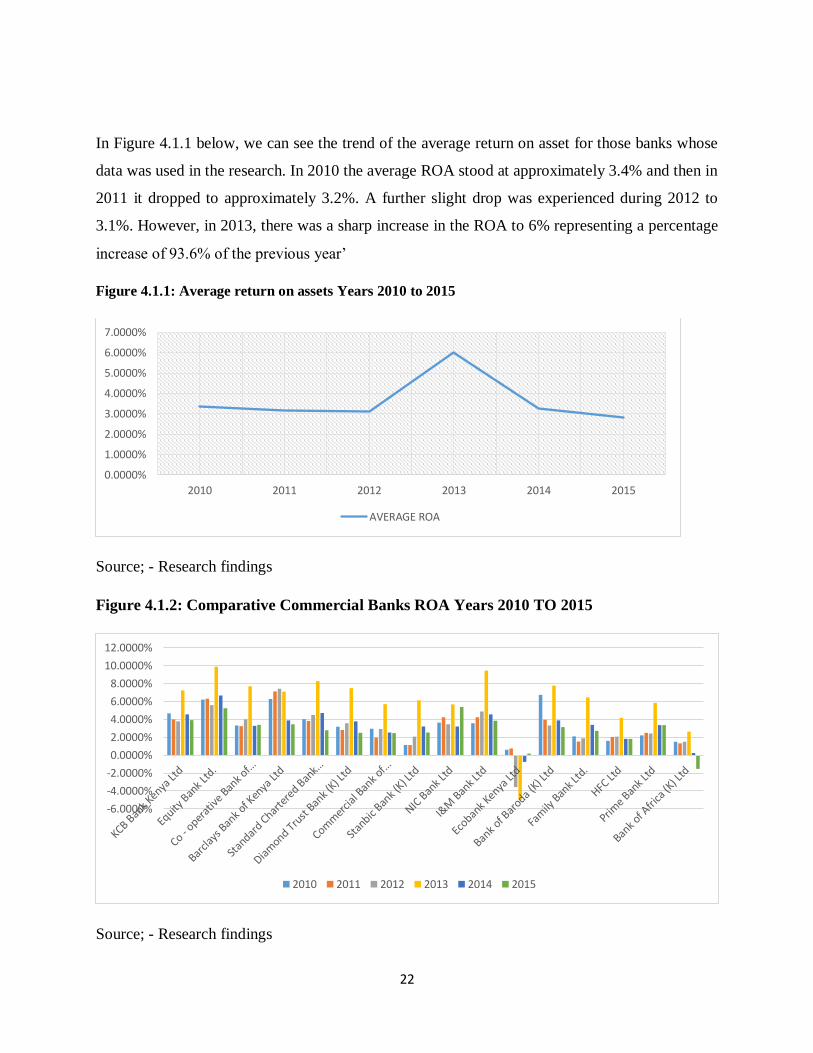
Table 4.2 Correlation matrix
Source; – research findings
From the table 4.2 above Pearson’s correlation coefficient stands at -0.17 between return on asset
and cost income ratio which means that there exists a perfectly negative relationship between these
two variables. For bank size and return on asset, it stands at -0.013 which also means that there is
a perfect negative relationship between these two variables. For return on asset and capital
adequacy, the correlation is +0.11 which points to a perfectly positive relationship between these
variables. The relationship is still perfectly positive when it comes to interest rate and return on
asset because the correlation coefficient stands at +0.16.
Also observed from table 4.2 above is that the relationship between interest rate and cost income
ratio, bank size, and capital adequacy is all positive as reflected by the coefficients +0.89, +0.29
and +0.09 respectively. The relationship between capital adequacy and cost income ratio is shown
as +0.08 representing a perfectly positive relationship between the variables. The relationship
between capital adequacy and bank size is also shown to be perfectly positive at +0.64. At +0.27,
the relationship between bank size and cost income ratio is also perfectly positive.
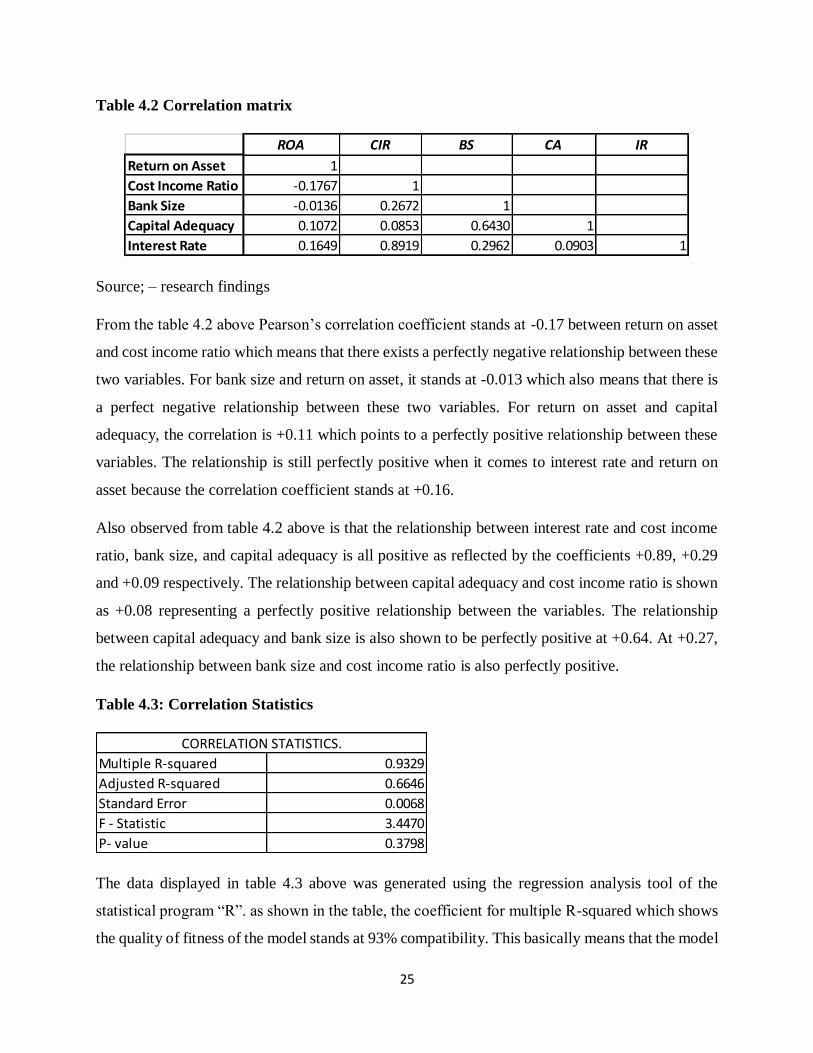
Table 4.3: Correlation Statistics
The data displayed in table 4.3 above was generated using the regression analysis tool of the
statistical program “R”. as shown in the table, the coefficient for multiple R-squared which shows
the quality of fitness of the model stands at 93% compatibility. This basically means that the model
ROA CIR BS CA IR
Return on Asset 1
Cost Income Ratio -0.1767 1
Bank Size -0.0136 0.2672 1
Capital Adequacy 0.1072 0.0853 0.6430 1
Interest Rate 0.1649 0.8919 0.2962 0.0903 1
Multiple R-squared 0.9329
Adjusted R-squared 0.6646
Standard Error 0.0068
F - Statistic 3.4470
P- value 0.3798
CORRELATION STATISTICS.
26
used in the research is appropriate and explains that the combination of the explanatory variables
is responsible for 93% of changes in the performance of commercial banks sampled for the study.
The explanatory or independent variables of the study namely; - interest rate, cost income ratio,
bank size and capital adequacy have a 93% influence on the performance of the Kenyan
commercial banks considered for the study. There is strong positive relationship between the
combination of the independent variables and the performance of Kenyan commercial banks.
However, since the independent variables are four, the coefficient of adjusted R- squared was used.
At 66%, this coefficient shows that the model developed can explain up to 66% the dependent
variable (performance of commercial banks in Kenya).
4.3.2 Regression Analysis
The linear regression method used for this study was the least squares method. This was used to
determine the line of best fit for the model through minimizing the sum of squares of the distances
from the points to the line of best fit.
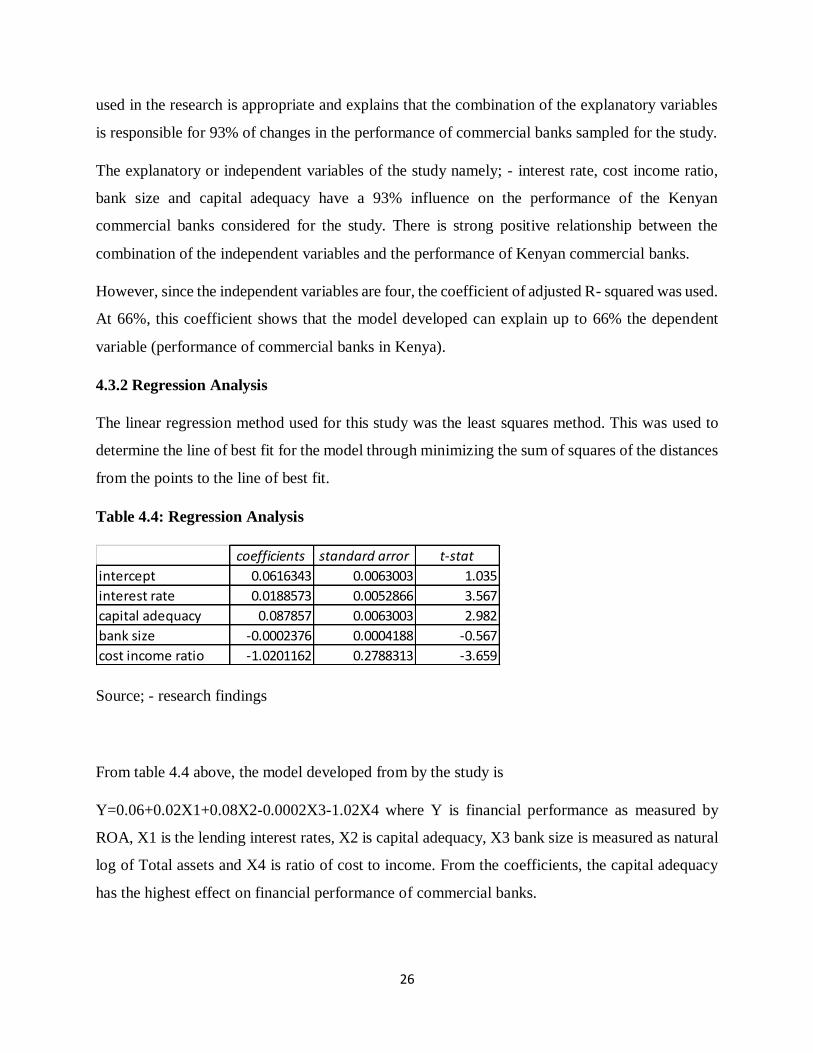
Table 4.4: Regression Analysis
Source; - research findings
From table 4.4 above, the model developed from by the study is
Y=0.06+0.02X1+0.08X2-0.0002X3-1.02X4 where Y is financial performance as measured by
ROA, X1 is the lending interest rates, X2 is capital adequacy, X3 bank size is measured as natural
log of Total assets and X4 is ratio of cost to income. From the coefficients, the capital adequacy
has the highest effect on financial performance of commercial banks.
coefficients standard arror t-stat
intercept 0.0616343 0.0063003 1.035
interest rate 0.0188573 0.0052866 3.567
capital adequacy 0.087857 0.0063003 2.982
bank size -0.0002376 0.0004188 -0.567
cost income ratio -1.0201162 0.2788313 -3.659
27
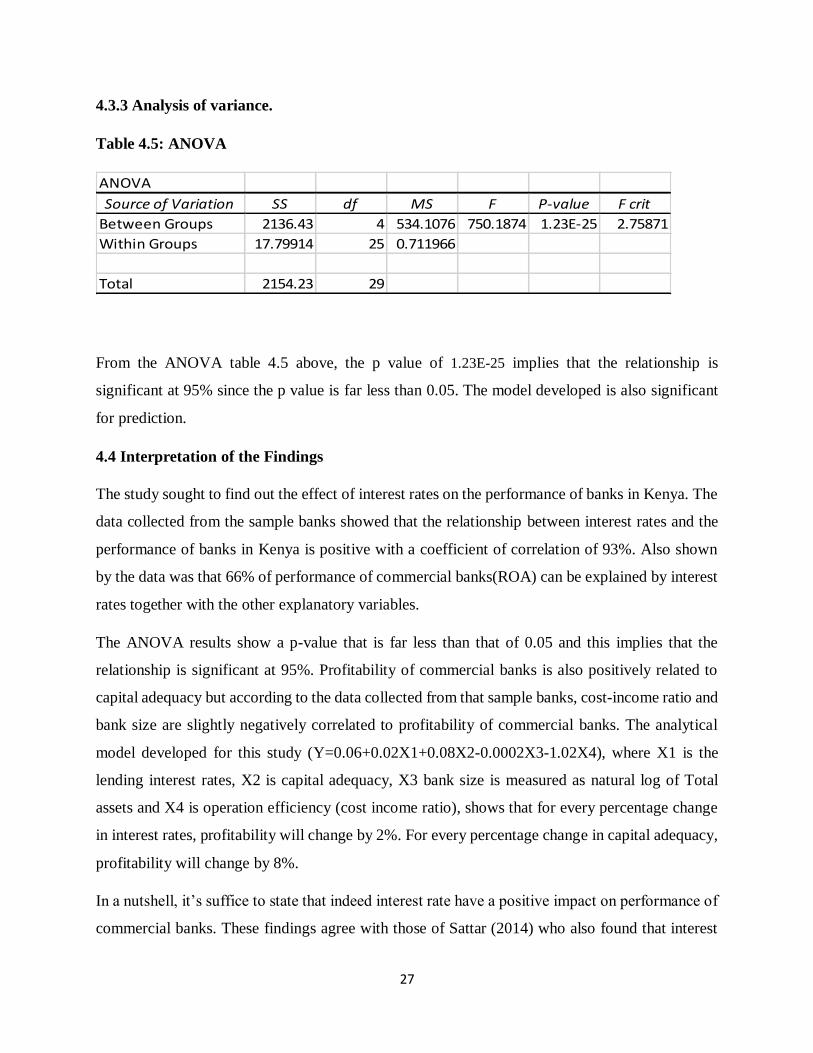
4.3.3 Analysis of variance.
Table 4.5: ANOVA
From the ANOVA table 4.5 above, the p value of 1.23E-25 implies that the relationship is
significant at 95% since the p value is far less than 0.05. The model developed is also significant
for prediction.
4.4 Interpretation of the Findings
The study sought to find out the effect of interest rates on the performance of banks in Kenya. The
data collected from the sample banks showed that the relationship between interest rates and the
performance of banks in Kenya is positive with a coefficient of correlation of 93%. Also shown
by the data was that 66% of performance of commercial banks(ROA) can be explained by interest
rates together with the other explanatory variables.
The ANOVA results show a p-value that is far less than that of 0.05 and this implies that the
relationship is significant at 95%. Profitability of commercial banks is also positively related to
capital adequacy but according to the data collected from that sample banks, cost-income ratio and
bank size are slightly negatively correlated to profitability of commercial banks. The analytical
model developed for this study (Y=0.06+0.02X1+0.08X2-0.0002X3-1.02X4), where X1 is the
lending interest rates, X2 is capital adequacy, X3 bank size is measured as natural log of Total
assets and X4 is operation efficiency (cost income ratio), shows that for every percentage change
in interest rates, profitability will change by 2%. For every percentage change in capital adequacy,
profitability will change by 8%.
In a nutshell, it’s suffice to state that indeed interest rate have a positive impact on performance of
commercial banks. These findings agree with those of Sattar (2014) who also found that interest
ANOVA
Source of Variation SS df MS F P-value F crit
Between Groups 2136.43 4 534.1076 750.1874 1.23E-25 2.75871
Within Groups 17.79914 25 0.711966
Total 2154.23 29

28
rates do in fact affect the performance of commercial banks in Pakistan. Locally, Odhiambo (2009)
found that interest rates make up the main income for financial institutions with non-financial
income coming in second which comprises many sources.

29
CHAPTER FIVE
SUMMARY, CONCLUSION AND RECOMMENDATIONS
5.1 Introduction
This chapter presents the summary of findings, conclusions and recommendations derived from
the findings of the study. The chapter also presents the limitations that were encountered in the
study with suggestions for further research. This chapter is arranged as section 5.2,5.3,5.4,5.5 and
5.6 which are summary of the study, conclusion, policy recommendation, limitations and finally
recommendations for further research respectively.
5.2 Summary
The main objective of the study was to establish the effect of interest rates in the financial
performance of commercial banks in Kenya. The study which was descriptive in nature was done
to achieve the objectives. The study used regression analysis to determine the relationship between
lending interest rates and the financial performance measured by return on assets. Return on
Assets(ROA) was the dependent variable of the study and the descriptive / independent variables
were; - interest rates, bank size, cost-income ratio and capital adequacy.
The study found that there was significant positive relationship between interest rates and the
financial performance of commercial banks in Kenya and this was underscored by a positive
coefficient of correlation of 0.66. Commercial bank financial performance was also found to be
positively related to lending interest rates and bank size with a coefficient of correlation of 0.93.
out of the sampled banks, it was found that Over 90% of commercial banks have positive return
on assets. The highest performance for the period of study was recorded in year 2013 where the
best performing commercial bank had a return on assets of 9.8%. The lowest performance was
also recorded in the same year whereby the highest loss made by worst performing commercial
bank was -5.0%.
5.3 Conclusion
The main objective of this study was to determine the effect of interest rates on the financial
performance of commercial banks in Kenya. From the findings above, the study concludes that
lending interest rates have significant perfectly positive effect on financial performance of
30
commercial banks in Kenya at 95% confidence level. The relationship between lending interest
rates and profitable was also found to be linear with increase in lending interest rates leading to
higher profitability. The study further concludes that commercial banks in Kenya are profitable
with over 95% of the sampled commercial banks having positive financial returns. This is shown
by the positive ROA.
The study also concludes that lending interest rates, capital adequacy and bank size all have
significant effect on ROA. Also, cost to income ratio of commercial banks has effect on
profitability of commercial banks where the big commercial banks have higher profitability as they
enjoy economies of scale. Finally, the study concludes that the model containing that lending
interest rates, capital adequacy, cost-income ratio, and size of commercial bank can explain 93%
of the changes in commercial banks profitability.
5.4 Policy Recommendation
Based on the study findings, the First recommendation would be that since commercial bank
lending rates have positive effect on commercial banks profitability, and generally this is because
higher lending rate implies more revenues to the commercial banks. The demand for loans in
Kenya generally marginally reduces when interest rates increase meaning that demand for loans
in Kenya is inelastic and hence insensitive to changes in price for money (interest rates). To
cushion consumers from exploitation by commercial banks, the Central Bank should carryout
monitoring roles strictly and discipline any commercial banks that may be increasing the interest
rates unfairly and exploiting Kenyans.
Also in conjunction with the KBA and assistance from CBK, emphasis needs to be put into
developing alternative business channels for banks to generate income. This is good because
enables banks to generate revenue through utilization on non-interest avenues. The knock-on effect
will be a noticeable reduction in lending rates because banks will no longer need to charge high
interest rates to generate good profits. With lower interest rates, more Kenyans will be able to
access credit facilities which will most likely lead to increased business and productivity.
Further policy recommendation is that CBK and KBA together with the ministry of finance come
up with policies that make the macro environment less hostile and volatile so that the smaller 3rd
tier banks can easily grow and begin to enjoy economies of scale and not rely so much on in
31
income for simple milestones like breaking even. Along the same line, policies should be put in
place that encourage financial inclusion especially targeting the rural unbanked population for
better financial planning and management.
5.5 Limitations of the Study
During the carrying out of the study, the first limitation was that, out of the 18 banks selected for
the sample size, two did not have financial records for 2010.
Also, this study made use of return on assets as measure of financial performance. There are other
measures of financial performance including return on equity (ROE), Return on Deposits (ROD),
Return on investment (ROI), return on capital employed (ROCE) among others.
The study was very reliant on secondary data which had already been compiled by the Central
Bank of Kenya as well published financial statements of commercial banks. The data was used as
is from the financial statements without any adjustments and there was no way of verifying the
validity of the data and it was therefore assumed to be accurate for this study. The study results
are therefore subject to the validity of the data.
Also to note is that the study was specific to Kenya and therefore suffers from the limitations of
country specific studies.it therefore cannot be used to properly show the banking situation in other
sub-Saharan African countries.
5.6 Suggestions for Further Research
Based on the limitations of the study, findings and experience obtained over the research period,
there are several other areas of study where resources and physical effort can be directed. Lending
interest rates remain a major source of revenue for commercial banks however further research
can be conducted around alternative business channels for banks
Further research should be done in different countries to enable generalization of the findings. In
addition, some study can be carried out using data from other avenues like NSE, KBA, business
daily other than mainly depending on data from commercial banks and CBK. This will improve
the reliability of the financial information. Further study can be done on other financial institutions.

32
Lastly, there is need for one carry out another study in the banking industry that makes use of other
control variables in order to show the impact of lending interest rate on bank performance not bank
size, capital adequacy, and cost-income ratio cannot be overemphasized.

1
REFERENCES
Abdul S. (2014) Impact of Interest Rate Changes on the Profitability of four Major
Commercial Banks in Pakistan. International Journal of Accounting and Financial Reporting.
Ahokpossi, C. (2013). Determinants of Bank Interest Margins in Sub-Saharan Africa, IMF
Working Paper WP/13/34.Washington D.C.: International Monetary Fund.
Amrik H. & Michael K. (2015) Kenya’s Financial Transformation in the 21st Century
Bean A.M (2017) determinants of interest rates
Boyd J. and Jalal A. (2012) The Fisher Effect, A Contradiction: Theory and Empirics
Bubna A. and Chowdhry, B. (2010), “Franchising Microfinance”, Review of Finance, Vol. 14, No.
3
Bulkley G., Richard D. F. Harris & Nawosah V. (2008) Revisiting the Expectations Hypothesis of
the Term Structure of Interest Rates. University of Exeter
Central bank of Kenya prudential guidelines edition January 2013
Central bank of Kenya report (July 2016) performance and developments in the kenyan banking
sector for the quarter ended 31st march 2016
Cox J.C, Ingersoll J.E. & Stephen A. R. (1985) A Theory of the term structure of interest rates.
Econometrica, Vol. 53, No. 2
Daley D. and Dacosta D. (2012) Market Interest Rate and Commercial Banks Profitability: An
Empirical Study
Demirguc-Kunt, A., and Huizinga, H., (1997). Determinants of Commercial Bank Interest
Margins and Profitability: Some International Evidence. Washington,
Emmanuelle, N.Y.S., (2003). A European Study of Bank Interest Margins: Is Net Fees Revenue A
Determinant. Doctoral Thesis. United Kingdom, U.K: University of Birmingham
Fisher I. (1930) the theory of interest as determined by impatience to spread income and
opportunity to invest it.
Froyen, R. (1996). Macroeconomics: Theories and Policies.5thEdition. New Jersey: Prentice Hall
Publishers.
2
Fry, M. (1995). Money, Interest and Banking in Economic Development. 2nd edition. Johns
Hopkins University.
Gary R.E., (1999) the loanable funds model
Hualan C. & Wang W. (2006) The effects of interest rate changes on bank stock returns and
profitability.
Kamau, A. W. (2009). Efficiency and productivity in the banking sector in Kenya. Doctoral thesis,
University of Nairobi, 2009.
Keynes J.M (1936) The General Theory of Employment, Interest, and Money
Mbua S.N (2017) effect of interest rates capping by the central bank of Kenya on the banks listed
Mishkin F.S. (2009) the economics of money, banking & financial markets.9th edition
Mugenda, O.M., and Mugenda, A.G. (2003). Research Methods: Quantitative and Qualitative
Approaches. Acts Press. Nairobi. Kenya.
Ngechu. M. (2004). Understanding the research process and methods. An introduction to research
methods. Acts Press, Nairobi.
Ngugi, R.W., (2001). An Empirical Analysis of Interest Rate Spread in Kenya. African Economic
Research Consortium, Research Paper 106
on the Nairobi securities exchange. United States International University
Philip A. and Luiz F.P. (2008) Financial Liberalization and Economic Performance in Emerging
Countries
Podjadek R. & Genay .H (2014) what is the impact of a low interest rate environment on bank
profitability? The federal reserve bank of Chicago.
Ramful P. (2001) The determinants of interest rate spread: empirical evidence on the Mauritian
banking sector. Research department, bank of Mauritius.
The European Parliament. How do low and negative interest rates affect bank’s activity and
profitability in the euro area. Monetary dialogue, November 2016
Warren J. T. (1986) the expectations theory of the term structure and short-term interest rates in
Australia. Reserve Bank of Australia Research Discussion Paper 8607

3
Were.M. & Wambua. J (2014) What factors drive interest rate spread of commercial banks?
Empirical evidence from Kenya. Africa growth
4
APPENDICES
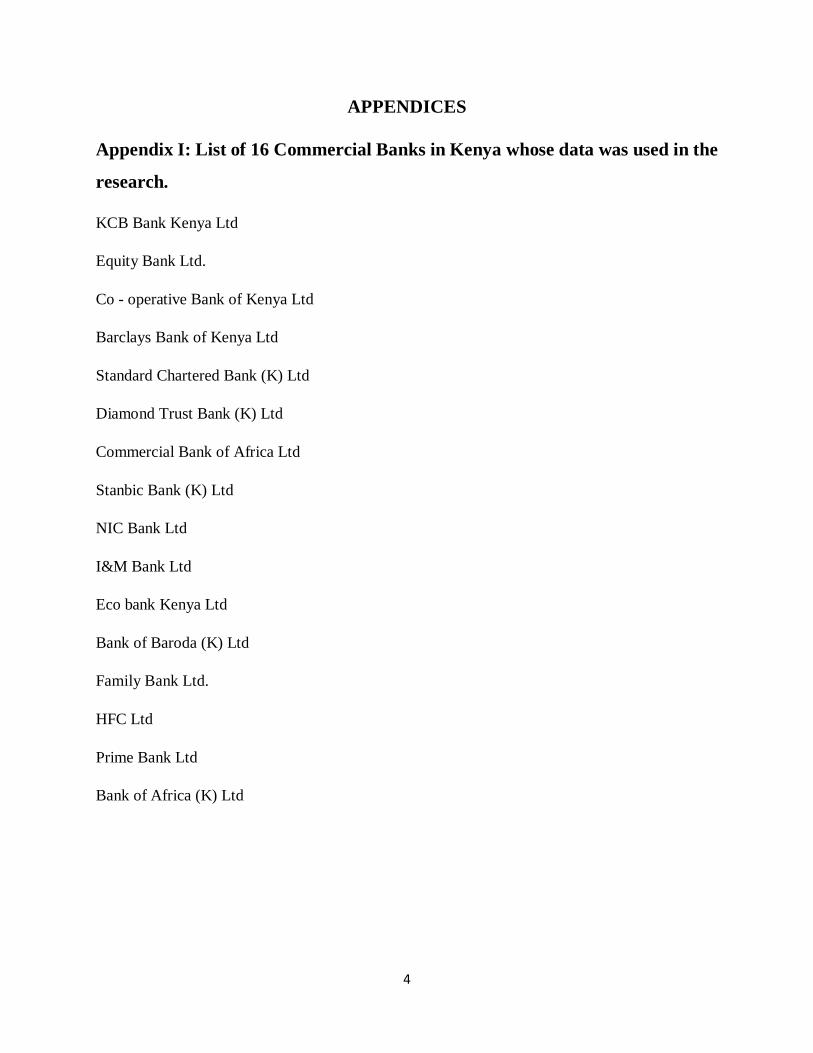
Appendix I: List of 16 Commercial Banks in Kenya whose data was used in the
research.
KCB Bank Kenya Ltd
Equity Bank Ltd.
Co - operative Bank of Kenya Ltd
Barclays Bank of Kenya Ltd
Standard Chartered Bank (K) Ltd
Diamond Trust Bank (K) Ltd
Commercial Bank of Africa Ltd
Stanbic Bank (K) Ltd
NIC Bank Ltd
I&M Bank Ltd
Eco bank Kenya Ltd
Bank of Baroda (K) Ltd
Family Bank Ltd.
HFC Ltd
Prime Bank Ltd
Bank of Africa (K) Ltd
5
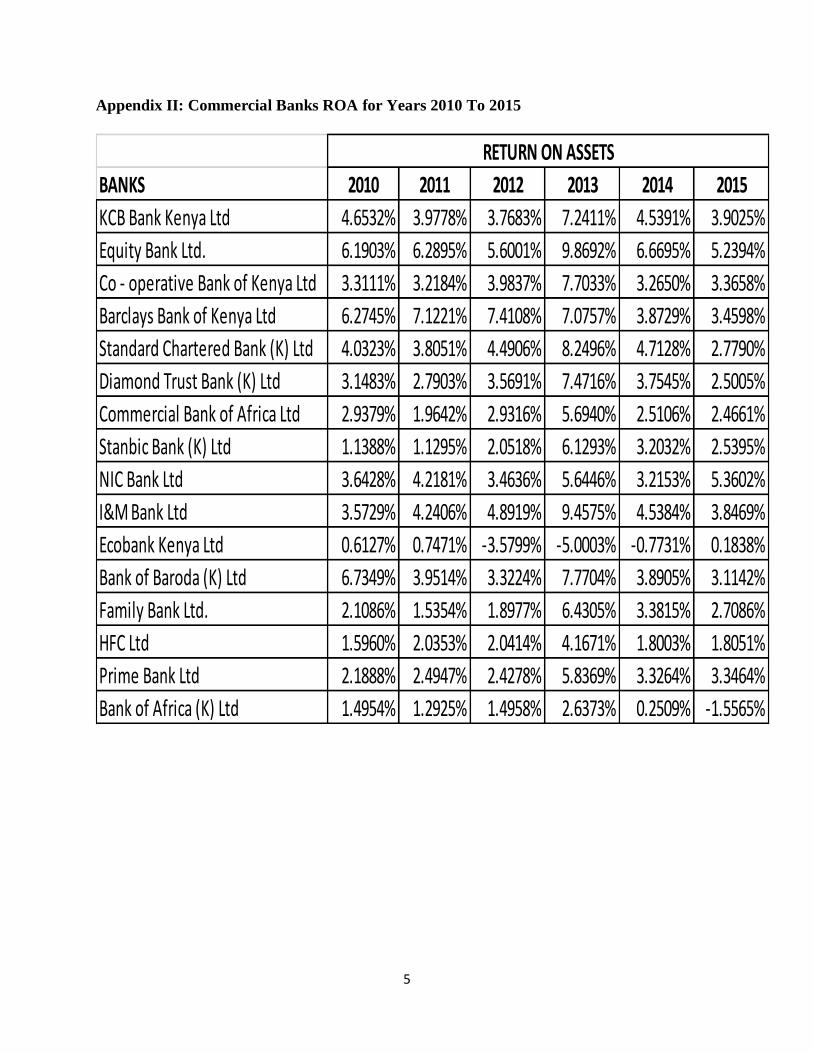
Appendix II: Commercial Banks ROA for Years 2010 To 2015
BANKS 2010 2011 2012 2013 2014 2015
KCB Bank Kenya Ltd 4.6532% 3.9778% 3.7683% 7.2411% 4.5391% 3.9025%
Equity Bank Ltd. 6.1903% 6.2895% 5.6001% 9.8692% 6.6695% 5.2394%
Co - operative Bank of Kenya Ltd 3.3111% 3.2184% 3.9837% 7.7033% 3.2650% 3.3658%
Barclays Bank of Kenya Ltd 6.2745% 7.1221% 7.4108% 7.0757% 3.8729% 3.4598%
Standard Chartered Bank (K) Ltd 4.0323% 3.8051% 4.4906% 8.2496% 4.7128% 2.7790%
Diamond Trust Bank (K) Ltd 3.1483% 2.7903% 3.5691% 7.4716% 3.7545% 2.5005%
Commercial Bank of Africa Ltd 2.9379% 1.9642% 2.9316% 5.6940% 2.5106% 2.4661%
Stanbic Bank (K) Ltd 1.1388% 1.1295% 2.0518% 6.1293% 3.2032% 2.5395%
NIC Bank Ltd 3.6428% 4.2181% 3.4636% 5.6446% 3.2153% 5.3602%
I&M Bank Ltd 3.5729% 4.2406% 4.8919% 9.4575% 4.5384% 3.8469%
Ecobank Kenya Ltd 0.6127% 0.7471% -3.5799% -5.0003% -0.7731% 0.1838%
Bank of Baroda (K) Ltd 6.7349% 3.9514% 3.3224% 7.7704% 3.8905% 3.1142%
Family Bank Ltd. 2.1086% 1.5354% 1.8977% 6.4305% 3.3815% 2.7086%
HFC Ltd 1.5960% 2.0353% 2.0414% 4.1671% 1.8003% 1.8051%
Prime Bank Ltd 2.1888% 2.4947% 2.4278% 5.8369% 3.3264% 3.3464%
Bank of Africa (K) Ltd 1.4954% 1.2925% 1.4958% 2.6373% 0.2509% -1.5565%
RETURN ON ASSETS
6
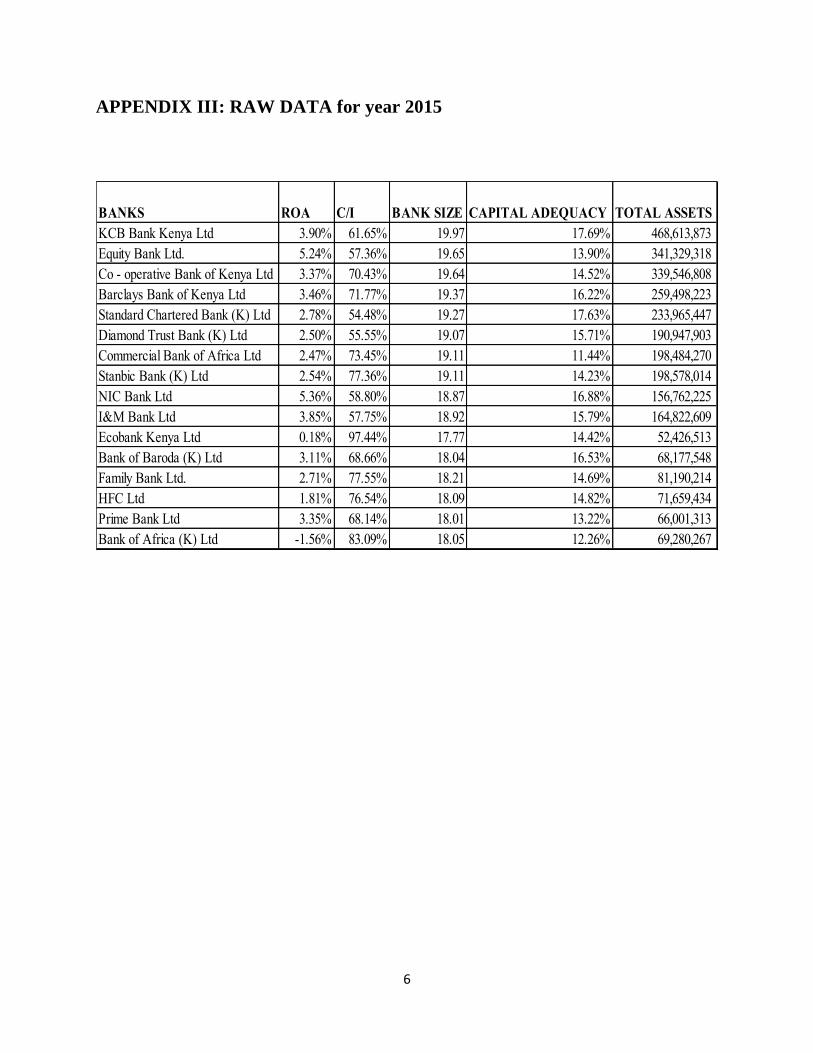
APPENDIX III: RAW DATA for year 2015
BANKS ROA C/I BANK SIZE CAPITAL ADEQUACY TOTAL ASSETS
KCB Bank Kenya Ltd 3.90% 61.65% 19.97 17.69% 468,613,873
Equity Bank Ltd. 5.24% 57.36% 19.65 13.90% 341,329,318
Co - operative Bank of Kenya Ltd 3.37% 70.43% 19.64 14.52% 339,546,808
Barclays Bank of Kenya Ltd 3.46% 71.77% 19.37 16.22% 259,498,223
Standard Chartered Bank (K) Ltd 2.78% 54.48% 19.27 17.63% 233,965,447
Diamond Trust Bank (K) Ltd 2.50% 55.55% 19.07 15.71% 190,947,903
Commercial Bank of Africa Ltd 2.47% 73.45% 19.11 11.44% 198,484,270
Stanbic Bank (K) Ltd 2.54% 77.36% 19.11 14.23% 198,578,014
NIC Bank Ltd 5.36% 58.80% 18.87 16.88% 156,762,225
I&M Bank Ltd 3.85% 57.75% 18.92 15.79% 164,822,609
Ecobank Kenya Ltd 0.18% 97.44% 17.77 14.42% 52,426,513
Bank of Baroda (K) Ltd 3.11% 68.66% 18.04 16.53% 68,177,548
Family Bank Ltd. 2.71% 77.55% 18.21 14.69% 81,190,214
HFC Ltd 1.81% 76.54% 18.09 14.82% 71,659,434
Prime Bank Ltd 3.35% 68.14% 18.01 13.22% 66,001,313
Bank of Africa (K) Ltd -1.56% 83.09% 18.05 12.26% 69,280,267