interest rate pass through in ukraine
TRANSCRIPT

8/2/2019 Interest Rate Pass Through in Ukraine
http://slidepdf.com/reader/full/interest-rate-pass-through-in-ukraine 1/81
INTEREST RATE PASS THROUGHIN UKRAINE
by
Iaryna Grynkiv
A thesis submitted in partial fulfillment of the requirements for the degree of
Master of Arts in Economics
National University “Kyiv-Mohyla Academy”Economics Education and Research Consortium
Master’s Program in Economics
2007
Approved by ___________________________________________________ Ms. Serhiy Korablin (Head of the State Examination Committee)
__________________________________________________
__________________________________________________
__________________________________________________
Program Authorizedto Offer Degree Master’s Program in Economics, NaUKMA
Date __________________________________________________________
8/2/2019 Interest Rate Pass Through in Ukraine
http://slidepdf.com/reader/full/interest-rate-pass-through-in-ukraine 2/81
National University “Kyiv-Mohyla Academy”
Abstract
INTEREST RATE PASS THROUGH IN UKRAINE
by Iaryna Grynkiv
Head of the State Examination Committee: Mr. Serhiy Korablin,Economist, National Bank of Ukraine
This paper aims to investigate the issue of interest rate pass through in Ukainebetween 2000 and 2006. After identifying a structural break in the interest rate
data, we apply structural vector autoregressive methodology to model the
process of pass through from monetary policy shock and from a measure of
cost of funds to a series of bank retail rates for the whole period and a post-
break subperiod. We find the evidence of incomplete pass through in the
short run: the transmitted proportion of changes in market interest rate to
bank deposit and credit rates within one month is at most 64%. At the same
time, the hypothesis of full pass through to most retail rates in the long run
can not be unanimously rejected. Also, the pass through from monetary
policy rate (the NBU discount rate) appears to be higher both in the short and
long run than the pass through from market interest rates, which stands out
against the popular belief that the monetary policy does not work in Ukraine.
Inaddition, we find the pass through to be both higher and associated with a
shoter lag since the July of 2002, the point of structural break. Finally, no
asymmetry is found in the interest rate pass through process.

8/2/2019 Interest Rate Pass Through in Ukraine
http://slidepdf.com/reader/full/interest-rate-pass-through-in-ukraine 3/81
TABLE OF CONTENTS
List of Charts………………………………………………………. ii
List of Tables……………………………………………………….. iv
Acknowledgments………………………………………………….. vii
Glossary……………………………………………………………. viii
Chapter 1: Introduction…………………………………………… . 1
Chapter 2: Literature Review……………………………………….... 4
Chapter 3: Methodology…………………………………………….. 13
3. A VAR framework……………………………………. 133.1. Cost of Funds Approach………………………… 143.2. Monetary Policy Approach………………………. 143.3. Testable Hypothesises…………………………… 153.4. Bivariate VAR approach…………………………. 163.5. Test for Asymmetric Interest Rate Pass Through… 173.6. Multivariate Vector Autoregression Model……… 17
Chapter 4: Data Description…………………………………………. 20
4.1. Data description……………………………………… 20
4.2. Correlation Analysis…………………………………... 22Chapter 5: Estimation Results………………………………………… 27
5.1. Bivariate VAR model………………………………….. 275.1.1. Marginal Costs Approach……………………….. 275.1.2. Subsample Results from Bivariate VAR…………. 325.1.3. Monetary Policy Approach……………………… 345.1.4. Results on Asymmetry of Responses……………. 36
5.2. Results from Multivariate VAR……………………….. 37
Chapter 6: Conclusions and Implications……………………………... 40
Bibliography………………………………………………………….. 43 Appendix…………………………………………………………….. 47

8/2/2019 Interest Rate Pass Through in Ukraine
http://slidepdf.com/reader/full/interest-rate-pass-through-in-ukraine 4/81
LIST OF CHARTS
Number
Chart 1. The Transmissions between Policy and Retail Rates…………… 16
Chart 2. Market and Policy Rates……………………………………….. 22
Chart 3. Bank lending rates……………………………………...…......... 22
Chart 4. Bank deposit rates……………………………………………... 22
Chart 5. The amount of credits given in the economy…………………... 75
Chart 6. Interest rate pass through to lenging rates redeemable…75in UAH. Full sample estimation.
Chart 7. Interest rate pass through to lenging rates redeemable………... 75in the US dollar. Full sample estimation
Chart 8. Interest rate pass through to deposit rates to firms……75redeemable in UAH. Full sample estimation
Chart 9. Interest rate pass through to deposit rates to households…75rredeemable in UAH. Full sample estimation
Chart 10. Interest rate pass through to lenging rates redeemable ……..….76in UAH. Short sample estimation.
Chart 11. Interest rate pass through to lenging rates redeemable ………..76in the US dollar. Short sample estimation
Chart 12. Interest rate pass through to deposit rates to firms ………76
redeemable in UAH. Short sample estimation
Chart 13. Interest rate pass through to deposit rates …………………….76to households redeemable in UAH. Short sample estimation
Chart 14. Interest rate pass through to lenging rates ……………76redeemable in UAH. Monetary Policy Approach. Full sample estimation
Chart 15. Interest rate pass through to lenging rates redeemable………….76in UAH. Monetary Policy Approach. Short sample estimation
ii

8/2/2019 Interest Rate Pass Through in Ukraine
http://slidepdf.com/reader/full/interest-rate-pass-through-in-ukraine 5/81
Chart 16. Interest rate pass through to lenging rates to………….77households redeemable in UAH. Monetary Policy Approach.Full sample estimation
Chart 17. Interest rate pass through to lenging rates to …………77households redeemable in UAH. Monetary Policy
Approach. Short sample estimation
Chart 18. Interest rate pass through to deposit rates to redeemable……….77in UAH. Monetary Policy Approach. Full sample estimation
Chart 19. Interest rate pass through to deposit rates to redeemable……… 77in UAH. Monetary Policy Approach. Full sample estimation
iii

8/2/2019 Interest Rate Pass Through in Ukraine
http://slidepdf.com/reader/full/interest-rate-pass-through-in-ukraine 6/81
LIST OF TABLES
Number
Table 1. Descriptive statistics………………………………………. 53
Table 2. Correlation Analisys between bank lending rate an........... 57interbank lending rates redeemable in UAH
Table 3. Correlation analysis between bank lending and market ………. 58
interest rate redeemable in US dollar
Table 4. Correlation analysis between bank deposit and market……….. 59interest rates redeemable in UAH
Table 5. Dicket Fuller test for unit root for interbank and bank……….. 60lending rates, discount rate
Table 6. Dicket Fuller test for unit root for bank deposit rates………… 61
Table 7. Interest rate pass through based on biviriate Var model from.... 62
Market rate to bank lending rate redeemable at UAH; fullsample estimation.
Table 8. Interest rate pass through based on biviriate Var model from.... 63market to bank lending rates redeemable at US dollar; fullsample estimation
Table 9. Interest rate pass through based on biviriate Var model from… 64market to deposit rate redeemable at UAH; full sampleestimation
Table 10. Interest rate pass through based on biviriate Var model from… 65market to lending rate redeemable in UAH. Short sampleestimation
Table 11. Interest rate pass through based on biviriate Var model from.... 66market to lending rate redeemable at the US dollar. Shortsample estimation
Table 12. Interest rate pass through based on bivariate Var model from… 67market to deposit rate redeemable at UAH. Short sampleestimation
iv

8/2/2019 Interest Rate Pass Through in Ukraine
http://slidepdf.com/reader/full/interest-rate-pass-through-in-ukraine 7/81
Table 13. Interest rate pass through based on biviriate Var model from… 68policy to lending rate denominated in UAH. Full sampleestimation
Table 14. Interest rate pass through based on biviriate Var model from… 69policy to lending rate redeemable in UAH. Short sampleestimation
Table 15. Interest rate pass through based on biviriate Var model from… 70policy to deposit rate redeemable at UAH. Full sampleestimation
Table 16. Interest rate pass through based on biviriate Var model from… 71policy to deposit rate redeemable at UAH. Short sampleestimation
Table 17. Interest rate pass through based on Multivariate VAR model….. 72from market to credit rates redeemable at UAH. Full sampleestimation.
Table 18. Interest rate pass through based on Multivariate VAR model..... 73from policy to credit rates redeemable at UAH.Full sample estimation.
Table 19. Interest rate pass through based on Multivariate VAR model …. 73From deposit to credit rates redeemable at UAH.Full sample estimation.
Table 20. Interest rate pass through based on Multivariate VAR model…. 74from policy to credit rates redeemable at UAH.Full sample estimation.
Table 21. Results from Granger causality test…………………………… 74
v

8/2/2019 Interest Rate Pass Through in Ukraine
http://slidepdf.com/reader/full/interest-rate-pass-through-in-ukraine 8/81
ACKNOWLEDGMENTS
The author wishes to express her sincere gratitude to her advisor, Prof.
Olesia Verchenko for overall guidance, valuable comments, support and
understanding. The special thank is devoted to Prof. Tom Coupe for his
thorough review and helpful remarks. She is grateful to Lisenko Roman, the
Head of Research Department at the NBU, for his kindness of providing
necessary data for this research. The author deeply appreciates the feedback
of her work provided by Research Workshop proffessors, PavloProkopovych and Sergei Slobodyan. She is indebted to God for His help and
provision, and to her parents and younger sister for their gentle support while
this not easy period of thesis writing.
vi

8/2/2019 Interest Rate Pass Through in Ukraine
http://slidepdf.com/reader/full/interest-rate-pass-through-in-ukraine 9/81
GLOSSARY
MTM - Monetary Transmission Mechanism
NBU - National Bank of Ukraine
IMF - International Monetary Fund
UAH – Ukrainian currency hryvna
IRF- Impulse Response Function
Interest Rate Pass Through – The process of transmission of changes intopolicy/market interest rates to changes inmarket/bank interest rates
vii
8/2/2019 Interest Rate Pass Through in Ukraine
http://slidepdf.com/reader/full/interest-rate-pass-through-in-ukraine 10/81
C h a p t e r 1
INTRODUCTION
The belief that monetary policy could have an effect on the activity of
real economy at least in the short-run induced many economists to investigate
and explain the possible channels through which money supply affects
output, inflation and other real economic variables. These channels constitute
the so-called monetary transmission mechanism (MTM). Depending on
structure of the particular economy channels of MTM could be divided into
two groups: core and minor channels. A necessary condition for monetary
authority to achieve its intermediate targets and final objectives is a clear
understanding of the outcomes a particular policy will have on the economy,
which justifies the creation of an appropriate model of MTM (Mishkin 1996).
During the last decade Ukraine has been pursuing monetary policy
focused on pegging the exchange rate of Ukrainian currency (hryvna) to the
US dollar. Therefore, the exchange rate channel is considered to be the most
important channel of MTM in this country. Capital controls which are de
facto present in Ukraine imply some independence of monetary policy from
foreign monetary policy 1. So, there is the possibility that other channels of
MTM can operate as well. Some evidence of credit channel functioning in
Ukraine was found by Kryshko (2002). He also made an assumption of the
existence of interest rate channel of MTM in this country. But as a wholeMTM has not been investigated in Ukraine yet.
Strong IMF’s recommendation to the NBU to turn to the regime of
inflation targeting makes a more thourough investigation of Ukrainian MTM
even more important task (IMF, 2005). Due to considerable policy lags, using
inflation as a target anchor requires very good forecast of future price
1 De jure a number of permits is needed to make an international capial transaction, which results in
both additional costs and time lags of capital movement.

8/2/2019 Interest Rate Pass Through in Ukraine
http://slidepdf.com/reader/full/interest-rate-pass-through-in-ukraine 11/81
movements, thus calling for an appropriate econometric model of MTM.
When being an intern in the Research department of the National Bank of
Ukaraine the author was involved in the first attempts of monetary policy
makers to describe the core channels of MTM in Ukraine, which motivated
the current research interest rate pass through.
Since the interest rate pass through is the process of transforming
changes in policy and market interest rates into bank retail rates, it is
important part of such channels of MTM as interest rate channel, credit
channel and asset price channel. Therefore, the quicker and fuller pass
through is a necessary condition for operation of these channels. Which in
turn implies better economic performance. For example, through interest rate
channel the Central Bank can make expansionary monetary policy by lowering
interest rate, which in turn leads to the increase in investment and aggregate
demand. Or, if credit channel operates in the economy, decrease in the short
term interest rate will lead to the increase in the net wealth of economic
agents, which in turn increases the capacity to obtain a loan, which provokes
investment and aggregate demand expansion.
A significant effect of interest rate pass through on possible
operation of some MTM channels was noticed only decade and a half ago
(Lowe and Rohling, 1992, Cottareli and Kourelis, 1994). Therefore, the share
of studies dealing with the estimation of interest rate pass through is very
small in the bulk of MTM literature. Despite the fact that interest rate pass
through is estimated to be heterogeneous across countries there are common
findings on this issue. For example, interest rate pass through is found to be
sticky (or incomplete) in the short run, or in other words, there is very small
reaction of reail interest rates to the changes in the reference rate (market or
policy nominal interest rate ). On the other hand, interest rate pass though
appears to be complete in the long run, or in other words, there is one to one
relation between changes in reference rate and in retail rates. Some research
on interest rate pass through is concerned with testing for asymmetry in this
process (whether interest rate pass through depends on the direction of
2
8/2/2019 Interest Rate Pass Through in Ukraine
http://slidepdf.com/reader/full/interest-rate-pass-through-in-ukraine 12/81
changes in reference rate), even though there are no consistent evidence on
this issue.
While a considerable amount of studies estimated interest rate pass
through both in developed and developing countries, using either cross
country data or data for one country, Ukrainian pass through process was not
subject to research of neither cross countries studies, nor a paper focusing
only on one economy. This paper is aiming to fill this gap in the research on
interest rate pass through in Ukraine. Particularly, such issues as
completeness of pass through both in the short run and in the long run,
asymmetry in the interest rate pass through process, and the possibility of
independent monetary policy in Ukraine are of main interest of this research.
Therefore, this thesis will make a considerable contribution to the knowledge
of interest rate pass through in Ukraine, and test the assumption of Ukrainian
policy makers about absence of links between policy interest rate and retail
rates.
The rest of paper is organized as follows. Chapter 2 provides description
of literature review of interest rate pass through investigation. Chapter 3
describes methodology we use in our research. Chapter 4 gives data
description and Chapter 5 provides results of an empirical analysis. Chapter 6
concludes.
3
8/2/2019 Interest Rate Pass Through in Ukraine
http://slidepdf.com/reader/full/interest-rate-pass-through-in-ukraine 13/81
C h a p t e r 2
LITERATURE REVIEW
This section is organized in the following way. First, four theories which
explain interest rate stickiness are presented. Then, the well-known paper of
Caureliss and Kotarelli(1994), that initiated the estimation of interest rate pass
through, is described. The question of whether single monetary policy has the
same effect on different EU countries pushed many researches investigate
this issue. Their work is summarized in next section. Then we describe the
investigation of interest rate pass through in CEEC countries which recently
joined EU. After that review of literature dealing with analysis of pass through
process for the single country is given. The chapter finishes with the
description of studies concentrating on the financial structure of the economy
while interest rate pass through issue is being investigated.
The issue of interest rate pass through is relatively new and started to be
investigated only nearly fifteen years ago. Most of them explore this issue
using empirical estimation. Only few try to explain interest rate stickiness
theoretically. According to Lowe and Rohling (1992) there are several theories
suitable to justify price stickiness in financial markets. Among them are
agency costs (Stiglitz and Weiss, 1981), adjustment costs (Cottareli and
Kourelis, 1994), switching costs (Lowe and Rohling, 1992) and risk
sharing(Fried and Howidd, 1980). Agency costs appear as a result of asymmetric information. As market interest rate increases, banks do not
necessary respond by raising loan rate proportionally to it. If loan interest rate
increases, firms with the safest projects and therefore rellatevely low rate of
return will refuse from banks’ funding. Therefore, the share of bank’s clients
with riskier investment opportunities rises. Moreover, with the increase in
interest rate firms will be willing to undertake riskier investment projects. Due
to these reasons the probability of default on bank loans enlarges. Therefore,
4

8/2/2019 Interest Rate Pass Through in Ukraine
http://slidepdf.com/reader/full/interest-rate-pass-through-in-ukraine 14/81
with the increase in loan rate the risk-adjusted expected receipts to banks will
not necessary rise. Consequently, banks will try to ration the credit and set
loan rate below the market interest rate.
The theory of switching costs applies to markets where transactions costs
and costs of acquiring new information are very high. Since for a bank one
customer is not the same as another, bank should find clients with the better
risk profile. But searching procedure is not without cost, which is transferred
to customers in the form of additional fee. This additional payment (switching
costs) makes it costly for a client to switch from one bank to another, which
results in a retail interest rate pass through from market interest rate to be less
then one (Lowe and Roling, 1992).
Adjustment costs theory states that banks will not respond to change in
market interest rate when cost of adjusting to new loan rate exceeds the cost
of keeping old loan rate. It may happen because of two reasons. Firstly, the
cost of keeping non-equilibrium rate is positively related to the elasticity of
demand for loans. The latter will be smaller in markets with higher barriers to
entry, less competitors and no alternative sources of finance. And secondly,
banks may not adjust their loan rate if they expect the change in market
interest rate to be temporary (Cottarelly and Kourelis, 1994).
In addition, risk sharing theory explains lending rate stickiness in the case
when borrowers are more risk averse than stakeholders of the banks. If clients
demand more stable interest payments, banks will charge higher additional fee
to compensate themselves for paying interest rate less flexible than their
marginal cost of funds, so that average interest receipt of the bank will be
higher then in the case of flexible interest rates on deposits. Borrowers
consider this fee as an insurance premium. They will not change the bank
because of presence of switching cost. As a result we obtain lending rate
stickiness (Fried and Howitt, 1980). In our research, we will try to find the
source of interest rate stickiness for the case of Ukraine, and attribute it to
one or several of these theories. This theory may be the most suitable to
5

8/2/2019 Interest Rate Pass Through in Ukraine
http://slidepdf.com/reader/full/interest-rate-pass-through-in-ukraine 15/81
explain stickiness of lending rate in Ukraine, because it incorporates the
structure of financial market and institutional arrangement of the country.
The amount of studies trying to investigate how changes in the policy
interest rate are transmitted into changes in the short/long term market and
retail interest rate constitute very small part in the bulk of literature dealing
with the estimation of the MTM as a whole (e.g. Sander and Kleimeier, 2004,
Cottarelli and Kaurelis, 1994, and Bondt, 2002). Cottarelli and Korelis(1994)
are the first to suggest the measure of retail rates stickiness to changes in
market rates. They estimate interest rate pass through in 31 developed and
developing countries and reveal that short term pass through to lending rates
is incomplete and rather different across countries. Moreover, authors try to
explain the degree of interest rate stickiness observed across countries by
regressing the pass through on different characteristics of each country’s
financial market structure. They reveal several factors that reduce the
inflexibility of retail rates. Among them are the absence of constraints on
capital movements, high degree of competition in banking sector, private
sector ownership of banking system, and the presence of alternative sources
of financing. Additionally, discount rate is found to have strong effect on
reducing interest rate stickiness in the developing countries, but the strength
of this effect was decreasing substantially when discount rate was used
repeatedly in a signaling purpose. But results obtained in this study should be
interpreted with the caution, since authors estimate nonstationary time series
by OLS, because methodology dealing with such data was not developed at
that time.
Following by the study of Cottarelli ad Kaurelis (1994), several authors
continue exploring interest rate pass through in across country perspective,
applying more advanced empirical technologies. Researchers use VAR model
for time series, and panel data models for estimation of pass through both
across countries and time. Also, error correction mechanism is employed to
test for convergence of different countries lending rate pass through. While
the set of countries differ across papers, the main results are the same – the
6

8/2/2019 Interest Rate Pass Through in Ukraine
http://slidepdf.com/reader/full/interest-rate-pass-through-in-ukraine 16/81
transmission of changes in the policy and market rates to retail rates is not full
in the short run for all countries, although the size of pass through differ
across states. In the long run lending rate pass through is estimated to be
complete.
Testing for asymmetry in the interest rate pass through process constitutes
an integral part of the research on this issue. The techniques used for
estimation of asymmetry vary across studies. For example, Bond at all (2005)
divide their sample into two subsamples regarding whether reference rate is
above or below its equilibrium level. Lim (2001) and Burgstaller (2005)
interact the reference rate with an indicator function, that shows the direction
of movement of this rate. The nature of tested asymmetry is also different.
While some authors are trying to find irregularity of pass through depending
on whether reference rate is above or below its equilibrium level, others test
the asymmetry arising when policy/market interest rate increases or decreases
(Mojon, 2000). There is evidence that interest rate pass through is quicker
when the reference rate moves to its equilibrium level from above than in
case when it moves from below(Kleimeier and Sander, 2000). Besides these
results, it is found that the timing of the response to change in market rates
depends on whether these rates are increasing or decreasing (Borio and Fritz,
1995, Burgstaller, 2005). In the short run lending rates appear to react faster
and more completely when reference rate increases than when it is decreases,
even though in some studies this difference is found to be insignificant (Borio
and Fritz, 1995, Sander and Kleimer, 2004). For example, in the long run
there is no evidence on asymmetries in the interest rate pass through in Italy.
(Gambacorta L. and S. Iannotti, 2005). Also, the difference between market
and retail bank rate influences the stickiness of pass through. Rosen (2002)
finds that the longer is the gap between market and bank deposit rate the
smaller is the reaction of deposit rate to the changes in the reference rate. In
our research we will mainly follow Burgstaller (2005) by using VAR model to
test for asymmetry in interest rate pass through, but the method of estimating
7

8/2/2019 Interest Rate Pass Through in Ukraine
http://slidepdf.com/reader/full/interest-rate-pass-through-in-ukraine 17/81
asymmetry is one of the author, and it was not used in any of the known to
the author studies.
With the creation of European Monetary Union, a number of studies
investigating the impact of single monetary policy on EU countries appeared.
Using monthly panel data, responses of retail rate to policy rates in 6 largest
European countries are estimated during two main interest rate cycles, from
1979 to 1988, and from 1988 to 1998, Mojon (2000) finds the faster reaction
of borrowing rates to changes in market rates since the introduction of
common currency, even though these responses are heterogeneous across
countries. Updating the estimation approach of Caturreli and Korelis (1994)
by using the error correction mechanism, Toolsema et all (2002) also
investigate whether the effect of monetary policy on retail rates has evolved
over time. They use monthly data from 1980 to 2000 for 6 EU countries and
find no convergence of monetary transmission since the start of EU. ECB
policy decisions are found to alter the interest rate in EU countries differently,
consequently making the conducting of single monetary policy more
complicated. In contrast to these two studies, Bondt (2002) employs sample
period from January 1996 to May 2001 for several EU countries. She uses
several empirical techniques, error correction model and VAR model, and
analyzes the market and bank interest rate of the same maturity. While
estimating interest rate pass through the researcher confirms the finding that
transmission of changes in markets rates to retail rate has begun faster since
the introduction of Euro. The rise in pass through is explained by the increase
in banking competition since the introduction by EU. Oppose to Bond
(2002), Sander H, and S. Kleimeier (2003) tested structural break in the data
for UE countries interest rate. They reveal that changes in the relationship
between market and bank interest rates have happened before the creation of
single monetary union. The increase in the interest rate pass through is
explained by the banking sector reforms proceeding the entering of EU by
these countries. Moreover, using cost of fund approach no improvement in
pass through process since the introduction of EU is found in this paper. But
8

8/2/2019 Interest Rate Pass Through in Ukraine
http://slidepdf.com/reader/full/interest-rate-pass-through-in-ukraine 18/81
taking into account short sample period authors attempt to report results with
causation. In our research we will follow the recommendation given in the
papers described above while testing for structural break in the relationship
between interest rates. Moreover, since the data sample for our estimation is
also short, using the same techniques for estimation interest rate pass though
as in Bond (2002) makes our results more comparable to those received in
this study.
Also the structure of financial sector has an influence on the magnitude
and timing of pass through effect. For a bank with a very strong market
power interest rate pass through is incomplete, while competitive
environment of banking sector push the pass through up to one (Bondt,
2002, Mojon, 2000). However, the degree of competition plays more
important role for the deposit rates pass through than for the lending rates
pass through (Coricelly et all, 2006). Kot (2004) reveals that the higher the
competition among banks is the faster and with higher magnitude the
transmission of policy rate changes into changes in the retail rates is. The
researcher gives possible explanation of discrepancies in the interest rate pass
through in euro zone and EU accession countries by the different degree of
competition in banking sector in these countries. The presence of
competition from additional sources of investing enlarges the pass through
from market rates to bank rates (Mojon, 2000). Some researches investigate
how magnitude and speed of pass through from market rates to retail rates
depends on competition within banking sector in one country. Cotarelli et. all
(1995) find that Italian bank which operates in local credit market with high
degree of concentration experiences larger retail rate stickiness, then the one
in more competitive area.
Most studies of interest rate pass through in transition countries are
motivated by the accession of the CEEC to the EU. They intend to
investigate whether the single monetary policy has the same effect on the
developing countries as it has on developed ones. For example, in Poland,
Hungary and Czech Republic the long run pass through from policy to retail
9

8/2/2019 Interest Rate Pass Through in Ukraine
http://slidepdf.com/reader/full/interest-rate-pass-through-in-ukraine 19/81
rates was found to be very heterogeneous across countries. With the help of
Autoregressive distributed lag model (ARDL) it is estimated that the
transmission of changes from policy rates to lending rate tends to be rather
full in the short run. On the other hand, deposit rate pass through appears to
be sticky both in the short run and in the long run in these countries. Also,
there is no evidence of asymmetric behavior of the speed of the pass through
depending on whether policy interest rate increases or decreases for these
countries (Egert et. all, 2004).
Crespo-Cuaresma et al. (2006) explore interest rate pass through in five
CEEC countries (the three countries mentioned above plus Slovenia ad
Slovakia are investigated) and three euro area countries. Besides investigating
the pass through from market to retail interest rates, the full transmission
from policy to deposits and lending rates via market rates is estimated using a
VAR model. Little evidence on transmission of policy rates into long run
market rates is found, and this is explained by instability of yield curve in
CEEC countries. But policy rate appears to have effect through money
market and T-bill rate on long run retail rates. Even though interest rate pass
through in CEEC countries is estimated to be on average higher then in EU
countries, it is declining over time. This puts question on the existing in these
countries beliefs about the increasing competition in CEEC banking sector.
Retail rate pass through are found to be on average lower then those
reported in the literature, but rather complete pass through to corporate
lending rates was found in all five CEEC countries. The authors explain this
by the fact that they do check for existence of cointegration relationship
between interest rates. Preceding to their work studies, error correction model
was employed without checking for cointergration, which may exists only for
several bivariate interest rate relationships. Therefore, wrong assumption of
existence of long-term relationship between interest rates may lead to
different results. Also, oppose to the early findings, significant discrepancies
between interest rate pass through are detected when policy interest rate have
different direction of changes.
10

8/2/2019 Interest Rate Pass Through in Ukraine
http://slidepdf.com/reader/full/interest-rate-pass-through-in-ukraine 20/81
Some homogeneity in the pass through to lending rates in the four
Common Monetary Area (CMA) countries of the South Africa Customs
Union (SACU) is detected. But pass through to deposit rates appears to be
rather heterogeneous across these countries. Moreover, pass through to
deposit rates is more asymmetric than the one to lending rates. All this
findings may be explained by the low competition of the banking sectors of
the members of SACU (Sander H. and S. Kleimeier, 2006).
To compare interest rate pass through in five CEEC countries described
above with the one in Rumania, Tieman (2004) uses the error correction
model. Romania with very similar to Ukrainian conditions in financial sector
(excess liquidity in banking sector and underdeveloped financial markets) was
hypothesized to have weaker pass though from policy to market and retail
rates as compared to other CEEC countries. However, the obtained results
contradicted this assumption. Estimates of interest rate pass through from
policy rates to credit and deposit rates are found to be very similar to ones
obtained for these CEEC countries. But unlike the CEEC countries, the
transmission of changes in policy rates to changes in market rates have
strengthened over time, what is consistent with the observable increase in
competition in banking sector.
In some studies interest rate pass through is estimated using bank level
data It appears, that the structure of the banking sectors has significant
influence on the transmission of changes from policy/market to bank retail
rates. For example, for both Chile (Berstein S. and R. Fuentes, 2003) and
Germany (Weth, 2002) the pass through to lending rates charged by bigger
banks is faster, than the ones to lending rates charged by smaller banks. Also
pass through depends on type of banks’ customers. The larger the share of
household consumers, the faster bank credit rate reacts to the changes in
reference rate. And the smaller portion of long term business with firms and
households bank has the faster interest rate pass through from market rates is.
Additionally, banks that rely on savings deposit to fund their loans react
slower to the changes in the reference rate (Weth, 2002).
11

8/2/2019 Interest Rate Pass Through in Ukraine
http://slidepdf.com/reader/full/interest-rate-pass-through-in-ukraine 21/81
Interest rate pass through also differs across instruments. In most
literature pass through to corporate lending rate is higher than to deposit or
household credit rates. At the same time, overnight deposits are much less
responsible to changes in reference rate than short or long-tern deposit rates
(Crespo-Cuaresma at al., Mojon, B., 2000). Also, the lower the maturity of
bank interest rate the higher interest rate pass-through to it is (Sander H. and
S. Kleimeier, 2003)
Some authors tested whether deposit rates have effect on lending rates. In
the literature related to banking efficiency and productivity there are two
approaches concerning banks’ deposits. Asset or intermediation approach
views them as inputs to bank lending activity, while the service provision or
production approach consider deposits as one of the main services provided
by banks to their clients (Mlima and Hjalmarsson, 2002 ). Most results
received from analyzing data on this issue conclude that deposits are outputs
of banking activity (Fixler and Zieschang, 1999).
To summarize main findings from literature dealing with estimation of the
pass though, the following conclusions can be made. The lending rates are
very sticky with respect to movements into policy and market rates in the
short run, while in the long run there is almost complete pass through. The
process of transmissions of changes in policy/market rate to retail rates is
flowing differently across countries, and there is no convergence of pass
through among countries in the long run. The structure of financial market
and institutional arrangement inside the country are the main factors that
contribute to variability of path through across countries.
We are not aware of any attempts to measure interest rate pass through in
Ukraine. Moreover, Ukraine was not included in any set of countries while the
estimation of interest rate pass through was done in cross countries
perspective. Therefore, we expect our work significantly contribute to the
world literature and answer question about possibility of existing interest rate
channel of MTM in Ukraine.
12
8/2/2019 Interest Rate Pass Through in Ukraine
http://slidepdf.com/reader/full/interest-rate-pass-through-in-ukraine 22/81
C h a p t e r 3
METHODOLOGY
A VAR framework
The issue of interest rate pass through is usually estimated using one of
the following methodologies: panel data estimation, error correction model,
and vector autorregression model. The first approach is based on the
pioneering work of Cottarelli and Kourelis(1994). Authors estimate interest
rate pass through in the cross country perspective, trying to reveal and explain
the heterogeneity in the interest rate pass through process across different
countris. This framework is not suitable for our study, as we explore this topic
in the perspective of only one country, Ukraine.
The main assumption of the second approach, error correction model,
is that market interest rates are weakly exogenous to bank retail rates, which is
not appropriate in case of Ukraine. The reason is the following. In this study
we consider interbank lendig interest rate to be a proxy for market interest
rate. And, not only the NBU but also retail banks can influence interbank
rate. For example, suppose that there is positive shock to the demand for
loans in the economy. Then bank lending rate increases. In this situation
banks may need more funds to satisfy the loan demand. Therefore, the
demand for interbank loans increases forcing interbank lending rate to go up. The model for our estimation of pass through process uses the third
approach, VAR methodology, because it allows incorporating possible
influence of bank retail rates on market rates. We will employ two approaches
while estimating interest rate pass through: cost of funds approach and
monetary policy approach.
13

8/2/2019 Interest Rate Pass Through in Ukraine
http://slidepdf.com/reader/full/interest-rate-pass-through-in-ukraine 23/81
3.1. Cost of Funds Approach
This approach is the best method to describe the second stage of interest rate
pass through, or , transmission changes in market interest rates to bank retail
rates. There are several reasons for bank deposit and lending rates to be
influenced by market rates. Firstly, banks can rely on money market resources
to fund their short term loans. Secondly, the yield on government securities
can be viewed as opportunity costs for banks’ loans. Because of this the link
between the yield on government bonds and long term bank lending rate
should exist. Thirdly, banks can rely on money market rates instead of
deposits for funding loans. This can explain why bank deposit rates should
incorporate market rates. Also, households and non financial sector can save
its funds instead of deposit in form of government securities of comparable
maturity (Crespo-Cuaresma et al., 2006).
3.2. Monetary Policy Approach
This approach assumes the availability of direct link between policy interest
rate and bank retail interest rates. There are several explanation for bank
deposit and credit rates to be influenced by discount rate. Firstly, discount
rate is the cost of banks’ refinancing. Secondly, policy rate signals about future
stance of monetary policy and helps to form public expectations about
monetary policy actions. And finally, discount rate influences money market
interest rates, which in turn affect bank retail rates. But, according to Sander
and Kleimeier, 2004, the direct relationship between policy and bank retail
rates can only exists in the case of stable yield curve.
14

8/2/2019 Interest Rate Pass Through in Ukraine
http://slidepdf.com/reader/full/interest-rate-pass-through-in-ukraine 24/81
3.3. Testable Hypothesises
In this study we will investigate the path of transmission of changes in policy
rate / market rate to retail banking rates described in Chart 1.
Chart 1. The Transmission between Policy and Retail Rates
Source: Crespo-Cuaresma et al., 2006.
We wil investigate the following relationships between interest rates:
1) Policy interest rate Bank deposit interest rate (Monetary Policy
Approach);
2) Policy interest rate Bank credit interest rate (Monetary Policy
Approach);
3) Market interest rate Bank deposit interest rate (second stage of
Cost of Funds Approach);
4) Market interest rateBank credit interest rate (second stage of Cost
of Funds Approach);
5) Policy rate Short term market rate Long term market rate
Bank deposit ineterst rate Bank credit interest rate (Cost of Funds
Approach)
In this study the following hypothesis wil be tested;
1)
Complete pass-through from the reference interest rate to the bank retail rate in the long run;
2) Policy interest rate can affect bank retail interest rates;
3) Pass through is not different in different segments of Ukrainian
economy (e.g. household sector vs. firms’ sector);
4) Pass though is not different across instruments ( e.g. we want answer
the question wether pass though differs across interest rates
denominated in different currencies, with different maturities);
15

8/2/2019 Interest Rate Pass Through in Ukraine
http://slidepdf.com/reader/full/interest-rate-pass-through-in-ukraine 25/81
5) There are no asymmetries in interest rate pass through process.
3.4. Bivariate Var Approach
Following Bondt (2002), the next uniform specification will be used while:
, (1)t
K
k
k t t e AY cY ++= ∑=
−1
With , , , ;⎥⎥⎦
⎤
⎢⎢⎣
⎡=
R
t
B
t
t i
iY
⎥⎥⎦
⎤
⎢⎢⎣
⎡=
R
B
c
cc
⎥⎥⎦
⎤
⎢⎢⎣
⎡=
R
k
R
k
B
k
B
k
ba
ba A
⎥⎥⎦
⎤
⎢⎢⎣
⎡=
R
t
B
t
t e
ee
Where
B
t i - bank retail (deposit or credit) ineterst rate;
R
t i - reference rate: policy interest rate (Monetary Policy Approach) or market
interest rate (Cost of Funds Approach);
This specification is suitable in case when interest rate series are stationary. If
at least one of the two series is integrated of order k, we should take k’th
differences of both series, and only then run model (1).
To determine lag order we will use such criteria as Akaike, Hannan Quin,
and Schwartz, but bearing in mind that our sample is short. Therefore,
underestimation is considered to be a smaller problem, then overestimation of
lag order. Thus, in case of discrepancies between different test we will focus
on Schwartz criterion, which is more suitable for short sample.
To determine which exactly market interest rate to use we will perform
correlation analysis and for each bank retail rate we will select appropriate
market rate, which has with bank rate the highest correlation coefficient. This
procedure of selecting reference rate is common to the literature (Bond, 2002,
Sander and Kleimeier, 2004). Sometimes, researches propose select market
interest rate that match the maturity with bank interest rate. But, it is not
always possible to find for each bank retail rate reference rate of comparable
maturity (Sander and Kleimeier, 2004). So, additionally, we will select the
reference rate based on matching the maturity approach.
16

8/2/2019 Interest Rate Pass Through in Ukraine
http://slidepdf.com/reader/full/interest-rate-pass-through-in-ukraine 26/81
In solving identification problem we will assume that shock in retail
interest rate does not have simultaneous effect on market interest rate. This
restriction makes sense, because we want to investigate how exogenouse
shock to market rate is transmitted to bank interest rate. Therefore, we can
use Cholesky decomposition with the lower zero triangular matrix of imposed
restriction. In this approach shock in market interest rate could
contemporaneously cause retail bank interest rate, but not the other way
around.
3.5. Test for asymmetric interest rate pass through
To investigate the asymmetry in interest rate pass through process using
VAR framework we will follow slightly modify the Burgstaller(2005)
approach. Opposite to Burgstaller (2005) we will use structural Var not
reduced form VAR and test for asymmetry using IRF approach. This is the
innovation of methodology used in this thesis. The equation from the
systems of VAR equations for bank interest rate has to be of the following
form:
∑=
−−−−− +++++++=K
k
B
t k t k k t
R
k t k
R
k t k
B
k t k t
R
t
R
t
B
t e I I iii I iii1
00 )( δ γ β α γ β µ (2)
Here it is again assumed reference interest rate contemporaneously affect the
retail rates, but not vice versa. is the dummy variable indicating the case
when reference interest rate is falling. Then
t I
k
β coefficient will capture the
effect of rising market rates.
3.6. Multivariate vector autoregression model
After establishing pair wise links between market and retail rate, we consider
multivariate models of interest rate pass through. Firstly we should determine
whether deposit rates influence pass through process of lending rates(Bondt,
17

8/2/2019 Interest Rate Pass Through in Ukraine
http://slidepdf.com/reader/full/interest-rate-pass-through-in-ukraine 27/81
2002). Since some banks can finance loans by raising deposits rather than
issuing securities, the deposit interest rate may serve as marginal cost for loan
interest rate. For each particular lending interest rate we determine deposit
rate which has the highest correlation with it and include it in the regression.
Then the following model is tested:
, (3)t
K
k
k t t e AY cY ++= ∑=
−1
with , ,
⎥⎥⎥⎥⎥⎥⎥
⎦
⎤
⎢⎢⎢⎢⎢⎢⎢
⎣
⎡
=
BL
t
BD
t
ML
t
MS
t
Pt
t
i
i
i
i
i
Y
⎥⎥⎥⎥⎥⎥⎥
⎦
⎤
⎢⎢⎢⎢⎢⎢⎢
⎣
⎡
=
BL
BD
ML
MS
P
c
c
c
c
c
c
⎥⎥⎥⎥⎥⎥⎥
⎦
⎤
⎢⎢⎢⎢⎢⎢⎢
⎣
⎡
=
BL
k
BL
k
BL
k
BL
k
BL
k
BD
k
BD
k
BD
k
BD
k
BD
k
ML
k
ML
k
ML
k
ML
k
ML
k
MS
k
MS
k
MS
k
MS
k
MS
k
Pk
Pk
Pk
Pk
Pk
gh f ba
gh f ba
gh f ba
gh f ba
gh f ba
A
⎥⎥⎥⎥⎥
⎥⎥
⎦
⎤
⎢⎢⎢⎢⎢
⎢⎢
⎣
⎡
=
BL
t
BD
t
MLt
MS
t
P
t
t
e
e
e
e
e
e
Where -interest rate on bank loans at period t, - interest rate on bank
deposits at period t , - long term market interest rate, -short term
market interest rate, - policy ineterst rate at period .
BL
t i
BD
t i
ML
t i
MS
t i
P
t i t
Since bivariate VAR is a partial case of Multivariate VAR model, why do we
need estimate bivariate VAR model? There are several explanations. Firstly,
most studies estimating interest rate pass through use bivariate VAR model,
and even when some of them use multivariate VAR, the bivariate VAR model
is estimated as well. Therefore, running bivariate VAR model will make our
estimates of interest rate pass through comparable to the literature. Secondly,
given very short sample period of data, estimation of model with smaller
18

8/2/2019 Interest Rate Pass Through in Ukraine
http://slidepdf.com/reader/full/interest-rate-pass-through-in-ukraine 28/81
number of variable will lead to smaller standard errors. Thirdly, bivariate VAR
allows to estimate Marginal Cost approach directly. And finaly, we can not use
Multivariate VAR for the case of bank retail rates denominated in foreign
currency, because policy interest rate is only denominated in UAH.
Before estimating regression (3) we will perform Granger causality test to test
whether deposit rates Granger cause lending rates. If we can reject the
hypothesis that bank deposit rate do not Granger cause bank lending rate, we
will run regression (3). In other case, we will estimate regression (3) without
bank deposit rates. While choosing appropriate lag structure, we will perform
test similar to the case of bivariate VAR. To solve the identification problem,
we will use the following statements known from the Monetary Economics.
1) Policy interest rate can only influence short term nominal interest rate;
2) According to the expectation theory of interest rate, long tern interest
rate is the average of current short term interest rate and expected
future short term interest rates. Therefore, short term interest rate
influences long term interest rate;
3) While making consumption/investment decisions, public concerns
only about real interest rate.
Bearing in mind these facts, we can construct the following chain of
transmission of changes in policy interest rate to bank retail rates:
→∆→∆→∆ ratetermlongratetermshort rate policy
ratecredit bank ratedeposit bank ∆→∆→
In solving identification problem we will assume that contamporaneously
interest rate from the chain above can not influence rates, which preceed
it in this chain. Therefore, we can use Cholesky decomposition with
upper triangular matrix to solve identification problem.
19

8/2/2019 Interest Rate Pass Through in Ukraine
http://slidepdf.com/reader/full/interest-rate-pass-through-in-ukraine 29/81
C h a p t e r 4
DATA DESCRIPTION
4.1. Data description
Data on interest rate series come from the monthly bulletin of the
National Bank of Ukraine “Visnyk NBU” and official website of the NBU2.
The sample period from January 2000 until November 2006. Each interest
rate series contains 83 monthly observations, and is computed as average
weighted percentage per annum. Relatevely short sample period is a
weakness of the thesis. However, adding observations before 1999 is
inappropriate taking into account high volatility of data after period of
financial crisis of 1998. Moreover, there are big holes in data before 2000 year.
The three broad categories of relevant interest rate series are: interest rates
set by the NBU, interbank interest rate series and retail bank interest rates.
There are three series on policy interest rates: discount interest rate, interest
rate on tender credits, and the NBU overnight interest rate. Interbank rates
consist of deposit interest rates and credits interest rates, which differ across
maturity (deposit rates: up to 1 month, from 1 to 3 months, from 3 to 6
months, from 6 to 12 months, and over 12 months maturity; credit rates:
overnight, from 1 to 7 days, from 8 to 21 days, from 22 to 31 days, from 32 to
92 days, and over 92 days maturity ) and across currency denominated (UAHand US dollar). Bank retail rates series also can be divided into credit and
deposit interest rate series, which in turn differ across maturity (up to 1
month, from 1 to 3 months, from 3 to 6 months, from 6 to 12 months, and
over 12 months maturity), across currency denominated (UAH and US
dollar), and across type of client (households and enterprises). Chart 2 shows
2 www.bank.gov.ua
20

8/2/2019 Interest Rate Pass Through in Ukraine
http://slidepdf.com/reader/full/interest-rate-pass-through-in-ukraine 30/81
the behavior of interbank lending rates and policy discount rate denominated
in UAH. All series fluctuate heavily and have downward trend during the first
part of the sample period.
Chart 2. Market and Policy rates (percentages per annum; m onthly averages)
0,0
10,0
20,0
30,0
40,0
50,0
60,0
70,0
J a n 2 0 0 0
J u n 2 0 0 0
N o v 2 0 0 0
A p r 2 0 0 1
S e p 2 0 0 1
F e b 2 0 0 2
J u l 2 0 0 2
D e c 2 0 0 2
M a y 2 0 0 3
O c t 2 0 0 3
M a r 2 0 0 4
A u g 2 0 0 4
J a n 2 0 0 5
J u n 2 0 0 5
N o v 2 0 0 5
A p r 2 0 0 6
S e p 2 0 0 6
%
Interbank overnight lending rate, UAH
Interbank lending rate fro m 22 to 31 days, UAH
Interbank lending rate fro m 32 to 92 days, UAHInterbank lending rate over 92 days, UAH
NBU discount rate
Chart 3 and Chart 4 plot hryvna-denominated bank lending and deposit rates
denominated in hryvna respectively. As interbank rates, these series also firstly
have decreasing trend and fluctuate more than in the second part of the
sample. Graphical inspection of the interest rate behavior suggests the
presence of a structural break in the data accounting to mid of 2002.
Chart 3. Bank lending rates
(percentages per annum; monthly averages )
0
10
20
30
40
50
60
70
J a n 2 0 0 0
M a y 2 0 0 0
S e p 2 0 0 0
J a n 2 0 0 1
M a y 2 0 0 1
S e p 2 0 0 1
J a n 2 0 0 2
M a y 2 0 0 2
S e p 2 0 0 2
J a n 2 0 0 3
M a y 2 0 0 3
S e p 2 0 0 3
J a n 2 0 0 4
M a y 2 0 0 4
S e p 2 0 0 4
J a n 2 0 0 5
M a y 2 0 0 5
S e p 2 0 0 5
J a n 2 0 0 6
M a y 2 0 0 6
S e p 2 0 0 6
%
Rate on loans to enterprises up to 1 month, UAH
Rate on loans to enterprises from 1 to 3 months, UAH
Rate on loans to enterprises from 3 to 6 months, UAH
Rate on loans to enterprises from 6 to 12 months, UAH
Rate o loans to enterprises over 12 months, UAH
Chart 4. Bank deposit rates
(percentages per annum; monthly averages)
05
1015202530354045
J a n 2 0 0 0
J u n 2 0 0 0
N o v 2 0 0 0
A p r 2 0 0 1
S e p 2 0 0 1
F e b 2 0 0 2
J u l 2 0 0 2
D e c 2 0 0 2
M a y 2 0 0 3
O c t 2 0 0 3
M a r 2 0 0 4
A u g 2 0 0 4
J a n 2 0 0 5
J u n 2 0 0 5
N o v 2 0 0 5
A p r 2 0 0 6
S e p 2 0 0 6
%
Rate on deposits from enterprises up to 1 month, UAH
Rate on deposit from enterprises fron 1 to 3 months, UAH
Rate on deposits from enterprises from 3 to 6 months, UAH
Rate on deposits from enterprises from 6 to 12 months, UAH
Rate on deposits from enterprises over 12 months
We have tested the structural break using Hansen’s (1992) test on modelstability, which is based on a cumulative sum of the least squares residuals
(CUSUM)3. The advantage of this technique is that it “is appropriate for time
series data and might be used if one is uncertain about when a structural
change might have taken place” (Green, 2000). Also, in contrast to the Chow
3 Test was conducted in STATA8 statistical package using programs written by Sean Becketti (original
version), November 1993, STB-24 sts7_6 and Modified for Stata 6 by Christopher F Baum
([email protected]), 1 March 2000
21

8/2/2019 Interest Rate Pass Through in Ukraine
http://slidepdf.com/reader/full/interest-rate-pass-through-in-ukraine 31/81
test (which is also frequently used in tests for structural break in the literature
(Bondt, 2002 )), this test allows for the unequal disturbance variances in both
samples. From the graphical representation of interest rates behavior we may
conclude that disturbance variance is indeed not equal across the whole
sample. Therefore, using Chow test is not appropriate here.
For the most of bank retail rates the CUSUM test indicates the presence
of structural break in the interval from 28th to 33th observation4. Therefore,
we decided to put the point of structural break to be the 30th observation,
which corresponds to July 2002. An interesting question is what economic
event might have caused the structural break in the interest rate series. Before
the middle of 2002 the NBU was constantly decreasing discount rate to lower
the bank retail rates and stimulate the demand for loans. But 2002 is the first
year of huge increase in real estate prices. This led to increase in demand for
banks loans and to increase in banks’ competition. And if we look at Table 1,
which gives the descriptive statistics of the interest rate series for the whole
sample (first five columns) and for the sample starting from July 2002 (last 5
columns), starting 2002 all interest rate series have lower mean, and variance
is several times smaller comparatively to the variances in the whole sample.
The structural breake may be explained by the natural sequence of envents:
the constant decrease in riskiesness of the loans led to fall in interest rate, but
it should be stopped at some point.
4.2. Correlation Analysis
One insight that economic theory can yield on the determination of retail
bank rate is to represent the latter as a function of another interest rate or
combination of rates. These rates can be thought as the opportunity cost of
bank lending decisions. For example, when bank maximizes its profit it is the
marginal cost that matters. Money market rate is the most widely used rate to
4 Results of the test for the structural break are available from the author upon request.
22

8/2/2019 Interest Rate Pass Through in Ukraine
http://slidepdf.com/reader/full/interest-rate-pass-through-in-ukraine 32/81
determine the marginal cost of funds or revenue foregone in making the loan.
However, other rates can influence bank lending rates. For example, policy
rate may be a better indicator of marginal cost of funds in the following cases.
Firstly, when money market is highly volatile the policy rate can signal about
persistent movements of money market rates, rather than their transitional
behavior. Secondly, in the model of uncertainty with withdrawal of deposits
and illiquidity of loans, penalty costs of the Central Bank is what really
matters in setting interest rates by bank (Borio, 1995). Because in the case of
unexpected withdrawal of deposits bank has to borrow funds from the
Central Bank. And the policy interest rate is the cost of borrowing these
funds.
A distinction should be made between monetary policy and cost of funds
approaches when selecting an appropriate reference rate (changes in which
are transmitted into retail rates). As it was said in the methodology section,
the data on three types of policy interest rates is available: the discount rate,
overnight interest rate, and interest rate on tender credits. The interest rate on
tender credits is the least appropriate policy interest rate in our case because
of the following reasons. Firstly, it is not completely determined by the NBU.
The NBU only sets the lowest interest rate under which it is willing to lend
funds. Actual tender interest rate is determined through auction procedure.
But, there were months during which there were no tender credit auctions. In
these cases there is no data on interest rate on tender credit. The absence of
credit auctions can be explained by the several reasons. For example, there
were no demand for the NBU credits or the NBU was not willing to give
tender credits. Therefore, we can not fill missing data, because we do not
know the actual reason for the absence of each particular observation.
The second policy interest rate is the NBU overnight interest rate. It
always should be not less than discount interest rate. However, the actual
procedure how the overnight interest rate is determined is not evident. There
is a suspision that policy makers can refinance banks ‘favorable’ for them and
set low overnight rate.Moreover, the NBU overnight rate has only one night
23

8/2/2019 Interest Rate Pass Through in Ukraine
http://slidepdf.com/reader/full/interest-rate-pass-through-in-ukraine 33/81
maturity, and it is less likely, that it contains more information about
monetary policy stance than the NBU discount rate. Therefore, we will use
the NBU discount rate as policy interest rate. Besides the fact that it signals
about monetary policy stance, it is also a basis for formaulating other policy
interest rates, and lehally it is very difficult for the policy makers to use it to
reach their short term private objectives.
In majority of research dealing with interest rate pass through money
market interest rate is selected as the one that represent marginal cost of
funds for retail bank interest rates (Bondt, 2005 and Sander and Kleimeier,
2004a). In this section we conduct correlation analysis aiming to detect the
money market rate which exhibits the highest correlation with retail bank
interest rate5. The reference rate for bank lending and deposit rates is selected
among such money market rates as interbank overnight credit rate, interbank
credits rates of maturities up to 7 days notice, from 8 to 21 days, from 22 to
31 days, from 32 to 92 day, and with the notice more than 92 days. For both
bank deposit and lending rates the market rate denominated in the same
currency is selected. Correlations are computed both across maturity and
different lags of market interest rate.
The results of correlation computations for the whole sample starting in
2000, January and subsample starting from 2002, July to 2006, November are
presented in Table 2, Table 3, and Table 4 respectively. In the second column
reference rate which has the highest correlation with the bank retail rate
during the whole sample is presented, while the fifth column gives the market
rate which has the highest correlation with appropriate retail rate during
subsample period. Third and sixth columns give the corresponding
correlation coefficients. And the sixth column presents the market rate
chosen as marginal cost for retail bank rate in case of both periods. For credit
rates denominated in UAH the correlation coefficients varies from 0.45 to
0.91. Interest rates on credits to enterprises exhibit higher co movements with
5 Sander and Kleimeier (2004 a) suggest to use the market rate of comparable maturity as the marginal
cost. We tried to do this but received insignificant results. It may be because it is not always possible
to match the maturities of retail and reference rates.
24
8/2/2019 Interest Rate Pass Through in Ukraine
http://slidepdf.com/reader/full/interest-rate-pass-through-in-ukraine 34/81
market rates than the ones on credits to households. In most cases for credit
rates the lag with the highest correlation is zero, implying that lending rates
collectively react with the same speed to the changes in market rates. The
correlation coefficients, lag order and reference rates for the credits rate in the
case of shorter subsample are nearly the same as the ones in the whole
sample. This suggests that interest rate pass through process to credit rates
does not change after 2002. The only unexpected result is the negative
correlation coefficient near long term credit rate to households. Other
correlations coefficients between long tern credit rate to households and
market rate are also negative for the case of whole sample. This might imply
that interbank interest rate is not an appropriate measure of marginal cost for
the long term rate on credit to households redeemable in UAH. In addition, it
may be explained by the fact that market for this type of credit has not been
developed very well in Ukraine6.
The correlation coefficients between lending interest rates and market
interest rates denominated in US dollars are on average lower than the ones
between lending rates denominated in UAH. In both whole and short sample
the most appropriate measure of marginal cost is interbank lending rate with
over 92 days notice. The correlation coefficients vary between 0.55 ( long
term credits to households) and 0.79 (credits to firms with maturity more than
6 months) for the case of whole sample, and between 0.249 (credit to
households with maturity from 6 to 12 months) and 0.418 (credits to
households with maturity from1 to 3 months). The correlation coefficients
for the short sample are on average two times lower suggesting the decrease
in interest rate pass through for the lending rates redeemable at US dollar
since the structural break period.
Turning to the case of deposit rates redeemable in UAH, correlation
coefficients vary between 0.48 and 0.75 for the whole sample, and between
0.17 and 0.40 for the subsample. Lower correlations in the second period
6 The amount of long term credit given to natural persons is in 10-15 times lower than the ones given to
firms. Conclusion is drawn from the author’s first look at the data. Numerical illustration of this
statement is in the process of development.
25

8/2/2019 Interest Rate Pass Through in Ukraine
http://slidepdf.com/reader/full/interest-rate-pass-through-in-ukraine 35/81
imply that relationship between market and retail deposit rates became weaker
in the last for years comparatively to the first 2 and one half years. It may have
happened because of the increase in the funding opportunities for the banks,
as well as enhanced competition in the deposit market among banks. Also,
the lag orders increase in subsample comparatively to the whole sample
implying that the speed with which bank deposit rates react to the changes in
the market rate decreased in the last years. It also may be due to banks’
attempt to attract more deposits by raising deposit rates and keeping them
high regardless of market rates movements. But it is only possible in the
short run. The correlation coefficients for the case of credit rates is nearly
two times higher than the ones for deposit rates, suggesting that pass through
to deposit rates is lower than to credit rates.
26

8/2/2019 Interest Rate Pass Through in Ukraine
http://slidepdf.com/reader/full/interest-rate-pass-through-in-ukraine 36/81
C h a p t e r 5
ESTIMATION RESULTS
5.1. Bivariate VAR model.
5.1.1. Marginal Cost Approach
There are two approaches to test interest rate pass through in the literature:
error correction model and structural VAR model. We will employ the latter
model, because the former assumes that market interest rate are fully
exogenous to the retail bank interest rates, while VAR model allows variables
endogenously influence each other7. So, in this section we estimate model (1)
described above.
Dickey Fuller test on stationarity showed that almost all retail bank and
interbank interest rate series in both samples are stationary at 5% or 10%
significance level. Interbank credit rates redeemable in US dollar with maturity
up to 7 days are I(1) in both samples, as well interest rates on credits in
foreighn currency wih maturity higher than 6 months. Policy interest rate are
I(1) process in the short sample. Test statistics are given in Table 5 for the
case of interbank credit rates, bank lending interest rates, and discount rate;
and in Table 6 for the case of bank deposit interest rates. Also we have done
Durbin’s alternative test for autocorrelation for each series. At 5 %significance level we can not reject the null hypothesis of no correlation in
each interest rate series8.
Therefore, we run regression (1) in levels in case of stationarity of both
bank and reference interest rate, and regression (1) is estimated in the first
7 In Ukraine banking sector is the largest and most developed among all financial sectors, therefore it is
very unlikely that bank retail rates do not influence market rates.
8 p-value and chi2 statistics for each interest rate series are available upon request..
27

8/2/2019 Interest Rate Pass Through in Ukraine
http://slidepdf.com/reader/full/interest-rate-pass-through-in-ukraine 37/81
differences when at least one of the two interest rate entering this model is
I(1) process. To determine the VAR lag order we use the Akaike's
information criterion (AIC), Schwartz's Bayesian information criterion
(SBIC), and the Hannan and Quinn information criterion (HQIC). When
they show different lags we choose the lag according to SBIC, because this
test is the most appropriate for small samples. In some cases SBIC can
underestimate the lag order, but in the case of short sample, overestimation
problem is more severe than the underestimation one.
In computing the structural responses of retail bank interest rate to the
impulses in the reference rate the underidentification problem is solved using
Cholesky decomposition (zero lower triangular transition matrix). As it was
said above we make indentification restrictions by assuming that bank rate do
not cause market rate contemporaneously, while the inverse is possible. Since
we are interested how the shocks of the monetary policy are transmitted via
market rates to the bank retail rates, the assumption that shocks to market
rates are exogenous seems reasonable. For each credit and deposit bank rate
we run a VAR model using market rate selected via correlation analysis from
Table 2, Table 3, and Table 4.
After estimating VAR model we check the eigenvalue stability condition.
For all bank retail rates VAR models appear to satisfy stability condition9.
Also, we implement the Lagrangian Multiplier test for autocorrelation in
residuals of VAR model. Mainly, there are no autocorrelation found in VAR
model’s residuals. When the autocorrelation in some lag is detected we try to
vary the number of lags in the model10.
Interest rate pass through coefficients are computed using cumulative
impulse response functions. Since this function gives the response to one
standard deviation shock in the market rate, we divide the values of
cumulative impulse response function by the standard deviation of
corresponding market rate. Immediate pass through estimator is the response
9 Computed eigenvalues for each VAR model are available upon request.
10 P-values and chi2 statistics for each Lagrangian Multiplier test are available upon request..
28
8/2/2019 Interest Rate Pass Through in Ukraine
http://slidepdf.com/reader/full/interest-rate-pass-through-in-ukraine 38/81
of the respective retail rate to the 100 basis points shock in the reference rate
in period zero, short term pass through estimator is the response of this rate
after 1 month, long term pass through estimator – response after 12 months,
and very long tern estimator-the response after 36 months. This classification
is common to the literature. The results of estimation for the whole sample
are given in Table 7 for the case of credit rates denominated in UAH, Table 8
– for the case of lending rates denominated in US dollar, and in Table 9 for
deposit rates denominated in UAH. Several conclusions can be made.
Firstly, the interest rate pass through is not complete in the short run,
which is in line with other empirical findings. In almost all cases
contemporaneous responses of lending rates to 1 percentage point shock to
the reference rate is insignificantly different from zero at 5% significance
level. There are only two cases when the market rate has significant
contemporaneous effect credit rates: credit rates to enterprises with maturity 1
and 12 months, which is equal to 15 and 2 percents respectively. On the other
hand, the only two lending rates redeemable in the USA dollar for which
there is significant contemporaneous pass through are 3 months and 6
months maturity rates to households with interest rate pass through 15 % and
16 % respectively. In a month the pass through to lending rates redeemable in
the USA dollar increases to 1.2%-4% but still remains significantly different
from zero for several rates for households. In all cases with deposit rates
redeemable in UAH contemporaneous pass through is significantly different
from zero, but it is very low ranging from 0.046 for the case of interest rate
on deposit to enterprises for 12 months to 0.31 for this rate with 1 month
maturity.
The short term pass through to interest rates on credit to enterprises is still
not complete, but significant for all rates. It varies between 5 basis points for
the case of lending rate at up to 12 months maturity and 25 basis points in
case of rate up to 1 month maturity. On the other hand, all short term pass
through to lending rates on credits to households are still insignificant. It can
be explained by the inelastic demand for this type of credit, which is likely in
29

8/2/2019 Interest Rate Pass Through in Ukraine
http://slidepdf.com/reader/full/interest-rate-pass-through-in-ukraine 39/81
the case of absence alternative sources of financing. In contrast to the lending
interest rate redeemable in UAH, only three lending rates to households
redeemable at the US dollar react significantly after a month to changes in
reference rate. This are rate with maturity of 3, 6, and more than 12 months
and pass through ranging from 0.22 to 0.4 . Turning to the case of deposit,
interest rate pass through increases in a month and is significant to all but
deposit rate to enterprises with maturity of 12 months. Changes transmitted
from reference to deposit rates ranges from 0.069 for 6 month deposit rate to
households to 0.49 for 1 month deposit rate to enterprises.
Secondly, pass through to lending and deposit rates is higher in the long
term. In case of lending rates redeemable in UAH it varies between 0.39%
(credits to enterprises at 12 moths maturity) and 1.28 % (credits to
households at 3 months maturity). Pass through to lending rates redeemable
at the US dollar fall in the range between 5 % (credits to households at 12
months notice) and 1.26 % ( 6 months credits to households). This pass
through remains insignificantly different from one for the case of lending
rates to firms. After 36 months responses of credit rates to shock in market
rates increase even more. They vary between 0.65 and 2.05 (credits to
households at 3 months maturity redeemable at UAH). Overshooting in the
pass through can mean that banks attempt to increase lending rate by the
higher amount than increase in reference rate to provide themselves with the
risk premium for the increase in the share of more risky borrowers. This
situation is described in detail in the literature review section. The other
explanation for overshooting, which can also explain sticky pass through in
the short run is that menu and switching costs prevents banks from changing
the interest rate too frequently. But when they actually change the credit rate,
they increase (decrease) them by the higher amount then the change in market
rate. But this explanation could be appropriate only in case when banks
expect market rates to change in the same direction11. Even though the pass
11 Autocorrelations for all lending rates are positive assuming these rates to move in the same direction
in te future.
30

8/2/2019 Interest Rate Pass Through in Ukraine
http://slidepdf.com/reader/full/interest-rate-pass-through-in-ukraine 40/81
through to these rates is estimated to be higher than one we can not reject the
hypothesis of equality the pass through to 1 in the long run. But there are still
some lending rates which are insignificant to the changes in the
corresponding market rate (interest rates on credits to households at the 1, 12,
and more than 12 months maturity redeemable at UAH). It can be explained
by the underdevelopment of market for such type of credits. As one looks at
the Chart 5, the amount of credit redeemable at UAH and given to
households is 10-15 times less than the amount of credits given to enterprises
during the period under review. Oppose to credit rates redeemable at UAH,
only lending rates on credits to enterprises given in the US dollar are
insignifficntly different from zero in the long run. But for all credit rates
redeemable in foreign currency we can not reject the hypothesis of complete
pass through after 36 months.
Lets turn to the case of deposits. We can not reject the hypothesis of
complete pass though to deposit rates to households except rate with 12
months maturity. But for interest rates on deposit to firms the pass through is
still incomplete even though significantly different from zero Overall, long
term pass through to rates on deposit to enterprises are lower by 2- 3 times
than to ones on deposit to households. The explanation might be that the
segments of markets for deposits from enterprises are not fully competitive or
the switching costs of these deposits are relatively high.
Third conclusion is that the average speed of adjustment from the shock in
reference rate is 15 -20 months for the case of lending rate redeemable both
in UAH and the US dollar, and to interest rate on deposit given to
households. This can be seen from Chart 6, 7 and 9 in Appendix. On the
other hand, from Chart 8 it can be drawn that depost rates to firms reacts to
changes in reference rate on average after 10 months, even though the pass
through remains incomplete for these rates.
And finally, there is some evidence that interest rates with lower maturity
have higher pass through, than the ones with higher maturity. For example,
from Chart 6 we can see that response functions of rates with lower maturity
31

8/2/2019 Interest Rate Pass Through in Ukraine
http://slidepdf.com/reader/full/interest-rate-pass-through-in-ukraine 41/81
lie above the ones with higher maturity. The exception is the interest rate
pass through behavior of lending rate to enterprises, but it is the only lending
rate that has another reference rate.
So, the results from the bivariate VAR for the case of full sample are very
similar to once described in the literature. We have received stick pass
through in the short run, but rather complete in the long run. Also, interest
rate pass through to deposits to enterprises appears to be not complete even
in the long term, which fits the literature as well. Moreover, interest rates
with lower maturity have higher pass through. But, oppose to the results
received in another studies, the average lag of interest rate transmission is
higher for Ukraine.
5.1.2 .Subsample results from bivariate VAR .
Results of estimation the interest rate pass through over the subsample
starting from 2002 July are presented in Table 10 for the case of lending rate
redeemable at UAH, Table 11 for the case of lending rates redeemable at the
US dollar, and in Table 12 for the case of deposit rates denominated in UAH.
The methodology is the same as described in the previous section. At first
glance, the results on pass through to lending rate redeemable in UAH are
similar to the onces described earlier: sticky pass through in the short run, full
pass through in the long run, and presence of differences in the interest rate
pass through process across different instruments. It can be seen from the
Table 10 that over this subsample period in the short run interest rates on
credits to enterprises become more sticky to the shock in reference rate (all
short term pass through are not significant different from zero except lending
rate to enterprises at the maturity up to 1 month). This may be due to the
short sample period that causes high standard errors. But from the other
hand, long term pass through to enterprises credits has increased during
subsample period. Even though long term credits are still estimated to have
not significant pass through, lending rate to enterprises with the maturity
from 6 to 12 months becomes significantly different from zero and complete
32

8/2/2019 Interest Rate Pass Through in Ukraine
http://slidepdf.com/reader/full/interest-rate-pass-through-in-ukraine 42/81
in the long run. If we look at Chart 6 (for the whole sample) and Chart 10 (for
the short sample) we may observe that the lag of transmission of changes
from the reference rate to the retail rates droped by nearly 3 times and
constitutes on average 5 moths. This length of interest rate pass through is
very similar to the one observable in the foreigh countries. The increase in
speed of adjustments of lending rate to enterprises to the change in market
rate since the middle of 2002 can be explained by increase in competition and
decrease in switching and asymmetric information costs in these segments of
retail bank market. Also, as in the whole sample the reaction of the interest
rates on credit to households is not significant to the changes in interbank
rates. The only pass through significantly different from zero in the long run
is to household lending rate with maturity up to 3 months. But, compared to
the whole sample results, there is no overshooting in this type of pass
through, moreover, it became not complete even in the long run. It may
suggest that the demand elasticity for this type of loans decreased starting the
point of structural break. It could be due to un developments of this sector of
retail banking 12.
The interest rate pass through to the lending rate denominated in the US
dollar become insignificantly different from zero and significantly different
from one in both short term and long term. Credit rate to enterprises remain
the only instrument the pass through to which is complete even though not
significantly different from zero in the long run starting point of the structural
break. The only explanation which come to mind is that interbank interest
rate is ot an apropiate measure for marginal cost for these type of
instruments.
Results shown in Table 12 say that interest rate pass through to bank
deposit rates to households increase in the short run and remain complete in
the lon run compared to the result for the whole sample. Moreover, as the
Chart 13 shows the lag of transmission of changes from reference rate to
12 It can be seen from Chart 5 that amount of credits to enterprises rose more rapidly than amount of
credits to household over the subsample period.
33

8/2/2019 Interest Rate Pass Through in Ukraine
http://slidepdf.com/reader/full/interest-rate-pass-through-in-ukraine 43/81
deposit rates to houseolds decrease by two times since the structural break
point. But interest rate pass through to bank rates on enterprises deposit with
maturity higher than 6 months became insignificantly different from zero in
both short and long run in subsample.
5.1.3.Monetary policy Approach
In this section we estimate the interest rate pass through from policy
rates to retail banks rate. For estimation we test model (1) with the reference
rate being policy rate (NBU discount rate). In case of the whole sample we
estimate model (1) in levels, and in case of subsample, we estimate (1) in first
differences because discont rate appears to be I(1) process starting the point
of structural break. We use the same methodology for determining lag order
and identification restriction as we employed in the Cost of Funds Approach.
We will only estimate pass through to bank retail rates denominated in UAH,
because the NBU discount rate is redeemable in UAH. The results of
estimaton are presented in Table 13 for the case of lending rates and fullsample period, in Table 14 for the case of lending rate and sort sample period.
Table 15 and Table 16 depict the results for interest rate pass through to
deposit for the case of full and short sample period respectively. As can be
seen from Table 13 interest rate pass through is also stick in the short run.
But oppose to the cost od funds approach the pass hrough to lending rates to
enterprises with maturity more than 6 months are significantly different from
zero, suggesting that policy rate is more appropriate reference rate for long
term rates to firms that interbank rate is. It may be due to the fact that policy
rate signals about long term behaviour of interest rate while interbank term
rate is short term rate. Even though after 12 months the interest rate pass
through increases, only for some rates(lending rates to firms with up to 1
month and 1-3 months maturity, and up to 1 month and long term to
households), while for other rates pass through is less than 100% or even
insignificantly different from 0 for the case of lending rates to firms with
34

8/2/2019 Interest Rate Pass Through in Ukraine
http://slidepdf.com/reader/full/interest-rate-pass-through-in-ukraine 44/81
maturity of 1-3 months and 6-12 months. But after 36 months pass through
becomes complete for all rates but leding rates to households with maturity
more than month.
If we turn to short sample results (Chart 15, Chart 17), the pass through
to lending rates to enterprises becomes higher in the short run (it ranges from
0.468 for 1 month maturity to 0.638 for 1-3 months maturity rate). But in the
long run only two rates with maturity less than 3 months have complete pass
through, but long term rate to enterprises has insignificantly different from 0
pass through both in the short and long terms. The pass through to rates on
credits to households with maturities less than 6 months is complete already
in a month, but rates with maturity higher than 6 months have negative but
insignificantly different from 0 pass through both in the short and in the long
term.
If we look at Table 15, we can see that interest rate pass through to
deposit rates to all type of customers are not significantly different from 0 in
the short run. After 12 months pass through increases a little bit (it ranges
from 0.114 for deposit rates to firms with maturity of 6-12 months to 0.629
for the case of deposit rates to households with maturity of 6-12 months), but
remains not complete even after 36 months. From Table 16 it can be drawn
that discount rate does not influence deposit rates to firms except to ones
with long term maturity. But pass through to deposit rates to households
increases in the short term and becomes even complete for the case of
interest rates with maturity less than 3 months.
To sum up, we an not reject the hypothesis that the NBU discount rate
has influence on the bank retail rates, even though the reaction of interest
rates differ across instruments. Also, there is some evidence on fuller and
quicker pass through since the mid 2002.
35
8/2/2019 Interest Rate Pass Through in Ukraine
http://slidepdf.com/reader/full/interest-rate-pass-through-in-ukraine 45/81
5.1.4.Results on asymmetry of responses in bivariate models.
One of the issues investigated in interest rate pass through process is
the asymmetry of responses of retail bank rates to the changes in market rate.
It is assumed that when market interest rate goes up the lending (deposit)
bank interest rate are less (more) sticky comparatively to the case when
market interest decreases. Mostly researchers estimate error correction model
to test interest rate asymmetry. We can not rely on error correction model to
the reason described above. Burgstaller (2005) proposed to estimate VAR
model of type (2) and test the hypothesis of equality to zero coefficients near
dummies variable. But, what we received in this case are the coefficients of
reduced form VAR, not the structural VAR. But these two sets of coefficients
are not necessary equal to each other, they even might have different signs.
Therefore, we should use the results from structural VAR to test for
asymmetry, which are not given in Stata package. Therefore, we make
asymmetry test in the following way. We estimate model (2) and then we use
Cholesky decomposition to turn reduced form VAR coefficients intostructural ones. While imposing identification restriction, we assume as before
that retail rates do not cause contemporaneously market interest rate, but not
vice versa. From this follows that interacted with market rate terms also are
not influenced by retail bank rate at the same period, but not vice versa.
From this followes that interacted with market rate terms also are not
influenced by retail bank rate at the same period, but not vice versa. We take
the same pair of interest rates as in a bivariate model and add to them to
interacted variable. All interacted variables appears to be stationary at 5 %
significance level. The number of lags is chosen in the same manner as in the
section above. Then we compute cumulative impulse response function from
the changes in market rate to the changes in market rate interacted with
dummy, which take 1 when market interest rate increases. If there is
asymmetric behavior in the pass through process, the computed coefficients
of this cumulative IRF should be significantly different from zero. For both
36
8/2/2019 Interest Rate Pass Through in Ukraine
http://slidepdf.com/reader/full/interest-rate-pass-through-in-ukraine 46/81
sample, the results of testing on asymmetric response to changes in market
rate indicates that there are no asymmetry in responses both deposit and
credit bank rates to the change in market rate except long term interest rate
on credit to enterprises. As it was assumed, when market interest rate
increases the pass through is higher, then when it decreases. But for this
interest rate, the cumulative IRF is statistically different from zero only in the
first 4 periods. Starting with the 5 th period there is no statistical difference
between pass through in case increasing or decreasing reference rate. 13
5.2.Results from Multivariate Var
In this section we examined the pass through process through multivariate
VAR model (3). Even though the bivariate VAR is the partial case of the
multivariate VAR model, analyzing the bivariate VAR first can be justified by
the following reasons. Firstly, it makes results compared with the literature,
since bivariate model of interest rate pass through is very frequently used.
Secondly, it allows to test the cost of funds approach directly. And thirdly, for
our particular case of very short sample, the smaller number of variables leads
to the increase in the degree of freedom.
To estimate the multivariate model of the pass through process and to
reveal the transmission chain of changes in different interest rates, we need
firstly to examine whether deposit rates cause lending rate. For each retail
lending rate we select the reference deposit rates from the set of bank deposit
rates which exhibit the highest correlation with it. Then we perform the
Granger causality test to test the hypothesis that bank deposit rate does not
Granger cause the lending rate. The results of this test for the whole sample
are presented in Table 21.
13 We do not present the results of testing for asymmetric pass through here because it was estimated
that there is no significant asymmetric behavior of interest rate pass through except for the one rate.
For the case of interest rate on long term credit to enterprises, when market interest rate increases the
pass through is higher then when market rate decreases on 0.05%, 0.11%, 0.15%, and 0.19%
correspondingly in period ,1,2, ad 3.
37

8/2/2019 Interest Rate Pass Through in Ukraine
http://slidepdf.com/reader/full/interest-rate-pass-through-in-ukraine 47/81
The second column of Table 21 shows the deposit rate chosen via
correlation analysis as the possible candidate for having predictive power for
selected credit rate beond the marginal cost approach. As it can be seen from
this table, bank rate on deposits made by households move closer with credit
rates. The third columns gives the p-value for the hypothesis that deposit rate
does not Granger cause lending rate. For the case of the whole sample, we
can reject the hypothesis that banks rates on loans to households at the
maturity of up to 1 month, from 1 to 3 months, and up to 12 months are not
caused by deposit rate.
After we revealed which credit rates may be caused by deposit rate, we
perform the multivariate VAR model for estimating interest rate pass though.
As describe in the methodology section, we include the following variables
into the model: long term interbank lending rate as a proxy for long term
market rate (since it is the only available for author rate with maturity more
then 3 months), short term market rate proxied by interbank rate used as
marginal cost for bank rate in the marginal cost approach, the NBU discount
interest rate, which represent the polict interest rate, and the lending rate
itself. We include also deposit rate if the particular lending rate is Granger
caused by deposit rate. While imposing identification restriction to receive
structural parameters, we follow the logic explained in the methodology
section. We assume that policy rate is conteproraneously exogenous to all
other rates, long term market rate is contemporaneously exogenous to all but
policy interest rate. Then we assume that bank lending rate is caused in one
period by all other rates, and short term market rate can influence the deposit
rate in one period, but not vice versa. Since all ineterst rates are stationary for
the case of whole sample, we run regression (3) in levels. We follow the same
strategy as in bivariate VAR while determining the appropriate lag order.
Then we compute cumulative IRF . As it was done above, the immediate pass
through from one rate to another is the value of cumulative IRF in period 0,
short term pass through is the response after 12 months, and very long term
pass through – the response after 36 months. Long term market interest rate
38

8/2/2019 Interest Rate Pass Through in Ukraine
http://slidepdf.com/reader/full/interest-rate-pass-through-in-ukraine 48/81
appears to have no effect both on bank retail rates and on short term market
rate. It can be explained y the fact that the yield curve is not stable in Ukarine
(which is common evidence for developing countries), or that banks use
rather short term interest rate than long term rate as a measure of marginal
cost.
The results for interest rate pass through from market rates to the bank
lending rates for the whole sample are presented in Table 17 and from deposit
rate to bank lending rates in Table 19. Bank rates on credit to households at
the maturity of up to 1 month and up to 3 months do not react to changes in
short term market rate, but these two rates transmit shocks made to deposit
rate. Therefore, we can suggest that appropriate marginal cost for these two
lending rates is deposit rate, so it is possible that banks finance their lending
activities to households with the help of sources from 6 months maturity
deposits made by household. The pass through from interbank rate to 6
months credit rate to enterprises is a little bit lower then the one estimated in
bivariate model and it is not influenced by deposit rates. Even though for
majority of lending rates interest rate pass through from market rate is
insignificantly different from zero, but for some rates we can not reject the
hypothesis that pass through is complete in the long run (lending rates to
firms with the maturity of 1, 1-3, and 6-12 months, and lending rate to
hoesholds with the maturity of up to 1 month). It may be that short sample
sample period and big number of variables compared to bivariate VAR
model contribute to the insignificance of the coefficients.
Table 18 and Table 20 present the results of interest rate pass through
from the NBU discount rate to the bank retail and market ineterst rates
respectively. As it always appears, pass through from the policy rate is sticky
in the short term for both market and bank lending rates, but it becomes
complete and sigifficantly different from 0 already after 12 months.
39

8/2/2019 Interest Rate Pass Through in Ukraine
http://slidepdf.com/reader/full/interest-rate-pass-through-in-ukraine 49/81
C h a p t e r 6
CONCLUSIONS AND IMPLICATIONS
This thesis presents an empirical analysis of the interest rate pass
through process in Ukraine. Both bivariate and Multivariate specifications
of Vector Autoregressive model are used to estimate the pass through
from policy and market interest rates to bank retail rates. Two approaches,
cost of funds approach and monetary policy approach, are involved when
we describe the transmission of changes from policy and market rates to
retail rates. Also the distinction between maturity, currency denominated
(UAH and the US dollar), and type of bank customers (households and
enterprises) for bank retail rates are made while estimated interest rate
transmission process. A structural break that corresponds to July 2002 is
found in the data using CUSUM test for structural break. Therefore, the
estimation is conducted for two samples: the whole original sample, and
the sample starting from July, 2002.
The first finding is that pass through appears to be stick in the short
run, but rather complete in the log run, which is common to the literature.
There is evidence that interest rates with lower maturity have higher pass
through. The interest rate pass through to instruments with long term
maturity is estimated to be insignificant. This implies that market interest rate
is inappropriate measure of marginal cost for them. The lag of transmission
from market to retail rates decreases on average by two times since the point
of structural break. This suggests the increase in banking competition since
the mid 2002. Also, deposit rates react quicker to the changes in reference rate
than bank lending rates do, but in the long term their pass through tends to
be incomplete, which is also common to the literature. The pass through to
interest rates on credits to enterprises is bigger than to credits to households
40

8/2/2019 Interest Rate Pass Through in Ukraine
http://slidepdf.com/reader/full/interest-rate-pass-through-in-ukraine 50/81
(which is estimated to be insignificantly different from 0 for majority of
cases). This may be due to underdevelopment of market for this type of
credit compared to market for credits to firms.
Secondly, we can reject the hypothesis that policy rate does not
influence bank retail rates. For both samples, the pass through is incomplete
in the short term (even though it is higher than the pass through from market
rates) while for almost all instruments pass through is complete in the long
run. Also, the pass through from policy rate becomes fuller and quicker since
the point of structural break. From the results from multivariate VAR we canconclude that banks respond more to the NBU discount rate than on the
market interest rate while setting their retail rates.
Thirdly, we have not found the precence of asymmetric interest rate
pass through in Ukraine, which is in line with results received for other
developing countries.
In order to strengthen the process of monetary transmission in Ukaine,to iget better the soundness of banking sector, as well as to improve the
monetary policy , we suggest the few decisive measures. Namely,
- take into account the possibility of presence of MTM channels which
include the interest rate pass through as subchannel; presence of
complete interest rate pass through suggests the operation of first
stage of interest and credit channels of MTM in Ukraine;
- pay more attention to the consequences of changes in the NBU
discount rate; It appears that Ukrainian banks take ino account the
behaviour of the NBU discount rate when setting their retail rates;
- take into account the timing effect while conducting monetary policy;
the interest rates transmission is estimated to have longer lag then the
one for other developping countries.
41

8/2/2019 Interest Rate Pass Through in Ukraine
http://slidepdf.com/reader/full/interest-rate-pass-through-in-ukraine 51/81
The further research in the field of interest rate pass through in Ukraine
can be done on the Micro level. In particular, it is interesting how different
bank characteristics and the structure of bank sector itself influence interest
rate pass through process. To make this kind of research bank level data is
needed. It is available at the NBU, but public access to this data is restricted
by Ukrainian legislation.
42

8/2/2019 Interest Rate Pass Through in Ukraine
http://slidepdf.com/reader/full/interest-rate-pass-through-in-ukraine 52/81
BIBLIOGRAPHY
Bernarke , B. and M. Gertler. Inside the Black Box: The Credit Channel of Monetary Policy . Journal of Economic Perspectives, vol. 9,4, pp.27-48, 1995.
Berstein, S. and R. Fuentes. Is There Lending Rate Stickiness in the Chilean Banking Industry? CentralBank of Chile, working paper
#218, 2003. Bondt, G. de.Retail Bank Interest Rate Pass Through: New Evidence at the
Euro Area Level , EuropeanCentral Bank, working paper #136, 2002.
Bondt, G. de, Mojon, B. and N. Valla, Term Structure and Sluggishness of Retail Bank Interest Rates in Euro Areas Countries ,European Central Bank,
working paper # 518, 2005.Burgstaller, J. Interest Rate Pass- Through Estimates from Vector
Autoregressive Models . Working paper , 2005 .
Coricelli, F., Egert, B. and R.MacDonald, Interest Rate Pas Through in New EU Member States: The Case of the Czech Republic, Hungary and Poland .Milliam Davidson Institute
Working paper # 671, 2004.Coricelli, F., Egert, B. and R.MacDonald , Monetary Transmission Mechanism in Central and Eastern Europe: Surveying the
Empirical Evidence. Work inprogress, 2005.
Cottarelli, C., Ferri, G., and A.Generale, Bank Lending Rates and Financial Structure in Italy: A Case Study . IMF, working paper #38,
1995.
Cottarelli, C. and A. Kourelis.Financial Structure, Bank Lending Rates, and the Transmission
Mechanism of Monetary Policy .IMF, working paper # 39, 1994.
Crespo-Cuaresma, J., Egert B. and T. Reininger. Interest Rate Pass Through in Central and Eastern
Europe: Reborn from Ashes Merely
to Pass Away . Focus onEuropean EconomicIntegration, 2006.
Engel, B.F. and C.W.J. Granger. Co- integration and Error Correction: Representation, Estimation and Testing. Econometrica, 55,pp.251-276, 1987.
Espinosa-Vega, M. and A. Rebucci.Retail Bank Interest Rate Pass Through: is Chile Atypical . Cetral
Bank of Chile Working Paper,# 221, 2003.Fixler, D. and K. Zieschang. The
Productivity of the Banking Sector: Integrating Financial and Production
Approaches to Measuring Financial Service Output . Canadian Journalof Economics, vol. 32, pp. 547-569, 1999.
Fried, J. and P. Howitt. Credit Rationing and Implicit Contract
Theory . Journal of Money, Creditand Banking, #12, pp.471-487,1980.
Gambacorta, L. How do Banks Set Interest Rates? NBER Working paper, #10295, 2004.
Gambacorta, L. and S. Iannotti. Are there asymmetries in the Response of Bank Interest Rates to Monetary Shocks? Banca D’Italia Working paper # 566, 2005.
43

8/2/2019 Interest Rate Pass Through in Ukraine
http://slidepdf.com/reader/full/interest-rate-pass-through-in-ukraine 53/81
Green, W. Econometric Analysis.Prentice Hall, 4-th edition,2000.
Hansen, B. Testing for Parameter Instability in Linear Models.
Journal of Policy Modeling, 14,pp.517-533, 1992.
Kleimeier, S. and H. Sander.Regionalization versus globalization in European financial Market Integration: Evidence from Co- integration Analyses . Journal of Banking and Finance 24(6),pp.1005-1043, 2000.
Kot, A. Is Interest Rate Pass-Through Related to Banking Sector competitiveness? National Bank of Poland, working paper, 2004.
Lim G.C. Bank Interest Rate Adjustments: Are They Asymmetric? The Economic Record, vol. 77,no. 237, pp. 135-147, 2001.
Lowe, P. and T. Rohling. Loan Rate Stickiness: Theory and Practice .Reserve Bank of Australia,research discussion paper#9206, 1992.
Mishkin, F. The Channels of Monetary Transmission: Lesson for Monetary Policy . National Bureau of Economic Research, working paper #5464, 1996.
Mlima, A.P. and L. Hjalmarsson. Measurement of Inputs and Outputs in the Banking Industry . Tanzanet
Journal, 3, pp. 12-22, 2002.Mojon, B. Financial Structure and the
Interest Rate Channel of ECB Monetary Policy . EuropeanCentral Bank, working paper#40, 2000.
Rosen R.J. What Goes Up Must Come Down? Asymmetries and Persistence in Bank Deposit Rates . Journal of Financial Services Research,21:3, pp. 173-193, 2002.
Rousseas, S. A Markup Theory of Bank Loan Rates . Journal of PostKeynesian Economics, 8, 1, pp.135-144, 1985.
Sander, H. and S. Kleimeier.Convergence in Eurozone Retail Banking? What Interest Rate Pass- Through tells us About Monetary Policy Transmission, Competition and Integration . LIFE Working Paper, 03-009, 2003.
Sander, H. and S. Kleimeier. Interest Rate Pass Through in an Enlarge
Europe: the Role of Banking Market Structure for Monetary Policy Transmission in Transmission Countries . Working paper, 2004.
Sander, H. and S. Kleimeier. Interest Rate Pass-Through in the Common
Monetary Area of the SACU Countries. METEOR working paper, 2006.
Stiglitz, J. and A. Weiss. Credit Rationing in the Markets with Imperfect Information . AmericanEconomic Review, #71, pp.393-410, 1981.
Taylor, J. The Monetary Transmission Mechanism: An Empirical Framework. Joural of EconomicPerspectives, vol.9, #3, pp. 11-26, 1995.
Tieman, A. Interest Rate Pass Through in Romania and Other Central
European Economies . IMF Working Paper, wp/04/211,2004.
Toolsema, L.A., Sturm, D.-E. and J.de Haan. Convergence of Pass Through From Money Market toLending Rates in EU Countries:
New Evidence . CCSO Centre forEconomic Research, Working Paper #6, 2002.
Weth, M. The Pass Through From Market Interest to Bank Lending
45

8/2/2019 Interest Rate Pass Through in Ukraine
http://slidepdf.com/reader/full/interest-rate-pass-through-in-ukraine 54/81
Rates in Germany . Discussionpaper 11/02, EconomicResearch Center of DeutscheBundesbank, 2002.
Winker, P. Sluggish Adjustment of Interest Rates and Credit Rationing: an Applicaton of Unit Root Testing and Error Correction Modelling .
Applied Economics Journal, 31,pp. 267-277.
46

8/2/2019 Interest Rate Pass Through in Ukraine
http://slidepdf.com/reader/full/interest-rate-pass-through-in-ukraine 55/81
APPENDIX
Table 1. Descriprive statistics
Interest rate series
Number
of
observati
ons
Mean
Stand
ard
Deviat
ion
Min Max
Numb
er of
observ
ations
Mean
Stand
ard
Deviat
ion
Min Max
01.2000-11.2006 07.2002-11.2006
Policy interest rate
Discount rate 83 13.26 8.67 7 45 53 8.10 0.99 7 9..5
Overnight 57 12.25 4.41 8 24.6 46 10.96 3..24 8 20
Rate on tender credit 59 11.43 3.48 7.7 21 45 10.11 2.04 7.7 15
Interbank lending rate denominated in UAH
Overnight 83 8.19 8.44 0.8 41.7 53 4.55 3.58 0.8 16.8
Up to 7 days notice 83 9.96 8.54 1.9 43.8 53 6.13 3.79 1.9 18.6
From 8 to 21 days 83 12.78 8.33 4.3 45.6 53 8.7 3.70 4.3 20.4
From 22 to 31 day 83 15.16 10.07 4.3 58 53 9.4 3.04 4.3 19.4
From 32 to 92 days 83 15..57 9.49 4.1 56.5 53 9.86 3..24 4.1 18.2
Over 92 days notice 83 17.92 7.66 9.3 47.4 53 13.74 2.80 9.3 21.4
Interbank lending rate denominated in $
Overnight 83 3.81 1.48 1.4 6.4 53 3.02 0.98 1.4 5.4
Up to 7 days notice 83 3.93 1.53 1.3 7..2 53 3.08 0.91 1.3 4.7
From 8 to 21 days 83 5.21 1.64 2.8 9..5 53 4.29 0.73 2.8 5.8
47

8/2/2019 Interest Rate Pass Through in Ukraine
http://slidepdf.com/reader/full/interest-rate-pass-through-in-ukraine 56/81
Interest rate series
Numbe
r of
observa
tionsMean
Stand
ard
Devi
ationMin Max
Num
ber
of
obser
vatio
ns
Mean
Stand
ard
Devi
ationMin Max
01.2000-11.2006 07.2002-11.2006
From 22 to 31 day
83 5.71 1.94 3.3 12.3 53 4.47 0.60 3.3 6..2
From 32 to 92 days
83 6.45 3.15 2.5 15.3 53 4.42 0.92 2.5 6.7
Over 92 days notice83 9.09 3.44 4 18.3 53 7.04 1.85 4 13
Bank lending rate denominated in UAH to firms
Up to 1 month
83 19.82 10.19 8.7 57.6 53 13.34 2.39 8.7 20
From 1 to 3 months
83 24.57 10.31 14.5 61.1 53 18.19 2.16 14.5 23.4
From 3 to 6 months
83 26.21 10.69 15.4 55.8 53 19.35 2.53 15.4 27
From 6 to 12 months
83 25.47 10.17 16.3 58.3 53 18.88 1.91 16.3 25.1
Long term notice
83 22.24 10.55 14.4 59.7 53 16.25 1.32 14.4 20.9
Bank lending rate denominated in UAH to households
Up to 1 month
83 25.50 11.34 3.3 59.8 53 18.52 6.16 3.3 32.3
From 1 to 3 months
83 25.34 7.87 13.2 46.7 53 20.63 2.76 13.2 26.9
From 3 to 6 months
83 22.87 7.77 9.7 51 53 18.25 3.43 9.7 25.2
From 6 to 12 months
83 22.52 2.79 14.1 28.4 53 21.72 2.07 17 27.5
Long term notice
83 17.67 2.72 8 21.3 53 18.99 1.24 14.6 21.3
Bank credit rate denominated in $ to firms
Up to 1 month to
83 10.91 3.17 7 21.7 53 9.60 1.45 7 12.8
From 1 to 3 months to
83 12.36 2.76 8.5 22.8 53 10.77 1.22 8.5 13.5
48

8/2/2019 Interest Rate Pass Through in Ukraine
http://slidepdf.com/reader/full/interest-rate-pass-through-in-ukraine 57/81
Interest rate series
Numbe
r of
observa
tionsMean
Stand
ard
Devi
ationMin Max
Num
ber
of
obser
vatio
ns
Mean
Stand
ard
Devi
ationMin Max
01.2000-11.2006 07.2002-11.2006
From 3 to 6 months 83 14.29 2.39 9.5 23.8 53 13.24 1.51 9.5 16.1
From 6 to 12 months 83 14.21 2.14 10.05 19.8 53 12.88 1.20 10.05 15.4
Long term notice 83 14.08 2.18 11.3 20.1 53 12.78 0.91 11.3 14.9
Bank lending rate denominated in UAH to households
Up to 1 month 83 14.92 2.94 10.1 24.7 53 13.90 1.39 10.1 17.2
From 1 to 3 months 83 15.82 2.48 10.8 24.4 53 14.71 1.15 10.8 16.7
From 3 to 6 months 83 16.3 2.85 11.5 24 53 14.75 1.27 11.5 17.3
From 6 to 12 months 83 16.60 2.03 14 23.9 53 15.55 0.86 14 18.5
Long term notice 83 14.37 1.74 11.8 22.9 53 13.74 0.79 11.8 15.2
Bank deposit rate denominated in UAH to firms
Up to 1 month 83 7.64 5.17 2 30.2 53 5.60 2.58 2 13.9
From 1 to 3 months 83 12.45 3.97 2.7 33.3 53 10.30 1.80 2.7 13.8
From 3 to 6 months 83 13.07 4.39 3.5 38.4 53 11.39 2.00 3.5 14.9
From 6 to 12 months 83 10.95 4.07 5.3 30.4 53 8.91 2.01 5.3 12.7
Long term notice 83 11.63 4.27 6.8 25.7 53 9.21 0.87 6.8 11.9
Up to 1 month 83 14.69 6.62 6.6 38.3 53 10.75 2.63 6.6 16.1
From 1 to 3 months 83 17.10 4.97 10.06 33.1 53 13.94 1.62 10.06 18.4
From 3 to 6 months 83 18.08 5.19 12.05 33 53 14.73 1.33 12.05 18
49

8/2/2019 Interest Rate Pass Through in Ukraine
http://slidepdf.com/reader/full/interest-rate-pass-through-in-ukraine 58/81
Interest rate series
Numbe
r of
observa
tionsMean
Stand
ard
Devi
ationMin Max
Num
ber
of
obser
vatio
ns
Mean
Stand
ard
Devi
ationMin Max
01.2000-11.2006 07.2002-11.2006
From 6 to 12 months 83 19.16 7.16 10.2 43.1 53 14.75 1.45 10.2 19.1
Long term notice 83 24.72 13.78 13.9 74.8 53 16.59 2.47 13.9 25.1
Bank deposit rate denominated in $ to firms
Up to 1 month
83 3.05 0.92 1 5.4 53 3.05 0.91 1.8 5.4
From 1 to 3 months
83 5.71 1.37 3.4 10.5 53 5.64 1.14 3.4 8.4
From 3 to 6 months 83 7.09 1.50 3.7 11.6 53 6.9 1.39 3.7 9.3
From 6 to 12 months 83 8.29 2.40 3.8 15.8 53 7.25 1.25 4.4 10
Long term notice 83 7.06 1.74 2.8 15.4 53 6.80 0.88 4.7 8.3
Bank deposit rate denominated in $ to households
Up to 1 month 83 5.92 2.27 3.3 17.2 53 5.25 0.77 4.2 8
From 1 to 3 months 83 6.74 1.24 4.4 9.9 53 7.22 1.19 5.2 9.9
From 3 to 6 months 83 7.97 1.52 5.7 16.7 53 8.17 0.70 7.1 10.1
From 6 to 12 months 83 8.37 0.89 6.7 12.1 53 8.31 0.68 6.7 10.3
Long term notice 83 10.80 2.69 8.4 21.4 53 9.50 0.42 8.4 10.4
50

8/2/2019 Interest Rate Pass Through in Ukraine
http://slidepdf.com/reader/full/interest-rate-pass-through-in-ukraine 59/81
Table 2. Correlation Analisys between bank lending rate and Interbank lending rates redeemable in UAH
Bank rate Market
Rate Corre- lation
Lag in months
Market rate
Corre- Lation
Lag in months
Market rate chosen
2000.01-2006.11 2002.07-2006.11
Lending rate Interbank
lending
rate
Interbank
lending
rate
Interbank
lending
rate
Up to 1
month to
firms
32 - 92
days
notice 0.91 0
from 32
to 92
days 0.91 0
from 32
to 92
days From 1 to
3 months
to firms
32 - 92
days
notice
0.86 0
32 - 92
days
notice
0.85 0
32 - 92
days
notice
From 3 to
6 months
to firms
32 - 92
days
notice 0.81 0
32 - 92
days
notice 0.81 0
32 - 92
days
notice From 6 to
12 months
to firms
32 - 92
days
notice 0.84 0
32 - 92
days
notice 0.84 0
32 - 92
days
notice
Long term
notice to
firms
over 92
days
notice 0.76
0
32 - 92
days
notice 0.77
0
over 92
days
notice
Up to 1
month to
households
32 - 92
days
notice
0.710
32 - 92
days
notice
0.690
32 - 92
days
notice
From 1 to
3 months
to
households
32 - 92
days
notice 0.78 1
32 - 92
days
notice 0.78 1
32 - 92
days
notice
From 3 to
6 months
to
households
32 - 92
days
notice 0.76 0
32 - 92
days
notice 0.76 0
32 - 92
days
notice
From 6 to
12 months
to
households
over 92
days
notice 0.45 2
over 92
days
notice 0.45 2
over 92
days
notice
Long term
notice to
households
Overnigt
Interbank
lending
rate 0.61 1
Interbank
lending
rate from
21 to 32
day - 0.59 1
Overnigt
Interbank
lending
rate
51

8/2/2019 Interest Rate Pass Through in Ukraine
http://slidepdf.com/reader/full/interest-rate-pass-through-in-ukraine 60/81
Table 3. Correlation analysis between bank lending and market interestrate redeemable in US dollar
Bankrate
Market rate
Corre- lation
Lag in months
Market Rate
Corre- Lation
Lag in months
Market rate
chosen
2000.01-2006.112002.07-2006.11
Lending rate Interbank
lending
rate
Interbank
lending
rate
Up to 1month to
firms
22 - 31days
notice 0.60 1
22 - 31days
notice 0.356 10
22 - 31days
notice From 1 to
3 months
to firms
over 92
days
notice 0.78 2
over 92
days
notice 0.292 1
over 92
days
notice From 3 to
6 months
to firms
over 92
days
notice 0.63 3
32 - 92
days
notice 0.337 10
over 92
days
notice From 6 to
12 months
to firms
over 92
days
notice 0.79 1
over 92
days
notice 0.304 1
over 92
days
notice
Long term
notice to
firms
over 92
days
notice 0.79
2
over 92
days
notice 0.355
1
over 92
days
notice
Up to 1
month to
households
up to 7
days
notice 0.622
up to 7
days
notice
0.3396
up to 7
days
notice
From 1 to
3 months
to
households
over 92
days 0.59 1over 92
days 0.418 10over 92
days
From 3 to
6 months
to
households
over 92
days 0.74 1over 92
days 0.290 2over 92
days
From 6 to
12 months
to
households
over 92
days
notice 0.69 3
over 92
days
notice 0.249 0
over 92
days
notice
Long term
notice to
households
over 92
days
notice 0.55 1
over 92
days
notice 0.267 1
over 92
days
notice
52

8/2/2019 Interest Rate Pass Through in Ukraine
http://slidepdf.com/reader/full/interest-rate-pass-through-in-ukraine 61/81
Table 4.Correlation analysis between bank deposit and market interestrates redeemable in UAH
Bankdeposit Rate
Market rate
Corre- lation
Lag in months
Market rate
Corre- lation
Lag in months
Market rate chosen
2000.01-2006.112002.07-2006.11
To firms Interbanklending
rate
Interbanklending
rate Up to
1
month
Overnight 0.844 0
up to 7
days
notice 0.3671 6
up to 7
days
notice From 1
to 3
months
32 - 92
days
notice 0.880 0
32 - 92
days
notice 0.406 5
32 - 92
days
notice From 3
to 6
months
32 - 92
days
notice 0.727 0
32 - 92
days
notice 0.372 8
32 - 92
days
notice From 6
to 12
months
32 - 92
days
notice
0.7502
32 - 92
days
notice
-0.712 1
32 to 92
days
notice
Long
term
notice
32 - 92
days
notice 0.819
1
32 - 92
days
notice -0.387 1
32 - 92
days
notice To
households
Up to
1
month
32 - 92
days
notice 0.841 1
32 - 92
days
notice 0.6951
32 - 92
days
From 1
to 3
months
32 - 92
days
notice 0.873
3
32 - 92
days
notice 0.742 2
32 - 92
days
notice
From 3to 6
months
32 - 92days
notice 0.847
232 - 92days
notice 0.540 232 - 92days
notice
From 6
to 12
months
32 - 92
days
notice 0.806
2
32 - 92
days
notice 0.454 1
32 - 92
days
notice
Long
term
notice
32 - 92
days
notice 0.800
2
32 - 92
days
notice 0.467 1
32 - 92
days
notice
53

8/2/2019 Interest Rate Pass Through in Ukraine
http://slidepdf.com/reader/full/interest-rate-pass-through-in-ukraine 62/81
Table 5. Dicket Fuller test for unit root for interbank and bank lending rates, discount rate14
Interestrate Test statistics Interestrate Test statistics Interbank
lending
rate
(UAH)
2000.01-
2006.11
2002.07-
2006.11Interbank
lending
rate ($)
2000.01-
2006.11 2002.07-
2006.11
Overnight -5.72 -3.88 Overnight -1.81 -1.29
Up to 7
days
notice
-5.57 -3.46
Up to 7
days
notice
-1.72 -1.4
8-21 day
notice-4.84 -3.18
8-21 day
notice-3.16 -3.21
22-31
days
notice
-4.74 -3.02
22-31
days
notice
-2.89 -3.63
32-92
days
notice
-4.83 -2.95
32-92
days
notice
-3.1 -5.05
Over 92
days
notice
-5.84 -5.9
Over 92
days
notice
-3.77 -6.05
Bank
lending
rate
(UAH)
Bank
lending
rate ($)
To firms To firms
Up to 1
month-4.11 -3.08
Up to 1
month-3.39 -2.95
From 1 to3 months -4.85 -3.00 From 1 to3 months -2.98 -5.48
From 3 to
6 months-3.82 -2.95
From 3 to
6 months-4.14 -2.76
From 6 to
12 months-8.33 -4.49
From 6 to
12 months-2.04 -2.28
Long term
notice-5.38 -3.84
Long term
notice-2.58 -1.51
To households To households Up to 1
month-2.90 -2.27
Up to 1
month-4.62 -5.53
From 1 to
3 months-3.94 -5.23
From 1 to
3 months-5.43 -5.98
From 3 to
6 months-5.90 -2.97
From 3 to
6 months-3.41 -4.55
From 6 to
12 months-5.92 -2.95
From 6 to
12 months-3.03 -3.61
Long term
notice-3.92 -4.53
Long term
notice-6.09 -2.79
NBU
discount
rate
-6.80 -1.95
14 For the whole sample : 10% critical value is -3.54, 5% critical value is -2.9, 1% critical value is -2.59;
For the short sample : 10% critical value is -3.58, 5% critical value is -2.93, 1% critical value is -2.60
54

8/2/2019 Interest Rate Pass Through in Ukraine
http://slidepdf.com/reader/full/interest-rate-pass-through-in-ukraine 63/81
Table 6. Dicket Fuller test for unit root for bank deposit rates15
Bank depositrate
(UAH)
Test statistics Bank depositrate
(UAH)
Test statistics
2000.01-
2006.11
2002.07-
2006.11 2000.01-
2006.11 2002.07-
2006.11
To firms To households Up to 1
month-5.48 -2.59
Up to 1
month-2.86 -3.15
From 1
to 3
months
-6.52 -5.74
From 1
to 3
months
-3.92 -2.20
From 3to 6
months
-5.73 -5.21From 3to 6
months
-2.87 -2.71
From 6
to 12
months
-5.61 -2.74
From 6
to 12
months
-3.16 -3.57
Long
term
notice
-3.89 -7.40
Long
term
notice
-2.80 -3.07
15 For the whole sample : 10% critical value is -3.54, 5% critical value is -2.9, 1% critical value is -2.59;
For the short sample : 10% critical value is -3.58, 5% critical value is -2.93, 1% critical value is -2.60
55

8/2/2019 Interest Rate Pass Through in Ukraine
http://slidepdf.com/reader/full/interest-rate-pass-through-in-ukraine 64/81
Table 7. Interest rate pass through based on biviriate Var model fromMarket rate to bank lending rate redeemable at UAH; fullsample estimation.
Bank lendingrate
Immediate passthrough
Passthroughin amonth
Passthroughafter 12months
Passthroughafter 36months
Lagorderof
Var
Marketratechosen
Inerbanklending rate with maturity of
To firms Up to 1
month0.15*
(0.03 )
0.25*
(0.06)
0.5^
(0.39)
0.54^
(0.53)1
32 - 92
days From 1
to 3
months
0.02
(0.02)
0.09*
(0.04)
0.98*^
(0.25)
1.3*^
(0.36)
1 32 - 92
days
From 3
to 6
months
0.02
(0.01)
0.06*
(0.03)
0.7*^
(0.23)
1.22*^
(0.41)
132 - 92
days From 6
to 12
months
0.02*
(0.01)
0.048*
(0.02)
0.39*
(0.14)
0.65*^
(0.24)1
32 - 92
days
Long
term
notice
-0.0
(0.02)
0.0
(0.03)
0.31
(0.27)
0.51^
(0.40)1
> 92
days
Tohouseholds
Up to 1
month0.04
(0.02)
0.12*
(0.05)
0.69*^
(0.27)
0.94*^
(0.39)1
32 - 92
days From 1
to 3
months
0.07
(0.06)
0.16
(0.11)
0.85^
(0.54)
1.06 ^
(0.73)1
32 - 92
days
From 3
to 6
months
0.07
(0.04)
0.13
(0.07)
1.28* ^
(0.40)
2.05*^
(0.90)2
32 - 92
days
From 6
to 12
months
0.04
(0.03)
0.097
(0.06)
0.82*
(0.40)
1.24
(0.68)2
> 92
days
Long
term
notice
0.03
(0.03)
0.08
(0.05)
0.16
(0.09)
0.16
(0.09)1 Overnigt
* denotes 5 % level significance of t statistics;^ denotes equality to 1 at 5% level
56

8/2/2019 Interest Rate Pass Through in Ukraine
http://slidepdf.com/reader/full/interest-rate-pass-through-in-ukraine 65/81
Table 8. Interest rate pass through based on biviriate Var model frommarket to bank lending rates redeemable at US dollar; fullsample estimation
Banklending rate
Immediate pass through
Pass through in a month
Pass through after 12 months
Pass through after 36 months
Lag order of Var
Market rate chosen
Interbanklending rate
To firms Up to 1
month
-0.05
(0.08)
-0.02
(0.14)
1.30^
(0.93)
1.95^
(1.42)
1 22 - 31
days
notice
From 1to 3
months
0.07(0.04)
0.12*(0.06)
0.80*^(0.32)
1.14*^(0.56)
2 over 92days
notice From 3
to 6
months
-0.04
(0.03)
-0.05
(0.06)
0.22
(0.31)
0.69^
(0.67)
3 over 92
days
notice From 6
to 12
months
0.01
(0.02)
0.03
(0.04)
0.21
(0.26)
0.35^
(0.45)
1 over 92
days
notice Long
term
notice
0.04*
(0.02)
0.06
(0.03)
0.25
(0.22)
0.45^
(0.43)
2 over 92
days
notice Tohouseholds
Up to 1month
0.22(0.16)
0.38(0.27)
1.53^(1.07)
2.31^(2.31)
2 up to 7days
notice From 1
to 3
months
0.15*
(0.06)
0.40*
(0.10)
1.14*^
(0.41)
1.17*^
(0.45)
1 over 92
days
notice From 3
to 6
months
0.16*
(0.04)
0.35*
(0.09)
1.26*^
(0.47)
1.41*^
(0.64)
1 over 92
days
notice From 6
to 12
months
0.03
(0.03)
0.03
(0.05)
0.5*
(0.2)
0.85*^
(0.42)
3 over 92
days
notice Long
term
notice
0.09*
(0.04)
0.22*
(0.06)
0.6*^
(0.24)
0.62*^
(0.26)
1 over 92
days
notice * denotes 5 % level significance of t statistics;^ denotes equality to 1 at 5% level
57

8/2/2019 Interest Rate Pass Through in Ukraine
http://slidepdf.com/reader/full/interest-rate-pass-through-in-ukraine 66/81
Table 9. Interest rate pass through based on biviriate Var model frommarket to deposit rate redeemable at UAH; full sample estimation
Bankdeposit rate
Immediate pass through Pass through in a month
Pass through after 12 months
Pass through after 36 months
Lag order of Var
Market rate chosen
InterbankLending rate
To firms Up to 1
month
0.3131*
(0.3311)
0.4949*
(0.0615)
0.7532*^
(0.2028)
0.7548*^
(0.2069)
1 up to 7
days
notice From 1
to 3
months
0.0959*
(0.0210)
0.1984*
(0.0274)
0.5799*
(0.1148)
0.6249*
(0.1545)
1 32 – 92
days
notice From 3
to 6
months
0.0233
(0.0308)
0.1037*
(0.0405)
0.5179*
(0.1069)
0.5522*
(0.1303)
1 32 – 92
days
notice From 6
to 12
months
0.0461*
(0.0196)
0.0929*
(0.0036)
0.3669*
(0.1339)
0.4082*^
(0.1534)
2 32 – 92
days
notice Long
term
notice
0.0514*
(0.0235)
0.1316*
(0.0381)
0.5952*
(0.1429)
0.6547*^
(0.1816)
1 32 – 92
days
notice Tohouseholds Up to 1
month
0.0371
(0.0213)
0.099*
(0.0339)
1.1778*^
(0.2682)
2.1205*^
(0.8268)
3 32 – 92
days
notice From 1
to 3
months
0.0186*
(0.0073)
0.0813*
(0.0166)
0.9415*^
(0.2083)
1.3627*^
(0.4572)
2 32 – 92
days
notice From 3
to 6
months
0.0347*
(0.0153)
0.0692*
(0.0250)
0.8150*^
(0.2302)
1.2066*^
(0.4492)
2 32 – 92
days
notice From 6
to 12
months
0.0145
(0.0152)
0.0082
(0.0225)
0.4527*
(0.1310)
0.8238*^
(0.2917)
4 32 – 92
days
notice Long
term
notice
0.0772*
(0.0350)
0.1722*
(0.0540)
0.9773*^
(0.3569)
1.7624*^
(0.7674)
3 32 – 92
days
notice * denotes 5 % level significance of t statistics;^ denotes equality to 1 at 5% level
58
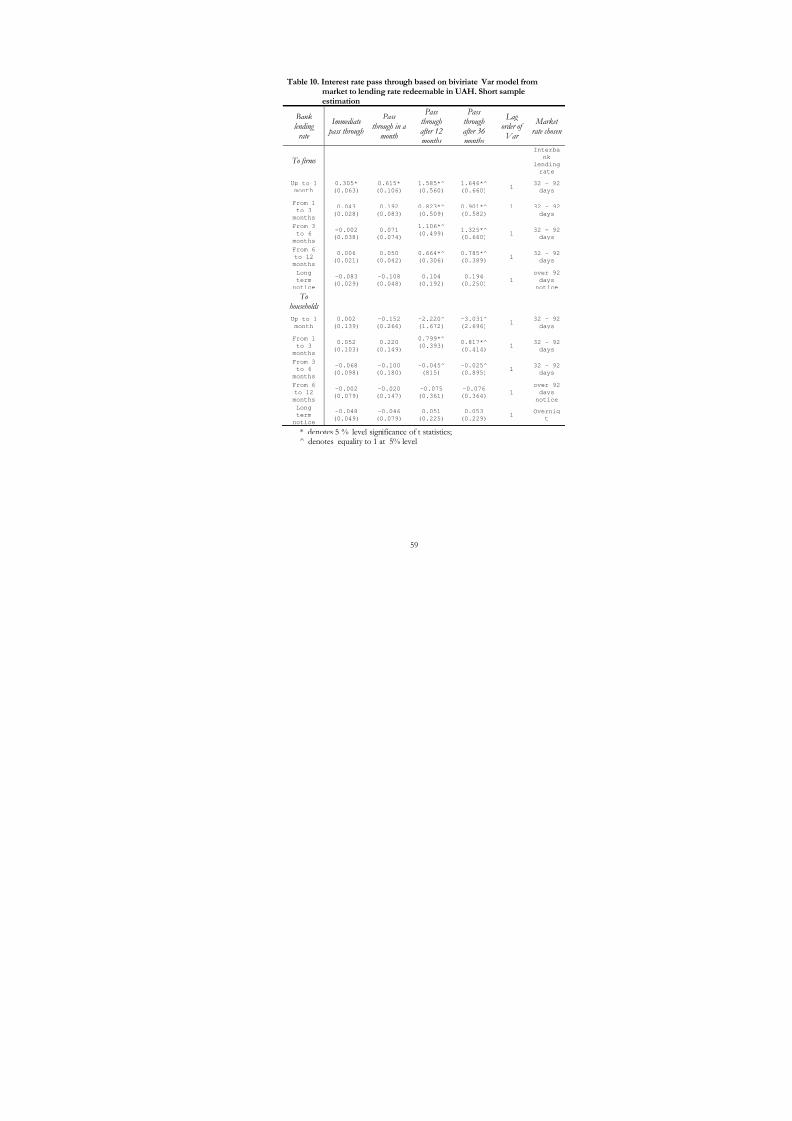
8/2/2019 Interest Rate Pass Through in Ukraine
http://slidepdf.com/reader/full/interest-rate-pass-through-in-ukraine 67/81

8/2/2019 Interest Rate Pass Through in Ukraine
http://slidepdf.com/reader/full/interest-rate-pass-through-in-ukraine 68/81
Table 11. Interest rate pass through based on biviriate Var model frommarket to lending rate redeemable at the US dollar. Shortsample estimation.
Banklending
rate
Immediate pass
through
Pass through in a month
Pass through after 12 months
Pass through after 36 months
Lag order of Var
Market rate chosen
To firms
Interban
k
lending
rate
Up to 1
month
0.032
(0.219)
0.167
(0.421)
1.012^
(1.691)
1.048^
(1.77)1
22 - 31
days
From 1to 3
months
0.132
(0.082)
0.267
(0.127)
0.337
(0.174)
0.337
(0.175)1
over 92days
notice
From 3
to 6
months
0.040
(0.082)
0.211
(0.158)
0.654
(0.444)0.660
(0.455)1
over 92
days
notice
From 6
to 12
months
-0.016
(0.047)
-0.681
(0.098)
-0.310
(0.376)
-0.324
(0.423)1
Over 92
days
notice
Long
term
notice
-0.001
(0.025)
-0.054
(0.655)
-0.456
(0.336)
-0.681
(0.608)1
over 92
days
notice
Tohouseholds
Up to 1
month
0.436
(0.193)
0.589
(0.313)
0.238
(0.787)
0.138
(0.879)2
up to 7
days
notice
From 1
to 3
months
-0.198
(0.251)
-0.069
(0.375)
0.245
(0.665)
0.245
(0.666)1
over 92
days
notice
From 3
to 6months
0.139
(0.082)
0.233
(0.14)
0.350
(0.219)
0.315
(0.219) 1
over 92
daysnotice
From 6
to 12
months
0.096
(0.051)
0.096
(0.093)
0.067
(0.186)
0.067
0.1861
over 92
days
notice
Long
term
notice
0.012
(0.040)
0.016
(0.078)
0.025
(0.207)
0.025
(0.211)1
over 92
days
notice
* denotes 5 % level significance of t statistics;^ denotes equality to 1 at 5% level
60

8/2/2019 Interest Rate Pass Through in Ukraine
http://slidepdf.com/reader/full/interest-rate-pass-through-in-ukraine 69/81
Table 12. Interest rate pass through based on bivariate Var model frommarket to deposit rate redeemable at UAH. Short sampleestimation
Bankdeposit rate
Immediate pass through
Pass through in a
month
Pass through after 12 months
Pass through after 36 months
Lag order of Var
Market rate chosen
To firms
Interba
nk
lending
rate Up to 1
month
0.181*
(0.053)
0.261*
(0.107)
0.132^
(0.550)
0.079^
(0.644)1
up to 7
days From 1
to 3
months
0.080
(0.068)
0.221*
(0.091)
0.621*^
(0.277)
0.633*^
(0.295)
1 32 - 92
days
From 3
to 6
months
0.046
(008)
0.128
(0.112)
0.380
(0.268)
0.386
(0.273)1
32 - 92
days
From 6
to 12
months
-0.074
(0.055)
-0.127
(0.103)
-0.263
(0.387)
-0.268
(0.411)1
32 - 92
days
Long
term
notice
-0.064
(0.036)
-0.029
(0.043)
0.072
(0.071)
0.073
(0.071)1
32 - 92
days
Tohouseholds Up to 1
month
0.136*
(0.051)
0.372*
(0.097)
1.704*^
(0.602)
1.732*^
(0.660)1
32 - 92
days From 1
to 3
months
0.074*(0.019)
0.268*(0.051)
0.833*^(0.302)
0.842*^(0.271)
1 32 - 92days
From 3
to 6
months
0.039
(0.023)
0.160*
(0.051)
0.751*^
(0.270)
0.739*^
(0.264)2
32 - 92
days
From 6
to 12
months
0.041
(0.033)
0.141*
(0.059)
0.714*^
(0.249)
0.696*^
(0.236)2
32 - 92
days
Long
term
notice
0.021
(0.038)
0.098*
(0.074)
1.040*^
(0.515)
1.200*^
(0.640)1
32 - 92
days
* denotes 5 % level significance of t statistics;^ denotes equality to 1 at 5% level
61

8/2/2019 Interest Rate Pass Through in Ukraine
http://slidepdf.com/reader/full/interest-rate-pass-through-in-ukraine 70/81
Table 13. Interest rate pass through based on biviriate Var model from policy to lending rate denominated in UAH. Full sample estimation
Banklending rate
Immediate pass through
Pass through in a
month
Pass through after 12 months
Pass through after 36 months
Corre- lation coeffi- cient
Lag order of Var
To firms
Up to 1
month
0.081*
(0.034)0.164*
(0.059)
0.844*^
(0.170)
1.215*^
(0.255)0.993 1
From 1 to
3 months
0.000
(0.021)
0.013
(0.035)
0.326
(0.168)
0.954*^
(0.393)0.938 1
From 3 to
6 months
0.006
(0.016)
0.022
(0.031)
0.409*
(0.188)
0.831*^
(0.317)0.944 1
From 6 to12 months
0.034*(0.008)
0.067*(0.007)
0.359(0.141)
0.624^(0.335)
0.957 1
Long term
notice
0.058*
(0.018)
0.137*
(0.034)
0.818*^
(0.164)
1.494^
(0.375)0.975 2
Tohouseholds Up to 1
month
0.136*
(0.057)
0.233*
(0.097)
0.987*^
(0.246)
1.549*^
(0.308)0.838 2
From 1 to
3 months
0.044
(0.045)
0.125*
(0.056)
0.732*^
(0.128)
1.087*^
(0.23)0.880 1
From 3 to
6 months
-0.031
(0.034)
0.032
(0.049)
0.455*
(0.138)
0.942*^
(0.213)0.895 2
From 6 to12 months
0.028(0.031)
0.047(0.039)
0.148*
(0.055) 0.195*(0.068)
0.433 1
Long term
notice
-0.003
(0.023)
-0.014
(0.037)
-0.168*
(0.079)
-0.263*
(0.117)0.791 1
* denotes 5 % level significance of t statistics;^ denotes equality to 1 at 5% level
62

8/2/2019 Interest Rate Pass Through in Ukraine
http://slidepdf.com/reader/full/interest-rate-pass-through-in-ukraine 71/81
Table 14. Interest rate pass through based on biviriate Var model from policy to lending rate redeemable in UAH. Short sample estimation
Banklending rate(ss)
Immediate pass through
Pass through in a month
Pass through after 12 months
Pass through after 36 months
Corre- lation coeffi- cient
Lag order of Var
To firms Up to 1
month
0.125
(0.260)
0.468^
(0.349)
0.523^
(0.391)
0.523^
(0.391)
0.177 1
From 1 to
3 months
0.139
(0.174)
0.638*^
(0.212)
0.669*^
(0.278)
0.669*^
0.278
0.366 1
From 3 to
6 months
0.428*
(0.152)
0.519*
(0.162)
0.546*
(0.179)
0.546*
(0.179)
0.210 1
From 6 to
12 months
0.319*
(0.080)
0.533*
(0.109)
0.639*
(0.149)
0.639*
(0.149)
0.407 1
Long term
notice
-0.001
(0.112)
-0.010
(0.121)
0.098
(0.107)
0.096
(0.107)
0.273 2
Tohouseholds Up to 1
month
0.682^
(0.473)
0.055^
(0.606)
0.025^
(0.605)
0.025^
(0.605)
0.276 1
From 1 to
3 months
-0.625
(0.354)
0.337^
(0.376)
0.174^
(0.333)
0.174^
(0.333)
0.187 1
From 3 to
6 months
0.609^
(0.323)
0.336^
(0.381)
0.389^
(0.378)
0.389^
(0.378)
0.166 1
From 6 to
12 months
0.141
(0.222)
-0.77
(0.262)
-0.235
(0.257)
-0.235
(0.257)
0.244 1
Long term
notice
-0.151
(0.129)
-0.305*
(0.139)
-0.280
0.201
-0.292
0.206
0.378 3
* denotes 5 % level significance of t statistics;^ denotes equality to 1 at 5% level
63

8/2/2019 Interest Rate Pass Through in Ukraine
http://slidepdf.com/reader/full/interest-rate-pass-through-in-ukraine 72/81
Table 15. Interest rate pass through based on biviriate Var model from policy to deposit rate redeemable at UAH. Full sample estimation
Bankdeposit rate(fs)
Immediate pass through
Pass through in a
month
Pass through after 12 months
Pass through after 36 months
Corre- lation coeffi- cient
Lag order of Var
To firms
Up to 1
month
0.021
(0.039)
0.048
(0.051)
0.274*
(0.096)
0.388*
(0.126)0.706 1
From 1 to
3 months
0.009
(0.025)
0.032
(0.032)
0.243*
(0.043)
0.368*
(0.067)0.792 1
From 3 to
6 months
-0.192*
(0.033)
-0.253*
(0.050)
-0.087
(0.083)
0.028
(0.087)
0.585 1
From 6 to
12 months
-0.009
(0.017)
0.008
(0.031)
0.114*
(0.079)
0.273*
(0.116)0.840 2
Long term
notice
-0.038
(0.024)
-0.019
(0.033)
0.293*
(0.056)
0.446*
(0.088)0.863 1
Tohouseholds
Up to 1
month
-0.063*
(0.028)
-0.087
(0.047)
0.011
(0.179)
0.354
(0.247)0.843 2
From 1 to
3 months
0.008
(0.009)
0.013
(0.023)
0.238*
(0.102)
0.555*
(0.149)0.904 2
From 3 to6 months
0.010(0.018)
0.024(0.028)
0.263*(0.108)
0.620*(0.182)
0.913 2
From 6 to
12 months
0.039
(0.023)
0.092*
(0.039)
0.629*
(0.111)
0.918*
(0.175)0.938 2
Long term
notice
0.006
(0.036)
0.094
(0.060)
-0.017
(0.353)
0.057
(0.748)0.915 3
* denotes 5 % level significance of t statistics;^ denotes equality to 1 at 5% level
64

8/2/2019 Interest Rate Pass Through in Ukraine
http://slidepdf.com/reader/full/interest-rate-pass-through-in-ukraine 73/81
Table 16. Interest rate pass through based on biviriate Var model from policy to deposit rate redeemable at UAH. Short sample estimation
Bankdeposit rate(fs)
Immediate pass through
Pass through in a month
Pass through after 12 months
Pass through after 36 months
Corre- lation coeffi- cient
Lag order of Var
To firms Up to 1
month
0.274
(0.664)
0.331
(0.868)
0.346
(0.934)
0.346
(0.934)0.225 1
From 1 to
3 months
0.734
(0.794)
0.360
(0.907)
0.435
0.912
0.435
(0.912)0.317 1
From 3 to
6 months
-0.535
(0.843)
0.128
(0.921)
0.043
(0.984)
0.043
(0.984)0.199 1
From 6 to12 months
0.189(0.512)
0.330(0.597)
0.333(0.606)
0.333(0.600)
0.250 1
Long term
notice
0.183
(0.377)
0.537
(0.324)
1.030*
(0.383)
1.021*
(0.388)0.156 3
Tohouseholds Up to 1
month
0.324*
(0.534)
2.18*^
(0.659)
2.214*^
(0.694)
2.214*^
(0.694)0.413 1
From 1 to
3 months
0.301
(0.232)
1.201*
(0.426)
2.501*^
(1.031)
2.502*^
(1.032)0.471 1
From 3 to
6 months
0.279
(0.257)
0.922*
(0.404)
1.293*
(0.609)
1.293*
(0.609)0.340 1
From 6 to
12 months
0.373
(0.339)
1.156*
(0.418)
1.131*
(0.444)
1.131*
(0.444)0.270 1
Long termnotice
0.424(0.383)
0.316(0.474)
0.337(0.491)
0.337(0.491)
0.460 1
* denotes 5 % level significance of t statistics;^ denotes equality to 1 at 5% level
65

8/2/2019 Interest Rate Pass Through in Ukraine
http://slidepdf.com/reader/full/interest-rate-pass-through-in-ukraine 74/81
Table 17. Interest rate pass through based on Multivariate VAR modelfrom market to credit rates redeemable at UAH. Full sampleestimation.
Bank lendingrate
Immediate passthrough
Passthroughin amonth
Passthroughafter 12months
Passthroughafter 36months
Lagorder of
Var
Marketratechosen
Inerbanklending rate with maturity of
To firms Up to 1
month0.099*
(0.022)
0.189*
(0.042)
0.401^
(0.030)
0.305^
(0.371)3
32 - 92
days From 1 to
3 months0.016
0.017
0.079*
(0.031)
0.308
0.198
0.056
(0.329)1
32 - 92
days From 3 to
6 months0.011
(0.013)
0.025
(0.023)
0.553^
(0.211)
0.333^
(0.597)2
32 - 92
days From 6 to
12 months0.007
(0.006)
0.047*
(0.012)
0.436
(0.160)
0.419^
(0.500)2
32 - 92
days Long term
notice0.018
(0.017)
0.046
(0.033)
0.072
(0.138)
0.049
(0.195)1
32-92
days
To
households Up to 1
month 0.040
(0.050)
0.066
(0.090)
0.233^
(0.460)
0.176
(0.496)2
32-92
days
From 1 to
3 months0.066
(0.036)
0.106*
(0.047)
0.245
(0.249)
0.060
(0.452)1
32-92
days
From 3 to
6 months0.009
(0.034)
0.032
(0.052)
-0.163
(0.192)
0.528
(0.375)1
32 - 92
days From 6 to
12 months-0.003
(0.027)
-0.017
(0.038)
0.042
(0.112)
0.624
(0.141)1
32-92
days
* denotes 5 % level significance of t statistics;
^ denotes equality to 1 at 5% level
66

8/2/2019 Interest Rate Pass Through in Ukraine
http://slidepdf.com/reader/full/interest-rate-pass-through-in-ukraine 75/81
Table 18. Interest rate pass through based on Multivariate VAR modelfrom policy to credit rates redeemable at UAH. Full sample estimation.
Bank lendingrate
Immediate passthrough
Passthroughin amonth
Passthroughafter 12months
Passthroughafter 36months
Lagorder of
Var
To firms Up to 1
month
0.017
(0.026)
0.063
(0.049)
0.808*^
(0.250)
1.852*^
0.4813
From 1 to
3 months
0.002
0.019
0.036
(0.033)
0.588*^
(0.124)
0.927*^
(0.201)1
From 3 to
6 months
0.034*
(0.014)
0.066*
(0.024)
0.510*^
(0.158)
1.271*^
(0.375)2
From 6 to
12 months
0.028*
(0.007)
0.057*
(0.014)
0.421*^
0.124
1.006*^
(0.380) 2Long term
notice
0.031
(0.019)
0.090*
(0.034)
0.753*^
(0.147)
1.128*^
(0.238)1
Tohouseholds Up to 1
month
0.131*
(0.056)
0.221*
(0.098)
0.936*^
(0.250)
1.502*^
(0.311)2
From 1 to
3 months
0.099*
(0.041)
0.148*
(0.048)
0.658*
(0.141)
1.063*^
(0.271)1
From 3 to
6 months
0.037
(0.038)
0.096
(0.054)
0.652*^
(0.110)
1.012*^
(0.229)1
From 6 to
12 months
0.011
(0.030)
0.010
(0.039)
0.119*
(0.062)
0.176*
(0.085)1
* denotes 5 % level significance of t statistics;^ denotes equality to 1 at 5% level
Table 19. Interest rate pass through based on Multivariate VAR modelfrom deposit to credit rates redeemable at UAH. Full sampleestimation.
Bank lendingrate
Immediate passthrough
Passthroughin amonth
Passthroughafter 12months
Passthroughafter 36months
Lag orderof Var
Depositratechosen
To households Tohouseholds
Up to 1month
0.216*(0.090)
0.456*(0.160)
1.184*^(0.547)
0.837*^(0.576)
2From 3 to6 months
From 1 to
3 months0.061(0.065)
0.206*(0.086)
0.622*^(0.251)
0.839*^(0.373)
1From 3 to
6 months
From 6 to
12 months-0.049(0.576)
0.022(0.069)
0.191(0.123)
0.228(0.131)
1From 1 to
6 months
67
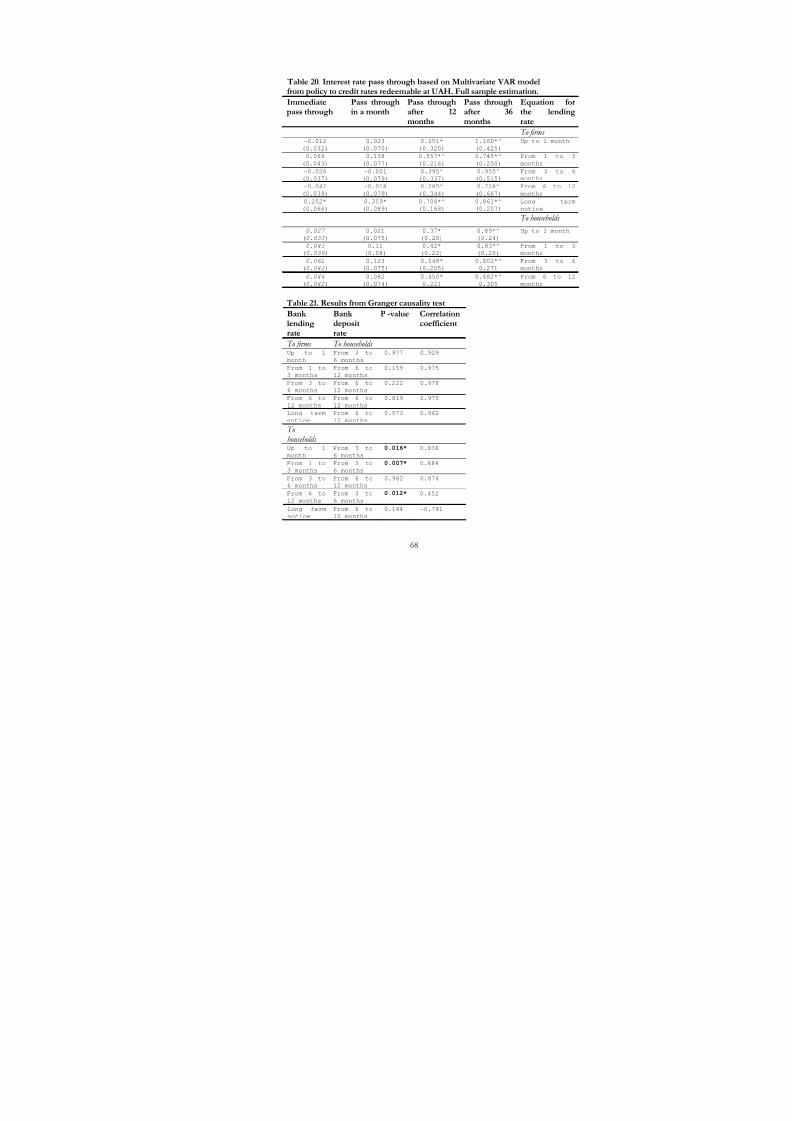
8/2/2019 Interest Rate Pass Through in Ukraine
http://slidepdf.com/reader/full/interest-rate-pass-through-in-ukraine 76/81
Table 20. Interest rate pass through based on Multivariate VAR modelfrom policy to credit rates redeemable at UAH. Full sample estimation.
Immediate pass through Pass throughin a month Pass throughafter 12months
Pass throughafter 36months
Equation forthe lendingrate
To firms -0.012
(0.032)
0.023
(0.070)
0.251*
(0.320)
1.160*^
(0.425)
Up to 1 month
0.069
(0.043)
0.138
(0.077)
0.557*^
(0.216)
0.745*^
(0.250)
From 1 to 3
months
-0.026
(0.037)
-0.001
(0.079)
0.395^
(0.337)
0.955^
(0.515)
From 3 to 6
months
-0.042
(0.039)
-0.018
(0.079)
0.285^
(0.344)
0.728^
(0.667)
From 6 to 12
months
0.252*
(0.066)
0.359*
(0.089)
0.708*^
(0.168)
0.861*^
(0.207)
Long term
notice
To households
0.027
(0.033)
0.021
(0.075)
0.37*
(0.20)
0.89*^
(0.24)
Up to 1 month
0.043
(0.039)
0.11
(0.08)
0.42*
(0.22)
0.83*^
(0.25)
From 1 to 3
months
0.062
(0.042)
0.123
(0.075)
0.548*
(0.205)
0.802*^
0.271
From 3 to 6
months
0.046
(0.042)
0.082
(0.074)
0.450*
0.221
0.682*^
0.309
From 6 to 12
months
Table 21. Results from Granger causality test
Bank lendingrate
Bank depositrate
P -value Correlationcoefficient
To firms To households Up to 1
month
From 3 to
6 months 0.977 0.929
From 1 to
3 months
From 6 to
12 months 0.159 0.975
From 3 to
6 months
From 6 to
12 months 0.222 0.978
From 6 to
12 months
From 6 to
12 months 0.819 0.975
Long term
notice
From 6 to
12 months
0.573 0.962
Tohouseholds Up to 1
month
From 3 to
6 months 0.016* 0.836
From 1 to
3 months
From 3 to
6 months 0.007* 0.884
From 3 to
6 months
From 6 to
12 months 0.982 0.874
From 6 to
12 months
From 3 to
6 months 0.012* 0.452
Long term
notice
From 6 to
12 months 0.144 -0.741
68

8/2/2019 Interest Rate Pass Through in Ukraine
http://slidepdf.com/reader/full/interest-rate-pass-through-in-ukraine 77/81
Chart 5. The amount of credits ginev in the economy.
0,0
10 000,0
20 000,0
30 000,0
40 000,0
50 000,0
60 000,0
70 000,0
80 000,0
90 000,0
100 000,0
A p r 2 0 0 3
J u l 2 0 0 3
O c t 2 0 0 3
J a n 2 0 0 4
A p r 2 0 0 4
J u l 2 0 0 4
O c t 2 0 0 4
J a n 2 0 0 5
A p r 2 0 0 5
J u l 2 0 0 5
O c t 2 0 0 5
J a n 2 0 0 6
A p r 2 0 0 6
J u l 2 0 0 6
M i l l i o n s o f h r y v n a s
Credits given to enterprises, UAH Credits given to households, UAH
Chart 6. Interest rate pass through Chart 7. Interest rate pass through toto lending rates redeemable in UAH. Lending rates redeemable in the USFull sample esimation. dollar. Full sample estimation
(The change in lending rate to the 1% cumulative (The change in lending rate to the 1 % cumulativeshock in market rate) shock in market rate)
Chart 8. Interest rate pass through Chart 9. Interest rate pass through toto deposit rates to firms redeemable deposit rates to householdsin UAH. Full sample estimation. redeemable in UAH.
Full sample estimation
(The change in deposit rate to the 1 % cumulative (The change indepos rate to the 1 % cumulativeitshock in market rate) shock in market rate)
69

8/2/2019 Interest Rate Pass Through in Ukraine
http://slidepdf.com/reader/full/interest-rate-pass-through-in-ukraine 78/81
Chart 10. Interest rate pass through Chart 11. Interest rate pass through toto lending rates redeemable in UAH. Lending rates redeemable in the USShort sample esimation. dollar. Short sample estimation
(The change in lending rate to the 1 %cumulative (The change in lending rate to the 1% cumulativeshock in market rate) shock in market rate)
Chart 12. Interest rate pass through Chart 13. Interest rate pass through toto deposit rates to firms redeemable deposit rates to householdsin UAH. Short sample estimation. redeemable in UAH.
Short sample estimation(The change in deposit rate to the 1 % cumulative (The change in depo t rate to the 1 % cumulativesishock in market rate) shock in market rate)
Chart 14. Interest rate pass through Chart 15. Interest rate pass through toto lending rates redeemable in UAH. lending rates redeemable in the UAHMonetary policy approach Monetary policy approachFull sample esimation. Short sample estimation(The change in lending rate to the 1 %cumulative (The change in lending r te to the 1% cumulativeashock in discount rate) shock in discount rate)
70

8/2/2019 Interest Rate Pass Through in Ukraine
http://slidepdf.com/reader/full/interest-rate-pass-through-in-ukraine 79/81
Chart 16. Interest rate pass through Chart 17. Interest rate pass through toto lending rates to households lending rates to households redeemableredeemable in the UAH. Monetary in UAH. Monetary policy approach.
policy approach. Full sample Short sample estimation.esimation.(The change in lending rate to the 1 %cumulative (The change in lending r te to the 1% cumulativeashock in discount rate) shock in discount rate)
Figure 18. Interest rate pass through Figure 19. Interest rate pass through toto deposit rates redeemable in UAH. deposit rates redeemable in the UAHMonetary policy approach. Monetary policy approach.Full sample esimation. Short sample estimation(The change in deposit rate to the 1 %cumulative (The change in deposit r te to the 1% cumulativeashock in discount rate) shock in discount rate)
71

8/2/2019 Interest Rate Pass Through in Ukraine
http://slidepdf.com/reader/full/interest-rate-pass-through-in-ukraine 80/81
INDEX
A Aristotle,3
72

8/2/2019 Interest Rate Pass Through in Ukraine
http://slidepdf.com/reader/full/interest-rate-pass-through-in-ukraine 81/81