interest rate derivatives in indian banks issn1452-4864/5_1_2010_may_1-188... · interest rate...
TRANSCRIPT

1. INTRODUCTION
The Banking sector has played a
commendable role in fuelling and sustaining
growth in the economy. It helps in
mobilizing the nations saving and in
channelizing them into high investment
priorities and better utilization of available
resources. Modern banking is something
different from lending and borrowing. They
accept risk in order to earn profits. In doing
so they recognize that there are different
types of risk such as credit risk, operational
risk, interest rate risk, liquidity risk, price
risk, foreign exchange risk, etc. Out of these
risks Interest rate risk is the most prevalent
risk which refers to the exposure of a bank’s
financial condition to adverse movements in
interest rate. It is the risk to earnings and
capital that if market rates of interest changes
unfavorably. This risk arises from
differences in timing of changes in rates, the
timing of cash flows (reprising risk),
changes in the shape of the yield curve (yield
INTEREST RATE DERIVATIVES IN INDIAN BANKS
Shashi Srivastava and Divya Srivastava*
Faculty of Management Studies, Banaras Hindu University, Varanasi, India
(Received 7 October 2009; accepted 19 January 2010)
Аbstract
The present research paper makes an attempt to provide a comprehensive profile of the global
OTC derivatives market, with special reference to interest rate derivatives. It has analyzed various
issues related to interest rate derivatives in Indian banks. The study would also examine if there is
any significant impact of ownership structure on the use of interest rate derivatives in sample banks.
To serve this particular objective the study is based on two major giants, the largest public sector and
private sector bank in India namely SBI and ICICI Bank. Different variables such as Total Asset,
Deposit, Advances, Tier I Capital, ROA, ROE, Interest Margin, Total loan Ratio, Total deposit Ratio,
etc have been analyzed with the help of various statistical tools such as ratios, correlation and
ANOVA to find out the extent to which these banks have managed the adverse movements in interest
rate with the help of interest rate derivatives.
Keywords: Over-the Counter (OTC) derivative market, Interest Rate Derivatives (IRD).
* Corresponding author: [email protected]
S e r b i a n
J o u r n a l
o f
M a n a g e m e n t
Serbian Journal of Management 5 (1) (2010) 111 - 125
www.sjm06.com

curve risk) and option values embedded in
the products (options risk). In essence, the
market value of banks assets (i.e. loans and
securities) will fall with increase in interest
rates. In addition earnings from assets, fees
and the cost of borrowed funds are affected
by changes in interest rates.
Accepting this risk is a normal part of
banking and can be an important source of
profitability and shareholder’s value.
Changes in interest rate effect a bank’s
earning by changing its net interest income
and the level of other interest sensitive
income and operating expenses. Interest rate
refers to volatility in net interest income
(NII) or in variation in net interest margin
(NIM) i.e. NII divided by earning assets due
to changes in interest rate. In other words,
interest rate risk arises from holding assets
and liabilities with different principal and
maturity dates or reprising dates.
Accordingly, an effective risk management
process that maintains interest rate risk
within prudent levels is essential to the safety
and soundness of banks. Banks can reduce
their interest rate risk by hedging with
derivatives securities and by using the
asset/liability management techniques.
The emergence of the market for
derivative product can be traced back to the
willingness of risk–averse economic agents
to guard themselves against uncertainties
arising out of fluctuation in asset prices. By
their very nature financial markets are
marked by a very high volatility. Through the
use of derivatives products, it is possible to
partially or fully transfer price risk by
locking in asset prices. These products
initially emerged as hedging devices against
fluctuation in commodity prices. Commodity
linked derivatives remained the sole form of
such products for almost three hundred year.
Financial derivatives came into spotlight in
the post 1970 period due to growing
instability in the financial market. They are
defined as financial instruments whose
payoff is based on the price of an underlying
asset, reference rate or an index. However
since their emergence, these products have
been very popular and by 1990’s they
accounted for about 2/3 of total transaction
in derivatives products. In recent years the
market for financial derivatives has grown
tremendously in terms of, variety of
instruments available, their complexity and
also turnover. In generic terms, markets are
meant for price determination and exchange
of goods and services, indeed prices are the
balancing wheels of the market mechanism.
In that context, derivatives are considered
facilitators of price discovery in financial
market and also as risk allocators. They add
to the completeness of financial market that
is by their very nature marked by a very high
degree of volatility. An interest rate
derivative is a derivative where the
underlying asset is the right to pay or receive
a (usually notional) amount of money at a
given Interest rate. In the wake of
deregulation of interest rates as part of
financial sector reforms, a need was felt to
introduce hedging instruments to manage
interest rate risk. The Reserve Bank had
introduced interest rate swaps (IRS) and
forward rate agreements (FRA) in March
1999 and interest rate futures (IRF) in 2003
and reintroduced IRF on 31st Aug 2009.
2. RESEARCH METHODOLOGY
The present research paper makes an
attempt to examine the various aspects
related to interest rate derivatives in Indian
banks. This paper has also emphasized on the
contribution of various segments in the
112 S.Srivastava / SJM 5 (1) (2010) 111 - 125

global OTC derivatives market. The present
study makes an attempt to test the hypothesis
that there is no relationship between
ownership structure and the use of interest
rate derivatives in the sample banks. To serve
this particular objective the study is based on
two major giants, the largest public sector
and private sector bank in India namely State
Bank of India (SBI) and Industrial Credit and
Investment Corporation of India (ICICI)
Bank (ICICI) Bank. The time duration for
the study was from 2006 to 2009. Secondary
data have been collected from the websites
of Bank for International Settlement and
Annual Reports of SBI and ICICI Bank. This
paper makes an effort to study different
variables such as Total Asset, Deposit,
Advances, Tier I Capital, ROA, ROE,
Interest Margin, Total loan Ratio, Total
deposit Ratio, etc with an objective to study
the role of interest rate derivatives in the
sample banks.
2.1. The Global OTC Derivatives
Market
Derivative contracts are entered into or
traded, either OTC or on exchanges. In Over
the counter market, trades are contracted and
prices agreed bilateral, i.e. between a pair of
one seller and one buyer, either directly or by
the intermediation of brokers through
electronic communication system. Table 1,
show different segments in the global OTC
derivatives market where interest rate
derivatives contribute nearly 70 % in the
global OTC derivatives market followed by
foreign exchange contracts and credit default
swaps by 8.4 % and 7.07 % respectively.
Equity-linked contracts and Commodity
contracts are far behind with 1.09 % and
0.74 % respectively (see Figure 1) till Dec
2008.
The total notional amounts outstanding
grew at 13.23 % from June 2007 to Dec2007
whereas it grew at 14.85 % during Dec 2007
to June 2008. The amount decreased by
13.42 % in Dec 2008. This was due to the
financial crisis in the second half of 2008
resulting in the first ever decline in the total
notional amounts outstanding of over-the-
counter (OTC). Gross market values, which
measure the cost of replacing all existing
contracts, represent a better measure of
market risk than notional amounts. Despite
the drop in amounts outstanding, significant
price movements resulted in notably higher
gross market values, which increased by
66.5 % to amount $ 33.9 trillion at the end of
December 2008. In the second half of 2008
the market for OTC interest rate derivatives
declined for the first time. Notional amounts
of these instruments fell to $ 418.7 trillion at
the end of December 2008, 8.6 % lower than
six months before. Despite the decrease in
notional amounts outstanding, declining
interest rates resulted in a notable 98.9 %
increase in the gross market value of interest
rate derivatives to amount $ 18.4 trillion
(Table 1).
The volume of outstanding CDS
contracts fell by 27.0 % to $ 41.9 trillion in
Dec 2008 against a background of severely
strained credit markets and increased
113S.Srivastava / SJM 5 (1) (2010) 111 - 125
Figure 1. Global OTC Derivatives marketsegmentation

multilateral netting of offsetting positions by
market participants. This was a continuation
of the developments seen in the first half of
2008. Single-name contracts declined by
22.8 % to $ 25.7 trillion while multi-name
contracts, a category that includes CDS
indices and CDS index trenches saw a more
pronounced decrease of 32.7 %, to $ 16.1
trillion. Despite the lower outstanding
volumes, the gross market value for CDS
contracts increased by 78.2 % to $ 5.7 trillion
as a result of the credit market turmoil. Gross
market values grew 95.6 % to $ 3.7 trillion
for single-name contracts and 52.5 % to $ 2.0
trillion for multi-name contracts. Greater use
of multilateral netting during the second half
of 2008 also resulted in a change in
composition across contract types. Amounts
outstanding of multi name contracts fell
32.7 % to $ 16.1 trillion, while the 22.8 %
decline in single-name contracts to $ 25.7
trillion was somewhat smaller.
114 S.Srivastava / SJM 5 (1) (2010) 111 - 125
Notional amounts outstanding Gross market values
Jun2007 Dec 07 Jun2008 Dec 2008 Jun07 Dec 07 Jun 08 Dec 08
GRAND
TOTAL
516,407 595,341 13.23%
683,726 14.85%
591,963 -13.42%
11,140 15,813 41.95%
20,353 28.71%
33,889 66.51%
A. Foreign
exchange
contracts
48,645 56,238 15.61%
62,983 11.99%
49,753 -21.01%
1,345 1,807 34.35%
2,262 25.18%
3,917 73.17%
Forwards and
forex swaps
24,530 29,144 31,966 24,562 492 675 802 1,732
Currency
swaps
12,312 14,347 16,307 14,725 619 817 1,071 1,588
Options 11,804 12,748 14,710 10,466 235 315 388 597
B. Interest
rate contracts
347,312 393,138 13.19%
458,304 16.58%
418,678 -8.65 %
6,063 7,177 18.37%
9,263 29.07%
18,420 98.86%
FRAs 22,809 26,599 39,370 39,262 43 41 88 153
Swaps 272,216 309,588 356,772 328,114 5,321 6,183 8,056 16,573
Options 52,288 56,951 62,162 51,301 700 953 1,120 1,694
C. Equity
contracts
8,590 8,469 -1.41%
10,177 20.17%
6,494 -36.19%
1,116 1,142 2.33%
1,146 0.35%
1,113 -2.88%
Forward swap 2,470 2,233 2,657 1,632 240 239 283 338
Options 6,119 6,236 7,520 4,862 876 903 863 775
D.Commodity
contracts
7,567 8,455 11.74
13,229 56.46%
4,427 -66.59%
636 1,899 198.5%
2,209 16.32%
955 -56.77%
Gold 426 595 649 395 47 70 68 65
Other 7,141 7,861 12,580 4,032 589 1,829 2,142 890
Forwardswaps 3,447 5,085 7,561 2,471
Options 3,694 2,776 5,019 1,561
E.Credit
default Swaps
42,581 57,894 35.96%
57,325 -0.98%
41,868 -26.96%
721 2,002 177.6%
3,172 58.44%
5,652 78.18%
Single-name
instrument
24,239 32,246 33,334 25,730 406 1,143 1,889 3,695
Multiname
instruments
18,341 25,648 25,648 16,138 315 859 1,283 1,957
F.Unallocated 61,713 71,146 81,708 70,742 1,259 1,788 2,301 3,831
Table I. The Global OTC Derivatives Market (Amts. outstanding in billions of US dollars)
Source: Bank for International Settlement, May 2009

Notional amounts outstanding of foreign
exchange derivatives decreased by 21.0 % to
$ 49.8 trillion. Gross market values rose by
73.2% to $ 3.9 trillion. FX derivatives in
terms of notional amounts, declined by
23.1 %, while options volumes fell 28.8 %.
In contrast, outstanding volumes of currency
swaps saw a more moderate contraction of
9.7 %. The US dollar and the euro remained
the most important vehicle currencies,
followed by the yen and sterling.
Amounts outstanding of OTC commodity
derivatives fell by a solid 66.5 % in the
second half of 2008 to $ 4.4 trillion.
Contracts on gold contracted by 39.2%, to
$ 0.4 trillion at the end of 2008, while other
commodity derivatives slid by 68.0 % to
$ 4.0 trillion. The continued decreases in
commodity prices during the second half of
2008 also had a substantial impact on the
gross market value of commodity contracts,
which fell by 56.8 % to $ 1.0 trillion.
In the second half of 2008 positions in
OTC equity derivatives decreased by 36.2 %
to $ 6.5 trillion, well below the levels seen in
recent years and a notable change of pace
from the 20.1 % increase in the first half of
2008. The decline in outstanding amounts
was of the same relative size across contract
types. Reflecting lower outstanding positions
and significantly decreased equity prices, the
gross market values of outstanding equity
derivatives declined a moderate 2.8 %. This
change was driven mainly by the gross
market value of options, which account for
around three quarters of all notional amounts
outstanding. The market value of options fell
10.1 % to $ 0.8 trillion, while the gross
market value of forwards and swaps
increased by 19.5 % to $ 0.3 trillion.
2.2. The Global OTC Interest Rate
Derivatives market
Interest rate derivatives are extensively
used by different market players world over,
such as Corporations, banks, insurance
companies, fund managers, governments,
individuals and the financial services
industry. They use interest rate derivative as
a tool to solve their financial risk
management problems. The notional amount
outstanding has increased from 347,312 to
393,138 and 458,304 (billion US Dollar) in
Jun 07, Dec 07 and Jun 08 respectively but
has declined by nearly 40,000 billion US
Dollar in Dec 2008. On the other hand the
gross market value has been just doubled
which depicts that most of the existing
contracts has been settled during that period
(Table 2).
115S.Srivastava / SJM 5 (1) (2010) 111 - 125
Notional amounts outstanding Gross market values
Jun 07 Dec 07 Jun 08 Dec 08 Jun07 Dec07 Jun08 Dec08
Total contracts 347,312 393,138 458,304 418,678 6,063 7,177 9,263 18,420
Reporting
dealers
148,555 157,245 5.8%
188,982 20.18%
162,970 -13.76%
2,375 2,774 16.8%
3,554 28.11%
6,629 86.52%
Other financial
institutions
153,370 193,107 25.90%
223,023 15.49%
214,107 -3.99%
2,946 3,786 28.51%
4,965 31.14%
10,731 116.13%
Nonfinancial
customers
45,387 42,786 -5.73%
46,299 8.21%
41,601 -10.14%
742 617 -
16.84%
745 20.74%
1,061 42.41%
Upto1 yr 132,402 127,601 153,181 137,278
1 - 5 yrs 125,700 134,713 150,096 138,263
Table 2: The Global OTC Interest Rate Derivatives (Amts in billions of US dollars)
Source: Bank for International Settlement, May 2009

The global Interest rate derivatives market
has been divided into different market
participants namely reporting dealers,
financial institutions and non financial
institutions. Bank for International
Settlement has identified these groups
namely reporting dealers the institutions,
whose head office is located in G10
countries and which participate in the
semiannual OTC derivatives market
statistics, financial institutions such as
commercial, investment banks, security
houses and lastly non financial institutions.
The notional amount outstanding used by
reporting dealers grew by four times in Jun
2008 but decreased by 13.76 % in Dec 2008.
Financial institutions show a decreasing
trend from 26 % in Dec 2007 to 15.49 % in
June 2008 and again 4 % in Dec2008. The
non financial institutions exhibit an uneven
trend, i.e. decrease by 5.73 % in Dec 07, an
increase by 8.21 % in Jun 2008 and again a
decrease by 10 % in Dec 2008. On the other
hand gross market value of reporting dealers
shows an accelerated growth from 28.11 %
to 86.52 % in Dec 2008 which signifies that
the cost of replacing all existing contracts
has increased drastically. The same trend was
reported by other two users. The financial
institution recorded an increase of 31 % to
116 % June-Dec 2008 while non financial
institutions have registered an increase from
20.74 % in June 2008 to 42 % in Dec 2008.
The use of interest rate derivatives by
different market participants are almost the
same with negligible fluctuations over the
years. The use of interest rate derivatives in
financial institutions range in between 40%
to 50 % during the study period, whereas it
was recorded between 38 % to 42 % and
10 % to 15 % by reporting dealers and by
non financial customers respectively during
the same time horizon (see Figure 2). The
trend on the basis of maturity remains almost
the same, over the years. Contracts up to 1
year maturity remains high than the contract
with maturity up to 5 years which means
shorter period contracts are more popular
than contracts with maturity period up to 5
years (Figure 3).
2.3. Implication of Interest Rate
Derivatives in Indian Banks
Bank participation in derivative markets
has risen sharply in recent years. A major
concern facing policymakers and bank
regulators today is the possibility that the
rising use of derivatives has increased the
riskiness and profitability of individual
116 S.Srivastava / SJM 5 (1) (2010) 111 - 125
Figure 2. Global IRD used by different Participants

banks and of the banking system as a whole.
Scheduled commercial banks reduced their
off-balance sheet exposure by 26.4 percent
during 2008-09, partly due to strengthening
of prudential norms by RBI. Figure 4, shows
a decrease in 2009 in both the banks. Interest
rate derivatives used in ICICI was maximum
in March 2008 amounting Rs.563, 103.00 cr.
which has decreased to Rs.195, 652.76 cr. in
March 2009. SBI has used interest rate
derivatives conservatively with a slight
increase from 2006 to 2007 but has shown a
decreasing trend from Rs.186, 610.16 cr. in
2007 to Rs.155, 928.42 cr. in 2008 and
Rs.97, 690.50 cr. in 2009. Significant
decrease was recorded in the use of interest
rate derivatives in SBI as well as in ICICI
Bank during March 2008 to March 2009 due
to global slow down. ICICI Bank, the
country's second largest bank, has the
exposure of 195,652.76 Cr. in Interest Rate
Derivatives in March 2009. SBI, the
country's largest bank, has an estimated
exposure of Rs.97, 690.50 cr. in Interest Rate
Derivatives during the same period.
The primary objective of any investor is
to maximize returns and minimize risks
(uncertainty of outcome). It can cause both
117S.Srivastava / SJM 5 (1) (2010) 111 - 125
Figure 3. Global IRD on the basis of Maturity
Figure 4. IRD in SBI and ICICI Bank
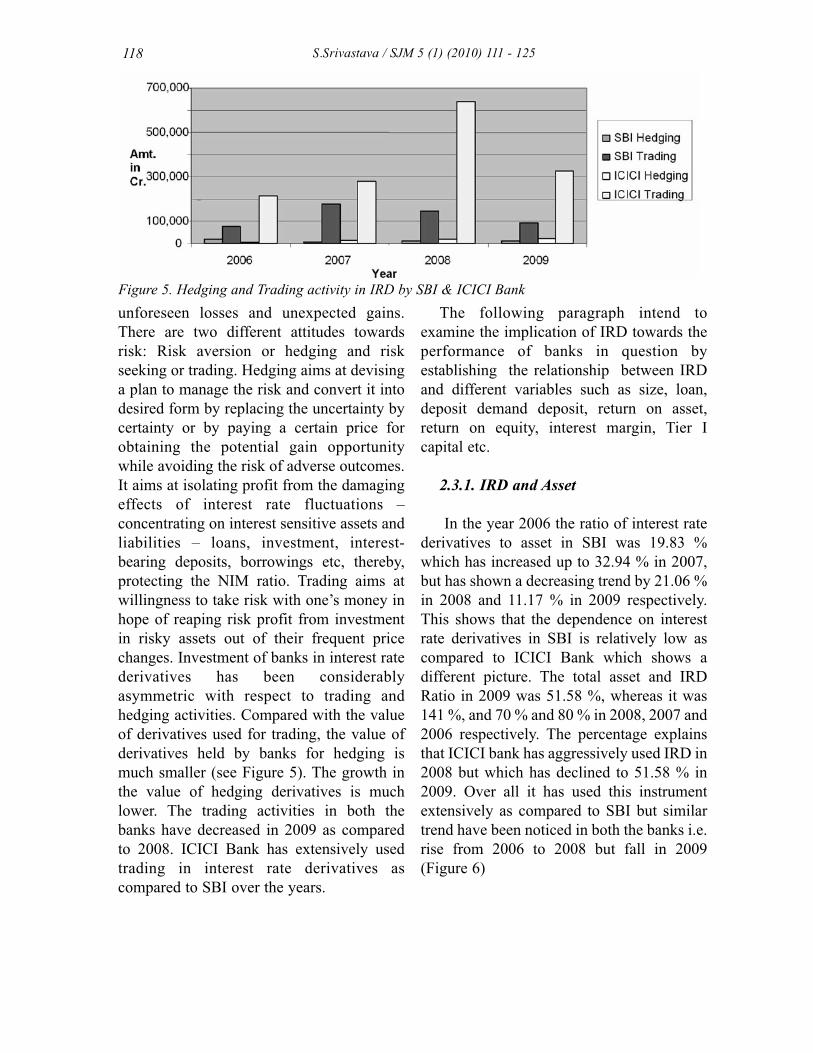
unforeseen losses and unexpected gains.
There are two different attitudes towards
risk: Risk aversion or hedging and risk
seeking or trading. Hedging aims at devising
a plan to manage the risk and convert it into
desired form by replacing the uncertainty by
certainty or by paying a certain price for
obtaining the potential gain opportunity
while avoiding the risk of adverse outcomes.
It aims at isolating profit from the damaging
effects of interest rate fluctuations –
concentrating on interest sensitive assets and
liabilities – loans, investment, interest-
bearing deposits, borrowings etc, thereby,
protecting the NIM ratio. Trading aims at
willingness to take risk with one’s money in
hope of reaping risk profit from investment
in risky assets out of their frequent price
changes. Investment of banks in interest rate
derivatives has been considerably
asymmetric with respect to trading and
hedging activities. Compared with the value
of derivatives used for trading, the value of
derivatives held by banks for hedging is
much smaller (see Figure 5). The growth in
the value of hedging derivatives is much
lower. The trading activities in both the
banks have decreased in 2009 as compared
to 2008. ICICI Bank has extensively used
trading in interest rate derivatives as
compared to SBI over the years.
The following paragraph intend to
examine the implication of IRD towards the
performance of banks in question by
establishing the relationship between IRD
and different variables such as size, loan,
deposit demand deposit, return on asset,
return on equity, interest margin, Tier I
capital etc.
2.3.1. IRD and Asset
In the year 2006 the ratio of interest rate
derivatives to asset in SBI was 19.83 %
which has increased up to 32.94 % in 2007,
but has shown a decreasing trend by 21.06 %
in 2008 and 11.17 % in 2009 respectively.
This shows that the dependence on interest
rate derivatives in SBI is relatively low as
compared to ICICI Bank which shows a
different picture. The total asset and IRD
Ratio in 2009 was 51.58 %, whereas it was
141 %, and 70 % and 80 % in 2008, 2007 and
2006 respectively. The percentage explains
that ICICI bank has aggressively used IRD in
2008 but which has declined to 51.58 % in
2009. Over all it has used this instrument
extensively as compared to SBI but similar
trend have been noticed in both the banks i.e.
rise from 2006 to 2008 but fall in 2009
(Figure 6)
118 S.Srivastava / SJM 5 (1) (2010) 111 - 125
Figure 5. Hedging and Trading activity in IRD by SBI & ICICI Bank

2.3.2. IRD and Loan ratio
Bank loans as an asset are risky
investments by banks in various areas,
ranging from commercial and industrial
loans to loans to individual customers. These
loans typically have longer maturity and
higher interest rate sensitivities than
liabilities. Interest rate risk arises when there
is maturity mismatches between banks asset
and liabilities. One way to manage this risk is
to increase or decrease the holding of asset
that give rise to the interest rate risk. Such
operation would involve the acquisition of
new assets, i.e. making new loans, or
premature sale of existing assets, which may
interrupt the lending policy and may damage
the relationship with corporate clients as well
as. As a risk management instrument,
derivatives provide additional opportunity to
mange the risk exposures in banks. Duffee
and Zhou (2001) have concluded that, banks
decision on hedging with derivatives may be
related to their loan making activities.
Brewer, Minton and Moser (2000) find a
positive relation between banks use of
interest rate derivatives for hedging and the
making of loans (Figure 7).
While calculating the ratio between
advances and IRD we found that the ratio of
advances to IRD was 2.67 in 2006, 1.80 in
119S.Srivastava / SJM 5 (1) (2010) 111 - 125
Figure 6. Asset and IRD in SBI and ICICI Bank
Figure 7. Asset, loan and IRD in SBI

2007, again 2.67 in 2008 and 5.037 in 2009.
While in the case of ICICI Bank the ratio
between the two is much lower which means
that the dependency between advance and
IRD is much higher as compared to SBI. In
2006 it was .722, in 2007 it was .810, in 2008
it was .400 and in 2009 it reached to 1.11
(Figure 8).
2.3.3. IRD and Bank profitability
The literature generally shows a negative
relation between profitability and the
hedging behavior for financial entities
(Purnanandam2006). More profitable banks
appear to have stronger financial strength
against adverse shocks and are remote from
financial distress which reduces the
likelihood for hedging. Return to total asset
(ROA) is useful in the study of the over all
efficiency of a bank in using its asset. Return
to equity (ROE) is particularly important to
shareholders and is related to the charter
value of a bank. The ratio of net interest
income to total asset (interest margin),
focuses on the interest –income generating
ability of banks. The return on asset has
increasing from 0.89 to 1.04 during 2006 to
2009 SBI but in case of ICICI Bank it has
marginally decreased from 1.3 to 1 during
the same period (Figure 9). The return on
equity was 15.47 in 2006 which decreased to
14.24 in 2007, but reached to its highest level
i.e. 17.82 in 2008. It has further decreased to
120 S.Srivastava / SJM 5 (1) (2010) 111 - 125
Figure 8. Asset, loan and IRD in ICICI Bank
Figure 9. ROA in SBI and ICICI Bank

15.73 in 2009. In case of ICICI Bank it has
shown a negative trend from 16.4 to 13.4 in
2006 and 2007 and again 11.1 to 7.7 in 2008
and 2009(Figure 10). Interest margin was
minimum in the case of SBI which ranged in
between 0.02 to 0.07 during 2006 to 2009
whereas in ICICI Bank it has ranged between
2.2 to 2.4. High interest margin is the
indicator of high risk in terms of interest
rates which in turn is a positive indicator for
the use of interest rate derivatives. This may
be a reason why ICICI Bank has extensively
used interest rate derivatives than SBI
(Figure 11).
2.3.4. IRD and Deposits
The flow of deposit provides a natural
hedging for banks to cover their liquidity
needs a potential substitution for derivatives.
High level of withdrawal risk reduces the
liquidity of the deposit from the bank’s
121S.Srivastava / SJM 5 (1) (2010) 111 - 125
Figure 10. ROE in SBI and ICICI Bank
Figure 11. Interest margin is SBI and ICICI Bank

perspective and in turn reduces the potential
ability to substitute other hedging
instruments such as derivatives. An
increasing trend could be seen in the deposit
ratio in the case of SBI i.e. 76.93 in 2006, 77
in 2007, 74 in 2008 and again 77 in 2009
except a decrease in 2008(74).On the
contrary, in ICICI Bank it was recorded as
65.67, 66.88, 64.44 and 57.57 in 2006, 2007,
2008 and 2009 respectively showing a mixed
trend. The demand deposit ratio was 13.76 in
2006, 14 in 2007 and 2008, and 11.48 in
2009 in SBI while in the case of ICICI Bank
it was 6.59, 6.2, 5.7 and 6.18. This implies
that demand deposit is more in ICICI as
compared to SBI during the same period
under study (Fig.12).
2.3.5. IRD and Tier I capital
The risk adjusted capital requirement such
as the tier I capital in the Basel II framework
is intended to serve as safety cushion against
various contingencies. Banks with stronger
capital position are arguably more capable of
servings interest rate. In this sense the capital
reserve of banks and other risk management
policies such as derivatives may be substitute
for each other. Controlling for the risk profile
of bank loans, there ought to be a negative
association between bank capital and the use
of other risk management institution such as
derivatives. In the case of SBI Tier I capital
has been fluctuating from year to year. It was
9.36 in 2006, but decreased to 8.01 in 2007.
It has again registered an increase up to 9.14
in 2008 but again decreased to 8.53 in 2009.
In the case of ICICI Bank Tier I Capital has
been increased from 9.2 to 11.84 in between
2006 to 2009 with an exception in
2007(7.42) (Fig.13).
3. OWNERSHIP STRUCTURE AND
USE OF INTEREST RATE
DERIVATIVES
The present study has used correlation as
well as ANOVA test in order to establish the
relationship between the ownership structure
and the use of interest rate derivatives. While
calculating the correlation between the asset
and IRD, it is evident from the Table: 3 that
there is a negative correlation between the
two (-0.07) which means that as asset
increases the investment in interest rate
derivatives decreases in SBI. In the case of
ICICI Bank approximately zero correlation
122 S.Srivastava / SJM 5 (1) (2010) 111 - 125
Figure 12. Total deposit and Demand Deposit Ratio in SBI and ICICI Bank

was found (0.0006) which means that there
was no relation or the two variables are
independent to each other and no predictive
pattern could be identified between the two.
Negative correlation was found in between
the loan and IRD (-0.014 %) in SBI
signifying that as the loan increases the
investment in interest rate derivatives
decreases while positive correlation was
found in ICICI Bank (0.36). Similarly,
negative correlation was found in SBI in
deposit and demand deposit ratio -0.02 and -
0.59 respectively. In the case of ICICI Bank
positive correlation was found in deposit
ratio 0.25 and negatives correlation in
demand deposit -0.90. In the case of SBI
negative correlation exists in ROA, ROE and
interest margin which depicts that as the
three increases interest rate derivatives
decreases and vice-versa. In the case of
ICICI Bank positive correlation was seen,
which means that as ROA and ROE
increases the use of IRD also increases.
Interest margin and IRD show a negative
correlation. While calculating the correlation
between IRD and Tier I Capital it was found
a negative correlation with a value of -0.10,
which means that as Tier I capital increases
IRD decreases and vice-versa. In ICICI Bank
we can see positive correlation (0.43) which
means that as tier I capital increases use of
IRD in ICICI Bank also increase.
While applying the Analysis of Variance
Test it was found that the calculated value of
F is smaller than the table value, hence the
hypothesis is accepted i.e. sample means in
both banks are equal with respect to IRD,
Net NPA and Tier I Capital. The hypothesis
is rejected in the case of advances proving
that sample means of the banks in question
are different (Table 4).
4. CONCLUSION
Public sector banks are operated by
government bodies with a share of more than
51 % and have deep commitment to social
123S.Srivastava / SJM 5 (1) (2010) 111 - 125
Figure 13. Tier I Capital
Bank Asset Deposit Deposit
ratio
Demand
deposit
ratio
Loan NPA% Tier I
Capital
ROA ROE Interest
margin
SBI -0.07 -0.25 -0.02 -0.59 -0.014 -0.19 -0.10 -0.12 -0.25 -0.14
ICICI 0.0006 0.02 0.25 -0.90 0.36 0.23 0.43 -0.04 0.72 -0.67
Table 3. Correlation table (between variables and IRD)

obligations. The government owns 59.41
percent stake in SBI. Private sector banks are
the banks which are controlled by the private
lenders with the approval from the RBI; they
are basically committed to earn profit. As the
public and private sector banks are different
in their policy making, it was also proved in
the present study that SBI and ICICI Bank
differ in their approach towards the use of
interest rate derivatives. The study of
different variable reveals that a negative
correlation have been found in SBI which
mean that as the volume of asset, loan,
deposit, demand deposit, ROA, ROE,
Interest margin, NPA, Tier I capital increases
the investment in IRD decreases. On the
other hand ICICI Bank shows almost
positive correlation in all the variables
except demand deposit and ROA, which
means as the variables, increases the use of
IRD, also increases. The difference in the
pattern of investment in IRD may be
attributed to the change in ownership
structure and policies adopted by these two
banks. As banks grow larger and make more
loans, the systematic risk can be captured by
the size of the banks as in the case of SBI, the
largest bank in India which seems to be
conservative in using interest rate
derivatives. On the other hand ICICI Bank
has used this instrument extensively. Almost
similar pattern of fluctuations could be seen
among the variables, over the years but the
predictability remains uncertain due to
limited data available, which is a major draw
back in this research paper, although few
suggestions could be useful. The interest rate
risk is managed by the large pool of asset in
the case of SBI while ICICI Bank has
emphasized on innovative risk management
tool and has invested in IRD.
124 S.Srivastava / SJM 5 (1) (2010) 111 - 125
IRD Advances Net
NPA
Tier I
Capital
Accepted A(3.11) A(2.13) A(1.3462)
Rejected R(10.26)
Table 4. ANOVA Test
ИЗВОДИ КАМАТНИХ СТОПА У ИНДИЈСКИМ БАНКАМА
Shashi Srivastava and Divya Srivastava*
Faculty of Management Studies, Banaras Hindu University, Varanasi, India
Извод
Овај рад представља покушај приказа свеобухватног профила глобалног тржишта ОТЦ-а, са
посебном пажњом на изводе каматних стопа. Анализирани су различити аспекти везани за
промену каматних стопа у банкама у Индији. Студија такође истражује и потенцијални утицај
власничке структуре према променама каматних стопа у банкама. У том смислу, студија се бави
компаративном анализом највеће државне (СБИ) и највеће приватне банке у Индији (ИЦИЦ).
Анализирани су бројни показатељи, као што су: укупно власништво, депозити, аванси, РОИ,
РОЕ, гранична каматна стопа, проценат кредита, итд. У сврху анализе коришћене су
статистичке методе типа корелације и АНОВА теста.
Кључне речи: Банкарско тржиште, изводи каматних стопа, компаративна анализа

References
Annual report of SBI and ICICI Bank,
2006, 2007, 2008, 2009
Bank for International Settlement, May
2009.
Brewer III Elijah, Minton Bernadette A.
& Moser James T. (2000). Interest-rate
derivatives and bank lending Journal of
Banking & Finance 24, pg no. 353-379
Datt Ruddar, Sundharam K.P.M. (2009).
Indian Economy, 6th Edition, S. Chand &
Company Ltd., New Delhi.
Duffee Gregory R. & Zhou Chunsheng
(2001). Credit derivatives in banking: Useful
tools for managing risk? Journal of Monetary
Economics 48, pg no. 25–54.
Mahieu Ronald, Xu Ying (2007). Hedging
with Interest rate and Credit Derivatives by
Banks.
Selvakumar M, Kathiravan P.G.,(2009). A
Study of Profitability Performance of Public
Sector Banks in India, Indian Journal of
Finance, Vol. III, pg no. 3-21.
Simons Katerina Jan-Feb, (1995). Interest
rate derivatives and asset-liability
management by commercial banks, New
England Economic Review.
125S.Srivastava / SJM 5 (1) (2010) 111 - 125