intercos group global cosmetic manufacturer …web.intercos.it/bond/files/fin/intercos spa -...
TRANSCRIPT

This Consolidated Full Year Financial Report has been translated into English solely for the convenience of the international reader. In case of discrepancies, the Italian language document is the sole authoritative and universally valid version.
INTERCOS GROUP
Global Cosmetic Manufacturer
CONSOLIDATED FINANCIAL STATEMENTS
AT DECEMBER 31, 2016
PREPARED IN CONFORMITY WITH IFRS
ADOPTED BY THE EUROPEAN UNION
Intercos S.p.A.
Registered Office
Milan - Piazza Generale Armando Diaz 1
1
This Consolidated Full Year Financial Report has been translated into English solely for the convenience of the international reader. In case of discrepancies, the Italian language document is the sole authoritative and universally valid version.
Intercos S.p.A. Registered Office in Milan – Piazza Generale Armando Diaz 1
Share capital Euros 10,710,193 fully paid-in
Consolidated Financial Statements at December 31, 2016
REPORT ON OPERATIONS
1. Profit and Financial Performance
2016 saw the Intercos Group confirm the success of its strategy and its leadership in the field of innovation
through product diversification, in the Color Cosmetic and Skin Care markets,
Both Business Units of the Group continue to grow in all distribution segments and in the full service
platforms, where it recorded a rise in orders and revenues, especially in the EMEA region.
The Group reported Revenues from sales for a total of €448,690 thousand in 2016 compared to €401,767
thousand in 2015, showing an increase of €46,923 thousand (+11.7%).
Adjusted EBITDA* in 2016 is a positive €62,467 thousand, with a 13.9% adjusted EBITDA margin against
14.9% in the prior year.
Operating profit (EBIT) is €41,331 thousand, with a 9.2% EBIT margin compared to 9.3% in 2015
(€37,297 thousand).
Capital expenditures in property, plant and equipment and intangible assets total €20,161 thousand and
€8,695 thousand, respectively.
The net financial position is €132,835 thousand compared to €148,596 thousand at December 31, 2015. The
considerable improvement of €15,761 thousand is due to better management of net working capital, which
decreases by €4,259 thousand despite a significant increase in volumes.
Equity is €137,493 thousand compared to €118,391 thousand at December 31, 2015, up by
€19,103 thousand.
* Adjusted EBITDA is represented by operating profit (loss) before depreciation, amortization and impairment reversals (losses) adjusted
from the management by nonrecurring income (expenses).

2
This Consolidated Full Year Financial Report has been translated into English solely for the convenience of the international reader. In case of discrepancies, the Italian language document is the sole authoritative and universally valid version.
2. World Economic Overview
The state of the global economy has improved slightly. However, the future outlook is still being
affected by various factors of uncertainty. In the United States, much depends on the economic
policies of the new administration, which have not yet been defined in detail: an expansive impact,
which is currently difficult to quantify, may derive from the measures announced with regard to the
budget policy, but there may also be negative effects due to the adoption and spread of trade
restrictions. Global growth could be hindered by the upsurge of turbulence in the emerging
economies, associated with the normalization of U.S. monetary policy.
The continuous rebalancing of China from a situation of growth driven by investments to one of
growth based on consumption will probably lead to a deceleration of the driving force of its
economy. Meanwhile, the recession in Latin America may find relief from a slight recovery in the
prices of raw materials and from financial conditions which have generally been streamlined.
Sanctions have played a role in the collapse of the economy in Russia and in the negative GDP, and
the protracted period of major political upset in Brazil has had a significant impact on its economy.
In the Eurozone, growth continues at a moderate pace, in the direction of gradual consolidation. The
risks of deflation have been reduced; inflation rose in December but, overall, inflation still remains
low. In order to maintain the expansive monetary conditions which will ensure a rise in inflation,
the ECB’s Governing Council has extended the length of its securities market program until at least
December 2017, and will extend it further if necessary. From April, monthly purchases will return
to €60 billion, as in the initial phase of the program.
According to the indicators currently available, in autumn, the recovery of the Italian economy
continued, albeit at a moderate pace. Considering the trend of industrial production, electrical
consumption and goods shipments, all of these sectors increased. Economic activity was stimulated
by the restart of investments and the expansion of household expenditures. In the third quarter of
2016, total employment stabilized; the number of company employees with permanent and short-
term contracts increased. In recent months, the expansion of credit to the private non-financial
sector continued, and there was also an increase in loans to companies. However, growth remains
moderate.
The forecasts for the Italian economy, based on the most recent trends, suggest that, on average,
GDP should grow about 0.9% in 2017 and 1.1% in both 2018 and 2019. Economic activity should
again be supported by domestic demand and, already in 2017, by the gradual strengthening of
foreign demand. In 2019, the level of GDP should still be approximately lower than in 2007.
3
This Consolidated Full Year Financial Report has been translated into English solely for the convenience of the international reader. In case of discrepancies, the Italian language document is the sole authoritative and universally valid version.
Overall it is thought that, with regard to these predictions, risks for growth are mainly orientated
downwards. Apart from financial factors, the main sources of uncertainty lie in the global context.
There is a particularly high risk that the expansion of the global economy may be affected, besides
what was considered in the forecasts, by the upsurge and spread of protectionist measures, as well
as by potential turbulence in the emerging economies.
3. Market Scenario
The global market of the Color Cosmetics sector has a retail value of approximately USD 60 billion, with
a 6.6% year-over-year increase against 6.5% in 2015.
With regard to the various geographical regions, Western Europe continues to expand, growing 3.9%
compared to 3.4% in 2015.
In North America, the market gain is 7.1% versus 2.3% in the prior year.
The Asian market (excluding Japan) expanded by 10% compared to 2015. China, in particular, grew 10.5%
against 2015 in a market worth USD 4.5 billion.
Emerging markets displayed a positive trend of +9.6%, with Brazil logging a 5% increase over 2015.
4. Important Factors significantly impacting Operating Performance
Technological innovation
The Intercos Group has adopted an R&D investment policy geared to identifying and developing innovative
products and efficient and competitive manufacturing processes. The search for innovation in terms of both
process and final product begins from the knowledge of the Make-up and Skin Care markets and the relative
distribution channels; this know-how gives the Group an advantage in adapting to the changing demand of
consumers, actively anticipating them and influencing them.
In 2016, the Intercos Group employed about 617 resources dedicated to innovation, creating, over the course
of just one year more than 594 new color cosmetics formulae that became products, 34 new raw materials
and over 628 new skin care formulae.
Market expansion thanks to new customer categories
The entry of new players in the market such as Emerging Regional Brands and Retailers have contributed to
the expansion of the market in which the Group operates, now no longer limited to multinational brands.
More specifically, the development of these categories of clients has made it possible to reach end consumers
that were not previously served. This has enabled the Intercos Group to extend its offering of services since
these new categories of customers do not have their own manufacturing capabilities and require a “full

4
This Consolidated Full Year Financial Report has been translated into English solely for the convenience of the international reader. In case of discrepancies, the Italian language document is the sole authoritative and universally valid version.
service” platform. The platform comprises not only the creation of the product but also its packaging and, if
necessary, the marketing concept.
5. Profit and Financial Review of the Intercos Group
For the purpose of providing information along the lines of the performance analysis and control parameters
of the Group, the non-IFRS alternative performance measures used by management to provide information
for a better assessment of the results of operations and financial position of the Group are presented below.
Such performance measures should not be interpreted as a substitute for the performance measures
established by the IFRS.
The content of the alternative performance measures that are not arrived directly in the financial statements
are defined as follows:
EBITDA: is calculated as profit before taxes, financial income (expenses) without any adjustment
and depreciation, amortization and impairment reversals (losses). EBITDA also excludes income
(expenses) from the result of unconsolidated companies and securities, as well as gains or losses on
disposal of consolidated investments, classified under Financial income (expenses) or, for the share
of the profit (loss) of investments accounted for using the equity method (non-operating), within the
item Result from investments.
Adjusted EBITDA: is calculated by the deducting the following, if applicable, from EBITDA, as
defined above:
impairment of goodwill, if any;
amortization of the portion of the purchase price allocated to intangible assets in a business
combination, as established in IFRS 3;
restructuring costs, under specific and significant restructuring plans;
nonrecurring other income (expenses) referring to particularly significant events unrelated to
ordinary business operations.
Operating Working Capital includes inventories and trade receivables and payables;
Net Working Capital: is given by operating working capital net of other current assets and
liabilities;
Net invested capital: is the sum of non-current assets, non-current liabilities and Net Working
Capital.
Net debt (cash) or net financial position: is given by the sum of current and non-current financial
liabilities net of short- and long-term financial receivables, including cash and cash equivalents;
Workforce: is given by the number of employees registered in the payroll book on the last day of
the period under consideration.

5
This Consolidated Full Year Financial Report has been translated into English solely for the convenience of the international reader. In case of discrepancies, the Italian language document is the sole authoritative and universally valid version.
(in € thousands)
2016 2015 Change
Revenues 448,690 401,767 46,923
EBITDA 63,105 58,761 4,344
Adjusted EBITDA 62,467 59,844 2,623
EBITDA margin 13.9% 14.9% -1.0%
Operating profit (EBIT) 41,331 37,297 4,034
EBIT margin 9.2% 9.3% -0.1%
EBT 31,782 24,815 6,967
EBT margin 7.1% 6.2% 0.9%
Profit 19,814 14,804 5,010
Profit margin 4.4% 3.7% 0.7%
(in € thousands) 2016 2015 Change
Net working capital 61,882 66,141 (4,259)
Working capital turnover
7.25 6.07 1.18
Net invested capital 270,328 266,986 3,342
Non-current assets 226,788 221,245 5,542
Net financial position 132,835 148,596 (15,761)
2016 2015 Change
Workforce (number) 2,747 2,409 338
Earnings per share (basic and diluted) 0.22 0.16 0.06
For the purpose of providing additional disclosure on the results of operations, financial position and cash
flows of the Group, the following Reclassified consolidated income statement, Reclassified consolidated
statement of financial position and consolidated net debt (cash) schedule are presented below.

6
This Consolidated Full Year Financial Report has been translated into English solely for the convenience of the international reader. In case of discrepancies, the Italian language document is the sole authoritative and universally valid version.
Reclassified Consolidated Income Statement by function
(in € thousands)
2016
2015
Revenues 448,690
401,767
Cost of sales (342,446)
(302,852)
Industrial gross margin 106,244
98,915
% of revenues 23.7% 24.6%
R&D and innovation costs (26,052)
(25,248)
Selling expenses (20,579)
(18,944)
General and administrative expenses (22,939)
(19,978)
Other operating income (expenses) 4,998
3,636
Result from investments (operating) (978)
-
Nonrecurring income (expenses) 638
(1,083)
Operating profit (EBIT) 41,331
37,297
EBIT margin 9.2% 9.3%
Depreciation, amortization and impairment reversals (losses) (21,774)
(21,463)
EBITDA (*) 63,105
58,761
Nonrecurring income (expenses) 638
(1,083)
Adjusted EBITDA (*) 62,467
59,844
EBITDA margin 13.9% 14.9%
Financial income (expenses), net (**) (9,812)
(12,588)
Result from investments (financial) 263
106
Profit before taxes (EBT) 31,782
24,815
Income taxes (11,968)
(10,011)
Profit for the year 19,814
14,804
Of which:
- attributable to the parent 19,514
14,701
- attributable to non-controlling interests
300
103
Earnings per share: Basic and diluted 0.22
0.16
(*) For additional details, please refer to page 4.
(**) Financial income (expenses) is the sum of financial income (expenses) without any adjustment.

7
This Consolidated Full Year Financial Report has been translated into English solely for the convenience of the international reader. In case of discrepancies, the Italian language document is the sole authoritative and universally valid version.
In 2016, consolidated revenues total €448,690 thousand, up 11.7% compared to 2015, at a higher growth rate
than the market rate.
Breakdown of revenues by geographical region
A comparison of revenues by geographical region in the two years is as follows:
(in € thousands)
Revenues by geographic region 2016 2015
Americas 161,479 162,313
EMEA 242,398 190,632
Asia 44,813 48,822
Total 448,690 401,767
Americas: this region recorded lower revenues compared to the prior year of 1%, mainly in the
Prestige market.
EMEA: posted sales of €242,398 thousand versus €190,632 thousand in the prior year, with the
€51,766 thousand (+27.2%) increase recorded in all customer segments, whereas the market increase
in the region was 3.9% overall.
60 59
37
25 15
62 63
41 32 20
Adjusted EBITDA EBITDA EBIT Profit before taxes Profit for the period
2015 2016

8
This Consolidated Full Year Financial Report has been translated into English solely for the convenience of the international reader. In case of discrepancies, the Italian language document is the sole authoritative and universally valid version.
Asia: reported a decrease in revenues of 8.2% compared to 2015 (€44,813 thousand from €48,822
thousand), mainly in respect of multinational customers.
Breakdown of sales by Business Unit
Details of the composition of Revenues in 2016 compared to 2015 by Business Unit are the following:
Year Change
(in € thousands) 2016 2015 2016 over 2015 2016 over 2015
%
Make-up 393,118 349,651 43,467 12.43%
Skin Care 55,571 52,116 3,455 6.63%
Total 448,690 401,767 46,923 11.68%
The contribution to revenues by Group companies is summarized below:
(in € thousands)
Company
2016 2015
Intercos Europe S.p.A.
249,387 206,359
Intercos America Inc.
94,525 105,096
Intercos Cosmetics Suzhou Co. Ltd
22,605 14,891
Intercos Technology Co. Ltd
37,623 43,310
Interfila Cosmetics (Shanghai) Co. Ltd
19,753 16,491
CRB Sa.
35,867 36,753
Other companies
20,758 15,759
Aggregate Total
480,518 438,659
Eliminations (31,828) (36,893)
Consolidated Total 448,690 401,767
Adjusted EBITDA is a positive €62,467 thousand, an increase of €2,623 thousand compared to €59,844
thousand in 2015, with a 13.9% EBITDA margin that is 1% lower than in 2015. Higher sales and keeping
fixed costs in check compensated the higher cost of sales caused by a different product and service mix.
Additional details on the results of the BUs are provided under Segment reporting, in Note 5 of the
consolidated financial statements.
Operating profit (EBIT) is a positive €41,331 thousand compared to 2015, reflecting a higher EBITDA and
lower incidence of nonrecurring income (expenses).
In 2015, net nonrecurring expenses, in fact, were €1,083 thousand mainly due to €449 thousand for legal
expenses incurred by Intercos S.p.A. in respect of an open dispute relating to a proprietary patent of the
Intercos Group and €543 thousand for the increase in the provision for risks as a result of higher customs
duties prudently estimated by Intercos Cosmetics Suzhou.

9
This Consolidated Full Year Financial Report has been translated into English solely for the convenience of the international reader. In case of discrepancies, the Italian language document is the sole authoritative and universally valid version.
In 2016, net nonrecurring income was recorded for €638 thousand. It includes: €256 thousand of income
from the sale of a building owned by the subsidiary CRB S.A.; €360 thousand of net nonrecurring income by
the Asian subsidiaries mainly due to the release of the provision for risks set aside previously for higher
customs duties not due and extra costs incurred to complete the project to create a second Intercos Group
headquarters run by the subholding company Intercos Asia Pacific Limited; €522 thousand of net
nonrecurring income referring to Intercos S.p.A. owing to the amicable settlement of a dispute with a third
party over trade secret misappropriations; €305 thousand of expenses by the subsidiary Intercos Europe
S.p.A. for employee social security contributions that arose on the completion of the question regarding the
closing of the Limbiate factory; €196 thousand of expenses by the subsidiary Drop Nail S.r.l. incurred for the
realization of the industrial project to strengthen its product range represented by nail polishes and nail care
projects.
Profit for the year is €19,814 thousand or 4.4% of revenues, compared to a profit of €14,804 thousand
reported in 2015 (3.7% of revenues).
10
This Consolidated Full Year Financial Report has been translated into English solely for the convenience of the international reader. In case of discrepancies, the Italian language document is the sole authoritative and universally valid version.
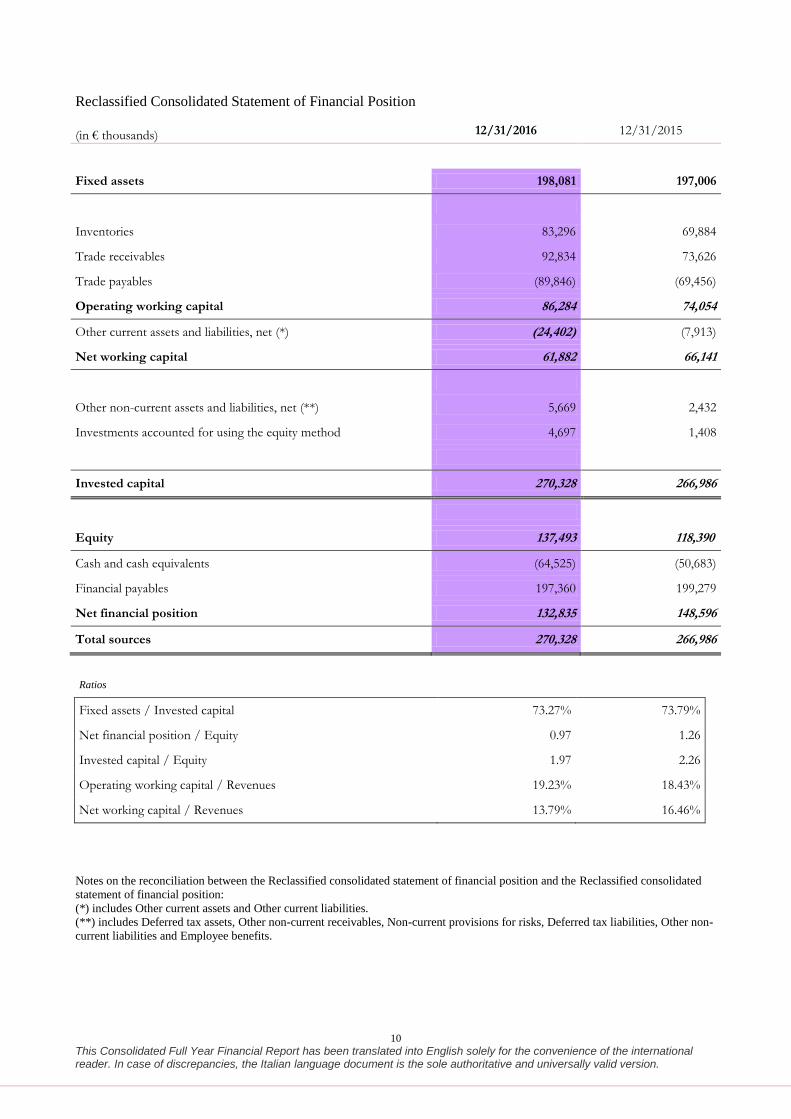
Reclassified Consolidated Statement of Financial Position
(in € thousands) 12/31/2016 12/31/2015
Fixed assets 198,081 197,006
Inventories 83,296 69,884
Trade receivables 92,834 73,626
Trade payables (89,846) (69,456)
Operating working capital 86,284 74,054
Other current assets and liabilities, net (*) (24,402) (7,913)
Net working capital 61,882 66,141
Other non-current assets and liabilities, net (**) 5,669 2,432
Investments accounted for using the equity method 4,697 1,408
Invested capital 270,328 266,986
Equity 137,493 118,390
Cash and cash equivalents (64,525) (50,683)
Financial payables 197,360 199,279
Net financial position 132,835 148,596
Total sources 270,328 266,986
Ratios
Fixed assets / Invested capital 73.27% 73.79%
Net financial position / Equity 0.97 1.26
Invested capital / Equity 1.97 2.26
Operating working capital / Revenues 19.23% 18.43%
Net working capital / Revenues 13.79% 16.46%
Notes on the reconciliation between the Reclassified consolidated statement of financial position and the Reclassified consolidated
statement of financial position:
(*) includes Other current assets and Other current liabilities.
(**) includes Deferred tax assets, Other non-current receivables, Non-current provisions for risks, Deferred tax liabilities, Other non-
current liabilities and Employee benefits.

11
This Consolidated Full Year Financial Report has been translated into English solely for the convenience of the international reader. In case of discrepancies, the Italian language document is the sole authoritative and universally valid version.
Capital expenditures in Property, plant and equipment and Intangible assets in 2016 total €28,856
thousand.
The improvement in the Net Financial Position continued into 2016 thanks to the optimization of the supply
chain processes and working capital management. This resulted in a total reduction in the current and the
medium-/long-term financial position of €15,761 thousand. The net debt at December 31, 2016 is therefore
€132,835 thousand compared to €148,596 thousand at December 31, 2015.
Consolidated net debt (cash)
(in € thousands) 12/31/2016 12/31/2015
Cash and cash equivalents (64,525) (50,683)
Borrowings from banks and other lenders 34,187 30,321
Current financial position (30,338) (20,362)
Borrowings from banks and other lenders 163,173 168,959
Non-current financial position 163,173 168,959
Debt (cash) 132,835 148,596
Equity at December 31, 2016 is €137,493 thousand compared to €118,390 thousand at December 31, 2015,
with an increase of €19,103 thousand. Additional details are provided Note 16 of the consolidated financial
statements.
66
221
267
149
118
62
227
270
133 137
Net Working Capital Fixed Assets Net Invested Capital Net Financial Position
Equity
2015 2016

12
This Consolidated Full Year Financial Report has been translated into English solely for the convenience of the international reader. In case of discrepancies, the Italian language document is the sole authoritative and universally valid version.
6. Significant Events in 2016
The following significant events took place during the year 2016:
On January 19, 2016, Intercos S.p.A. (parent) signed a settlement agreement with Woojung Tech.
Co., Ltd. and Mr Dong-Pil Choi to definitively and amicably close, in the company’s favor, the
dispute initiated in September 2014 between the company and the latter, in relation to which a
summons was filed by Intercos S.p.A. for trade secret misappropriation before the Courts in Los
Angeles, California.
On January 30, 2016, Intercos Asia Pacific increased its investment in the share capital of the
subsidiary Shinsegae Intercos Korea by Korean Won 5,000,000 thousand. The shareholder
Shinsegae also increased its investment in the company’s share capital so that its percentage
investment in capital would remain unchanged.
On February 9, 2016, the board of directors of Intercos S.p.A. approved the transfer of the
company’s registered office from Milan, Piazza Eleonora Duse 2, to Milan, Piazza Generale
Armando Diaz 1. The registered offices of the subsidiaries were also transferred: Drop Nail S.r.l. (on
February 15, 2016), Intercos Europe S.p.A. and Vitalab S.r.l. (on March 25, 2016).
On February 10, 2016, following the intent manifested by Drop Nail S.r.l.’s minority shareholder,
Paragon Cosmetics S.r.l., to: 1) divest of its 40% interest in the capital of Drop Nail S.r.l., equal to a
nominal amount of €20 thousand and 2) sell its remaining receivable due from Drop Nail S.r.l., for
the shareholder loans extended in the past, for a total amount of €1 thousand – Intercos S.p.A, as part
of its business plan aimed at strengthening its product range represented by nail polishes and nail
care products, purchased Paragon’s investment and receivable for €543 thousand, thus bringing its
investment to €1,186,234, representing 100% of the capital of the company Drop Nail S.r.l.
On March 25, 2016, the parent waived a part of its non interest-bearing shareholder loan due from
Drop Nail S.r.l. and, precisely, a total of €1,000 thousand, with such amount to be recorded in equity,
under Other reserves, subaccount Payment against share capital, bringing its investment to
€2,186,234 thousand.

13
This Consolidated Full Year Financial Report has been translated into English solely for the convenience of the international reader. In case of discrepancies, the Italian language document is the sole authoritative and universally valid version.
On May 2, 2016, a share capital increase was approved by the company Intercos Do Brasil Indùstria
e Comércio de Productos Cosmeticos LTDA (“IDOBRASIL”) for R$8,000,000, subscribed to and
fully paid in by Intercos S.p.A. as a shareholder of IDOBRASIL.
Following the above capital increase, the share capital of IDOBRASIL amounts to
R$30,377,143, divided into 30,377,143 shares of R$1.00 each, held by the shareholders as
follows: (a) 30,280,543 shares for a total of R$30,280,543 held by Intercos S.p.A. and (b)
96,600 shares for a total of R$96,600 held by Intercos America Inc.
On July 28, 2016, the Drop Nail S.r.l. shareholders’ meeting appointed Vincenzo Misitano as the
sole Director.
On August 1, 2016, Intercos S.p.A. conferred its investment in the company Hana Co. Ltd
(representing 20% of the entire share capital) to the company Intercos Asia Pacific Limited.
On August 1, 2016, Intercos S.p.A., as the sole shareholder of Intercos America Inc., subscribed to a
capital increase by Intercos America Inc. for a total of $25,000,000 to be paid in several tranches as
follows: 1) $5,000,000 by a cash injection; 2) $10,000,000 by the partial waver of intercompany
loans that were extended by Intercos S.p.A. to Intercos America Inc., which amounted to a total of
$37,900,000; and 3) $10,000,000 by payment in separate tranches based on resolutions passed
previously by the board of directors of Intercos America, in the event of specific and significant
financial needs of the same Intercos America Inc., with the understanding that the last tranche will be
paid no later than one year from the date of August 1, 2016.
On August 17, 2016, the sales agreement was signed between CRB S.A. – as the seller – and the
company Solufonds S.A. – as the buyer (on behalf of Procimmo Swiss Commercial Fund 56) (the
“Buyer”) – for a building owned by CRB situated in ZI du Verney 1 in Puidoux, Canton of Vaud,
Switzerland (the “Building”). This Sales Agreement has effect from December 1, 2016 and the sales
price is CHF 6,200,000 (in addition to VAT of CHF 347,760).
On September 8, 2016 and September 12, 2016, respectively, Intercos S.p.A. and Intercos
Europe S.p.A. – in agreement with their respective Boards of Statutory Auditors – adopted a new

14
This Consolidated Full Year Financial Report has been translated into English solely for the convenience of the international reader. In case of discrepancies, the Italian language document is the sole authoritative and universally valid version.
Organizational, Management and Control Model pursuant to Legislative Decree 231/2001. On the
same date, the Ethics Code and the Code of Conduct were updated by the Group.
On October 21, 2016, Intercos S.p.A. formed a new company called Intercos Concept S.r.l., with
beginning share capital of €10,000 fully paid in by Intercos S.p.A. Intercos Concept is dedicated,
among other things, to the performance of services to companies, including commercial, marketing,
promotional, organizational, technical, consulting and other types of services, as it pertains to private
labels, and, therefore, directed to the development of brands for clients that operate in the retail
commercial sector of colored products for make-up, creams, personal-care products, nail polish,
perfume and cosmetic products in general, as well as like products, accessories or, in any case,
products that complement cosmetics.
On October 21, 2016, in order to render management of the company more efficient, the
shareholders’ meeting of Intercos S.p.A. amended the bylaws to increase the possible number of
members of the board of directors from 5 to 7 and appointed new Board members: Paolo Valsecchi –
who is already COO of the Intercos Group and has power of attorney in the company with important
powers in various areas of corporate activities – and Renato Semerari.
In December 2016, the parent, as the sole shareholder of Intercos Concept S.r.l., made a payment
against share capital of €350,000 to Intercos Concept S.r.l., to be recognized in equity and recorded
in the Other reserves, subaccount Payment against share capital, bringing its investment to €360,000,
representing 100% of the company’s share capital.
15
This Consolidated Full Year Financial Report has been translated into English solely for the convenience of the international reader. In case of discrepancies, the Italian language document is the sole authoritative and universally valid version.
7. Related Party Transactions
Related party transactions do not qualify as either atypical or unusual but fall under the ordinary course of
the business operations of the Group companies. Such transactions, when not concluded at standard
conditions or dictated by specific laws, are nevertheless carried out on an arm’s length basis.
The details of the effects of related party transactions on the income statement for 2016 and the statement of
financial position at December 31, 2016 are described in Note 32.
8. Performance of the main Companies of the Group
Intercos Europe S.p.A.: Intercos Europe is the most important company of the Group in terms of volume. In
2016, the company reported revenues of €249,387 thousand, up €43,028 thousand, or 21%, compared to
2015, especially in the Multinational and Retailers segments.
Intercos America Inc.: revenues are down by 10%, or €10,571 thousand, decreasing from €105,096
thousand in 2015 to €94,525 in 2016. The reduction can be traced to the Prestige and Retailers market.
Intercos Cosmetics Suzhou Ltd.: reported revenues of € 22,605 thousand compared to €14,891 thousand in
2015, recording a higher percentage increase than the most important companies in the Group (+52%),
primarily in the Multinational and Retailers segments.
Intercos Technology Ltd.: this company manages the production facility of the Intercos Group for sales in
the Asia region. In 2016, the company reported revenues of €37,623 thousand. This is a 13% decrease,
mainly in the Prestige and Retailers channels.
Interfila Cosmetics (Shanghai) Ltd.: in 2016, this company has higher sales than in 2015, increasing from
€16,491 thousand last year to €19,753 thousand in 2016 (+20%), principally due to Prestige customers and
the strengthening of Multinational customers.
CRB S.A.: sales were €35,867 thousand, recording a decrease of €886 thousand (-2%).

16
This Consolidated Full Year Financial Report has been translated into English solely for the convenience of the international reader. In case of discrepancies, the Italian language document is the sole authoritative and universally valid version.
9. Research & Development
In 2016, the Group continued to invest in new products and technologies, confirming its global leadership
position in the Make-up and Skin Care businesses.
The increase in Research & Development costs in 2016 totals €6,395 thousand and refers mainly to €2,701
thousand for projects that are not yet completed and classified in Assets under development and payments in
advance, conducted principally by Intercos S.p.A. and €3,694 thousand classified in Research and
development costs, of which €2,490 thousand relates to Intercos S.p.A., €512 thousand to Intercos America,
€183 thousand to CRB S.A. projects and, lastly, €509 thousand for research conducted by Vitalab S.r.l.
The increase in Assets under development of €2,701 thousand is mainly composed of costs on the
uncompleted R&D projects of Intercos S.p.A. The projects refer for the most part to:
(i) €490 thousand for the “Sharpenable Pencils” project begun in June 2016. The objective is to research
new, eco-compatible and sustainable raw materials capable of characterizing new patentable formulae for a
new pencil in plastic.
(ii) €529 thousand for the “Nail Polish” project begun in the second quarter of 2016. The objective is to
create and manufacture new nail polish materials capable of making nail polishes last longer than those
traditionally found on the market.
(iii) €682 thousand for the “Diplaticoni” project begun towards the end of the second quarter of 2016. The
objective is to obtain a family of new eco-sustainable cosmetic raw materials, owned by Intercos and not
otherwise available on the market, that can take different physical forms and thus can be used in all product
categories.
(iv) €487 thousand for the “PLA” project begun during the year. The objective is to develop biodegradable
polymers.
(v) €126 thousand for the “Silicone ogive”, project. The objective is to identify a new silicone to develop
suitable ogives for the manufacture of lipsticks that perform better than those currently in use.
(vi) €113 thousand for the “Patch” project. The objective is to develop a cosmetic patch, with a multilayer
structure similar to that of transdermal patches with a decorative and/or corrective function for the eye area.
(vii) €273 thousand for the “CMR” project begun during the year. The objective is to develop ceramic
materials.
For capitalized projects, management carefully assesses their expected economic benefits and the benefits
obtained over the course of their useful life, testing for any onset of impairment.

17
This Consolidated Full Year Financial Report has been translated into English solely for the convenience of the international reader. In case of discrepancies, the Italian language document is the sole authoritative and universally valid version.
10. Personnel and Organization
The headcount of the Group at December 31, 2016, including temp workers, numbers 4,591 compared to
3,822 at year-end 2015, with an increase of 769 people, of whom 338 are employees of the Group and 431
are temporary workers.
The breakdown by category is as follows:
Group headcount December 31, 2016 December 31, 2015
Executive and mid-level managers 242 221
White-collars 946 866
Blue-collars 1,559 1,322
Total 2,747 2,409
Temporary 1,844 1,413
Total 4,591 3,822
The breakdown by permanent and fixed-term personnel is the following:
Group headcount December 31, 2016 December 31, 2015
Permanent 2,727 2,395
Fixed-term 20 14
Total 2,747 2,409
During the year, there were no deaths or accidents in the workplace which caused serious injury to personnel.
Employee benefit expenses increased €11,518 thousand, from €121,726 thousand in 2015 to €133,245
thousand in 2016, or 9.5%. The change is mainly due to an increase in the Group’s workforce as a result of
higher manufacturing and sales volumes.
The Group uses temp work contracts for its manufacturing activities in order to render direct manufacturing
costs more flexible. The growth in business in 2015 and 2016 led to an increase in these costs of €6,321
thousand compared to the prior year, from €25,748 thousand in 2015 to €32,069 thousand in 2016.

18
This Consolidated Full Year Financial Report has been translated into English solely for the convenience of the international reader. In case of discrepancies, the Italian language document is the sole authoritative and universally valid version.
11. Risk Management and Uncertainties
The Group’s business is exposed to various types of risk including exchange rate risk, interest rate risk,
credit risk and liquidity risk.
Exchange rate risk
The Group operates globally and is exposed to foreign exchange risk arising from fluctuations in the
equivalent amount of commercial and financial flows denominated in currencies other than the functional
currency of the individual companies of the Group.
The Group’s exposure is mainly concentrated in the following exchange rates:
- EUR/USD exchange rate: with reference to commercial and financial transactions entered into
by Eurozone companies operating on the North American market and vice versa.
- EUR/GBP exchange rate: with reference to commercial and financial transactions entered into
by Eurozone companies operating on the British market and vice versa.
- USD/RMB: with reference to commercial and financial transactions entered into by Chinese
companies operating on the North American market and vice versa.
- EUR/RMB: with reference to commercial and financial transactions entered into by Eurozone
companies operating on the Chinese market and vice-versa.
- CHF/EUR/USD: with reference to commercial and financial transactions entered into by the
Group company operating in Switzerland.
It is the Group’s policy to hedge, where possible, exposures denominated in currencies other than the
functional currency of the individual companies, particularly the following:
certain flows: commercial flows and exposures generated by loans receivable and payable;
forecast flows: commercial flows originating from certain or highly probable contractual
commitments.
These hedges are monitored by net currency positions managed by the Group or by using derivative
contracts.
19
This Consolidated Full Year Financial Report has been translated into English solely for the convenience of the international reader. In case of discrepancies, the Italian language document is the sole authoritative and universally valid version.
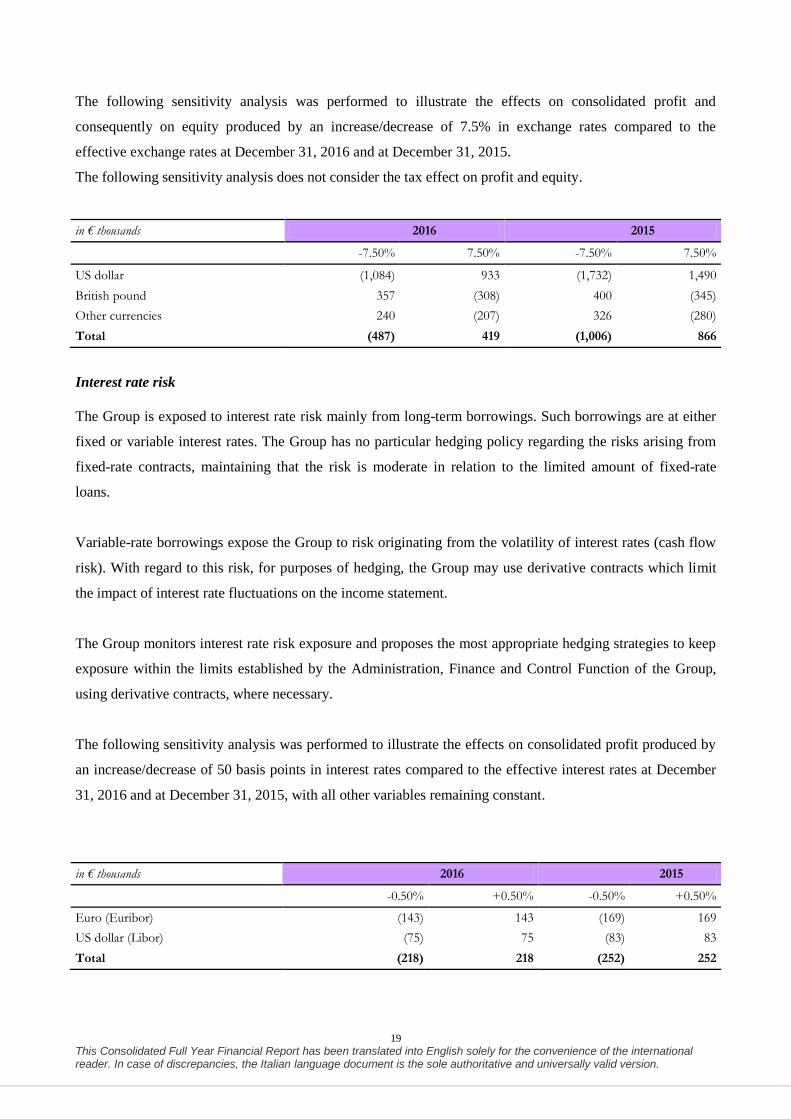
The following sensitivity analysis was performed to illustrate the effects on consolidated profit and
consequently on equity produced by an increase/decrease of 7.5% in exchange rates compared to the
effective exchange rates at December 31, 2016 and at December 31, 2015.
The following sensitivity analysis does not consider the tax effect on profit and equity.
in € thousands 2016 2015
-7.50% 7.50% -7.50% 7.50%
US dollar (1,084) 933 (1,732) 1,490
British pound 357 (308) 400 (345)
Other currencies 240 (207) 326 (280)
Total (487) 419 (1,006) 866
Interest rate risk
The Group is exposed to interest rate risk mainly from long-term borrowings. Such borrowings are at either
fixed or variable interest rates. The Group has no particular hedging policy regarding the risks arising from
fixed-rate contracts, maintaining that the risk is moderate in relation to the limited amount of fixed-rate
loans.
Variable-rate borrowings expose the Group to risk originating from the volatility of interest rates (cash flow
risk). With regard to this risk, for purposes of hedging, the Group may use derivative contracts which limit
the impact of interest rate fluctuations on the income statement.
The Group monitors interest rate risk exposure and proposes the most appropriate hedging strategies to keep
exposure within the limits established by the Administration, Finance and Control Function of the Group,
using derivative contracts, where necessary.
The following sensitivity analysis was performed to illustrate the effects on consolidated profit produced by
an increase/decrease of 50 basis points in interest rates compared to the effective interest rates at December
31, 2016 and at December 31, 2015, with all other variables remaining constant.
in € thousands 2016 2015
-0.50% +0.50% -0.50% +0.50%
Euro (Euribor) (143) 143 (169) 169
US dollar (Libor) (75) 75 (83) 83
Total (218) 218 (252) 252

20
This Consolidated Full Year Financial Report has been translated into English solely for the convenience of the international reader. In case of discrepancies, the Italian language document is the sole authoritative and universally valid version.
The potential effects reported above were calculated by taking the liabilities which represent the most
significant part of the Group’s borrowings at the reference date and calculating, on that amount, the potential
impact of a change in the interest rates on an annual basis.
The liabilities in this analysis include variable-rate financial payables and receivables, cash and cash
equivalents and derivative financial instruments whose value is affected by changes in interest rates.
Credit risk
Credit risk is associated with trade receivables, cash and cash equivalents, financial instruments, deposits at
banks and other financial institutions and is defined as the risk that a counterparty does not fulfill the
obligations associated with a financial instrument or a commercial contract, thus resulting in a financial loss.
The credit risk related to trading counterparties is managed by the individual subsidiaries and monitored
centrally by the corporate Administration, Finance and Control Function. The Intercos Group does not have
significant concentrations of credit risk. However, there are policies in place to ensure that sales of products
and services are made to customers with a high degree of creditworthiness, taking into consideration their
financial position, past experience and other factors. Credit limits for major customers are based on internal
and external valuations according to ceilings approved by management in the individual countries. The use
of credit limits is monitored periodically at a local level. It should be noted that at the end of the year 2016,
the Group, for the subsidiary Intercos Europe S.p.A., sold receivables that are not past due under non-
recourse factoring contracts for €7,247 thousand.
As for credit risk relating to the management of financial resources and cash, the risk is monitored by the
Administration, Finance and Control Function of the Group which has policies in place to ensure that the
companies of the Group enter into transactions with independent high-credit-quality counterparties.
Trade accounts receivables, the provision for impairment of receivables and an ageing analysis of receivables
are presented at December 31, 2016 and December 31, 2015.
(in € thousands)
12/31/2016 Trade
receivables Current
Overdue 0-60 days
Overdue 61-90 days
Overdue over 90
days
Provision for impairment
Make-up 81,425 64,616 13,786 1,349 1,961
(287)
Skin Care 11,409 8,357 2,427 333 339
(47)
Total 92,834 72,974 16,212 1,682 2,300
(334)
21
This Consolidated Full Year Financial Report has been translated into English solely for the convenience of the international reader. In case of discrepancies, the Italian language document is the sole authoritative and universally valid version.
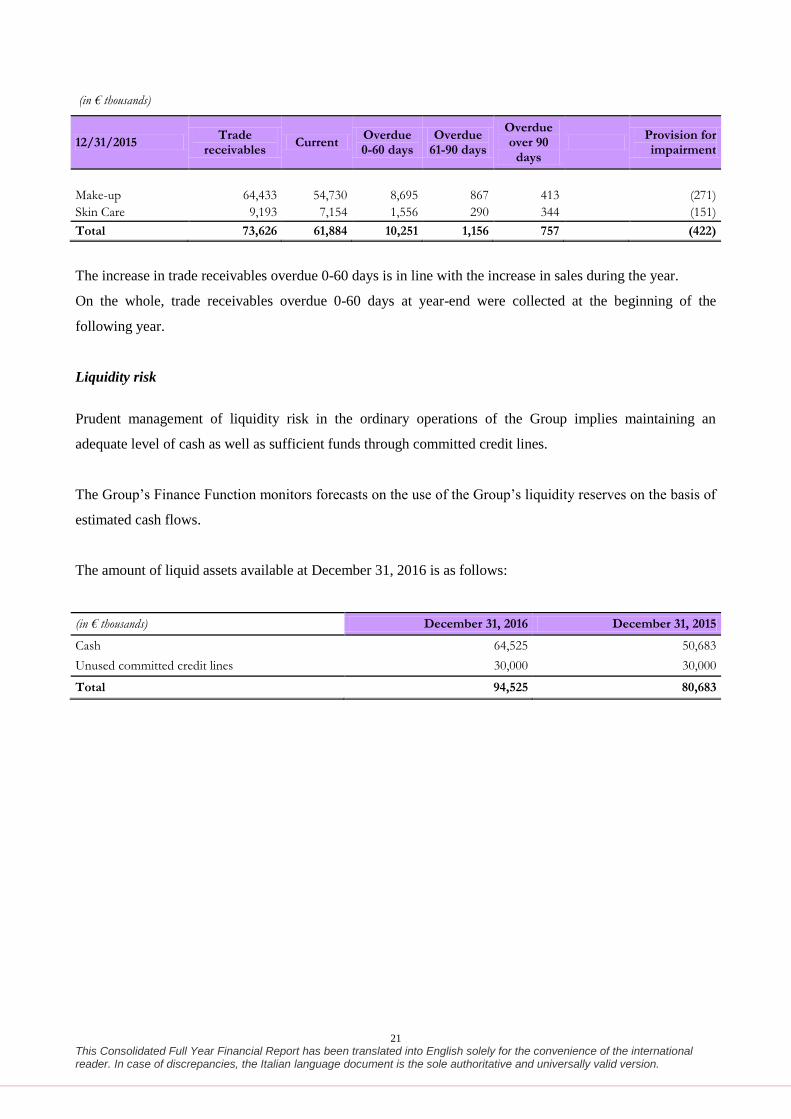
(in € thousands)
12/31/2015 Trade
receivables Current
Overdue 0-60 days
Overdue 61-90 days
Overdue over 90
days
Provision for impairment
Make-up 64,433 54,730 8,695 867 413
(271)
Skin Care 9,193 7,154 1,556 290 344
(151)
Total 73,626 61,884 10,251 1,156 757
(422)
The increase in trade receivables overdue 0-60 days is in line with the increase in sales during the year.
On the whole, trade receivables overdue 0-60 days at year-end were collected at the beginning of the
following year.
Liquidity risk
Prudent management of liquidity risk in the ordinary operations of the Group implies maintaining an
adequate level of cash as well as sufficient funds through committed credit lines.
The Group’s Finance Function monitors forecasts on the use of the Group’s liquidity reserves on the basis of
estimated cash flows.
The amount of liquid assets available at December 31, 2016 is as follows:
(in € thousands) December 31, 2016 December 31, 2015
Cash 64,525 50,683
Unused committed credit lines 30,000 30,000
Total 94,525 80,683

22
This Consolidated Full Year Financial Report has been translated into English solely for the convenience of the international reader. In case of discrepancies, the Italian language document is the sole authoritative and universally valid version.
The following tables present an analysis of the maturities of borrowings and other liabilities. Borrowings
from banks in the following tables are presented at their nominal amount:
(in € thousands) Within 1 year
1 to 5 years
Beyond 5 years
At December 31, 2016
Bonds - - 120,000 120,000
Borrowings from banks and other lenders - m-l/term 4,135 38,989 0 43,124
Finance leases payable 256 913 0 1,169
Medium/long-term debt 4,391 39,903 120,000 164,294
Borrowings from banks and other lenders - s/term 26,372 1,507 4,186 32,066
Factoring companies payable 253 0 0 253
Trade payables 89,846 0 0 89,846
Short-term debt 116,471 1,507 4,186 122,165
Total 120,863 41,410 124,186 286,459
(in € thousands) Within
1 year 1 to
5 years Beyond 5
years At
December 31, 2015
Bonds - - 120,000 120,000
Borrowings from banks and other lenders - m-l/term 6,335 42,525 - 48,860
Finance leases payable 239 700 - 939
Medium/long-term debt 6,574 43,225 120,000 169,799
Borrowings from banks and other lenders - s/term 19,131 - - 19,131
Factoring companies payable 199 - - 199
Trade payables 69,456 - - 69,456
Short-term debt 88,786 - - 88,786
Total 95,360 43,225 120,000 258,585

23
This Consolidated Full Year Financial Report has been translated into English solely for the convenience of the international reader. In case of discrepancies, the Italian language document is the sole authoritative and universally valid version.
In order to complete the disclosure on financial risks, a reconciliation is presented below between the
categories of financial assets and liabilities as identified in the statement of financial position format of the
Group and the categories of assets and liabilities identified in accordance with the requirements of IFRS7.
(in € thousands)
12/31/2016
Financial assets at fair
value through profit or loss
Receivables and loans
Available-for-sale financial
assets
Held-to-maturity
assets
Financial liabilities at fair value through
profit or loss
Other liabilities at amortized
cost
Hedging derivatives
Available-for-sale financial assets
- - - - - - -
Derivatives (assets) - - - - - - -
Securities held for trading - - - - - - -
Trade receivables - 92,834 - - - - -
Other receivables (*) - 2,925 - - - - -
Borrowings from banks and other lenders
- - - - - 197,360 -
Trade payables - - - - - 89,846 -
Other payables (*) - - - - - 21,385 -
Derivatives (liabilities) - - - - - - 447
Total - 95,760 - - - 308,951 447
(in € thousands)
12/31/2015
Financial assets at fair
value through profit or loss
Receivables and loans
Available-for-sale financial
assets
Held-to-maturity
assets
Financial liabilities at fair value
through profit or loss
Other liabilities at
amortized cost
Hedging derivatives
Available-for-sale financial assets
- - - - - - -
Derivatives (assets) - - - - - - -
Securities held for trading - - - - - - -
Trade receivables - 73,626 - - - - -
Other receivables (*) - 6,494 - - - - -
Borrowings from banks and other lenders
- - - - - 199,279 -
Trade payables - - - - - 69,456 -
Other payables (*) - - - - - 20,063 -
Derivatives (liabilities) - - - - - - 586
Total - 80,120 - - - 288,798 586
(*) Other receivables and Other payables exclude items of a tax nature which do not meet the definition of financial assets or liabilities.

24
This Consolidated Full Year Financial Report has been translated into English solely for the convenience of the international reader. In case of discrepancies, the Italian language document is the sole authoritative and universally valid version.
Derivatives
IFRS require the fair value categorization of derivative financial instruments within the fair value hierarchy
based on inputs that are observable in the market or other financial parameters (e.g. interest rate, exchange
rate curves, etc.). Derivatives in foreign currency to hedge exchange rate risk fall under Level 2 of the fair
value hierarchy since the fair value of these instruments is determined by recalculating the present value at
the official year-end rate for exchange rates and interest rates quoted in the market.
The following table illustrates the fair value of the financial instruments portfolio:
Fair value hierarchy at the reporting date
(in € thousands) December 31, 2016
Level 2 December 31, 2015
Level 2
Assets Currency forwards / swaps/ options
Fair value hedge - -
Liabilities Currency forwards / swaps/ options
Fair value hedge 447 586
Fair value hedges are used to hedge exchange rate risk on financial assets and liabilities recorded in the
financial statements.
With reference to derivatives to hedge exchange rate risk, an indication is given below of the estimated dates
of flows in US dollars.
Notional amount in thousands of USD
December 31, 2016 December 31, 2015
Due Collection Payment Collection Payment
Within 1 year 17,500 - 24,000 -
1 to 5 years - - - -
Beyond 5 years - - - -
Total 17,500 - 24,000 -

25
This Consolidated Full Year Financial Report has been translated into English solely for the convenience of the international reader. In case of discrepancies, the Italian language document is the sole authoritative and universally valid version.
12. Environmental Analysis
The environmental impact on the territory by the Group’s production process, especially in terms of the
disposal of expired cosmetics and waste, is duly managed with the assistance of an outside services and
environmental technologies company.
Matters associated with safety at work and protection and safeguarding of the environment are always of
major concern to the Intercos Group. The activities conducted in these areas ensured that, during the year
2016, there were no cases of accidents at work causing serious injury to employees, or charges of harming
the environment.
13. Tax Consolidation
Intercos S.p.A. has adhered to the national tax consolidation procedure under articles 117-129 of T.U.I.R. as
the “consolidating” company since 2008, valid for a three-year period, with Intercos Europe S.p.A. and
Marketing Projects S.r.l. as the “consolidated” companies. The option was also renewed for the period 2011-
2013 and the period 2014-2016. The companies participating in the national tax consolidation procedure are,
besides the parent, Intercos Europe S.p.A., Marketing Projects S.r.l. in liquidation, Ager S.r.l., Vitalab S.r.l.,
Drop Nail S.r.l. and Kit Productions S.r.l.
Each of these companies transfers its taxable income or tax loss to Intercos S.p.A. which records a receivable
(equal to the IRES tax to be paid) from the companies which contribute a taxable income, or a payable to the
companies which transfer a tax loss.
Intercos S.p.A., as the consolidating company, is responsible not only for any additional taxes assessed and
the relative fines and interest referring to its own individual total income, but also for the sums which could
become due, with reference to the consolidated tax return, from “formal control” activities pursuant to ex art.
36-ter DPR 600/73. It is also liable, jointly and severally, for the sums due in relation to fines levied on
companies in the consolidated tax return which have committed violations in determining the individual
position. Similarly, the consolidated companies are jointly and severally liable with Intercos S.p.A., as the
consolidating company, for higher taxes assessed relating to the consolidated tax return referring to
adjustments to the income in its tax return, also as a result of “formal control” activities, pursuant to ex art.
36-ter DPR 600/73. All of this is governed by the Tax consolidation agreement originally signed on June 5,
2008 and subsequent updates, the last of which is dated October 1, 2014.

26
This Consolidated Full Year Financial Report has been translated into English solely for the convenience of the international reader. In case of discrepancies, the Italian language document is the sole authoritative and universally valid version.
14. Share Capital
Share capital at December 31, 2016 is unchanged compared to December 31, 2015, amounts to €10,710,193
and is represented by 91,319,870 no par value ordinary shares divided as follows:
51,624,356 Class A shares,
39,267,544 Class B shares,
427,970 Class C shares,
Class A, Class B and Class C shares all have the same rights and can be transferred by acts between living
persons and by succession due to death, with effect on Intercos S.p.A. pursuant to law, without prejudice to
article 5 of the bylaws.
The following table presents the situation at December 31, 2016:
At December 31, 2016 At December 31, 2015 At December 31, 2014
Class A shares - number 51,624,356 51,624,356 51,624,356 Class B shares - number 39,267,544 39,267,544 39,267,544 Class C shares - number 427,970 427,970 427,970
Total share capital in euros 10,710,193 10,710,193 10,710,193
In observance of the provisions of art. 2428 of the Italian Civil Code, note should be taken that the
subsidiaries neither hold nor have purchased or sold shares of the parent during the course of the year under
examination, not even through fiduciaries or trustees.

27
This Consolidated Full Year Financial Report has been translated into English solely for the convenience of the international reader. In case of discrepancies, the Italian language document is the sole authoritative and universally valid version.
15. Subsequent Events
There were no events subsequent to the date of the financial statements which, if previously known, would
have required an adjustment to the financial statements.
As for developments in the early months of 2017, a description of significant subsequent events is presented
below:
In January and February 2017, the parent negotiated, with a syndicate of banks composed of
Banca IMI S.p.A., IntesaSanpaolo S.p.A., Unicredit S.p.A., BNL S.p.A. and ICBC (Europe) SA –
Milan Branch, certain amendments to the loan contract signed on March 24, 2015 by the company,
Intercos Europe S.p.A., Banca IMI S.p.A. and Unicredit S.p.A., the total amount of which, after such
amendments, will nevertheless remain at €80,000,000. More specifically, the amendments refer to:
a) an increase in the amount of the Term Facility from €50,000,000 to €60,000,000, with BNL
S.p.A. entering the loan contract as a lender of such Term Facility, with a commitment of
€20,000,000; b) a reduction in the amount of the Revolving Facility from €30,000,000 to
€20,000,000, with ICBC (Europe) SA – Milan Branch entering the loan contract as the sole lender of
such Revolving Facility, with a commitment of €20,000,000; c) an amendment to move the due date
on the Term Facility to December 31, 2021; d) a new interest rate per year for the Term Facility,
equal to the 6-month Euribor (and 6-month Libor for the tranche in U.S. dollars), plus 150 basis
points; e) a new interest rate per year for the Revolving Facility, equal to the 6-month Euribor or the
3-month Euribor, plus 100 basis points; f) a commitment fee of the Revolving Facility equal to 25
basis points; and g) an amendment to the definition of Permitted Indebtedness.
Also in January and February 2017, the parent negotiated the amendments to certain terms and
conditions of the €120,000,000 non-convertible bonds due March 28, 2022 with a 3.875% fixed rate
per year, the issue of which was approved by the board of directors on February 19, 2015. More
specifically, the amendments refer to: a) the reduction in the interest rate from 3.875% to 3.25% per
year; b) the amendment to move the maturity date to March 28, 2023; c) the extension of the period
– from March 28, 2018 to March 28, 2020 (excluded) – in which the bonds can be repaid in advance
by paying only the so-called “Make Whole Amount”; and d) the recalculation of the reimbursement
cost of the bonds, establishing that, in the event of repayment between March 28, 2020 and March
27, 2021 (included), the cost will be 101% of the face value of the bonds (instead of 100% as

28
This Consolidated Full Year Financial Report has been translated into English solely for the convenience of the international reader. In case of discrepancies, the Italian language document is the sole authoritative and universally valid version.
currently established for the same period) whereas in the event of repayment between March 28,
2021 and the new maturity date of the bonds, the cost will be equal to the face value of the bonds as
currently established.
In February 2017, Intercos Asia Pacific increased its investment in the share capital of the
subsidiary Shinsegae Intercos Korea by Korean Won 2,500,000 thousand. The shareholder
Shinsegae also increased its investment in the company’s share capital so that its percentage
investment in capital would remain unchanged.
16. Information regarding Policies or Factors of a governmental, economic, fiscal, monetary or
political Nature that have had or could have, directly or indirectly, significant Repercussions
on the Activities of the Group
During the year to which the foregoing reported financial information and results refer, the activities of the
Group have not been affected in a substantive manner by policies or factors of a governmental, economic,
fiscal, monetary or political nature.
17. Outlook for 2017
A substantially positive outlook is expected for the year 2017, in effect confirming the Group’s expectations
as illustrated in its Business Plan.
Milan, March 27, 2017 INTERCOS S.p.A.
On behalf of the Board of Directors
___________________________
This Consolidated Full Year Financial Report has been translated into English solely for the convenience of the international reader. In case of discrepancies, the Italian language document is the sole authoritative and universally valid version.
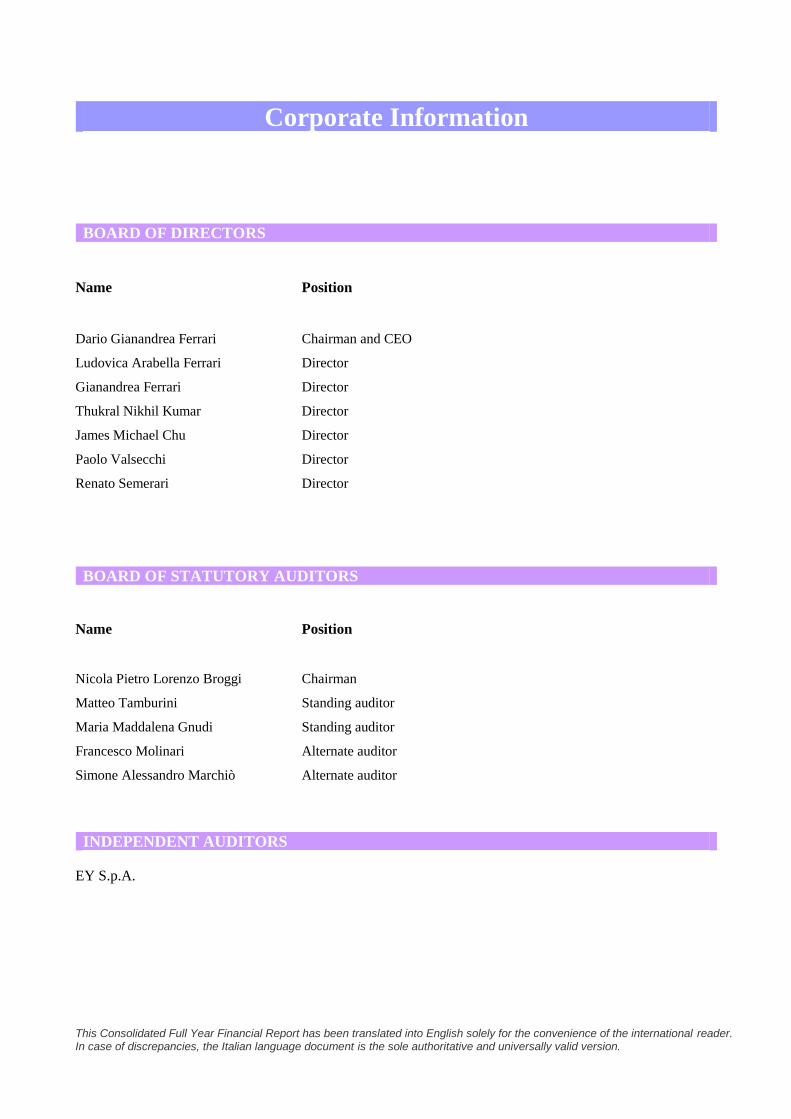
Corporate Information
BOARD OF DIRECTORS
Name Position
Dario Gianandrea Ferrari Chairman and CEO
Ludovica Arabella Ferrari Director
Gianandrea Ferrari Director
Thukral Nikhil Kumar Director
James Michael Chu Director
Paolo Valsecchi Director
Renato Semerari Director
BOARD OF STATUTORY AUDITORS
Name Position
Nicola Pietro Lorenzo Broggi Chairman
Matteo Tamburini Standing auditor
Maria Maddalena Gnudi Standing auditor
Francesco Molinari Alternate auditor
Simone Alessandro Marchiò Alternate auditor
INDEPENDENT AUDITORS
EY S.p.A.

This Consolidated Full Year Financial Report has been translated into English solely for the convenience of the international reader. In case of discrepancies, the Italian language document is the sole authoritative and universally valid version.
2
Consolidated Statement of Financial Position at December 31, 2016
(in € thousands) Note December 31, 2016 December 31, 2015
NON-CURRENT ASSETS
Property, plant and equipment 7 96,806 98,254
Intangible assets 8 24,509 22,075
Goodwill 9 76,765 76,677
Investments 2 4,697 1,408
Deferred tax assets 10 16,768 16,603
Other non-current assets 11 7,241 6,229
Non-current assets
226,788 221,245
CURRENT ASSETS
Inventories 12 83,296 69,884
Trade receivables 13 92,834 73,626
Other current assets 14 9,301 14,503
Cash and cash equivalents 15 64,525 50,683
Current assets 249,957 208,695
TOTAL ASSETS 476,745 429,941
EQUITY
Share capital
10,710 10,710
Other reserves
66,005 66,005
Retained earnings
58,424 38,857
Equity attributable to owners of the parent
135,139 115,572
Equity attributable to non-controlling interests 2,354 2,819
TOTAL EQUITY 16 137,493 118,391
LIABILITIES
NON-CURRENT LIABILITIES
Borrowings from banks and other lenders 17 163,063 168,959
Provisions 18 1,079 2,777
Deferred tax liabilities 19 8,459 9,079
Other non-current liabilities
182 165
Employee benefit obligations 20 8,621 8,379
Non-current liabilities
181,403 189,359
CURRENT LIABILITIES
Borrowings from banks and other lenders 17 33,667 29,761
Other financial payables 17 631 560
Trade payables 21 89,846 69,456
Other current liabilities 22 33,704 22,415
Current liabilities 157,848 122,192
TOTAL EQUITY AND LIABILITIES 476,745 429,941

This Consolidated Full Year Financial Report has been translated into English solely for the convenience of the international reader. In case of discrepancies, the Italian language document is the sole authoritative and universally valid version.
3
Consolidated Income Statement and Consolidated Statement of Comprehensive Income for the year ended December 31, 2016
CONSOLIDATED INCOME STATEMENT
(in € thousands) Note 2016 2015
Revenues 23 448,690 401,767
Cost of sales 24 (342,446) (302,852)
Industrial gross margin
106,244 98,915
Research & Development and innovation costs 25 (26,052) (25,248)
Selling expenses 26 (20,579) (18,944)
General and administrative expenses 27 (22,939) (19,978)
Other operating income (expenses)
4,998 3,636
Result from investments (operating) 30 (978) -
Nonrecurring income (expenses) 28 638 (1,083)
Operating profit (EBIT)
41,331 37,297
Financial income 29 7,923 9,985
Financial expenses 29 (17,735) (22,573)
Result from investments (financial) 30 263 106
Profit before tax (EBT)
31,782 24,815
Income taxes 31 (11,968) (10,011)
Profit for the year 19,814 14,804
Attributable to: - owners of the parent 19,514 14,701
- non-controlling interests 300 103
Earnings per share: Basic and diluted 33 0.22 0.16
CONSOLIDATED STATEMENT OF COMPREHENSIVE INCOME
(in € thousands)
2016 2015
Net profit 19,814 14,804
Other comprehensive income that will not be reclassified subsequently to the income statement, net of tax effect - Actuarial gains (losses) on remeasurement of employee defined benefit plans 20 (39) 396
- Tax effect 10/19 132 (113)
Total 93 283
Other comprehensive income that will be reclassified subsequently to the income statement, net of tax effect - Exchange differences on translating foreign operations 16 312 5,926
Total 312 5,926
Comprehensive income for the year 20,219 21,013
attributable to:
- owners of the parent 20,058 20,792
- non-controlling interests 161 220

This Consolidated Full Year Financial Report has been translated into English solely for the convenience of the international reader. In case of discrepancies, the Italian language document is the sole authoritative and universally valid version.
4
Consolidated Statement of Changes in Equity at December 31, 2016
( in € thousands) Equity attributable to owners of the parent Equity attributable to
non-controlling interests Total
Description Share capital
Other reserves (Share premium
reserve)
Reserves and retained earnings
Profit for the year
Share capital
Profit (Loss) for the year
Balances at January 1, 2016 10,710 66,005 18,065 20,792 2,599 220 118,391
Appropriation of 2015 profit - - 20,792 (20,792) 220 (220) -
Exchange differences on translating foreign operations
- - - 452 - (140) 312
Other comprehensive income, net of tax effect
- - - 92 - 1 93
Consolidation reserve - - (491) - (626) - (1,117)
Profit for the year - - - 19,514 - 300 19,814
Balances at December 31, 2016 10,710 66,005 38,366 20,058 2,193 161 137,493
Consolidated Statement of Changes in Equity at December 31, 2015
(in € thousands) Equity attributable to owners of the parent Equity attributable to non-controlling
interests Total
Description Share capital
Other reserves (Share premium reserve)
Reserves and retained earnings
(accumulated losses)
Profit for the
year
Share capital
Profit (Loss) for the
year
Balances at January 1, 2015 10,710 66,005 4,191 13,883 2,143 (78) 96,854
Appropriation 2014 profit - - 13,883 (13,883) (78) 78 -
Exchange differences on translating foreign operations
- - - 5,827 - 99 5,926
Increase in capital of non-controlling interests
- - - - 165 - 165
Other comprehensive income, net of tax effect
- - - 265 - 18 283
Consolidation reserve - - (9) - 369 - 360
Profit for the year - - - 14,701 - 103 14,804
Balances at December 31, 2015 10,710 66,005 18,065 20,792 2,599 220 118,391
This Consolidated Full Year Financial Report has been translated into English solely for the convenience of the international reader. In case of discrepancies, the Italian language document is the sole authoritative and universally valid version.
5
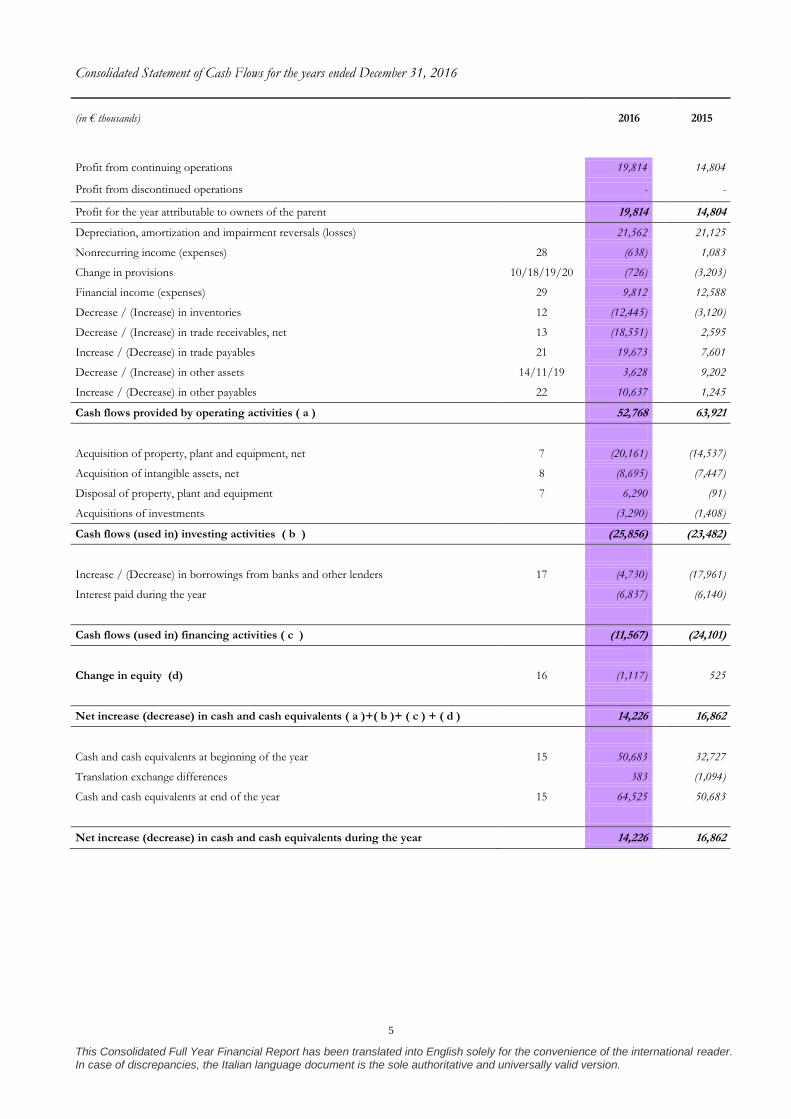
Consolidated Statement of Cash Flows for the years ended December 31, 2016
(in € thousands) 2016 2015
Profit from continuing operations
19,814
14,804
Profit from discontinued operations
-
-
Profit for the year attributable to owners of the parent
19,814 14,804
Depreciation, amortization and impairment reversals (losses)
21,562
21,125
Nonrecurring income (expenses) 28 (638)
1,083
Change in provisions 10/18/19/20 (726)
(3,203)
Financial income (expenses) 29 9,812
12,588
Decrease / (Increase) in inventories 12 (12,445)
(3,120)
Decrease / (Increase) in trade receivables, net 13 (18,551)
2,595
Increase / (Decrease) in trade payables 21 19,673
7,601
Decrease / (Increase) in other assets 14/11/19 3,628
9,202
Increase / (Decrease) in other payables 22 10,637
1,245
Cash flows provided by operating activities ( a )
52,768 63,921
Acquisition of property, plant and equipment, net 7 (20,161)
(14,537)
Acquisition of intangible assets, net 8 (8,695)
(7,447)
Disposal of property, plant and equipment 7 6,290
(91)
Acquisitions of investments
(3,290)
(1,408)
Cash flows (used in) investing activities ( b )
(25,856)
(23,482)
Increase / (Decrease) in borrowings from banks and other lenders 17 (4,730)
(17,961)
Interest paid during the year
(6,837)
(6,140)
Cash flows (used in) financing activities ( c )
(11,567) (24,101)
Change in equity (d) 16 (1,117)
525
Net increase (decrease) in cash and cash equivalents ( a )+( b )+ ( c ) + ( d )
14,226 16,862
Cash and cash equivalents at beginning of the year 15 50,683
32,727
Translation exchange differences
383
(1,094)
Cash and cash equivalents at end of the year 15 64,525
50,683
Net increase (decrease) in cash and cash equivalents during the year
14,226 16,862

This Consolidated Full Year Financial Report has been translated into English solely for the convenience of the international reader. In case of discrepancies, the Italian language document is the sole authoritative and universally valid version.
6
NOTES TO THE CONSOLIDATED FINANCIAL STATEMENTS
1. General information
Group structure
Intercos S.p.A. is a corporation organized under the laws of the Republic of Italy, with its registered office in
Milan, Piazza Diaz 1.
Starting from the end of 2013, the Group’s business was reorganized and is now aggregated into two areas
identified on the basis of the following operating segments:
Make-Up Business Unit: specialized in the creation, development, manufacture and marketing of
powders, emulsions, lipsticks and types of cosmetics using delivery systems in the form of pens/pencils
for the face, eyes and lips
Skin Care Business Unit: specialized in the manufacture and marketing of cosmetic and skin care
creams.
The Group’s main manufacturing facilities are at the plant sites in Italy, America, Switzerland, China and
Brazil.

This Consolidated Full Year Financial Report has been translated into English solely for the convenience of the international reader. In case of discrepancies, the Italian language document is the sole authoritative and universally valid version.
7
The Group’s organization structure is updated to the closing date of the consolidated financial statements at
December 31, 2016 and shows the operating companies and those in liquidation.
100% 100% 100%
65% 99.7% 0.3% 100%
100% 100% 76%
100% 75.01% 70%
100% 100% 100%
20% 100% 100% 100% 50%
100%
Intercos Technology (SIP)
Co., Ltd
(P.R. China)
Hana Co. Ltd.
(South Korea)
Intercos Daily Product
(SIP) Co. Ltd.
(P.R. China)
Intercos Cosmetics (Suzhou)
Co., Ltd
(P.R. China)
Intercos S.p.A.
(Italy)
Intercos Paris S.à r.l.
(France)
Intercos UK Ltd
(United Kingdom)
Intercos Marketing Ltd
(United Kingdom)
Kit Productions S.r.l.
(Italy)
Marketing Projects S.r.l. in a
wind-up
(Italy)
Intercos America Inc.
(United States of America)
Intercos do Brasil Indústria e
Comércio de Productos
Cosméticos LTDA
(Brazil)
CRB S.A.
(Switzerland)
Vitalab S.r.l.
(Italy)
CRB Benelux Bv
(The Netherlands)
Intercos Concept S.r.l.
(Italy)
Intercos Asia Pacific Limited
(Hong Kong)
Intercos Europe S.p.A.
(Italy)
Drop Nail S.r.l.
(Italy)
Ager S.r.l.
(Italy)
Shinsegae Intercos Korea Inc.
(South Korea)
Interfila Cosmetics
(Shanghai) Co., Ltd
(P.R. China)

This Consolidated Full Year Financial Report has been translated into English solely for the convenience of the international reader. In case of discrepancies, the Italian language document is the sole authoritative and universally valid version.
8
2. Significant accounting policies
Basis of preparation
The consolidated financial statements for the year ended December 31, 2016 of the Intercos Group consist of
the statement of financial position, the income statement, the statement of comprehensive income, the
statement of changes in equity, the statement of cash flows and the notes thereto. All amounts in the notes are
expressed in thousands of euros, unless otherwise indicated.
The format of the income statement, as permitted by IAS 1, presents a format by function showing revenues
and cost of sales, which is considered to be a better representation of the economic and financial performance
of the Group.
The consolidated financial statements at December 31, 2016 have been prepared in accordance with
International Financial Reporting Standards (“IFRS”), issued by the International Accounting Standards Board
(“IASB”), and adopted by the European Commission for the preparation of the consolidated and separate
financial statements of companies with equity securities and/or debt listed on one of the regulated markets in the
European Union.
By IFRS is meant all “International Financial Reporting Standards”, all International Accounting Standards
(“IAS”), all interpretations of the International Financial Reporting Interpretations Committee (“IFRIC”),
formerly the Standing Interpretations Committee (“SIC”), adopted by the European Union and contained in the
relative European Union Regulations published up to the date on which the board of directors of Intercos S.p.A.
approved the draft consolidated financial statements of the Group. Any future guidance and updated
interpretations will be adopted in subsequent years in the manner established each time by the benchmark
accounting standards.
The consolidated financial statements were approved for publication by the board of directors on March 27,
2017.
New accounting standards, interpretations and amendments adopted by the Group
The accounting principles adopted in the preparation of the consolidated financial statements at December 31,
2016 are consistent with those applied in the prior year, except for the adoption of recently issued standards,
interpretations and amendments in effect from January 1, 2016, as listed below.
On January 9, 2015 the Regulations 2015/28 and 2015/29 were published in the Official Journal of the European
Union. They were both issued by the European Commission on December 17, 2014, endorsing (i) “Annual
Improvements to IFRS 2010-2012 Cycle” and (ii) the amendments to IAS 19 entitled “Defined Benefit Plans:
Employee Contributions (Amendments to IAS 19)”.

This Consolidated Full Year Financial Report has been translated into English solely for the convenience of the international reader. In case of discrepancies, the Italian language document is the sole authoritative and universally valid version.
9
The improvements contained in the “Annual Improvements to IFRS 2010-2012 Cycle” refer to the following
amendments: (i) to IFRS 2, clarifying the definition of “vesting conditions” and introducing separate definitions
of service conditions and performance conditions; (ii) to IFRS 3, clarifying that obligations to pay contingent
consideration, other than those falling within the definition of equity instruments, are assessed at fair value at
every balance sheet date, with changes recognized in the income statement; (iii) to IFRS 8, requiring disclosure
about the judgments made by management in applying aggregation criteria, describing the operating segments
that were aggregated and the economic indicators that were assessed in order to determine that the aggregated
segments share similar economic characteristics; (iv) to IAS 16 and IAS 38, clarifying the manner of
determining the gross carrying amount of assets, in the event of revaluation as a result of application of the
revaluation model; (v) to IAS 24, establishing the information to be disclosed when a related-party management
entity provides key management personnel services to a reporting entity (or the parent).
Regulation 2015/2173. issued by the European Commission on November 24, 2015 endorsed the amendments
contained in the document “Accounting for Acquisitions of Interests in Joint Operations (Amendments to IFRS
11)”, issued by the IASB on May 6, 2014. The amendments clarify the accounting for the acquisition of both the
initial interest and additional interests in a joint operation (which does not modify the type of interest) in which
the activity constitutes a business, as defined in IFRS 3, which requires the application of all of the principles on
business combinations.
Regulation 2015/2231, issued by the European Commission on December 2, 2015, endorsed the amendments
contained in the document “Clarification of Acceptable Methods of Depreciation and Amortization
(Amendments to IAS 16 and IAS 38)”, issued by the IASB on May 12, 2014. The amendments clarify that it is
not appropriate to use revenue-based methods to calculate the depreciation or amortization of an asset because
they exclusively reflect the flow of revenues generated by the asset and not the consumption of the economic
benefits embodied in the asset. With regard to intangible assets this presumption can be rebutted if: (i) the
intangible asset is expressed as a measure of revenue or (ii) it can be demonstrated that the revenue and the
consumption of economic benefits of the intangible asset are highly correlated.
Regulation 2015/2343 of December 15, 2015 endorsed the “Annual Improvements to IFRSs – 2012-2014 Cycle”
issued by the IASB on September 25, 2014, which: (i) for IFRS 5, clarifies that any reclassification of an asset
(or disposal group) from held for sale to held for distribution to shareholders/partners (or vice versa), must not
be considered as a new divestment plan but rather as a continuation of the original plan; (ii) for IFRS 7,
Financial Instruments: Disclosures provides additional guidance in the determination of whether or not there
exists continuing involvement in a financial asset that has been transferred, where a service agreement
pertaining to it exists; the same standard also clarifies the non-applicability of the additional disclosure in
connection with the offsetting of financial assets and liabilities in interim financial statements; (iii) for IAS 19,
clarifies that the discount rate to use to calculate the present value of bonds must be determined with reference
to the market returns of high-quality corporate bonds denominated in the same currency rather than with
reference to the county of reference; (iv) for IAS 34, clarifies that the information required by IAS 34 on
significant events and transactions can be disclosed in the notes to an entity’s interim financial statements or

This Consolidated Full Year Financial Report has been translated into English solely for the convenience of the international reader. In case of discrepancies, the Italian language document is the sole authoritative and universally valid version.
10
cross-referenced to some other statements that are available to users of the financial statements on the same
terms and at the same time as the interim financial statements, otherwise the interim financial report is
incomplete.
Regulation 2015/2406, issued by the European Commission on December 18, 2015, endorsed the amendments
contained in the document “Disclosure Initiative (Amendments to IAS 1)” issued by the IASB on December 18,
2014. The document clarifies guidance on materiality, the disaggregation and aggregation of line items, the
systematic presentation of notes and the identification of accounting policies and information requirements for
other components of comprehensive income arising from the measurement of investments accounted for using
the equity method.
On the same date the European Commission, under Regulation 2015/2441, endorsed the amendments contained
in the document “Equity method in separate financial statements (Amendments to IAS 27)”, issued by the IASB
on August 12, 2014. The amendments permit entities to use the equity method to account for investments in
subsidiaries, joint ventures and associates in their separate financial statements, in addition to, as in the past,
cost or in conformity with IAS 39. The chosen accounting option must be applied consistently for each category
of investments. The same amendment has consequently reshaped the definition of separate financial statements.
Regulation 2016/1703, issued by the European Commission on September 22, 2016, endorsed the amendments
contained in the document “Investment Entities: Applying the Consolidation Exception (Amendments to IFRS
10, IFRS 12 and IAS 28)”, issued by the IASB on December 18, 2014. The amendments clarify the
requirements when accounting for investment entities and provide relief in particular circumstances.
The above amendments did not have any impact on the results of operation or the financial position of the
Group.
Accounting standards, amendments and interpretations issued by the IASB/IFRIC and endorsed by the
European Commission, but not yet effective
The standards, amendments and interpretations endorsed by the European Commission in 2015, but not yet
effective, are listed and described below.
Regulation 2016/1905, issued by the European Commission on September 22, 2016, endorsed the amendments
contained in the document IFRS 15 “Revenue from Contracts with Customers”, issued by the IASB on May 28,
2014. IFRS l5 provides a single model for the recognition of revenues (including contract revenues) based on
the transfer of control of a good or a service to a customer. The standard provides a more structured approach to
the measurement and recognition of revenues, with a detailed Application Guide. More specifically, the core
principle of IFRS 15 is that an entity shall recognize revenue to depict the transfer of promised goods or services
to customers in an amount that reflects the consideration to which the entity expects to be entitled in exchange
for those goods or services. The five-step model framework is as follows: (i) identification of the contract

This Consolidated Full Year Financial Report has been translated into English solely for the convenience of the international reader. In case of discrepancies, the Italian language document is the sole authoritative and universally valid version.
11
(contracts) with a customer; the provisions of the standard are applied to each single contract except in cases in
which the standard requires that the entity consider more contracts together and then account for the contracts
accordingly; (ii) identification of the performance obligations, that is, the goods or services promised in the
contract); (iii) determination of the transaction price; in the event the consideration is variable, the entity shall
estimate the consideration, to the extent that it is highly probable that a significant reversal in the amount of
cumulative revenue recognized will not occur when the uncertainty associated with the variable consideration is
subsequently resolved; (iv) allocation of the transaction price to the performance obligations identified,
generally on the basis of the stand-alone sales prices of each good or service and (v) recognition of revenue
when or as the entity satisfies a performance obligation. IFRS 15 establishes the principles that an entity shall
apply to report useful information about the nature, amount, timing and uncertainty of revenue and cash flows.
On the basis of the Group’s business model and a preliminary analysis conducted on the main contracts
outstanding, it is believed that the application of IFRS 15 will not have any significant effects.
The provisions of IFRS 15, subsequently to the changes brought about by the amendments issued on September
11, 2015, are effective for annual periods beginning on or after January 1, 2018. At this time, the Group does
not expect to early adopt the standard. The standard is applicable retroactively using one of two methods: a)
retrospectively to each prior reporting period presented in accordance with IAS 8 (full retrospective approach)
or b) retrospectively with the cumulative effect of initially applying this Standard recognized at the date of
initial application (modified retrospective approach). If the second approach b) is elected, IFRS 15 is applied
retrospectively only to contracts that are not completed contracts at the date of initial application (January 1,
2018). Intercos is assessing which of the two retrospective options to apply.
The Group expects to complete its analysis on the application of IFRS 15 by the end of 2017, in time for the
evaluation of the quantitative aspects of the adoption of the new standard, to be disclosed in the annual financial
statements at December 31, 2017.
Regulation 2016/2067, issued by the European Commission on November 22, 2016, endorsed the amendments
contained in the document IFRS 9 “Financial Instruments”, issued by the IASB on July 24, 2014, together with
the relative Basis for Conclusions and Application Guide, superseding all previous versions of the standard. The
new requirements: (i) modify the classification categories of financial assets and establish that such
classification should be based on the contractual cash flow characteristics of the asset and also on the entity’s
business model; (ii) eliminate also the obligation to separate embedded derivatives in financial assets; (iii)
identify a new loss impairment model that considers forward-looking information based on the premise of
providing for expected credit losses as compared to the “incurred loss” model which postpones the recognition
of credit losses until the manifestation of a loss event, with reference to: financial assets measured at amortized
cost, financial assets measured at fair value through other comprehensive income, lease receivables, contract
assets, and certain loan commitments and financial guarantee contracts; (iv) introduce a fundamental review of
the qualification of hedging transactions with the objective of guaranteeing that these are aligned to the entity’s
risk management strategies and based on a more principle-based approach. IFRS 9 has therefore also amended
IFRS 7 “Financial Instruments: Disclosures”. The provisions in the above documents, which replace those

This Consolidated Full Year Financial Report has been translated into English solely for the convenience of the international reader. In case of discrepancies, the Italian language document is the sole authoritative and universally valid version.
12
contained in IAS 39 “Financial Instruments: Recognition and Measurement”, are effective for annual periods
beginning on or after January 1, 2018. The impact of the adoption of this standard is currently under evaluation,
although no significant effects are expected from the application of this standard on recurring transactions.
Accounting standards, interpretations and amendments issued by the IASB/IFRIC and not yet endorsed
by the European Commission
The following is a list and description of newly issued amendments, standards and interpretations which, at the
date of the financial statements, are in the process of being endorsed by the European Commission and address
matters pertaining to the Group’s financial statements.
Since the documents below have not yet been endorsed by the European Commission, the effective date of
application may be postponed to a date subsequent to that established in the relative documents.
With reference to the description of recently issued standards, the pronouncements by the IASB, not yet
endorsed by the European Commission, are reported below.
On September 11, 2014, the IASB issued the document “Sale or Contribution of Assets between an Investor and
its Associate or Joint Venture (Amendments to IFRS 10 and IAS 28)”. The amendments aim to define in greater
detail the accounting treatment and the recognition of the related effects in the income statement, of the loss of
control of a subsidiary due to its sale to an associate or a joint venture. The different accounting treatment to be
adopted in the financial statements of the investor depends on whether the assets sold or contributed constitute a
business, as defined by IFRS 3. On December 17, 2015 the IASB indefinitely deferred the adoption date of
these amendments.
On January 13, 2016, the IASB issued IFRS 16 “Leases”, which defines leases as a contract that conveys the
right to control the use of an underlying asset for a period of time in exchange for consideration, and eliminates,
for the lessee, the distinction between finance and operating lease, introducing a single lessee accounting model
for the recognition of leases. The application of this model requires the entity to recognize: (i) in the statement
of financial position, an asset representing the relative right-of-use, and a liability, representing the payment
obligation as established in the contract, unless the lease term is 12 months or less or the underlying asset has a
low value; (ii) in the income statement, depreciation of the right-of-use assets and separately the interest on the
lease liability. For purposes of the preparation of the financial statements, lessors continue to classify leases as
operating or finance. The provisions of IFRS 16, which replace those contained in IAS 17 “Leasing” and in the
relative interpretations, are effective for annual periods beginning on or after January 1, 2019, except for any
postponements established during the endorsement process by the European Commission.
On January 19, 2016, the IASB issued the document “Recognition of Deferred Tax Assets for Unrealized Losses
(Amendments to IAS 12)”. The amendments clarify that unrealized losses on debt instruments measured at fair
value and measured at cost for tax purposes give rise to deductible temporary differences; it also clarifies that
the estimates for future taxable profits: (i) also include income from the sale of assets for amounts higher than

This Consolidated Full Year Financial Report has been translated into English solely for the convenience of the international reader. In case of discrepancies, the Italian language document is the sole authoritative and universally valid version.
13
the relative carrying amount when there is sufficient evidence to conclude that it is probable; (ii) exclude tax
deductions resulting from the reversal of deductible temporary differences. The amendments are effective for
annual periods beginning on or after January 1, 2017, except for any postponements established during the
endorsement process by the European Commission.
On January 29, 2016, the IASB issued “Disclosure Initiative (Amendments to IAS 7)”. The amendments clarify
how to improve the information on financial liabilities provided to users of financial statements for monetary
and non-monetary changes in liabilities due to financing transactions, deriving, to the extent necessary, from: (i)
financing cash flows; (ii) the acquisition or loss of control of a subsidiary or a business: (iii) changes in
exchange rates; (iv) changes in fair value; and (v) other changes. These amendments are effective for annual
periods beginning on or after January 1, 2017, except for any postponements established during the endorsement
process by the European Commission.
On April 12, 2016, the IASB issued “Clarifications to IFRS 15 Revenue from Contracts with Customers”, which
clarify: (i) when a contractual promise to transfer a good or service is separately identifiable from other
performance obligations contained in the contract; (ii) how to determine if an entity is a principal or an agent,
according to whether the entity provides the goods or services or arranges for the goods or services to be
provided; (iii) how to determine whether the revenue from a license agreement should be recognized over time
or a specific point in time. The document also provides two practical expedients (optional) to the transition
requirements of IFRS 15, according to which the entity can elect: (i) in the case it uses the full retrospective
method, not to restate the completed contracts at the beginning of the first comparative period presented (the
standard already called for a similar approach in the case of the modified retrospective approach; and (ii) to
determine, instead of separately accounting for the effects of each single change, the aggregate effects of all the
changes since the start of the contract until the start of the first comparative period presented or at the date of the
first-time application, respectively, in the case of the full retrospective method and the modified retrospective
approach. These amendments are effective for annual periods beginning on or after January 1, 2018, except for
any postponements established during the endorsement process by the European Commission.
On June 20, 2016, the IASB issued “Classification and Measurement of Share-based Payment Transactions
(Amendments to IFRS 2)”, which: (i) clarifies the effects of vesting and non-vesting conditions on the
measurement of cash-settled share-based payment transactions; (ii) specifies that the modification from cash-
settled to equity-settled share-based payment generates the derecognition of the original liability, the recognition
of the share-based payment at the modification date fair value to the extent services have been rendered up to
the modification date and any difference between the carrying amount of the liability as at the modification date
and the amount recognized in equity at the same date would be recognized in the income statement
immediately; (iii) with regard to share-based payment transactions with net settlement features arising from
amounts withheld by an employer because of tax laws or regulations, introduces an exception so that these are
classified as equity-settled in their entirety provided the share-based payment transactions would have been
classified as equity-settled had it not included the net settlement feature because of the application of tax laws.

This Consolidated Full Year Financial Report has been translated into English solely for the convenience of the international reader. In case of discrepancies, the Italian language document is the sole authoritative and universally valid version.
14
These amendments are effective for annual periods beginning on or after January 1, 2018, except for any
postponements established during the endorsement process by the European Commission.
The amendments contained in the document “Annual Improvements to IFRS Standards 2014 - 2016 Cycle”,
issued by the IASB on December 8, 2016, refer to: (i) IFRS 1, deleting the short-term exemptions provided with
reference to IFRS 7, to IAS 19 and to IFRS 10 with regard to “Investment Entities” for the first-time adopter; (ii)
to IFRS 12, clarifying the scope of the standard by specifying that the disclosure requirements, except for those
in paragraphs B10-B16, apply to all interests of an entity that are classified as held for sale, as held for
distribution or as discontinued operations in accordance with IFRS 5; (iii) to IAS 28, clarifying that an
investment company, a mutual fund, an investment fund or similar entity or a joint venture can elect to measure
investments in an associate or a joint venture at fair value through the income statement separately for each
single investment upon initial recognition. The amendments also clarify that an entity that is not an investment
entity that holds an investment in an associate or joint venture that is an investment entity, may elect to keep the
fair value measurement made by these investment entities to measure its own investments. The amendments to
IFRS 1 and IAS 28 are effective for annual periods beginning on or after January 1, 2018, while the
amendments to IFRS 12 are effective for annual periods beginning on or after January 1, 2017, except for any
postponements established during the endorsement process by the European Commission.
On the same date the IASB issued IFRIC 22 “Foreign Currency Transactions and Advance Consideration”,
which establishes that, when there are transactions that include the receipt or payment of advance consideration
in a foreign currency, the exchange rate to be applied for initial recognition of the assets, costs or revenues that
are generated by the receipt or payment in advance, corresponds to the exchange rate in force at the date of the
advance receipt or payment. These amendments are effective for annual periods beginning on or after January 1,
2018, except for any postponements established during the endorsement process by the European Commission.
Intercos is reviewing these standards, where applicable, in order to evaluate if their adoption will or will not
have a significant impact on the financial statements.
Summary of significant accounting policies
The financial statements are prepared under the going concern concept.
The following accounting policies have been applied on a consistent basis for all periods presented.
Principles of consolidation
The consolidated financial statements of the Intercos Group include the financial statements at December 31,
2014 of Intercos S.p.A., the parent, and its subsidiaries.
The financial statements, prepared for purposes of consolidation, whose closing date coincides with that of the
parent, have been drawn up in accordance with the international financial accounting standards adopted by the
Group.

This Consolidated Full Year Financial Report has been translated into English solely for the convenience of the international reader. In case of discrepancies, the Italian language document is the sole authoritative and universally valid version.
15
The financial statements of the subsidiaries are adjusted, if necessary, to conform to the accounting policies of
the Group.
Control of an entity exists when the Group is exposed, or has rights, to variable returns from its involvement
with the investee and has the ability to affect those returns through its power over the investee.
Thus, the Group controls an investee if and only if the Group has all the following:
- power over the investee (when the investor has existing rights that give it the current ability to direct
the relevant activities, i.e. the activities that significantly affect the investee’s returns);
- exposure, or rights, to variable returns from its involvement with the investee;
- the ability to use its power over the investee to affect the amount of the investor’s returns.
When the Group holds less than the majority of voting rights (or similar rights), it shall consider all facts and
circumstances when assessing whether it controls an investee, including:
- contractual arrangements with other holders of voting rights;
- rights from contractual agreements;
- voting rights or potential voting rights of the Group.
The Group shall reassess whether it controls an investee if facts and circumstances indicate that there are
changes to one or more of the three elements defining control above. The consolidation of a subsidiary starts
from the date that control commences until the date that control ceases. The assets, liabilities, income and
expenses of the subsidiary acquired or sold during the year are included in the statement of comprehensive
income from the date the Group commences control until the date that control ceases.
The profit or loss for the year and each of the components of other comprehensive income shall be attributed to
the owners of the parent and to the non-controlling interests, even if this results in the non-controlling interests
having a deficit balance. All assets and liabilities, equity, income, costs and cash flows relating to transactions
between entities of the Group are eliminated in full on consolidation.
When the proportion of the equity held by the parent changes, without a loss of control, such change shall be
recorded in equity. If the Group loses control of the subsidiary, it shall:
- derecognize the assets (including any goodwill) and liabilities of the subsidiary;
- derecognize the carrying amount of any non-controlling interests;
- eliminate the cumulative translation differences recognized in equity;
- recognize the fair value of the consideration received;
- recognize any investment retained in the former subsidiary at its fair value;
- recognize the profit or loss in the income statement;
- reclassify to profit or loss, or transfer directly to retained earnings if required by other IFRSs, the
amounts recognized in other comprehensive income in relation to the subsidiary, as if the Group had
directly disposed of the related assets or liabilities.

This Consolidated Full Year Financial Report has been translated into English solely for the convenience of the international reader. In case of discrepancies, the Italian language document is the sole authoritative and universally valid version.
16
Scope of consolidation
Details of the companies included in the scope of consolidation of Intercos S.p.A. at December 31, 2016 and the
method of consolidation of the various companies are presented in the following table:
SUBSIDIARIES
(consolidated line-by-line)
Name Head Office Currency Capital in
thousands of currency
Percentage of ownership
Direct Indirect
Intercos Europe S.p.A. Milan Euro 3,000 100.00%
Kit Productions S.r.l. Pessano con Bornago (Milan) Euro 10 70.00%
Marketing Projects S.r.l. in liquidation Milan Euro 40 100.00%
Ager S.r.l. Monza Euro 31 76.00%
Drop Nail S.r.l. Milan Euro 50 100.00%
Intercos America Inc. Wilmington (USA) US dollar 10 100.00%
Intercos do Brasil Indústria e Comércio de Productos Cosméticos Ltda
Atibaia (Brazil) Brazilian real 30,377 99.7% 0.3%
Intercos Paris S.ar.l. Neuilly-sur-Seine (France) Euro 14 100.00%
Intercos UK Ltd Barnstaple (UK) British pound 0,1 65.00%
Intercos Marketing Ltd South Molton (UK) British pound 0.001 100%
CRB S.A. Puidoux (Switzerland) Swiss franc 100 100.00%
Vitalab S.r.l. Milan Euro 160 75.01%
CRB Benelux BV Maastricht (Netherlands) Euro 18 100.00%
Intercos Technology Co.Ltd. Suzhou (P.R.C.) US dollar 3,400
100.00%
Interfila Cosmetics (Shanghai) Co. Ltd Shanghai (P.R.C) US dollar 2,700
100.00%
Intercos Cosmetics Suzhou Co. Ltd. Suzhou (P.R.C.) US dollar 12,800
100.00%
Intercos Daily Product (SIP) Co. Ltd ** Suzhou (P.R.C.) RMB 5,000
100.00%
Intercos Asia Pacific Limited Hong Kong US dollar 27,004* 100.00%
Intercos Concept S.r.l.*** Milan Euro 10 100.00%
* The investment in Intercos Asia Pacific is recorded for USD 27,001 thousand and HKD 26 thousand; the latter, converted at the exchange rate at the
transaction date, is €3 thousand.
** Intercos Daily Product (SIP) Co. Ltd, at the date of this report, is not yet operational.
*** Intercos Concept S.r.l. was formed on October 21, 2016.
The changes during the year in the scope of consolidation are the following:
On October 21, 2016, a new company was formed called Intercos Concept S.r.l., with beginning share
capital of €10,000 fully paid in by the parent Intercos S.p.A.
In February 2016, the parent acquired the remaining 40% of the shares of the subsidiary Drop Nail
from the shareholder “Paragon Cosmetics S.r.l.”, bringing its investment to 100% of the share capital
of the subsidiary.
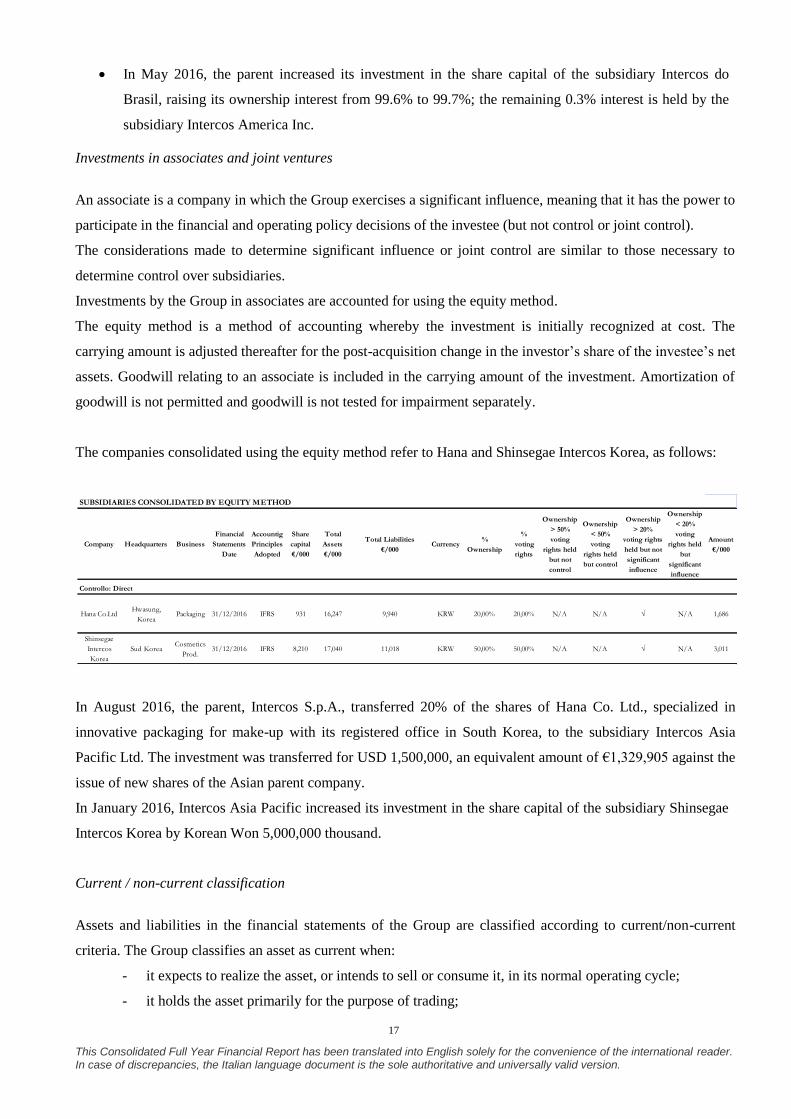
This Consolidated Full Year Financial Report has been translated into English solely for the convenience of the international reader. In case of discrepancies, the Italian language document is the sole authoritative and universally valid version.
17
In May 2016, the parent increased its investment in the share capital of the subsidiary Intercos do
Brasil, raising its ownership interest from 99.6% to 99.7%; the remaining 0.3% interest is held by the
subsidiary Intercos America Inc.
Investments in associates and joint ventures
An associate is a company in which the Group exercises a significant influence, meaning that it has the power to
participate in the financial and operating policy decisions of the investee (but not control or joint control).
The considerations made to determine significant influence or joint control are similar to those necessary to
determine control over subsidiaries.
Investments by the Group in associates are accounted for using the equity method.
The equity method is a method of accounting whereby the investment is initially recognized at cost. The
carrying amount is adjusted thereafter for the post-acquisition change in the investor’s share of the investee’s net
assets. Goodwill relating to an associate is included in the carrying amount of the investment. Amortization of
goodwill is not permitted and goodwill is not tested for impairment separately.
The companies consolidated using the equity method refer to Hana and Shinsegae Intercos Korea, as follows:
In August 2016, the parent, Intercos S.p.A., transferred 20% of the shares of Hana Co. Ltd., specialized in
innovative packaging for make-up with its registered office in South Korea, to the subsidiary Intercos Asia
Pacific Ltd. The investment was transferred for USD 1,500,000, an equivalent amount of €1,329,905 against the
issue of new shares of the Asian parent company.
In January 2016, Intercos Asia Pacific increased its investment in the share capital of the subsidiary Shinsegae
Intercos Korea by Korean Won 5,000,000 thousand.
Current / non-current classification
Assets and liabilities in the financial statements of the Group are classified according to current/non-current
criteria. The Group classifies an asset as current when:
- it expects to realize the asset, or intends to sell or consume it, in its normal operating cycle;
- it holds the asset primarily for the purpose of trading;
SUBSIDIARIES CONSOLIDATED BY EQUITY METHOD
Company Headquarters Business
Financial
Statements
Date
Accountig
Principles
Adopted
Share
capital
€/000
Total
Assets
€/000
Total Liabilities
€/000Currency
%
Ownership
%
voting
rights
Ownership
> 50%
voting
rights held
but not
control
Ownership
< 50%
voting
rights held
but control
Ownership
> 20%
voting rights
held but not
significant
influence
Ownership
< 20%
voting
rights held
but
significant
influence
Amount
€/000
Controllo: Direct
Hana Co.LtdHwasung,
KoreaPackaging 31/12/2016 IFRS 931 16,247 9,940 KRW 20,00% 20,00% N/A N/A √ N/A 1,686
Shinsegae
Intercos
Korea
Sud KoreaCosmetics
Prod.31/12/2016 IFRS 8,210 17,040 11,018 KRW 50,00% 50,00% N/A N/A √ N/A 3,011
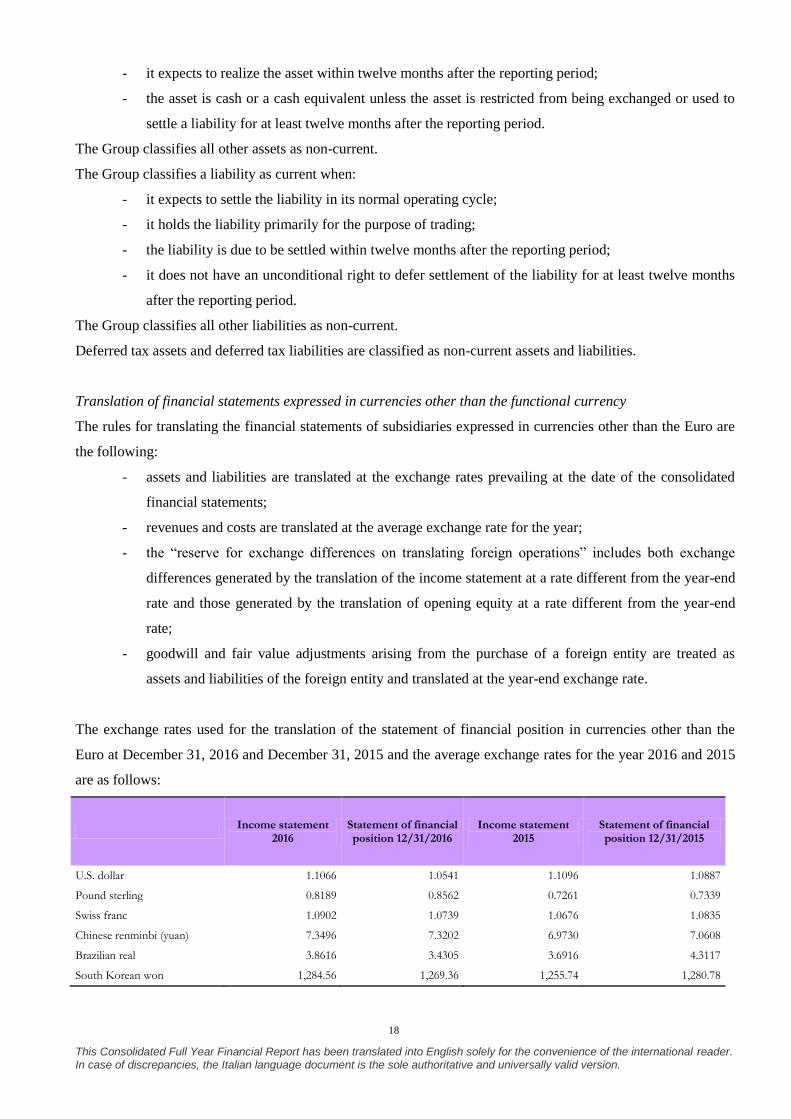
This Consolidated Full Year Financial Report has been translated into English solely for the convenience of the international reader. In case of discrepancies, the Italian language document is the sole authoritative and universally valid version.
18
- it expects to realize the asset within twelve months after the reporting period;
- the asset is cash or a cash equivalent unless the asset is restricted from being exchanged or used to
settle a liability for at least twelve months after the reporting period.
The Group classifies all other assets as non-current.
The Group classifies a liability as current when:
- it expects to settle the liability in its normal operating cycle;
- it holds the liability primarily for the purpose of trading;
- the liability is due to be settled within twelve months after the reporting period;
- it does not have an unconditional right to defer settlement of the liability for at least twelve months
after the reporting period.
The Group classifies all other liabilities as non-current.
Deferred tax assets and deferred tax liabilities are classified as non-current assets and liabilities.
Translation of financial statements expressed in currencies other than the functional currency
The rules for translating the financial statements of subsidiaries expressed in currencies other than the Euro are
the following:
- assets and liabilities are translated at the exchange rates prevailing at the date of the consolidated
financial statements;
- revenues and costs are translated at the average exchange rate for the year;
- the “reserve for exchange differences on translating foreign operations” includes both exchange
differences generated by the translation of the income statement at a rate different from the year-end
rate and those generated by the translation of opening equity at a rate different from the year-end
rate;
- goodwill and fair value adjustments arising from the purchase of a foreign entity are treated as
assets and liabilities of the foreign entity and translated at the year-end exchange rate.
The exchange rates used for the translation of the statement of financial position in currencies other than the
Euro at December 31, 2016 and December 31, 2015 and the average exchange rates for the year 2016 and 2015
are as follows:
Income statement
2016 Statement of financial position 12/31/2016
Income statement 2015
Statement of financial position 12/31/2015
U.S. dollar 1.1066 1.0541 1.1096 1.0887
Pound sterling 0.8189 0.8562 0.7261 0.7339
Swiss franc 1.0902 1.0739 1.0676 1.0835
Chinese renminbi (yuan) 7.3496 7.3202 6.9730 7.0608
Brazilian real 3.8616 3.4305 3.6916 4.3117
South Korean won 1,284.56 1,269.36 1,255.74 1,280.78

This Consolidated Full Year Financial Report has been translated into English solely for the convenience of the international reader. In case of discrepancies, the Italian language document is the sole authoritative and universally valid version.
19
Property, plant and equipment
Property, plant and equipment are stated at purchase or production cost less accumulated depreciation and
impairment losses, if any. Purchase cost includes all directly attributable costs necessary to make the asset ready
for use and any expenses for decommissioning and restoration that will be incurred as a result of contractual
obligations that require the assets to be restored to their original condition. Any borrowing costs incurred for the
acquisition, production or construction of property, plant and equipment are capitalized to the relative asset up
to the time such asset is ready for use.
Ordinary and/or cyclical maintenance and repairs are charged directly to the income statement in the year in
which they are incurred. Costs for the expansion, refurbishment or betterment of structural elements owned or
leased are capitalized solely to the extent that they meet the requisites for being classified separately as assets or
part of an asset under the component approach. Likewise, the replacement costs of identifiable components of
complex assets are charged to assets and depreciated over their estimated useful lives; the remaining carrying
amount of the component being replaced is charged to the income statement.
Spare parts of significant amount are capitalized and depreciated over the estimated useful life of the asset to
which they refer.
The carrying amount of property, plant and equipment is adjusted by systematic depreciation, calculated on a
straight-line basis from the date the asset is available and ready for use, over the estimated useful life of the
asset. In particular, depreciation is recognized starting from the month in which the asset is available for use or
is potentially able to provide the economic benefits associated with it and is charged on a monthly basis on a
straight-line basis at rates designed to write off the assets up to the end of their useful life or, for disposals, up to
the last month of utilization.
The annual depreciation rates representing the estimated useful lives of property, plant and equipment are as
follows:
Depreciation rate
December 31, 2016 December 31, 2015
Buildings 4% - 5.5% 4% - 5.5%
Plant 10% - 15% 10% - 15%
Machinery 10% - 12% 10% - 12%
Equipment 10% - 40% 10% - 40%
Furniture 12% - 20% 12% - 20%
Motor vehicles 20% - 25% 20% - 25%
The useful life of property, plant and equipment and the residual amount is reviewed and updated, where
applicable, at the end of every year.

This Consolidated Full Year Financial Report has been translated into English solely for the convenience of the international reader. In case of discrepancies, the Italian language document is the sole authoritative and universally valid version.
20
Whenever the depreciable asset is composed of distinctly identifiable elements whose useful life differs
significantly from the other parts that compose the asset, depreciation is taken separately for each of the parts
that compose the asset in accordance with the component approach.
Leasehold improvements are classified in property, plant and equipment, consistently with the nature of the cost
incurred. The depreciation period corresponds to the lower of the remaining estimated useful life of the
property, plant and equipment and the remaining term of the lease contract.
Gains and losses on the sale or disposal of property, plant and equipment are calculated as the difference
between the net proceeds from the sale and the carrying amounts of the assets sold or disposed of and are
recognized in the income statement in the year to which they refer.
Land is not depreciated and is measured at cost, net of accumulated impairment losses.
Leased assets
Assets owned under finance lease contracts in which substantially all the risks and rewards of ownership are
transferred to the Group are recognized as property, plant and equipment at fair value or, if lower, at the present
value of the minimum lease payments. The corresponding liability payable to the lessor is shown in the financial
statements under financial payables. The assets are depreciated according to the policies and rates indicated for
property, plant and equipment unless the term of the lease contract is shorter than the useful life represented by
these rates and reasonable certainty of transferring ownership of the leased asset at the natural expiration of the
contract is not assured. In that case, the depreciation period is represented by the term of the lease contract. The
lease payment is divided into its components of financial expense, recognized in the income statement, and the
repayment of principal, recorded as a reduction of the financial payables.
Leases in which the lessor retains substantially all the risks and rewards of ownership associated with ownership
of the assets are classified as operating leases. Payments made under operating leases are recognized in the
income statement on a straight-line basis over the term of the lease contract.
Intangible assets
Intangible assets are identifiable assets without physical substance, controlled by the company and able to
produce expected future economic benefits, as well as goodwill, when acquired against payment.
Identifiability of an intangible asset is defined as the possibility of distinguishing it from goodwill. This
requisite is normally satisfied when: (i) the asset arises from contractual or other legal rights, or (ii) the asset is
separable, i.e. is capable of being sold, transferred, rented or exchanged individually or as an integral part of
other assets. An entity controls an asset if the entity has the power to obtain the future economic benefits
flowing from the underlying resource and to restrict the access of others to those benefits. Intangible assets are
recognized at cost according to the criteria indicated for property, plant and equipment. Not even in the case of
the application of specific laws are revaluations permitted.

This Consolidated Full Year Financial Report has been translated into English solely for the convenience of the international reader. In case of discrepancies, the Italian language document is the sole authoritative and universally valid version.
21
Such assets are recorded at the cost of purchase and/or production, including incidental expenses directly
attributable to the preparation of the asset for its intended use, net of accumulated amortization, and any
impairment losses. Any borrowing costs arising during and for the development of intangible assets are
expensed in the income statement. Amortization starts when the asset is available for use and is charged on a
straight-line basis over the remaining period of possible utilization, intended as the estimated useful life.
This Consolidated Full Year Financial Report has been translated into English solely for the convenience of the international reader. In case of discrepancies, the Italian language document is the sole authoritative and universally valid version.
22
(i) Goodwill
Goodwill represents the excess of the cost of an acquisition over the fair value at the date of purchase, of assets
and liabilities of acquired companies or business segments. Goodwill is not subject to amortization but is tested
for impairment at least annually or whenever there is an indication of impairment, to verify the recoverability of
the relative carrying amount in the financial statements. To test for impairment, goodwill must be allocated to
cash-generating units or groups of cash-generating units (hereinafter also “CGU”). An impairment loss on
goodwill is recognized when the recoverable amount of goodwill is below the carrying amount in the financial
statements. The recoverable amount is the higher of the fair value of the CGU or groups of CGUs, less costs to
sell, and the relative value in use (see the following paragraph on the “Impairment of property, plant and
equipment and intangible assets” for additional information on the determination of the value in use). Reversal
of a previous impairment loss on goodwill is prohibited.
When the impairment loss is higher than the carrying amount of goodwill allocated to the cash-generating unit,
the remaining excess is allocated to the assets of the CGU in proportion to their carrying amount. The carrying
amount of an asset should not be reduced below the higher of:
- the fair value of the asset less costs to sell;
- the value in use, as defined above.
(ii) Trademarks, licenses and similar rights
Licenses are amortized on a straight-line basis so as to allocate the cost incurred for the purchase of the right
over the shortest period between the expected utilization period and the term of the relative contracts starting
from the time in which the acquired right becomes exercisable. Software licenses are amortized on a straight-
line basis over their estimated useful lives (5 years).
(iii) R&D costs
Costs associated with research and development are charged to the income statement in the year incurred except
for development costs recognized in intangible assets when they can be demonstrated and the following
conditions are met:
a) the project can be clearly identified and the costs associated with it can be identified and measured reliably;
b) the technical feasibility of the project;
c) the intention to complete the project and sell the intangible assets generated by the project;
d) a potential market exists or, in the case of internal use, the utility of the intangible asset for the production of
intangible assets generated by the project can be demonstrated;

This Consolidated Full Year Financial Report has been translated into English solely for the convenience of the international reader. In case of discrepancies, the Italian language document is the sole authoritative and universally valid version.
23
e) the technical and financial resources for the completion of the project are available.
Amortization of any capitalized development costs recorded in intangible assets starts from the date in which the
result generated by the project can be marketed. Amortization is charged on a straight-line basis over a period of
five years, which represents the estimated useful life of capitalized expenditures.
Impairment of property, plant and equipment and intangible assets
At each balance sheet date, property, plant and equipment and intangible assets with a finite life are reviewed to
identify the existence of any indicators of an impairment in their value. When the presence of these indicators is
identified, the recoverable amount of such assets is estimated and any impairment is recognized in the income
statement. The recoverable amount of an asset is the higher of its fair value less costs to sell and its value in use
where the value in use is the present value of the estimated future cash flows for such asset. The value in use is
determined by discounting the estimated future cash flows from the use of the asset to present value at a pretax
rate which reflects current market assessments of the time value of money, in relation to the period of the
investment and the risks specific to the asset. For an asset that does not generate independent financial flows, the
recoverable amount is determined by reference to the cash-generating unit to which such asset belongs.
An impairment loss is recognized in the income statement when the carrying amount of the asset, or the cash-
generating unit to which it is allocated, is higher than the recoverable amount. Where an impairment loss on
assets subsequently no longer exists or has decreased, the carrying amount of the asset, except for goodwill, is
increased and the reversal is recognized in the income statement. The asset is increased to the net carrying
amount that would have been recorded and reduced by the depreciation and amortization that would have been
charged had no impairment loss been recognized.
Financial instruments
Financial assets
Financial assets mainly relate to accounts receivable from customers, with fixed or determinable payments, that
are non-derivative and are not listed on an active market.
At first-time recognition, the financial assets are classified, depending on the case, as financial assets through
profit or loss, loans and receivables, financial assets held to maturity or available-for-sale financial assets. All
financial assets are recognized initially at fair value, to which directly attributable transaction costs are added,
except in the case of financial assets measured at fair value through profit or loss.
They are included in current assets, except for maturities greater than 12 months after the balance sheet date
which are classified in non-current assets. Such assets are recognized initially at fair value (to which directly
attributable transaction costs are added, except in the case of financial assets measured at fair value through
This Consolidated Full Year Financial Report has been translated into English solely for the convenience of the international reader. In case of discrepancies, the Italian language document is the sole authoritative and universally valid version.
24
profit or loss) and subsequently measured at amortized cost using the effective interest rate method. Where there
is objective evidence of an indication of impairment (that may include indications that a debtor or group of
debtors are in situations of financial difficulty, inability to meet obligations or inability or delays in interest
payments or important payments), the asset is reduced so that it equals the present value of estimated future cash
flows. The impairment loss is recognized in the income statement. Where an impairment loss on assets
subsequently no longer exists or has decreased, the carrying amount of the asset is increased up to the carrying
amount that would have been recorded under the amortized cost method had no impairment loss been
recognized.
Financial assets are derecognized from the financial statements when the right to receive cash flows from the
instrument is extinguished or when the Group has substantially transferred all the risks and rewards relating to
the receivable and the relative control.
Financial liabilities
Purchases and sales of financial liabilities are recognized on the trade date, that is, the date on which the Group
commits to purchase or sell the financial instrument.
Financial liabilities are borrowings, trade payables and other obligations payable. They are recognized initially
at fair value and subsequently measured at amortized cost using the effective interest rate method.
Financial liabilities are classified, on first-time recognition in financial liabilities at fair value through profit or
loss or in financing and loans.
All financial liabilities are recognized initially at fair value, to which directly attributable transaction costs are
added in the case of financing, loans and payables.
The financial liabilities of the Group include financing and loans, included bank overdrafts and guarantees
provided.
When there is a change in estimated cash flows and it is possible to estimate them reliably, the amount of the
borrowings is recalculated to reflect this change on the basis of the present value of the new estimated cash
flows and the internal rate of return determined initially. Financial liabilities are classified in current liabilities
unless the Group has an unconditional right to defer settlement of the liabilities for at least 12 months after the
balance sheet date.
Financial liabilities are derecognized from the financial statements when they are extinguished or when all the
risks and expenses relating to the liability have been transferred to third parties.
Derivative instruments
In accordance with its financial policies, the Group uses derivative financial instruments to hedge interest and
foreign exchange rate exposure. In particular, derivative financial instruments are used to hedge the exposure of
fluctuations in future cash flows arising as a result of the fulfillment of future contractual obligations defined at
the balance sheet date, mainly the payment of interest on variable-rate loans received (hereinafter also “cash
flow hedge”) and the risk of exposure to changes in the exchange rates relating to receivables and payables in
currencies other than the functional currency (hereinafter “fair value hedge”).

This Consolidated Full Year Financial Report has been translated into English solely for the convenience of the international reader. In case of discrepancies, the Italian language document is the sole authoritative and universally valid version.
25
Derivative financial instruments are initially recorded at fair value at the date of inception of the contract.
Changes in the fair value of the derivatives, subsequent to first-time recognition, are recognized in the income
statement as a financial component. This recognition criteria is applied to all derivatives since the Group does
not deem it opportune to implement the procedures necessary to determine the existence of the requisites to
designate, strictly from an accounting standpoint, the outstanding derivatives as hedging instruments, whether
fair value hedges or cash flow hedges, and therefore recognize the changes in fair value subsequent to the first-
time recognition of the derivatives according to specific hedge accounting criteria.
Determination of the fair value of derivative financial instruments
The Group measures financial instruments, such as derivatives, and non-financial assets, such as property
investments at fair value at each reporting date.
Fair value is the price that would be received to sell an asset or paid to transfer a liability in an orderly
transaction between market participants at the measurement date.
Fair value measurement assumes that the transaction to sell the asset or transfer the liability takes place either:
(a) in the principal market for the asset or liability; or
(b) in the absence of a principal market, the most advantageous market for the asset or liability.
The Group must have access to the principal (or most advantageous) market at the measurement date.
The fair value of an asset or a liability is measured using the assumptions that market participants would use
when pricing the asset or liability, assuming that market participants act in their economic best interest.
A fair value measurement of a non-financial asset takes into account a market participant’s ability to generate
economic benefits by using the asset in its highest and best use or by selling it to another market participant that
would use the asset in its highest and best use.
The Group uses valuation techniques that are appropriate in the circumstances and for which sufficient data are
available to measure fair value, maximizing the use of relevant observable inputs and minimizing the use of
unobservable inputs.
All assets and liabilities for which fair value is measured or disclosed in the financial statements are categorized
within the fair value hierarchy described as follows:
- Level 1 - quoted prices (unadjusted) in active markets for identical assets or liabilities that the entity
can access at the measurement date;
- Level 2 – inputs other than quoted prices included within Level 1 that are observable for the asset or
liability, either directly or indirectly;
- Level 3 – valuation techniques for which the inputs are unobservable for the asset or liability.
The fair value measurement is categorized in its entirety in the same level of the fair value hierarchy as the
lowest level input used for measurement.
For assets and liabilities held at the end of the reporting period that are measured at fair value on a recurring
basis, the Group determines if there have been any transfers between hierarchy levels, reviewing the
categorization (based on the lowest level input that is significant to the entire measurement).

This Consolidated Full Year Financial Report has been translated into English solely for the convenience of the international reader. In case of discrepancies, the Italian language document is the sole authoritative and universally valid version.
26
Inventories
Inventories are stated at the lower of purchase or production cost, determined using the weighted average cost
method, and estimated realizable value.
Inventories, where necessary, are adjusted to take into account obsolete or slow-moving goods. When the
circumstances which previously led to the adjustment no longer exist or when there is a clear indication of an
increase in net realizable value, the adjustments are reversed in whole or in part so that the new carrying amount
is the lower of purchase or production cost and net realizable value at the balance sheet date.
Cash
Cash includes bank deposits, postal deposits, cash and valuables in cash. They are stated in Euro at nominal
value, which corresponds to fair value, and if in a currency other than the euro, at the exchange rate at the end of
the year.
Provisions
Provisions include accruals for present legal or constructive obligations as a result of past events for which it is
more likely than not that an outflow of resources will be required to settle the obligation and the amount can be
reliably estimated. The accrual is measured using the best possible estimate of the amount that the Group would
be expected to pay to extinguish the obligation. Where the effect of the time value of money is material and the
dates of payment can be reliably estimated, the accrual is measured at present value. The rate used to determine
the present value of the liability reflects fair value and includes the additional effects relating to the specific risk
that can be associated with each liability. The change in the amount of the provision connected with the passage
of time is recognized in the income statement in Financial expenses.
Risks associated with liabilities that are only considered possible are disclosed under Guarantees and other
commitments.
Employee benefit obligations
The Group companies operate various types of defined benefit pension plans, in accordance with the conditions
and practices commonly applied in the countries in which the Group companies conduct their business.
Defined benefit pension plans, which also include the employee severance indemnities due to Italian employees
as set forth in article 2120 of the Italian Civil Code, are based on the working life and the compensation
received by the employee over a predetermined service period. In particular, the liability relating to employee
severance indemnities is recognized in the financial statements based on actuarial calculations since it qualifies
as an employee benefit due on the basis of a defined benefit plan. Recognition of a defined benefit plan in the
financial statements requires actuarial techniques to estimate the amount of benefits accruing to employees in
exchange for work performed during the current and prior years and the discounting of such benefits in order to
determine the present value of the Group’s commitments. The determination of the present value of such
commitments is calculated using the Projected Unit Credit Method. This method, which is one of the actuarial
techniques used for calculating accrued benefits, considers each active service period by the employee in the

This Consolidated Full Year Financial Report has been translated into English solely for the convenience of the international reader. In case of discrepancies, the Italian language document is the sole authoritative and universally valid version.
27
company as an additional unit which gives the right to benefits: the actuarial liability must therefore be
quantified on the basis of only the service life accrued at the date of measurement; therefore, the total liability is
normally recalculated on the basis of the ratio of the number of years of service accrued at the measurement date
to the total estimated service life that will be reached at the time of settlement. Furthermore, this method calls
for considering future increases in compensation, for whatever reasons (inflation, career, contract renewals, etc.)
up until the time of termination of employment.
The cost accrued during the year for defined benefit plans and recognized in the income statement under
employee benefit expenses is equal to the sum of the average present value of the defined benefits accrued by
active employees for the work performed during the year and the annual interest accrued on the present value of
the Group companies’ commitments at the beginning of the year, calculated using the discount rate of future
cash outflows adopted for the estimate of the liability at the end of the preceding year. Remeasurements of
employee defined benefit plans comprise actuarial gains and losses expressing the effects of differences arising
from experience adjustments and changes in actuarial assumptions. Such actuarial gains and losses are recorded
in the statement of comprehensive income.
Following the Reform of Supplementary Pension Benefits, as amended by the Budget Law 2007 and subsequent
decrees and regulations issued during the early months of 2007, employee severance indemnities that accrue
starting from the date of January 1, 2007 are assigned to pension funds or to a treasury fund managed by INPS
or, in the case of companies with less than 50 employees, may be retained in the company and calculated
similarly to the method used in past years. Employees have the right to choose the destination of their employee
severance indemnities up to December 31, 2007.
To this end, account was taken of the effect of the new provisions and only the liability relating to employee
severance indemnities that is retained in the company is measured in accordance with IAS 19, since the amount
of employee severance indemnities accruing from 2007 is assigned to alternative forms of pension or paid into a
treasury fund managed by INPS, according to the choice of destination made by each single employee.
Consequently, the portion of employee severance indemnities accruing and assigned to pension funds or to the
INPS-managed fund is classified as a defined contribution plan since the company’s obligation is only
represented by the payment of contributions to the pension fund or to INPS. The liability for severance
indemnities previously accrued continues to be considered as a defined benefit plan and is measured on the basis
of actuarial assumptions.
Translation of foreign currency balances and transactions
Transactions in foreign currency are translated to Euro using the exchange rate in effect at the dates of the
relative transactions. Foreign exchange gains and losses realized on the receipt or the payment of the above
transactions and the translation of monetary asset and liability balances denominated in foreign currencies are
recognized in the income statement.
Foreign exchange gains and losses arising from bonds and other monetary assets measured at fair value through
profit or loss are recognized as part of the changes in the relative fair value in the income statement.

This Consolidated Full Year Financial Report has been translated into English solely for the convenience of the international reader. In case of discrepancies, the Italian language document is the sole authoritative and universally valid version.
28
Discontinued operations
A discontinued operation is a component of an entity that either has been disposed of, or is classified as held for
sale, and represents a separate major line of business or geographical region of operations, and is part of a single
coordinated disposal plan.
In the consolidated income statement, the post-tax profit or loss of discontinued operations and the post-tax gain
or loss recognized on the measurement to fair value less costs to sell or on the disposal of the assets or disposal
group constituting the discontinued operation, is disclosed as a single amount separately from the post-tax profit
or loss from continuing operations.
The net cash flows attributable to the activities of discontinued operations are presented separately in the
statement of cash flows.
Disclosure of the above is also provided for the comparative period.
Revenues and costs
Revenues and costs are recognized according to the accrual and matching principles.
Revenues are recognized net of returns, discounts, allowances, rebates, taxes and directly related promotional
contributions. Revenues are recognized upon delivery of the goods to the final customer when all the risks and
rewards of ownership are transferred.
Revenue recognition
Sales of products
Revenues from sale of products are recognized when all the following conditions are met:
when the significant risks and rewards of ownership are transferred to the customer;
effective control over the assets in the transaction and the normal continuing level of business
associated with ownership have ceased;
the revenues can be measured reliably;
it is probable that economic benefits associated with the sales transaction will flow to the company;
the costs incurred or to be incurred can be determined reliably.
In the event the nature and the extent of the seller’s involvement is such that the risks and rewards
relating to ownership are not in fact transferred, the time of revenue recognition is deferred until the
date when such transfer can be considered to have taken place.
Under “bill and hold” transactions, revenue is recognized when there is a contract signed by the
customer in which the customer expressly asks that delivery of the products be deferred while
nevertheless assuming all their associated risks and rewards. Such transactions refer solely to products

This Consolidated Full Year Financial Report has been translated into English solely for the convenience of the international reader. In case of discrepancies, the Italian language document is the sole authoritative and universally valid version.
29
of Intercos Europe that are immediately available and will be concluded in a short period of time after
the date in which the “bill and hold” agreement was signed between the parties.
Performance of services
Revenues from services are recognized only when the results of the transaction can be estimated reliably, with
reference to the stage of completion of the transaction at the closing date of the financial statements.
The results of a transaction can be estimated reliably when all the following conditions are met:
the amount of revenues can be determined with reliability;
it is probable that any future economic benefit associated with the item of revenue will flow to the
entity;
the stage of completion at the date of the financial statements can be measured reliably;
the costs incurred for the transaction and the costs or to be incurred to complete the transaction can be
measured reliably.
Financial expenses
Financial expenses are recorded as expenses in the year incurred. They include interest on bank overdrafts and
loans, financial expenses on finance leases, actuarial losses and financial expenses on the actuarial valuation of
employee severance indemnities.
Income taxes
Current income taxes
Current tax income or tax expense for the year is measured based on the amount that is expected to be recovered
or paid to the tax authorities. The tax rates and the tax laws used in calculating the amount are those enacted, or
substantially in effect, at the reporting date of the financial statements in the countries where the Group operates
and generates its taxable income.
Current taxes relative to elements recognized directly in equity are also recognized in equity and not in the
income statement for the year. Management periodically evaluates the position taken in the tax return in the case
in which the tax rules are subject to interpretation and, where appropriate, makes suitable accruals.
Deferred taxes
Deferred income taxes are calculated by applying the “liability method” to the temporary differences between
the tax bases of the assets and liabilities and their corresponding carrying amounts.
Deferred tax liabilities are recognized on all taxable temporary differences, with the following exceptions:
- deferred tax liabilities arising from the initial recognition of goodwill or an asset or a liability in a
transaction that is not a business combination and, at the time of the transaction, affects neither

This Consolidated Full Year Financial Report has been translated into English solely for the convenience of the international reader. In case of discrepancies, the Italian language document is the sole authoritative and universally valid version.
30
accounting profit nor taxable profit (tax loss):
- reversal of taxable temporary differences, associated with investments in subsidiaries or associates,
can be controlled, and it is probable that it will not occur in the foreseeable future.
Deferred tax assets are recognized on all deductible temporary differences, the carryforward of unused tax
credits and the carryforward of unused tax losses, to the extent that it is probable that taxable profit will be
available against which the deductible temporary differences, the carryforward of unused tax credits and the
carryforward of unused tax losses can be utilized, except in the case of:
- deferred tax assets associated with deductible temporary difference arising from the initial
recognition of an asset or a liability in a transaction that is not a business combination and, at the
time of the transaction, affects neither the accounting profit nor the taxable profit (tax loss);
- deductible temporary differences arising from investments in subsidiaries or associates, in which
case the deferred tax assets are recognized only to the extent that it is probable that taxable profit
will be available against which the temporary difference can be utilized.
The carrying amount of deferred tax assets is reviewed at the end of each reporting period and reduced to the
extent that it is no longer probable that sufficient taxable income will be available to allow the benefit of part or
all the deferred tax asset to be utilized. Any such reduction is reversed to the extent that it becomes probable that
sufficient taxable profit will be available.
Deferred tax assets and liabilities are measured at the tax rates that are expected to apply to taxable income in
the period when such assets are realized or such liabilities are settled, based on tax rates that have been enacted
or substantively enacted by the end of the reporting period; in the calculation, account was taken of the
reduction in the IRES tax rate from the current 27.5% to 24%, starting from the year 2017 as established by Law
208 of December 28, 2015, known as the Stability Law 2016.
Deferred tax assets and liabilities relating to elements recognized outside the income statement are recognized
either directly in equity or in other comprehensive income, consistently with the items to which they refer.
Deferred tax assets and liabilities are offset if and only if there is a legally enforceable right to set off current tax
assets against current tax liabilities, and the deferred tax assets and deferred tax liabilities refer to the same
taxpayer and are levied by the same taxation authority.
Tax benefits acquired in a business combination which do not meet the criteria for separate recognition at the
acquisition date, may be recognized after the acquisition date, when new information is obtained about changes
in events or circumstances. The adjustment is recognized as a deduction from goodwill (up to the amount of
goodwill), if it is recognized during the measurement period, or in the income statement if recognized
subsequently.
Intercos S.p.A. has adhered to the national tax consolidation procedure under articles 117-129 of T.U.I.R. as the
“consolidating” company since 2008, valid for a three-year period, with Intercos Europe S.p.A. and Marketing
Projects S.r.l. as the “consolidated” companies. The option was also renewed for the period 2011-2013 and the
period 2014-2016. The companies participating in the national tax consolidation procedure are, besides the
parent, Intercos Europe S.p.A., Marketing Projects S.r.l. in liquidation, Ager S.r.l., Vitalab S.r.l., Drop Nail S.r.l.

This Consolidated Full Year Financial Report has been translated into English solely for the convenience of the international reader. In case of discrepancies, the Italian language document is the sole authoritative and universally valid version.
31
and Kit Productions S.r.l.
Each of these companies transfers its taxable income or tax loss to Intercos S.p.A. which records a receivable
(equal to the IRES tax to be paid) with the companies which contribute a taxable income or a payable with the
companies which transfer a tax loss.
Intercos S.p.A., as the consolidating company, is responsible not only for any additional taxes assessed and the
relative fines and interest referring to its own individual total income, but also for the sums which could become
due, with reference to the consolidated tax return, from “formal control” activities pursuant to ex art. 36-ter DPR
600/1973. It is also liable, jointly and severally, for the sums due in relation to fines levied on companies in the
consolidated tax return which have committed violations in determining the individual position. Similarly, the
consolidated companies are jointly and severally liable with Intercos S.p.A., as the consolidating company, for
higher taxes assessed relating to the consolidated tax return referring to adjustments to the income in its tax
return, also as a result of “formal control” activities, pursuant to ex art. 36-ter DPR 600/1973. All of this is
governed by the Tax consolidation agreement originally signed on June 5, 2008 and subsequent revisions, the
last, currently in existence, on October 1, 2014.
3. Risk management
Financial risk management is an integral part of the management of the Group’s business. The board of directors
of the company establishes the policies for the management of risks such as market risk, credit risk and liquidity
risk.
Types of risks
Financial risk management
The Group is exposed to various types of risks including exchange rate risk and interest rate risk, credit risk and
liquidity risk. The Group’s risk management strategy is focused on the unpredictability of the markets and
aimed at minimizing potential negative effects on earnings. Certain types of risk are mitigated using derivative
financial instruments.
The coordination and monitoring of major financial risks is centralized with management. The risk management
policies are approved, in concert with the board of directors, by the Group’s Administration, Finance and
Control Function, which provides written policies for the management of the above risks and the use of suitable
financial instruments.
In the sensitivity analyses performed and described below, the effect on profit and equity was calculated without
considering the tax effect.

This Consolidated Full Year Financial Report has been translated into English solely for the convenience of the international reader. In case of discrepancies, the Italian language document is the sole authoritative and universally valid version.
32
Exchange rate risk
The Group operates globally and is exposed to foreign exchange risk arising from fluctuations in the equivalent
amount of commercial and financial flows denominated in currencies other than the functional currency of the
individual companies of the Group.
The Group’s exposure is mainly concentrated on the following exchange rates:
- EUR/USD exchange rate: with reference to commercial and financial transactions entered into by
Eurozone companies operating on the North American market and vice versa.
- EUR/GBP exchange rate: with reference to commercial and financial transactions entered into by
Eurozone companies operating on the British market and vice versa.
- USD/RMB: with reference to commercial and financial transactions entered into by Chinese
companies operating on the North American market and vice versa.
- EUR/RMB: with reference to commercial and financial transactions entered into by Eurozone
companies operating on the Chinese market and vice-versa.
- CHF/EUR/USD: with reference to commercial and financial transactions entered into by the Group
company operating in Switzerland.
It is the Group’s policy to hedge, where possible, exposures denominated in currencies other than the functional
currency of the individual companies, particularly the following:
certain flows: commercial flows and exposures generated by loans receivable and payable;
forecast flows: commercial flows originating from certain or highly probable contractual commitments.
These hedges are monitored by net currency positions managed by the Group or by using derivative contracts.
The following sensitivity analysis was performed to illustrate the effects on consolidated profit and
consequently on equity produced by an increase/decrease of 7.5% in the exchange rates compared to the
effective exchange rates at December 31, 2016 and at December 31, 2015.
The following sensitivity analysis does not consider the tax effect on profit and equity.
(in € thousands) 2016 2015
-7.50% 7.50% -7.50% 7.50%
US dollar (1,084) 933 (1,732) 1,490
British pound 357 (308) 400 (345)
Other currencies 240 (207) 326 (280)
Total (487) 419 (1,006) 866

This Consolidated Full Year Financial Report has been translated into English solely for the convenience of the international reader. In case of discrepancies, the Italian language document is the sole authoritative and universally valid version.
33
Interest rate risk
The Group is exposed to interest rate risk mainly from long-term borrowings. Such borrowings are at either
fixed or variable interest rates. The Group has no particular hedging policy regarding the risks arising from
fixed-rate contracts, maintaining that the risk is moderate in relation to the limited amount of fixed-rate loans.
Variable-rate borrowings expose the Group to risk originating from the volatility of interest rates (cash flow
risk). With regard to this risk, for purposes of hedging, the Group may use derivative contracts which limit the
impact of interest rate fluctuations on the income statement.
The Group monitors interest rate risk exposure and proposes the most appropriate hedging strategies to keep
exposure within the limits established by the Administration, Finance and Control Function of the Group, using
derivative contracts, where necessary.
The following sensitivity analysis was performed to illustrate the effects on consolidated profit produced by an
increase/decrease of 50 basis points in interest rates compared to the effective interest rates at December 31,
2016 and at December 31, 2015, with all other variables remaining constant.
(in € thousands) 2016 2015
-0.50% +0.50% -0.50% +0.50%
Euro (Euribor) (143) 143 (169) 169
US dollar (Libor) (75) 75 (83) 83
Total (218) 218 (252) 252
The potential effects reported above were calculated by taking the liabilities which represent the most
significant part of the Group’s borrowings at the reference date and calculating, on that amount, the potential
impact of a change in the interest rates on an annual basis.
The liabilities in this analysis include variable-rate financial payables and receivables, cash and cash equivalents
and derivative financial instruments whose value is affected by changes in interest rates.
Credit risk
Credit risk is associated with trade receivables, cash and cash equivalents, financial instruments, deposits at
banks and other financial institutions and is defined as the risk that a counterparty does not fulfill the obligations
associated with a financial instrument or a commercial contract, thus resulting in a financial loss.
The credit risk related to trading counterparties is managed by the individual subsidiaries and monitored
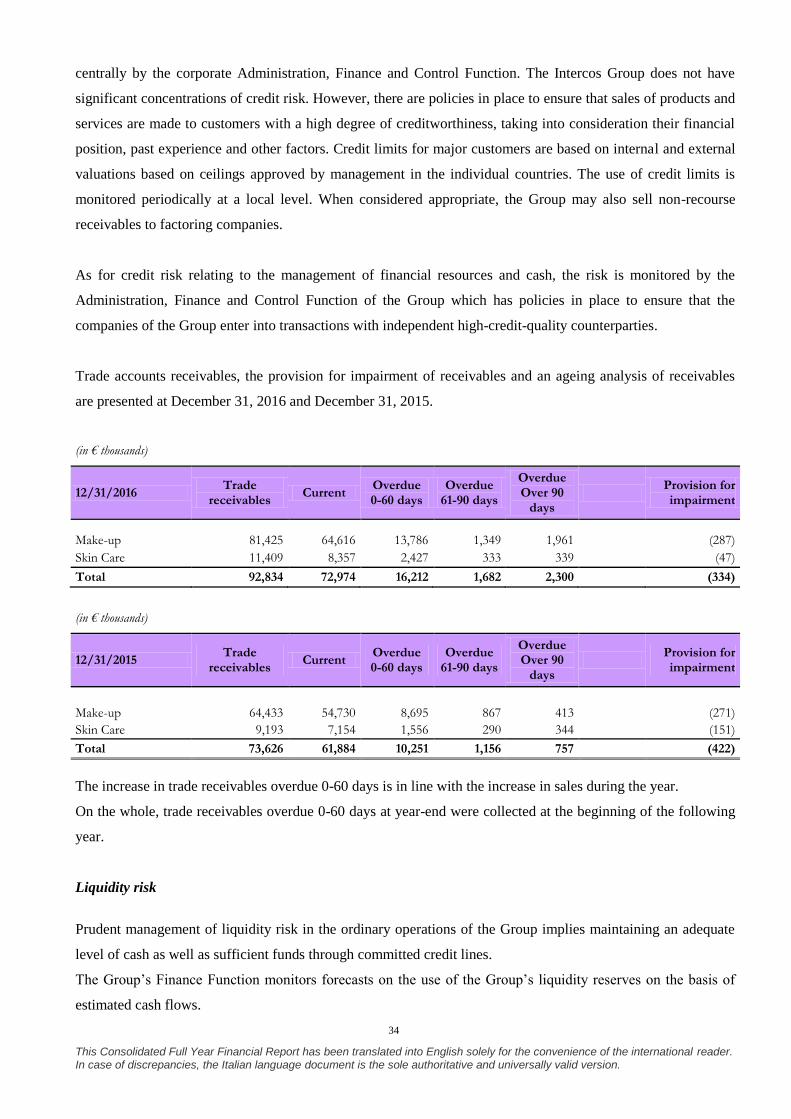
This Consolidated Full Year Financial Report has been translated into English solely for the convenience of the international reader. In case of discrepancies, the Italian language document is the sole authoritative and universally valid version.
34
centrally by the corporate Administration, Finance and Control Function. The Intercos Group does not have
significant concentrations of credit risk. However, there are policies in place to ensure that sales of products and
services are made to customers with a high degree of creditworthiness, taking into consideration their financial
position, past experience and other factors. Credit limits for major customers are based on internal and external
valuations based on ceilings approved by management in the individual countries. The use of credit limits is
monitored periodically at a local level. When considered appropriate, the Group may also sell non-recourse
receivables to factoring companies.
As for credit risk relating to the management of financial resources and cash, the risk is monitored by the
Administration, Finance and Control Function of the Group which has policies in place to ensure that the
companies of the Group enter into transactions with independent high-credit-quality counterparties.
Trade accounts receivables, the provision for impairment of receivables and an ageing analysis of receivables
are presented at December 31, 2016 and December 31, 2015.
(in € thousands)
12/31/2016 Trade
receivables Current
Overdue 0-60 days
Overdue 61-90 days
Overdue Over 90
days
Provision for impairment
Make-up 81,425 64,616 13,786 1,349 1,961
(287)
Skin Care 11,409 8,357 2,427 333 339
(47)
Total 92,834 72,974 16,212 1,682 2,300
(334)
(in € thousands)
12/31/2015 Trade
receivables Current
Overdue 0-60 days
Overdue 61-90 days
Overdue Over 90
days
Provision for impairment
Make-up 64,433 54,730 8,695 867 413
(271)
Skin Care 9,193 7,154 1,556 290 344
(151)
Total 73,626 61,884 10,251 1,156 757
(422)
The increase in trade receivables overdue 0-60 days is in line with the increase in sales during the year.
On the whole, trade receivables overdue 0-60 days at year-end were collected at the beginning of the following
year.
Liquidity risk
Prudent management of liquidity risk in the ordinary operations of the Group implies maintaining an adequate
level of cash as well as sufficient funds through committed credit lines.
The Group’s Finance Function monitors forecasts on the use of the Group’s liquidity reserves on the basis of
estimated cash flows.

This Consolidated Full Year Financial Report has been translated into English solely for the convenience of the international reader. In case of discrepancies, the Italian language document is the sole authoritative and universally valid version.
35
The amount of liquid assets available at December 31, 2016 compared to the end of the prior year is as follows.
(in € thousands) December 31, 2016 December 31, 2015
Cash and cash equivalents 64,525 50,683
Unused committed credit lines 30,000 30,000
Total 94,525 80,683
The following tables present an analysis of the maturities of borrowings and other liabilities. Borrowings from
banks in the following tables are presented at their nominal amount:
(in € thousands) Within 1 year
1 to 5 years
Beyond 5 years
At December 31, 2016
Bonds - - 120,000 120,000
Borrowings from banks and other lenders - m-l/term 4,135 38,989 0 43,124
Finance leases payable 256 913 0 1,169
Medium/long-term debt 4,391 39,903 120,000 164,294
Borrowings from banks and other lenders - s/term 26,372 1,507 4,186 32,066
Factoring companies payable 253 0 0 253
Trade payables 89,846 0 0 89,846
Short-term debt 116,471 1,507 4,186 122,165
Total 120,863 41,410 124,186 286,459
(in € thousands) Within
1 year 1 to
5 years Beyond 5
years At
December 31, 2015
Bonds - - 120,000 120,000
Borrowings from banks and other lenders - m-l/term 6,335 42,525 - 48,860
Finance leases payable 239 700 - 939
Medium/long-term debt 6,574 43,225 120,000 169,799
Borrowings from banks and other lenders - s/term 19,131 - - 19,131
Factoring companies payable 199 - - 199
Trade payables 69,456 - - 69,456
Short-term debt 88,786 - - 88,786
Total 95,360 43,225 120,000 258,585

This Consolidated Full Year Financial Report has been translated into English solely for the convenience of the international reader. In case of discrepancies, the Italian language document is the sole authoritative and universally valid version.
36
In order to complete the disclosure on financial risks, a reconciliation is presented below between the categories
of financial assets and liabilities as identified in the statement of financial position format of the Group and the
categories of assets and liabilities identified in accordance with the requirements of IFRS7.
(in € thousands)
12/31/2016
Financial assets at fair value through profit or loss
Receivables and loans
Available-for-sale financial assets
Held-to-maturity assets
Financial liabilities at fair value through profit or loss
Other liabilities at amortized cost
Hedging derivatives
Available-for-sale financial assets
- - - - - - -
Derivatives (assets) - - - - - - - Securities held for trading - - - - - - - Trade receivables - 92,834 - - - - - Other receivables (*) - 2,925 - - - - - Borrowings from banks and other lenders
- - - - - 197,360 -
Trade payables - - - - - 89,846 - Other payables (*) - - - - - 21,385 - Derivatives (liabilities) - - - - - - 447
Total - 95,760 - - - 308,951 447
(in € thousands)
12/31/2015
Financial assets at fair value through profit or loss
Receivables and loans
Available-for-sale financial assets
Held-to-maturity assets
Financial liabilities at fair value through profit or loss
Other liabilities at amortized cost
Hedging derivatives
Available-for-sale financial assets
- - - - - - -
Derivatives (assets) - - - - - - - Securities held for trading - - - - - - - Trade receivables - 73,626 - - - - - Other receivables (*) - 6,494 - - - - - Borrowings from banks and other lenders
- - - - - 199,279 -
Trade payables - - - - - 69,456 - Other payables (*) - - - - - 20,063 - Derivatives (liabilities) - - - - - - 586
Total - 80,120 - - - 288,798 586
(*) Other receivables and Other payables exclude items of a tax nature which do not meet the definition of financial assets or liabilities.
With reference to the assets and liabilities in the above tables, the fair value is considered to approximate the
carrying amounts in the financial statements.
Derivatives
IFRS require the fair value categorization of derivative financial instruments within the fair value hierarchy
based on inputs that are observable in the market or other financial parameters (e.g. interest rate, exchange rate
curves, etc.). Derivatives in foreign currency to hedge exchange rate risk fall under Level 2 of the fair value

This Consolidated Full Year Financial Report has been translated into English solely for the convenience of the international reader. In case of discrepancies, the Italian language document is the sole authoritative and universally valid version.
37
hierarchy since the fair value of these instruments is determined by recalculating the present value at the official
year-end rate for exchange rates and interest rates quoted in the market.
The following table illustrates the fair value of the financial instruments portfolio:
Fair value hierarchy at the reporting date
(in € thousands) December 31, 2016
Level 2 December 31, 2015
Level 2
Assets Currency Forwards/ swaps/ options
Fair value hedge - -
Liabilities Currency Forwards / swaps/ options
Fair value hedge 447 586
Fair value hedges are used to hedge exchange rate risk on financial assets and liabilities recorded in the financial
statements.
With reference to the derivatives to hedge exchange rate risk, an indication is given below of the estimated dates
of flows in US dollars.
Notional amount in thousands of USD
December 31, 2016 December 31, 2015
Due Collection Payment Collection Payment
Within 1 year 17,500 - 24,000 -
1 to 5 years - - - -
Beyond 5 years - - - -
Total 17,500 - 24,000 -

This Consolidated Full Year Financial Report has been translated into English solely for the convenience of the international reader. In case of discrepancies, the Italian language document is the sole authoritative and universally valid version.
38
4. Use of estimates and assumptions
The preparation of the consolidated financial statements requires management to apply accounting principles
and methods which at times are based upon complex subjective judgments and estimates connected with past
experience as well as reasonable and realistic assumptions according to the relevant circumstances. The use of
these estimates and assumptions can affect the amounts reported in the financial statements, such as the
statement of financial position, the statement of comprehensive income and the statement of cash flows, in
addition to the disclosure provided. Such estimates and assumptions have an effect on the reported amounts in
the financial statements due to the uncertainty characterizing the assumptions and the conditions on which the
estimates are based. Actual results could differ, even significantly, from those estimates owing to possible
changes in the factors considered in the determination of such estimates. Those accounting policies which
particularly require critical judgments by management in making estimates and for which a change in the
conditions underlying the assumptions used could have a significant impact on the financial statements are
briefly described below.
Goodwill
In accordance with the accounting policies adopted for the preparation of the financial statements, goodwill is
tested annually for any impairment that requires recognition in the income statement. The test specifically
requires the allocation of goodwill to cash-generating units and the subsequent determination of the recoverable
amount, being the higher of the fair value and the value in use. When the value in use is lower than the carrying
amount of the cash-generating unit, an impairment of goodwill should be recognized. The allocation of goodwill
to the cash-generating unit and the determination of the value in use require the use of estimates that depend
upon subjective judgments and factors which over time could be different from management’s estimates and
have consequent effects that could be significant.
Impairment of property, plant and equipment and intangible assets
Property, plant and equipment and intangible assets are tested for any impairment that requires recognition of an
impairment loss, whenever there are indications that the carrying amount through use may not be recoverable.
Verification of the existence of such indications requires management to exercise subjective judgment based on
information available internally and from the market and from historical experience. Moreover, whenever an
impairment may exist, the Group determines the impairment loss on the basis of appropriate measurement
techniques. The proper identification of the factors indicating that an impairment may exist and the estimates
used depend on factors which could vary over time and affect management’s judgments and estimates.

This Consolidated Full Year Financial Report has been translated into English solely for the convenience of the international reader. In case of discrepancies, the Italian language document is the sole authoritative and universally valid version.
39
Depreciation of property, plant and equipment
Depreciation of property, plant and equipment constitutes a significant cost for the Group. The cost of buildings,
plant and machinery is depreciated over the estimated useful lives of the assets on a straight-line basis. The
economic useful life of these assets is determined by management when the assets are purchased; it is based on
the historical experience of similar assets, market conditions and anticipation of future events which could have
an impact on the useful life, including changes in technology. Therefore, the effective economic life could differ
from the estimated useful life. The Group periodically reviews technological and sector changes, evaluates
decommissioning costs and the recoverable amount in order to update the residual useful life. This periodical
update could entail a change in the period of depreciation and therefore a change in the depreciation charge of
future year.
Deferred taxes
Deferred tax assets are recognized on the basis of expectations of future earnings. The estimate of future
earnings for purposes of the recognition of deferred taxes depends on factors which could vary over time and
significantly affect the amount of deferred taxes.
Provisions
Accruals are made to provisions for probable liabilities relating to disputes with employees, suppliers, third
parties and, generally, the expenses which the Group might be obliged to incur for obligations undertaken in the
past. These accruals also include an estimate of the liabilities which could arise from disputes concerning the
terms of fixed-term labor contracts used in the past. The determination of such accruals requires the assumption
of estimates which depend on the current knowledge of factors which could change over time and which could
produce effects that differ from the final outcomes estimated by management in preparing the financial
statements.

This Consolidated Full Year Financial Report has been translated into English solely for the convenience of the international reader. In case of discrepancies, the Italian language document is the sole authoritative and universally valid version.
40
5. Segment reporting
At December 31, 2016, the Group’s business is aggregated into two Business Units identified on the basis of the
following product lines:
“Make-up” Business Unit: specialized in the creation, development, manufacture and marketing of
powders, emulsions, lipsticks and types of cosmetics using delivery systems in the form of pens/pencils
for the face, eyes and lips.
“Skin Care” Business Unit: specialized in the manufacture and marketing of cosmetic and skin care
creams.
Financial information reported according to business units is periodically reviewed by the board of directors and
used for planning and budgeting.
Detailed information on each identified segment for the years ended December 31, 2016 and 2015 is presented
in the following tables.
2016 - (in € thousands) Make-up Skin Care Total
Revenues 393,118 55,571 448,690
Adjusted EBITDA * 55,670 6,797 62,467
Depreciation, amortization and impairment reversals (losses) (19,074) (2,700) (21,774)
Nonrecurring income (expenses)
638
Financial income (expenses)
(9,812)
Result from investments accounting for using the equity method
263
Income taxes
(11,968)
Profit for the year
19,814
Net invested capital 228,896 41,432 270,328
2015 - (in € thousands) Make-up Skin Care Total
Revenues 349,651 52,116 401,767
Adjusted EBITDA * 50,878 8,966 59,844
Depreciation, amortization and impairment reversals (losses) (19,551) (1,912) (21,463)
Nonrecurring income (expenses)
(1,083)
Finance income (expenses)
(12,588)
Income taxes
(10,011)
Profit for the year
14,804
Net invested capital 219,306 47,681 266,986
*Adjusted EBITDA is represented by operating profit (loss) before depreciation, amortization and impairment reversals (losses) adjusted by
nonrecurring income (expenses).
Make-up Business Unit: revenues total €393,118 thousand, with an increase of €43,467 thousand (+12.4%)
compared to 2015.

This Consolidated Full Year Financial Report has been translated into English solely for the convenience of the international reader. In case of discrepancies, the Italian language document is the sole authoritative and universally valid version.
41
Adjusted EBITDA, represented by operating profit before depreciation, amortization, impairment reversals
(losses) and nonrecurring income (expenses), grew €4,793 thousand, from €50,878 thousand to €55,670
thousand.
The increase in EBITDA in 2016 is due to higher volumes generated by a favorable product mix in the most
important geographical regions in which the Group operates.
Skin Care Business Unit: sales in 2016 are €55,571 thousand, an increase of €3,455 thousand (+6.6%) from
2015.
Adjusted EBITDA is €6,797 thousand compared to €8,966 thousand in 2015, with a decrease of €2,169
thousand (-24.2%).
The increase in volumes did not reflect an increase in adjusted EBITDA due to the effect of a different mix and
a higher incidence of manufacturing costs and structure costs, although the latter only to a limited extent.
Detailed information relating to the geographical regions contributing to revenues is reported according to the
location in which the recipient of the invoice has its headquarters.
(in € thousands) 2016 2015
Revenues
Americas 161,479 162,313
EMEA 242,398 190,632
Asia 44,813 48,822
Total 448,690 401,767
The geographical breakdown of revenues shows differing trends in different areas. More specifically:
Americas: this region recorded lower revenues compared to the prior year of 1%, mainly in the Prestige
market.
EMEA: posted sales of €242,398 thousand versus €190,632 thousand in the prior year, with the €51,766
thousand increase (+27.2%) recorded principally in all customer segments, whereas the market increase
in the region was 3.9% overall.
Asia: reported a decrease in revenues of 8.2% compared to 2015 (€44,813 thousand from €48,822
thousand), mainly in respect of multinational customers.
Assets of the Group by geographical region are as follows:
(in € thousands) 2016 2015
Assets
Americas 96,227 74,296
EMEA 252,800 265,787
Asia 127,718 89,857
Total 476,745 429,941

This Consolidated Full Year Financial Report has been translated into English solely for the convenience of the international reader. In case of discrepancies, the Italian language document is the sole authoritative and universally valid version.
42
Capital expenditures of the Group by geographical region are as follows:
(in € thousands) 2016 2015
Capital expenditures
Americas 5,275 2,248
EMEA 8,766 7,692
Asia 6,120 4,597
Total 20,161 14,537
Capital expenditures in the Americas region in 2016 include €1,333 thousand for the purchase of machinery and
equipment by Intercos America to increase productivity and the productive capacity of the filling and pencil
departments, and €1,636 thousand to the Intercos do Brasil production site, of which €1,574 thousand was for
the purchase of machinery and equipment.
The EMEA region spent a total of €8,766 thousand, of which €7,210 thousand by Intercos Europe S.p.A. and
€681 thousand by CRB S.A. Capital expenditures in both companies were for the purchase of new machinery
(€4,558 thousand) and new industrial equipment (€1,611 thousand).
As for the Asia region, the Group, through the subsidiary Intercos Technology Ltd, spent a total of €6,120
thousand for new capital expenditures, of which €1,379 thousand relates to industrial machinery and equipment
and €3,481 thousand to complete the new production facility in China.
6. Significant events in 2016
The following significant events took place during 2016:
On January 19, 2016, Intercos S.p.A. (parent) signed a settlement agreement with Woojung Tech. Co.,
Ltd. and Mr Dong-Pil Choi to definitively and amicably close, in the company’s favor, the dispute
initiated in September 2014, in relation to which a summons was filed by Intercos S.p.A. for trade secret
misappropriation before the Courts in Los Angeles, California”.
On January 30, 2016, Intercos Asia Pacific increased its investment in the share capital of the
subsidiary Shinsegae Intercos Korea by Korean Won 5,000,000 thousand. The shareholder Shinsegae
also increased its investment in the company’s share capital so that its percentage investment in capital
would remain unchanged.
On February 9, 2016, the board of directors of Intercos S.p.A. approved the transfer of the company’s
registered office from Milan, Piazza Eleonora Duse 2, to Milan, Piazza Generale Armando Diaz 1. The
registered offices of the subsidiaries were also transferred: Drop Nail S.r.l. (on February 15, 2016),
Intercos Europe S.p.A. and Vitalab S.r.l. (on March 25, 2016).
On February 10, 2016, following the intent manifested by Drop Nail S.r.l.’s minority shareholder,
Paragon Cosmetics S.r.l., to: 1) divest of its 40% interest in the capital of Drop Nail S.r.l., equal to a
nominal amount of €20 thousand and 2) sell its remaining receivable due from Drop Nail S.r.l., for the

This Consolidated Full Year Financial Report has been translated into English solely for the convenience of the international reader. In case of discrepancies, the Italian language document is the sole authoritative and universally valid version.
43
shareholder loans extended in the past, for a total amount of €1 thousand – Intercos S.p.A, as part of its
business plan aimed at strengthening its product range represented by nail polishes and nail care
products, purchased Paragon’s investment and receivable for €543 thousand, thus bringing its
investment to €1,186,234, representing 100% of the capital of the company Drop Nail S.r.l.
On March 25, 2016, the parent waived a part of its non interest-bearing shareholder loan due from
Drop Nail S.r.l. and, precisely, a total of €1,000 thousand, with such amount to be recorded in equity,
under Other reserves, subaccount Payment against share capital, bringing its investment to €2,186,234
thousand.
On May 2, 2016, a share capital increase was approved by the company Intercos Do Brasil Indùstria e
Comércio de Productos Cosmeticos LTDA (“IDOBRASIL”) for R$8,000,000, subscribed to and fully
paid in by Intercos S.p.A. as a shareholder of IDOBRASIL.
Following the above capital increase, the share capital of IDOBRASIL amounts to R$30,377,143,
divided into 30,377,143 shares of R$1.00 each, held by the shareholders as follows: (a) 30,280,543
shares for a total of R$30,280,543 held by Intercos S.p.A. and (b) 96,600 shares for a total of R$96,600
held by Intercos America Inc.
On July 28, 2016, the Drop Nail S.r.l. shareholders’ meeting appointed Vincenzo Misitano as the sole
Director.
On August 1, 2016, Intercos S.p.A. conferred its investment in the company Hana Co. Ltd
(representing 20% of the entire share capital) to the company Intercos Asia Pacific Limited.
On August 1, 2016, Intercos S.p.A., as the sole shareholder of Intercos America Inc., subscribed to a
capital increase by Intercos America Inc. for a total of $25,000,000 to be paid in several tranches as
follows: 1) $5,000,000 by a cash injection; 2) $10,000,000 by the partial waver of intercompany loans
that were extended by Intercos S.p.A. to Intercos America Inc., which amounted to a total of
$37,900,000; and 3) $10,000,000 by payment in separate tranches based on resolutions passed
previously by the board of directors of Intercos America, in the event of specific and significant
financial needs of the same Intercos America Inc., with the understanding that the last tranche will be
paid no later than one year from the date of August 1, 2016.
On August 17, 2016, the sales agreement was signed between CRB S.A. – as the seller – and the
company Solufonds S.A. – as the buyer (on behalf of Procimmo Swiss Commercial Fund 56) (the
“Buyer”) – for a building owned by CRB situated in ZI du Verney 1 in Puidoux, Canton of Vaud,
Switzerland (the “Building”). This Sales Agreement has effect from December 1, 2016 and the sales
price is CHF 6,200,000 (in addition to VAT of CHF 347,760).
On September 8, 2016 and September 12, 2016, respectively, Intercos S.p.A. and Intercos
Europe S.p.A. – in agreement with their respective Boards of Statutory Auditors – adopted a new
This Consolidated Full Year Financial Report has been translated into English solely for the convenience of the international reader. In case of discrepancies, the Italian language document is the sole authoritative and universally valid version.
44
Organizational, Management and Control Model pursuant to Legislative Decree 231/2001. On the same
date, the Ethics Code and the Code of Conduct were updated by the Group.
On October 21, 2016, Intercos S.p.A. formed a new company called Intercos Concept S.r.l., with
beginning share capital of €10,000 fully paid in by Intercos S.p.A. Intercos Concept is dedicated,
among other things, to the performance of services to companies, including commercial, marketing,
promotional, organizational, technical, consulting and other types of services, as it pertains to private
labels, and, therefore, directed to the development of brands for clients that operate in the retail
commercial sector of colored products for make-up, creams, personal-care products, nail polish,
perfume and cosmetic products in general, as well as like products, accessories or, in any case, products
that complement cosmetics.
On October 21, 2016, in order to render management of the company more efficient, the shareholders’
meeting of Intercos S.p.A. amended the bylaws to increase the possible number of members of the
Board of Directors from 5 to 7 and appointed new Board members: Paolo Valsecchi – who is already
COO of the Intercos Group and has power of attorney in the company with important powers in various
areas of corporate activities – and Renato Semerari.
In December 2016, the parent, as the sole shareholder of Intercos Concept S.r.l., made a payment
against share capital of €350,000 to Intercos Concept S.r.l., to be recognized in equity and recorded in
the Other reserves, subaccount Payment against share capital, bringing its investment to €360,000,
representing 100% of the company’s share capital.

This Consolidated Full Year Financial Report has been translated into English solely for the convenience of the international reader. In case of discrepancies, the Italian language document is the sole authoritative and universally valid version.
45
NOTES ON THE MAIN ITEMS OF THE CONSOLIDATED FINANCIAL STATEMENTS
7. Property, plant and equipment
Movements in Property, plant and equipment in 2016 are as follows:
December 31, 2016
(in € thousands) January 1,
2016 Increases / Depreciation
Translation differences /
Reclassifications.
Change in scope of consolidation
Decreases / Utilization
December 31, 2016
Historical cost
Land and buildings 133,004 4,148 2,053 (325) (6,416) 132,464
Plant and machinery 118,520 8,886 1,722 - (511) 128,618
Industrial equipment 34,569 2,100 (74) - (77) 36,519
Office furniture and equipment
13,865 981 206 (110) (323) 14,621
Motor vehicles and internal transportation equipment
2,301 49 (20) - (142) 2,188
Cell phones 21 - - - - 21
Assets under construction and payments on account
3,811 3,997 (2,708) (0) (239) 4,860
Total 306,091 20,161 1,179 (435) (7,708) 319,293
Accumulated depreciation
Land and buildings 68,632 5,952 178 - - 74,764
Plant and machinery 95,787 6,826 600 - (436) 102,777
Industrial equipment 31,587 1,490 (27) - (77) 32,974
Office furniture and equipment
9,906 699 208 (43) (794) 9,978
Motor vehicles and internal transportation equipment
1,905 200 (20) - (110) 1,974
Cell phones 20 - - - - 20
Assets under construction and payments on account
- - - - - -
Total 207,837 15,167 939 (43) (1,418) 222,486
Net carrying amount 98,254 4,993 240 (392) (6,290) 96,806
Overall capital expenditures during the year amount to €20,161 thousand
Expenditures of €1,133 thousand relate to the purchase of machinery and equipment by Intercos America, in
order to increase productivity and productive capacity of the filling and pencil departments, and €1,636
thousand to the Intercos do Brasil production facility, of which €1,574 thousand was for machinery and
equipment.
The increases in Plant and machinery and Industrial equipment refer to capital expenditures of €8,886 thousand
and €2,100 thousand, respectively. More specifically, new machinery purchases refer to Intercos Europe S.p.A
(€4,171 thousand), Intercos Technology Ltd (€485 thousand) and Intercos America Inc. (€1,333 thousand) while

This Consolidated Full Year Financial Report has been translated into English solely for the convenience of the international reader. In case of discrepancies, the Italian language document is the sole authoritative and universally valid version.
46
new industrial equipment expenditures include €1,598 thousand by Intercos Europe S.p.A. and €203 thousand
by the Chinese companies.
Land and buildings include mainly capital expenditures by the Chinese companies of €3,481 thousand for the
completion of the new production facility in China.
8. Intangible assets
Movements in Intangible assets in 2016 are as follows:
(in € thousands) January 1,
2016 Increases
Decreases/ Adjustments/ Translation differences
Reclassifications Amortization December 31,
2016
Development costs 10,468 3,694 31 5,809 (4,577) 15,425 Patent and software rights 3,356 1,525 0 741 (1,512) 4,111 Concessions and licenses 1,220 670 (4) 575 (298) 2,163 Assets under development 6,131 2,701 0 (6,131) 0 2,701 Other intangible assets 900 104 0 (886) (8) 111
TOTAL 22,075 8,695 27 108 (6,395) 24,509
The increase in Assets under development of €2,701 thousand is mainly composed of costs on the uncompleted
R&D projects of Intercos S.p.A. The projects refer for the most part to:
(i) €490 thousand for the “Sharpenable Pencils” project begun in June 2016. The objective is to research new,
eco-compatible and sustainable raw materials capable of characterizing new patentable formulae for a new
pencil in plastic;
(ii) €529 thousand for the “Nail Polish” project begun in the second quarter of 2016. The objective is to create
and manufacture new nail polish materials capable of making nail polishes last longer than those traditionally
found on the market;
(iii) €682 thousand for the “Diplaticoni” project begun towards the end of the second quarter of 2016. The
objective is to obtain a family of new eco-sustainable cosmetic raw materials, owned by Intercos and not
otherwise available on the market, that can take different physical forms and thus can be used in all product
categories;
(iv) €487 thousand for the “PLA” project begun during the year. The objective is to develop biodegradable
polymers;
(v) €126 thousand for the “Silicone ogive”, project. The objective is to identify a new silicone to develop
suitable ogives for the manufacture of lipsticks that perform better than those currently in use;
(vi) €113 thousand for the “Patch” project. The objective is to develop a cosmetic patch, with a multilayer
structure similar to that of transdermal patches with a decorative and/or corrective function for the eye area;

This Consolidated Full Year Financial Report has been translated into English solely for the convenience of the international reader. In case of discrepancies, the Italian language document is the sole authoritative and universally valid version.
47
(vii) €273 thousand for the “CMR” project begun during the year. The objective is to develop ceramic
materials.
For capitalized projects, management carefully assesses their expected economic benefits and those obtained
over the course of their useful life, testing for any onset of impairment.
Additional details on R&D are discussed in the Directors’ Report on Operations under profit and financial
performance and factors affecting operating performance in 2016.
9. Goodwill
Movements in Goodwill are as follows:
(in € thousands) January 1, 2016 Increases Translation differences December 31, 2016
Goodwill 76,677 - 89 76,765
For purposes of the impairment test, the CGUs (Cash Generating Units) identified by management at December
31, 2016 are the same as those in the prior year and are represented by:
Make-up CGU: specialized in the creation, development, manufacture, distribution and marketing of powders,
emulsions, lipsticks and types of cosmetics using delivery systems in the form of pens/pencils for the face, eyes
and lips. This CGU is represented by almost all the companies of the Group except CRB S.A. and partially by
Intercos America Inc. and Intercos Technology Co Ltd.
Skin Care CGU: introduced in 2006 following the decision to diversify the Intercos Group’s business through
the acquisition of the Swiss company CRB S.A., specialized in the manufacture and marketing of cosmetic and
skin care creams. This CGU is represented by the company CRB S.A. and partially by Intercos Europe S.p.A.,
Intercos America Inc. and Intercos Technology Co Ltd.
Goodwill at December 31, 2016 is allocated as follows: €60.2 million to the Make-up CGU and €16.7 million to
the Skin Care CGU.
Goodwill increased in total by €89 thousand as a result of the translation to Euro of the goodwill expressed in
local currency.
The recoverable amount of the CGUs to which goodwill is allocated is defined using the value in use.
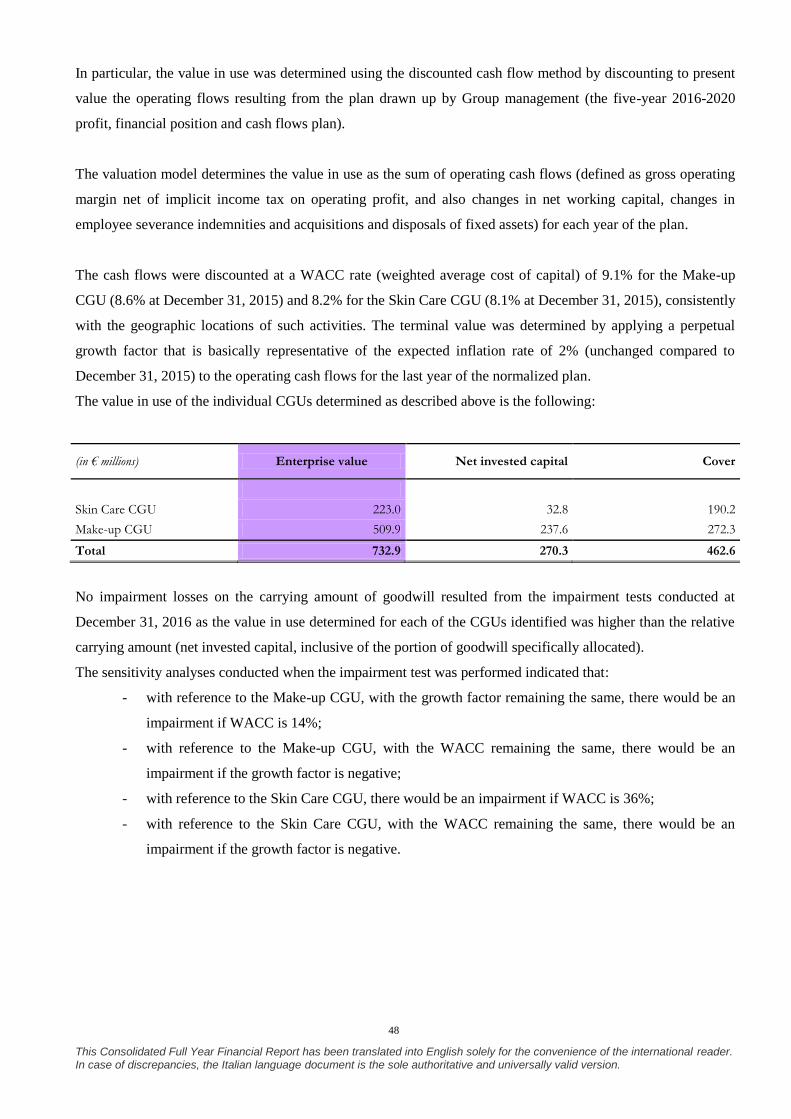
This Consolidated Full Year Financial Report has been translated into English solely for the convenience of the international reader. In case of discrepancies, the Italian language document is the sole authoritative and universally valid version.
48
In particular, the value in use was determined using the discounted cash flow method by discounting to present
value the operating flows resulting from the plan drawn up by Group management (the five-year 2016-2020
profit, financial position and cash flows plan).
The valuation model determines the value in use as the sum of operating cash flows (defined as gross operating
margin net of implicit income tax on operating profit, and also changes in net working capital, changes in
employee severance indemnities and acquisitions and disposals of fixed assets) for each year of the plan.
The cash flows were discounted at a WACC rate (weighted average cost of capital) of 9.1% for the Make-up
CGU (8.6% at December 31, 2015) and 8.2% for the Skin Care CGU (8.1% at December 31, 2015), consistently
with the geographic locations of such activities. The terminal value was determined by applying a perpetual
growth factor that is basically representative of the expected inflation rate of 2% (unchanged compared to
December 31, 2015) to the operating cash flows for the last year of the normalized plan.
The value in use of the individual CGUs determined as described above is the following:
(in € millions) Enterprise value Net invested capital Cover
Skin Care CGU 223.0 32.8 190.2
Make-up CGU 509.9 237.6 272.3
Total 732.9 270.3 462.6
No impairment losses on the carrying amount of goodwill resulted from the impairment tests conducted at
December 31, 2016 as the value in use determined for each of the CGUs identified was higher than the relative
carrying amount (net invested capital, inclusive of the portion of goodwill specifically allocated).
The sensitivity analyses conducted when the impairment test was performed indicated that:
- with reference to the Make-up CGU, with the growth factor remaining the same, there would be an
impairment if WACC is 14%;
- with reference to the Make-up CGU, with the WACC remaining the same, there would be an
impairment if the growth factor is negative;
- with reference to the Skin Care CGU, there would be an impairment if WACC is 36%;
- with reference to the Skin Care CGU, with the WACC remaining the same, there would be an
impairment if the growth factor is negative.

This Consolidated Full Year Financial Report has been translated into English solely for the convenience of the international reader. In case of discrepancies, the Italian language document is the sole authoritative and universally valid version.
49
10. Deferred tax assets
Deferred tax assets amount to €16,768 thousand at December 31, 2016 and are mainly composed of the
following:
(in € thousands) December 31, 2016 December 31, 2015
Provision for inventory obsolescence 5,043 6,412
Differences from exchange adjustments 1,442 1,053
Fees and interest, royalties deductible on a cash basis and not paid 2,406 3,206
Provision for impairment of receivables 33 63
Provisions 60 79
Loss carryforwards 4,185 2,119
Temporary differences on PPE revaluations 891 1,820
Temporary differences due to foreign tax laws 1,955 1,338
Differences on employee severance indemnities revaluation 45 21
Other minor differences (maintenance, hospitality expenses etc.) 708 492
Total 16,768 16,603
The increase at December 31, 2016 is largely due to higher deferred tax assets for “losses carried forward”
referring to the subsidiary Intercos America Inc., partially offset by lower deferred taxes for the “provision for
obsolete inventories” and for “compensation, interest and royalties deductible on a cash basis and not paid” also
attributable to the subsidiary Intercos America Inc.
11. Other non-current assets
Other non-current assets are detailed as follows:
(in € thousands) December 31, 2016 December 31, 2015
VAT receivables 5,302 5,017 Interest on VAT receivables 223 509 Security deposits 809 704 Other receivables 907 -
Total 7,241 6,229
Other receivables in other non-current assets include the receivable to be collected on the sale in 2013 of the
investment in the Malaysian company, Intercos Asia Pacific. According to the underlying contractual
agreements, the above receivable will be collected after 2017 and, more precisely, the plan calls for extinction in
July 2019. This receivable is for USD 956 thousand or an equivalent amount of €907 thousand which includes
the exchange adjust of €191 thousand.
VAT receivables, for which refunds have been filed, are unchanged compared to the prior year and are
classified as non-current since they are not expected to be settled within 12 months.

This Consolidated Full Year Financial Report has been translated into English solely for the convenience of the international reader. In case of discrepancies, the Italian language document is the sole authoritative and universally valid version.
50
12. Inventories
Details of Inventories are as follows:
(in € thousands) December 31, 2016 December 31, 2015
Raw materials, packaging and consumables 41,211 33,115
Semifinished products 31,086 25,524
Finished products and merchandise 10,999 11,245
Total 83,296 69,884
Inventories increased in 2016 by €13,412 thousand (+19.2%).
The balance is net of the provision for inventory writedowns, which shows the following movements during the
year ended December 31, 2016 and a 9% decrease in the accrual for the year:
(in € thousands) December 31, 2016 December 31, 2015
Beginning balance 21,415 20,885
Accrual 9,035 9,939
Utilization (11,246) (9,409)
Ending balance 19,203 21,415
The Intercos Group adopts a uniform method for the measurement of its obsolete inventories. Under this
approach all materials that have had no movement for more than 12 months are written down 100%, given that
at the end of such period the semifinished and finished product have only a limited possibility of being reused
for either marketing and/or production.
Movements show that the utilization during the year was significant on account of the destruction of products
principally by Intercos Europe and Intercos America.

This Consolidated Full Year Financial Report has been translated into English solely for the convenience of the international reader. In case of discrepancies, the Italian language document is the sole authoritative and universally valid version.
51
13. Trade receivables
Details of Trade receivables are as follows:
(in € thousands) December 31, 2016 December 31, 2015
Receivables from third parties 93,168 74,047
Provision for impairment of receivables (334) (422)
Total 92,834 73,626
Net trade receivables at December 31, 2016 show an increase of €19,208 thousand compared to the prior year,
mainly due to the higher sales during the year.
Movements in the provision for impairment of receivables during 2016 are as follows:
(in € thousands) December 31, 2016 December 31, 2015
Beginning balance 422 1,148
Accrual 61 830
Utilization (149) (1,556)
Ending balance 334 422
The balance of trade receivables is shown net of the provision for the impairment of receivables. This provision
is calculated in an analytical manner, dividing the receivables by class according to the level of risk and
applying a percentage of loss to each class on the basis of historical experience.
The fair value measurement of trade receivables and other receivables did not generate significant effects as
compared with the carrying amounts.
14. Other current assets
Details of other current assets are as follows:
(in € thousands) December 31, 2016 December 31, 2015
Receivables from the tax authorities 7,185 9,221
Sundry receivables 498 1,770
Advances to suppliers 1,065 1,785
Accrued income and prepaid expenses 553 1,727
Total 9,301 14,503
Other current assets decreased by €5,202 thousand mainly due to the reduction in Receivables from the tax
authorities of €2,033 thousand, of which €1,018 thousand is due to the reduction in VAT receivables of the
subsidiaries Intercos S.p.A. and Intercos Europe S.p.A., respectively, for €924 thousand and €94 thousand.

This Consolidated Full Year Financial Report has been translated into English solely for the convenience of the international reader. In case of discrepancies, the Italian language document is the sole authoritative and universally valid version.
52
Sundry receivables decreased by €1,272 thousand as a result of the reclassification to non-current assets of the
receivable on the sale of the investment in Intercos Asia Pacific. Additional details are provided in the Note on
Other non-current assets.
15. Cash and cash equivalents
Cash and cash equivalents increased by €13,842 thousand, from €50,683 thousand at year-end 2015 to €64,525
thousand at December 31, 2016.
The change in cash and cash equivalents in presented in the statement of cash flows.
(in € thousands) December 31, 2016 December 31, 2015
Bank and postal deposits 61,923 49,217
Cash on hand 2,602 1,466
Total 64,525 50,683
16. Equity
Share capital
Share capital at December 31, 2016 is unchanged compared to December 31, 2015, amounts to €10,710,193 and
is represented by 91,319,870 no par value ordinary shares divided as follows:
At December 31, 2016 At December 31, 2015 At December 31, 2014
Class A shares - number 51,624,356 51,624,356 51,624,356 Class B shares - number 39,267,544 39,267,544 39,267,544 Class C shares - number 427,970 427,970 427,970
Total share capital in euros
10,710,193
10,710,193
10,710,193
Class A, Class B and Class C shares all have the same rights and can be transferred by acts between living
persons and by succession due to death, with effect on Intercos S.p.A. pursuant to law, without prejudice to
article 5 of the bylaws.
Subject to the provisions of art. 2428 of the Italian Civil Code, note should be taken that the Group neither holds
nor has purchased or sold shares of the parent during the course of the year under examination, not even through
fiduciaries or trustees.
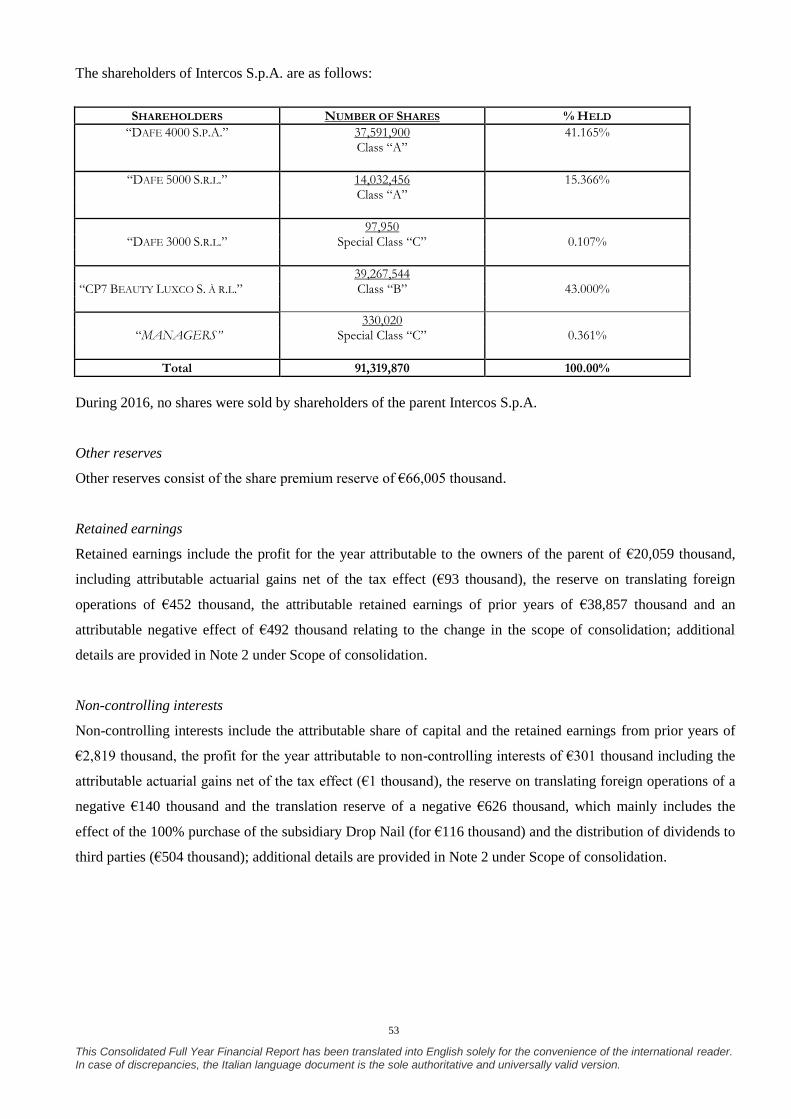
This Consolidated Full Year Financial Report has been translated into English solely for the convenience of the international reader. In case of discrepancies, the Italian language document is the sole authoritative and universally valid version.
53
The shareholders of Intercos S.p.A. are as follows:
SHAREHOLDERS NUMBER OF SHARES % HELD
“DAFE 4000 S.P.A.” 37,591,900 41.165% Class “A”
“DAFE 5000 S.R.L.” 14,032,456 15.366% Class “A”
97,950 “DAFE 3000 S.R.L.” Special Class “C” 0.107%
39,267,544 “CP7 BEAUTY LUXCO S. À R.L.” Class “B” 43.000%
330,020 “MANAGERS” Special Class “C” 0.361%
Total 91,319,870 100.00%
During 2016, no shares were sold by shareholders of the parent Intercos S.p.A.
Other reserves
Other reserves consist of the share premium reserve of €66,005 thousand.
Retained earnings
Retained earnings include the profit for the year attributable to the owners of the parent of €20,059 thousand,
including attributable actuarial gains net of the tax effect (€93 thousand), the reserve on translating foreign
operations of €452 thousand, the attributable retained earnings of prior years of €38,857 thousand and an
attributable negative effect of €492 thousand relating to the change in the scope of consolidation; additional
details are provided in Note 2 under Scope of consolidation.
Non-controlling interests
Non-controlling interests include the attributable share of capital and the retained earnings from prior years of
€2,819 thousand, the profit for the year attributable to non-controlling interests of €301 thousand including the
attributable actuarial gains net of the tax effect (€1 thousand), the reserve on translating foreign operations of a
negative €140 thousand and the translation reserve of a negative €626 thousand, which mainly includes the
effect of the 100% purchase of the subsidiary Drop Nail (for €116 thousand) and the distribution of dividends to
third parties (€504 thousand); additional details are provided in Note 2 under Scope of consolidation.
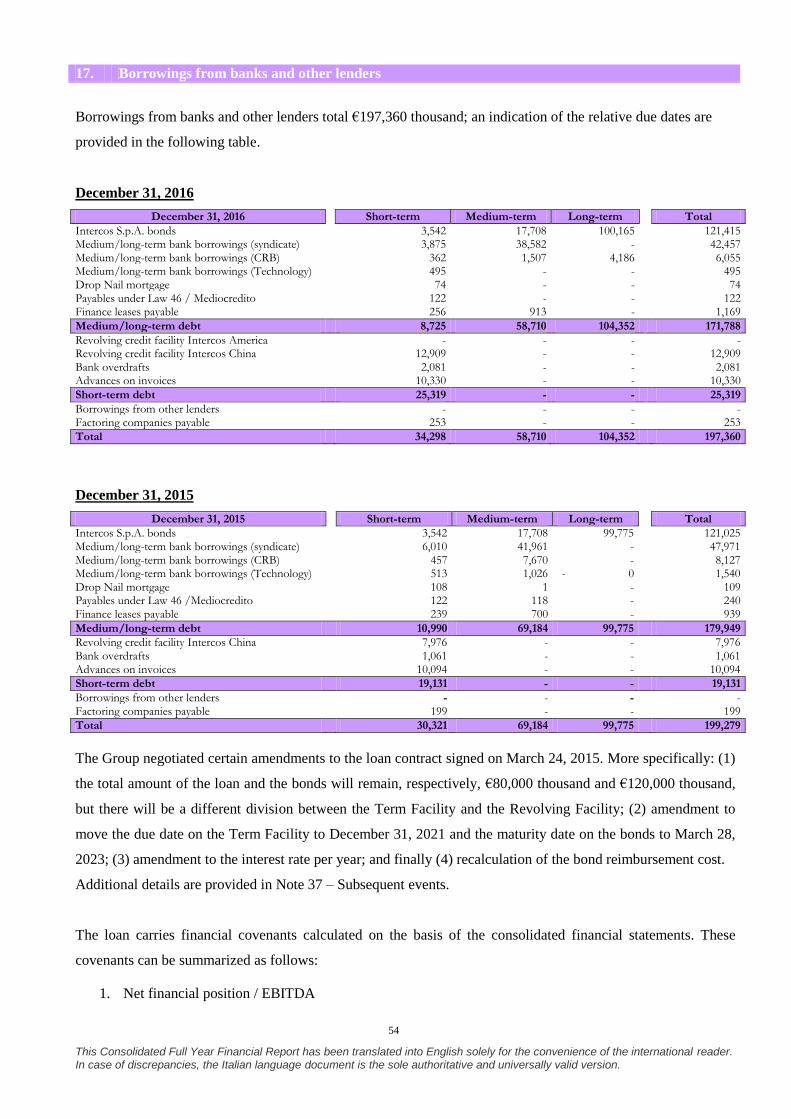
This Consolidated Full Year Financial Report has been translated into English solely for the convenience of the international reader. In case of discrepancies, the Italian language document is the sole authoritative and universally valid version.
54
17. Borrowings from banks and other lenders
Borrowings from banks and other lenders total €197,360 thousand; an indication of the relative due dates are
provided in the following table.
December 31, 2016
December 31, 2016
Short-term Medium-term Long-term
Total
Intercos S.p.A. bonds
3,542 17,708 100,165 121,415 Medium/long-term bank borrowings (syndicate)
3,875 38,582 - 42,457
Medium/long-term bank borrowings (CRB)
362 1,507 4,186 6,055 Medium/long-term bank borrowings (Technology)
495 - - 495
Drop Nail mortgage
74 - - 74 Payables under Law 46 / Mediocredito
122 - - 122
Finance leases payable
256 913 - 1,169
Medium/long-term debt
8,725 58,710 104,352 171,788
Revolving credit facility Intercos America
- - - - Revolving credit facility Intercos China
12,909 - - 12,909
Bank overdrafts
2,081 - - 2,081 Advances on invoices
10,330 - - 10,330
Short-term debt
25,319 - - 25,319
Borrowings from other lenders
- - - - Factoring companies payable
253 - - 253
Total
34,298 58,710 104,352 197,360
December 31, 2015
December 31, 2015
Short-term Medium-term Long-term
Total
Intercos S.p.A. bonds
3,542 17,708 99,775
121,025 Medium/long-term bank borrowings (syndicate)
6,010 41,961 -
47,971
Medium/long-term bank borrowings (CRB)
457 7,670 -
8,127 Medium/long-term bank borrowings (Technology)
513 1,026 - 0
1,540
Drop Nail mortgage
108 1 -
109 Payables under Law 46 /Mediocredito
122 118 -
240
Finance leases payable
239 700 -
939
Medium/long-term debt
10,990 69,184 99,775
179,949
Revolving credit facility Intercos China
7,976 - -
7,976 Bank overdrafts
1,061 - -
1,061
Advances on invoices
10,094 - -
10,094
Short-term debt
19,131 - -
19,131
Borrowings from other lenders
- - -
- Factoring companies payable
199 - -
199
Total
30,321 69,184 99,775
199,279
The Group negotiated certain amendments to the loan contract signed on March 24, 2015. More specifically: (1)
the total amount of the loan and the bonds will remain, respectively, €80,000 thousand and €120,000 thousand,
but there will be a different division between the Term Facility and the Revolving Facility; (2) amendment to
move the due date on the Term Facility to December 31, 2021 and the maturity date on the bonds to March 28,
2023; (3) amendment to the interest rate per year; and finally (4) recalculation of the bond reimbursement cost.
Additional details are provided in Note 37 – Subsequent events.
The loan carries financial covenants calculated on the basis of the consolidated financial statements. These
covenants can be summarized as follows:
1. Net financial position / EBITDA
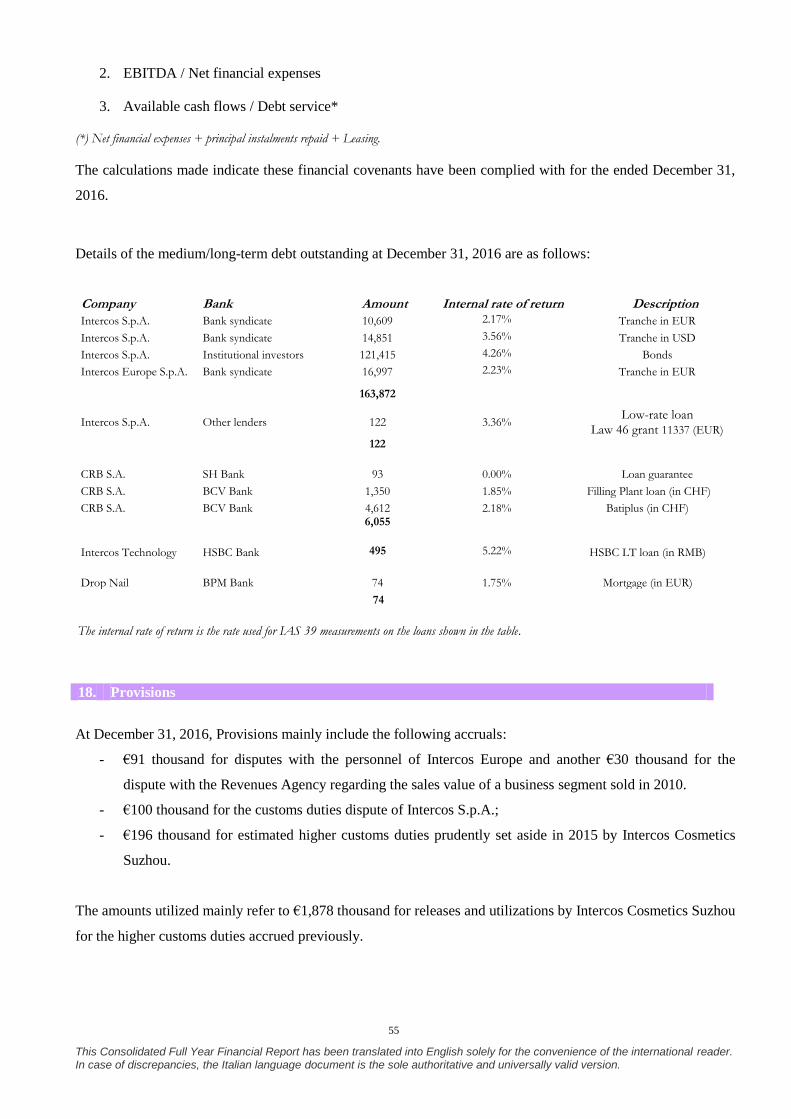
This Consolidated Full Year Financial Report has been translated into English solely for the convenience of the international reader. In case of discrepancies, the Italian language document is the sole authoritative and universally valid version.
55
2. EBITDA / Net financial expenses
3. Available cash flows / Debt service*
(*) Net financial expenses + principal instalments repaid + Leasing.
The calculations made indicate these financial covenants have been complied with for the ended December 31,
2016.
Details of the medium/long-term debt outstanding at December 31, 2016 are as follows:
Company
Bank Amount Internal rate of return
Description
Intercos S.p.A. Bank syndicate 10,609 2.17% Tranche in EUR
Intercos S.p.A. Bank syndicate 14,851 3.56% Tranche in USD
Intercos S.p.A. Institutional investors 121,415 4.26% Bonds
Intercos Europe S.p.A. Bank syndicate 16,997 2.23% Tranche in EUR
163,872
Intercos S.p.A. Other lenders 122 3.36% Low-rate loan
Law 46 grant 11337 (EUR)
122
CRB S.A. SH Bank 93 0.00% Loan guarantee
CRB S.A. BCV Bank 1,350 1.85% Filling Plant loan (in CHF)
CRB S.A. BCV Bank 4,612 2.18% Batiplus (in CHF)
6,055
Intercos Technology HSBC Bank 495 5.22% HSBC LT loan (in RMB)
Drop Nail BPM Bank 74 1.75% Mortgage (in EUR)
74
The internal rate of return is the rate used for IAS 39 measurements on the loans shown in the table.
18. Provisions
At December 31, 2016, Provisions mainly include the following accruals:
- €91 thousand for disputes with the personnel of Intercos Europe and another €30 thousand for the
dispute with the Revenues Agency regarding the sales value of a business segment sold in 2010.
- €100 thousand for the customs duties dispute of Intercos S.p.A.;
- €196 thousand for estimated higher customs duties prudently set aside in 2015 by Intercos Cosmetics
Suzhou.
The amounts utilized mainly refer to €1,878 thousand for releases and utilizations by Intercos Cosmetics Suzhou
for the higher customs duties accrued previously.

This Consolidated Full Year Financial Report has been translated into English solely for the convenience of the international reader. In case of discrepancies, the Italian language document is the sole authoritative and universally valid version.
56
Movements during the year in Provisions are as follows:
(in € thousands) December 31, 2016 December 31, 2015
Beginning balance 2,777 4,313
Accrual 422 604
Utilization (2,120) (2,139)
Ending balance 1,079 2,777
19. Deferred tax liabilities
Deferred tax liabilities amount to €8,459 thousand at December 31, 2016.
For a better understanding, a description of the temporary differences on which deferred taxes have been
calculated is presented in the following table:
(in € thousands) December 31, 2016 December 31, 2015
Land and buildings revaluation IAS 16 4,353 4,822
Exchange gains 1,773 1,673
Tax differences on PPE (elimination of tax effect/revaluations by law) 838 918
Consolidation adjustments on inventories 538 518
Consolidation adjustments on PPE (revaluations) 122 122
Differences on employee severance indemnities measurement IAS 19 29 134
Difference on fin. instruments measurement IAS 39 (effective interest) 18 18
Other minor differences 788 874
Total 8,459 9,079
20. Employee benefit obligations
Movements during the year in Employee benefit obligations are as follows:
(in € thousands) December 31, 2016 December 31, 2015
Beginning balance 8,379 9,245
Service Cost 621 493
Utilizations (540) (1,091)
Interest cost 122 127
Actuarial gains (losses) 39 (396)
Total 8,621 8,379

This Consolidated Full Year Financial Report has been translated into English solely for the convenience of the international reader. In case of discrepancies, the Italian language document is the sole authoritative and universally valid version.
57
The following table presents the main assumptions used in determining the actuarial value of Employee benefit
obligations at December 31, 2016 and 2015.
Italian subsidiaries of the Intercos Group December 31, 2016 December 31, 2015
Discount rate 1.62% 2.30%
Annual inflation rate 1.50% 2.00%
Annual rate of increase in salaries 2.625% 3.00%
Annual rate of increase in employee severance indemnities 1.50% 1.50%
CRB S.A. December 31, 2016 December 31, 2015
Discount rate 0.75% 0.90%
Annual inflation rate 1.00% 1.00%
Annual rate of increase in salaries 1.00% 1.00%
Annual rate of increase in employee severance indemnities 1.00% 1.00%
Group headcount December 31, 2016 December 31, 2015
Executive and mid-level managers 242 221
White-collars 946 866
Blue-collars 1,559 1,322
Total 2,747 2,409
Temporary 1,844 1,413
Total 4,591 3,822
The breakdown by permanent and fixed-term personnel is the following:
Group headcount December 31, 2016 December 31, 2015
Permanent 2,727 2,395
Fixed-term 20 14
Total 2,747 2,409
During the year, there were no deaths or accidents in the workplace which caused serious injury to personnel.

This Consolidated Full Year Financial Report has been translated into English solely for the convenience of the international reader. In case of discrepancies, the Italian language document is the sole authoritative and universally valid version.
58
21. Trade payables
Trade payables at December 31, 2016 and December 31, 2015 total, respectively, €89,846 thousand and
€69,456 thousand, with an increase of €20,391 thousand.
Trade payables refer to trading transactions with suppliers in the ordinary course of manufacturing and
investment activities. All trade payables are due within 12 months.
The fair value measurement of trade payables and other payables did not produce significant effects as
compared with the carrying amounts in view of the short period of time between the date the liability arises and
its due date.
22. Other current liabilities
Details of Other current liabilities are as follows:
(in € thousands) December 31, 2016 December 31, 2015
Payables to employees 12,296 11,142
Social security agencies payable 1,567 1,104
Tax authorities payable 12,053 1,932
Advances from customers 4,543 3,778
Accrued liabilities 55 77
Sundry payables 2,743 3,797
Derivatives (liabilities) 447 586
Total 33,704 22,415
Tax authorities payable refers to payables for IRPEF withholding taxes on employee compensation and
withholding taxes on self-employed compensation and VAT payable.
Social security agencies payable refers to social security costs on December compensation to employees, paid in
January.
Payables to employees refer to vacation pay accrued and not taken, bonuses payable and December payroll paid
in January.
Tax authorities payable include €7,039 thousand for IRES taxes payable for the year on the tax consolidation
referring to the parent, €578 thousand for IRAP taxes payable of the subsidiary Intercos Europe and €1,441
thousand for taxes payable of the subsidiary Intercos do Brasil
As for derivatives (liabilities) at December 31, 2016, there are foreign currency swaps of USD 17.5 million,
expiring by contract in the first half of 2017. The fair value at the balance sheet date is €447 thousand.
Additional details are given in Note 3 - Risk Management, under Derivatives.

This Consolidated Full Year Financial Report has been translated into English solely for the convenience of the international reader. In case of discrepancies, the Italian language document is the sole authoritative and universally valid version.
59
Guarantees and other commitments
Guarantees provided refer to sureties and guarantees provided by the parent Intercos S.p.A., on its behalf
(€16,365 thousand at December 31, 2016) and on behalf of subsidiaries (€5,630 thousand at December 31,
2016).
On behalf of the parent Intercos S.p.A.
The following pledges and guarantees were provided to guarantee the March 24, 2015 bank loan:
1) in favor of Banca IMI, the following pledge and lien as collateral were provided on the loan secured and in
compliance with the requirements of the ABI Code:
pledge on Intercos Europe S.p.A. shares for €3,000 thousand.
pledge on Intercos Class C shares provided by Dafe 3000 S.r.l. (97,950 shares) for €11 thousand to
guarantee the pool loan.
pledge on Intercos Class A shares provided by Dafe S.r.l. (37,591,900 shares) and by Dafe 5000 S.r.l.
(14,032,456 shares) for a total amount of €6,055 thousand.
Among the most important guarantees provided to third parties at December 31, 2016 are the following:
guarantee provided on behalf of the company Madina S.r.l. for an amount €2,000 thousand to guarantee
the transaction for the sale of the business segment put it place in 2012 by the subsidiary Marketing
Project S.r.l. in liquidation;
guarantee in favor of the Revenues Agency to guarantee the VAT receivable for the 2009 refund
request of €2,785 thousand, expiring on February 3, 2018;
guarantee in favor of the Revenues Agency to guarantee the VAT receivable for the 2010 refund
request of €1,513 thousand, expiring on November 30, 2018;
guarantee given in April 2014 through a surety policy provided by HSBC Brazil in favor of the
company owner of the building where Intercos do Brasil has its manufacturing activities for BRL 800
thousand, corresponding to €233 thousand;
guarantee of the Long Term Credit Facility provided by HSBC on behalf of Intercos Technology for
USD 2,500 thousand, corresponding to €2,372 thousand;
guarantee of the Long Term Credit Facility provided by BCV S.A. on behalf of CRB SA for CHF
6,920 thousand, corresponding to €6,444 thousand;
guarantee of the Revolving Credit Facility provided by Shanghai Pudong Development Bank on behalf
of Intercos Suzhou for RMB 50,600 thousand, corresponding to €6,912 thousand;
guarantee on the lease contract of Intercos America Inc. for the commercial office in New York City at
37th West 57th Street for USD 1,789 thousand, corresponding to €1,697 thousand;

This Consolidated Full Year Financial Report has been translated into English solely for the convenience of the international reader. In case of discrepancies, the Italian language document is the sole authoritative and universally valid version.
60
guarantee in the interests of Intercos America Inc. for the bank facility in favor of Intesa BCI for USD
1,400 thousand, corresponding to €1,328 thousand.
23. Revenues
(in € thousands) 2016 2015
Revenues from sales and services 448,690 401,767
The increase in revenues is €46,923 thousand (+11.7%).
The analysis of the geographical regions in 2016 compared to 2015 shows a positive trend in the EMEA region.
Additional information is provided in Note 5 – Segment Reporting, and in the Report on Operations.
24. Cost of sales
Cost of sales in 2016 totals €342,446 thousand.
The composition is as follows:
(in € thousands) 2016 2015
Labor cost 94,399 86,093
Raw materials, consumables and merchandise 164,646 139,986
Outside work 30,354 25,819
Shipping 15,184 14,808
Depreciation 11,072 11,444
Utilities 5,786 6,164
Maintenance 8,094 7,435
Other cost of sales 12,911 11,103
Total 342,446 302,852
The change from 2015 is €39,594 thousand.

This Consolidated Full Year Financial Report has been translated into English solely for the convenience of the international reader. In case of discrepancies, the Italian language document is the sole authoritative and universally valid version.
61
25. Research &Development and innovation costs
Research & Development and innovation costs amount to €26,052 thousand in 2016.
The composition is as follows:
(in € thousands) 2016 2015
Labor cost 16,765 16,246
Raw materials, consumables and merchandise 1,004 1,455
Consulting 1,736 1,624
Travel 1,954 1,802
Depreciation and amortization 7,500 7,098
Utilities 518 513
Capitalized internal construction costs (5,685) (5,235)
Other general expenses 2,261 1,745
Total 26,052 25,248
The change compared to 2015 is €804 thousand.
26. Selling expenses
In 2016, selling expenses amount to €20,579 thousand.
The composition is as follows:
(in € thousands) 2016 2015
Labor costs 12,967 11,058
Commercial expenses 1,317 1,064
Shipping 643 610
Consulting 653 778
Depreciation 353 350
Utilities 865 870
Losses on receivables 42 703
Other general expenses 3,738 3,512
Total 20,579 18,944
The change from 2015 is €1,635 thousand.

This Consolidated Full Year Financial Report has been translated into English solely for the convenience of the international reader. In case of discrepancies, the Italian language document is the sole authoritative and universally valid version.
62
27. General and administrative expenses
General and administrative expenses in 2016 amount to €22,939 thousand.
The composition is as follows
(in € thousands) 2016 2015
Labor costs 9,114 8,329
Computer system services 2,171 2,020
Employee training and selection 1,682 653
Consulting 3,211 2,817
Depreciation 2,637 2,233
Utilities 685 659
Rent 393 351
Other general expenses 3,046 2,917
Total 22,939 19,978
The change from the prior year is €2,961 thousand.
28. Nonrecurring income (expenses)
In 2016, net nonrecurring income was recorded for €638 thousand. It includes: €256 thousand of income from
the sale of a building owned by the subsidiary CRB S.A.; €360 thousand of net nonrecurring income by the
Asian subsidiaries mainly due to the release of the provision for risks set aside previously for higher customs
duties not due and extra costs incurred to complete the project to create a second Intercos Group headquarters
run by the subholding company Intercos Asia Pacific Limited; €522 thousand of net nonrecurring income
referring to Intercos S.p.A. owing to the amicable settlement of a dispute with a third party over trade secret
misappropriations; €305 thousand of expenses by the subsidiary Intercos Europe S.p.A. for employee social
security contributions that arose on the completion of the question regarding the closing of the Limbiate factory;
€196 thousand of expenses by the subsidiary Drop Nail S.r.l. incurred for the realization of the industrial project
to strengthen its product range represented by nail polishes and nail care projects.

This Consolidated Full Year Financial Report has been translated into English solely for the convenience of the international reader. In case of discrepancies, the Italian language document is the sole authoritative and universally valid version.
63
29. Financial income (expenses)
Financial income (expenses), net, shows an expense balance of €9,812 thousand in 2016. Details are as follows:
(in € thousands) 2016 2015
Bank interest income (71) (38)
Other financial income (83) (24)
Total financial income (154) (62)
Interest on short-term borrowings 1,320 1,582
Interest on medium/long-term borrowings 5,722 6,536
Fair value adjustments (138) 586
Interest discounted under IAS 19 application 121 127
Interest under IAS 23 application (200) (183)
Interest under IAS 39 application 551 4,353
Interest on leases under IAS 17 application 65 62
Bank charges 645 566
Total financial expenses 8,086 13,628
Foreign exchange gains (7,768) (9,923)
Foreign exchange losses 9,648 8,945
Net foreign exchange 1,880 (978)
Total 9,812 12,588
Interest under IAS 39 application decreased by €3,802 thousand because the costs for the restructuring of
medium- and long-term debt had been recorded in 2015.
30. Result from investments
The share of the profit (loss) of investments accounted for using the equity method is as follows:
(in € thousands) 2016 2015
Shinsegae Intercos Korea Inc. (978) -
Hana Co.Ltd. 263 106
Total 715 106
Additional information is provided in Note 2 – Significant accounting policies under Scope of consolidation.

This Consolidated Full Year Financial Report has been translated into English solely for the convenience of the international reader. In case of discrepancies, the Italian language document is the sole authoritative and universally valid version.
64
31. Income taxes
Details of income taxes are as follows:
(in € thousands) 2016 2015
Current income taxes 13,022 5,842
Deferred income taxes (786) 4,255
Prior years’ taxes (268) (86)
Total 11,968 10,011
The tax charge in 2016 is €11,968 thousand and is composed of €13,022 thousand of current income taxes and
€786 thousand of deferred taxes.
The Group utilized tax losses carryforwards in 2016 for a total of €7,440 thousand.
For current income taxes, the tax charge is based on the taxable income arising from the profit for the year and
taking into account the use of any tax loss carryforwards and applying the nominal tax rate in effect in each
country.
Current income taxes include the tax charge for IRAP taxes in 2016 of €2,123 thousand and the IRES credit of
€9,791 thousand mainly in reference to the parent and the subsidiary Intercos Europe S.p.A.
The reconciliation between the tax charge recognized in 2016 in the consolidated financial statements and the
theoretical tax charge based on the theoretical tax rate in Italy is as follows:
2016
(in € thousands) Amount Rate
Pre-tax profit 31,599
Theoretical tax charge 8,690 27.50%
IRAP 2,142 6.78%
Effect of changes in permanent tax difference in Italy 950 3.02%
Effect of decreases in permanent tax differences in Italy (460) -1.45%
Effect of tax differences at foreign companies 1,751 5.54%
Effect of different tax rates at foreign companies (1,377) -4.36%
Prior years’ taxes 268 0.85%
Tax charge in income statement 11,968 37.87%

This Consolidated Full Year Financial Report has been translated into English solely for the convenience of the international reader. In case of discrepancies, the Italian language document is the sole authoritative and universally valid version.
65
32. Related party transactions
Related party transactions do not qualify as either atypical or unusual but fall under the ordinary course of the
business operations of the Group companies. Such transactions, when not concluded at standard conditions or
dictated by specific laws, are nevertheless carried out on an arm’s length basis.
The effects of related party transactions including joint ventures, on the consolidated income statement for 2016
and the consolidated statement of financial position at December 31, 2016 are as follows:
(in € thousands)
Cost for services and leases and
rent
Employee benefit
expenses
Other costs and revenues
Financial expenses
Financial income
Trade receivables
Trade payables
Financial payables
Intercos Korea LTD (478) - - - 1 274 419 -
Hana Co Ltd (7) - - - - - 0 -
Total (484) - - - 1 274 420 -
The persons identified as key executives are mainly the directors of the various companies of the Group. Their
compensation is disclosed in the following Note 34.
(in € thousands)
Cost for services and
leases and rent
Employee benefit
expenses
Other costs and revenues
Financial expenses
Financial income
Trade receivables
Trade payables
Financial payables
Dafe International S.r.l. (146) - - - - - 33 -
Sci Maragia (46) - - - - - 62 -
Je m'en fous - - - - - - 22 -
Arterra Bioscience S.r.l. (336) - (0) (4) - - 497 -
My Style - (7) - - - - - -
Interior (3) (0) (31) - - - 29 -
Catterton (659) - (9) - - - 20 -
Vault - - - - - - - -
Maragia USA Inc. (28) - - - - - 28 -
Family and relatives of Dario Ferrari
(166)
Total (1,218) (173) (40) (4) - - 691 -

This Consolidated Full Year Financial Report has been translated into English solely for the convenience of the international reader. In case of discrepancies, the Italian language document is the sole authoritative and universally valid version.
66
33. Earnings per share
Earnings per share (EPS) is calculated as follows:
by dividing the profit attributable to the holders of ordinary shares by the average number of ordinary
shares during the year, net of treasury shares (basic EPS);
by dividing the profit by the average number of ordinary shares and the potential number of shares arising
from the exercise during the year of all option rights for stock option plans, net of treasury shares (diluted
EPS).
Basic EPS 2016
2015
Average number of shares during the year 91,319,870
91,319,870
Profit for the year (in € thousands) 19,814
14,804
Basic EPS and Diluted EPS 0.22
0.16
34. Compensation to the boards of directors and boards of statutory auditors
The costs relating to the compensation of the corporate boards for 2016 are as follows:
(in € thousands) Amount
Boards of directors 2,749
Boards of statutory auditors 99
Total 2,848
The persons identified as key executives are mostly the directors of the company.

This Consolidated Full Year Financial Report has been translated into English solely for the convenience of the international reader. In case of discrepancies, the Italian language document is the sole authoritative and universally valid version.
67
35. Independent auditors’ fees
(in € thousands)
Service Service provider User Note 2016 fee
Audit
EY S.p.A.
Parent
1
100
Audit EY S.p.A. Subsidiaries
78
EY network Subsidiaries 2 284
EY network Subsidiaries 3 82
Total 544
Notes:
1) Includes fees for the audit of the separate financial statements and the consolidated financial statements and
fees for the audit of the statement of costs for research & development staff for purposes of IRAP deductibility.
2) Includes fees relating to the audit of the Chinese, American and Swiss subsidiaries.
3) Includes fees relating to the voluntary audits of the IFRS financial statements of the Chinese subsidiaries.
36. Contingent liabilities
At December 31, 2016, the company is not aware of any contingent liabilities.
This Consolidated Full Year Financial Report has been translated into English solely for the convenience of the international reader. In case of discrepancies, the Italian language document is the sole authoritative and universally valid version.
68
37. Subsequent events
There were no events subsequent to the date of the financial statements which, if previously known, would have
required an adjustment to the financial statements.
As for developments in the Group in the beginning months of 2017, a description of significant subsequent
events is presented below.
In January and February 2017, the parent negotiated, with a syndicate of banks composed of Banca
IMI S.p.A., IntesaSanpaolo S.p.A., Unicredit S.p.A., BNL S.p.A. and ICBC (Europe) SA – Milan
Branch, certain amendments to the loan contract signed on March 24, 2015 by the company, Intercos
Europe S.p.A., Banca IMI S.p.A. and Unicredit S.p.A., the total amount of which, after such
amendments, will nevertheless remain at €80,000,000. More specifically, the amendments refer to: a) an
increase in the amount of the Term Facility from €50,000,000 to €60,000,000, with BNL S.p.A.
entering the loan contract as a lender of such Term Facility, with a commitment of €20,000,000; b) a
reduction in the amount of the Revolving Facility from €30,000,000 to €20,000,000, with ICBC
(Europe) SA – Milan Branch entering the loan contract as the sole lender of such Revolving Facility,
with a commitment of €20,000,000; c) an amendment to move the due date on the Term Facility to
December 31, 2021; d) a new interest rate per year for the Term Facility, equal to the 6-month Euribor
(and 6-month Libor for the tranche in U.S. dollars), plus 150 basis points; e) a new interest rate per year
for the Revolving Facility, equal to the 6-month Euribor or the 3-month Euribor, plus 100 basis points;
f) a commitment fee of the Revolving Facility equal to 25 basis points; and g) an amendment to the
definition of Permitted Indebtedness.
Also in January and February 2017, the parent negotiated the amendments to certain terms and
conditions of the €120,000,000 non-convertible bonds due March 28, 2022 with a 3.875% fixed rate per
year, the issue of which was approved by the board of directors on February 19, 2015. More
specifically, the amendments refer to: a) the reduction in the interest rate from 3.875% to 3.25% per
year; b) the amendment to move the maturity date to March 28, 2023; c) the extension of the period –
from March 28, 2018 to March 28, 2020 (excluded) – in which the bonds can be repaid in advance by
paying only the so-called “Make Whole Amount”; and d) the recalculation of the bond reimbursement
cost, establishing that, in the event of repayment between March 28, 2020 and March 27, 2021
(included), the cost will be 101% of the face value of the bonds (instead of 100% as currently

This Consolidated Full Year Financial Report has been translated into English solely for the convenience of the international reader. In case of discrepancies, the Italian language document is the sole authoritative and universally valid version.
69
established for the same period) whereas in the event of repayment between March 28, 2021 and the
new maturity date of the bonds, the cost will be equal to the face value of the bonds as currently
established.
In February 2017, Intercos Asia Pacific increased its investment in the share capital of the subsidiary
Shinsegae Intercos Korea by Korean Won 2,500,000 thousand. The shareholder Shinsegae also
increased its investment in the company’s share capital so that its percentage investment in capital
would remain unchanged.
Milan, March 27, 2017 INTERCOS S.p.A.
On behalf of the Board of Directors
___________________________

Intercos S.p.A.Consolidated financial statements as at December 31, 2016
Independent auditor’s report in accordance with articles 14and 16 of Legislative Decree n. 39, dated 27 January 2010

EY S.p.A.Sede Legale: Via Po, 32 - 00198 RomaCapitale Sociale deliberato Euro 3.250.000,00, sottoscritto e versato Euro 2.950.000,00 i.v.Iscritta alla S.O. del Registro delle Imprese presso la C.C.I.A.A. di RomaCodice fiscale e numero di iscrizione 00434000584 - numero R.E.A. 250904P.IVA 00891231003Iscritta al Registro Revisori Legali al n. 70945 Pubblicato sulla G.U. Suppl. 13 - IV Serie Speciale del 17/2/1998Iscritta all’Albo Speciale delle società di revisioneConsob al progressivo n. 2 delibera n.10831 del 16/7/1997
A member firm of Ernst & Young Global Limited
EY S.p.A.Via Meravigli, 1220123 Milano
Tel: +39 02 722121Fax: +39 02 722122037ey.com
INDEPENDENT AUDITOR’S REPORT IN ACCORDANCE WITH ARTICLES14 AND 16 OF LEGISLATIVE DECREE N. 39, DATED 27 JANUARY2010(Translation from the original Italian text)
To the Shareholders ofIntercos S.p.A.
Report on the consolidated financial statements
We have audited the accompanying consolidated financial statements of the Intercos Group, whichcomprise the statement of financial position as at December 31, 2016, the statement ofcomprehensive income, statement of changes in equity and the statement of cash flows for the yearthen ended, and a summary of significant accounting policies and other explanatory information.
Directors’ responsibility for the consolidated financial statementsThe Directors of Intercos S.p.A. are responsible for the preparation of these consolidated financialstatements that give a true and fair view in accordance with International Financial ReportingStandards as adopted by the European Union as well as with the regulations issued to implementarticle 9 of Legislative Decree n. 38, dated 28 February 2005.
Auditor's responsibilityOur responsibility is to express an opinion on these consolidated financial statements based on ouraudit. We conducted our audit in accordance with International Standards on Auditing (ISA Italia)implemented in accordance with article 11 of Legislative Decree n. 39, dated 27 January 2010.Those standards require that we comply with ethical requirements and plan and perform the audit toobtain reasonable assurance about whether the financial statements are free from materialmisstatement.
An audit involves performing procedures to obtain audit evidence about the amounts and disclosuresin the consolidated financial statements. The procedures selected depend on the auditor'sprofessional judgment, including the assessment of the risks of material misstatement of theconsolidated financial statements, whether due to fraud or error. In making those risk assessments,the auditor considers internal control relevant to the entity's preparation of the consolidated financialstatements that give a true and fair view in order to design audit procedures that are appropriate inthe circumstances, but not for the purpose of expressing an opinion on the effectiveness of theentity's internal control. An audit also includes evaluating the appropriateness of accounting policiesused and the reasonableness of accounting estimates made by Directors, as well as evaluating theoverall presentation of the consolidated financial statements.
We believe that the audit evidence we have obtained is sufficient and appropriate to provide a basisfor our audit opinion.
OpinionIn our opinion, the consolidated financial statements give a true and fair view of the financial positionof the Intercos Group as at December 31, 2016, and of its financial performance and its cash flowsfor the year then ended in accordance with International Financial Reporting Standards as adopted bythe European Union as well as with the regulations issued to implement article 9 of Legislative Decreen. 38, dated 28 February 2005.
Report on other legal and regulatory requirements
Opinion on the consistency of the Report on Operations with the consolidatedfinancial statementsWe have performed the procedures required under audit standard SA Italia n. 720B in order toexpress an opinion, as required by the law, on the consistency of the Report on Operations with theconsolidated financial statements. The Directors of Intercos S.p.A. are responsible for the preparationof the Report on Operations in accordance with the applicable laws and regulations. In our opinion theReport on Operations is consistent with the consolidated financial statements of the Intercos Group asat December 31, 2016.
Milan, April 5, 2017
EY S.p.A.Signed by: Paolo Zocchi, Partner
This report has been translated into the English language solely for the convenience of internationalreaders.