interannual rainfall variability in the … · the influence of pac ssts on nordeste and amazon...
TRANSCRIPT
INTERNATIONAL JOURNAL OF CLIMATOLOGY
Int. J. Climatol. 22: 1663–1686 (2002)
Published online in Wiley InterScience (www.interscience.wiley.com). DOI: 10.1002/joc.815
INTERANNUAL RAINFALL VARIABILITY IN THE AMAZON BASIN ANDSEA-SURFACE TEMPERATURES IN THE EQUATORIAL PACIFIC AND THE
TROPICAL ATLANTIC OCEANS
JOSYANE RONCHAIL,a,* GERARD COCHONNEAU,a MICHEL MOLINIER,a JEAN-LOUP GUYOT,a ADRIANA GORETTI DEMIRANDA CHAVES,b VALDEMAR GUIMARAESc and EURIDES DE OLIVEIRAc
a IRD, CP 7091, Lago Sul 71619-970, Brasilia (DF), Brasilb ANEEL, SGAN 603, ed. DNC, 70830-030 Brasilia (DF), Brasil
c ANA, SPF, Area 5, qd 3, bl B, Brasilia (DF), Brasil
Received 20 June 2001Revised 17 June 2002
Accepted 17 June 2002
ABSTRACT
Rainfall variability in the Amazon basin is studied in relation to sea-surface temperatures (SSTs) in the equatorial Pacificand the northern and southern tropical Atlantic during the 1977–99 period, using the HiBAm original rainfall data setand complementary cluster and composite analyses.
The northeastern part of the basin, north of 5 °S and east of 60 °W, is significantly related with tropical SSTs: a rainierwet season is observed when the equatorial Pacific and the northern (southern) tropical Atlantic are anomalously cold(warm). A shorter and drier wet season is observed during El Nino events and negative rainfall anomalies are alsosignificantly associated with a warm northern Atlantic in the austral autumn and a cold southern Atlantic in the spring.The northeastern Amazon rainfall anomalies are closely related with El Nino–southern oscillation during the wholeyear, whereas the relationships with the tropical Atlantic SST anomalies are mainly observed during the autumn. Atime–space continuity is observed between El Nino-related rainfall anomalies in the northeastern Amazon, those in thenorthern Amazon and south-eastern Amazon, and those in northern South America and in the Nordeste of Brazil.
A reinforcement of certain rainfall anomalies is observed when specific oceanic events combine. For instance, whenEl Nino and cold SSTs in the southern Atlantic are associated, very strong negative anomalies are observed in the wholenorthern Amazon basin. Nonetheless, the comparison of the cluster and the composite analyses results shows that therainfall anomalies in the northeastern Amazon are not always associated with tropical SST anomalies.
In the southern and western Amazon, significant tropical SST-related rainfall anomalies are very few and spatiallyvariable. The precipitation origins differ from those of the northeastern Amazon: land temperature variability, extratropicalperturbations and moisture advection are important rainfall factors, as well as SSTs. This could partially explain why:(a) the above-mentioned signals weaken or disappear, with the exception of the relative dryness that is observed at thepeak of an El Nino event and during the dry season when northern Atlantic SSTs are warmer than usual; (b) rainfallanomalies tend to resemble those of southeastern South America, noticeably at the beginning and the end of El Ninoand La Nina events; (c) some strong excesses of rain are not associated with any SST anomalies and merit furtherinvestigation. Copyright 2002 Royal Meteorological Society.
KEY WORDS: rainfall variability; Amazon basin; SST tropical Atlantic; ENSO; composite analysis; cluster analysis
1. INTRODUCTION
The Hydrology and Geodynamics in the Amazon basin (HiBAm) project1 aims to document and forecast thevariability of surface hydrology and sediment transport through the Amazon basin. As discharge variability ismainly explained by rainfall variability (e.g. see Molinier et al., 1996), this paper focuses on the relationship
* Correspondence to: Josyane Ronchail, IRD, CP 7091, Lago Sul 71619-970, Brasilia (DF)-Brasil; e-mail: [email protected]
Copyright 2002 Royal Meteorological Society
1664 J. RONCHAIL ET AL.
between rainfall and sea-surface temperatures (SSTs) in the equatorial Pacific (PAC) and in the tropical North(NATL) and South (SATL) Atlantic.
Observations and results from models show that the SSTs over the tropical Atlantic influence the interannualvariability of climate in South America, particularly in the northeast region of Brazil (Nordeste) (Hastenrathand Heller, 1977; Moura and Shukla, 1981; Harzallah et al., 1996; Nobre and Shukla, 1996) and over theeastern Amazon (Molion, 1987, 1993; Marengo, 1992; Nobre and Shukla, 1996; Roucou, 1997).
The influence of PAC SSTs on Nordeste and Amazon rainfall, as well as the Pacific–Atlantic relationshipsand the local conditions that provide rainfall anomalies, have been described in various papers (Hastenrathand Heller, 1977; Kousky et al., 1984; Rao and Hada, 1987; Aceituno, 1988; Rogers, 1988; Marengo, 1992;Marengo and Hastenrath, 1993; Moron et al., 1995; Nobre and Shukla, 1996; Enfield and Mayer, 1997;Roucou, 1997; Marengo et al., 1998; Uvo et al., 1998; Liebmann and Marengo, 2001; Pezzi and Cavalcanti,2001; Molinier et al., in press).
With the exception of Marengo (1992), Liebmann and Marengo (2001), and Molinier et al. (in press),little attention has been paid to the relationship between tropical SSTs and rainfall variability over the entireAmazon basin. The relative influences of El Nino–southern oscillation (ENSO) and of the tropical AtlanticSSTs on the Amazon basin rainfall are not well known yet. We propose a new analysis of the space–timevariability of rainfall in relation to the tropical SSTs using the original rainfall data set of the HiBAm project.
In Section 2 we describe the data sets used in this work and the time–space rainfall distribution in theAmazon basin. In Section 3 we analyse the relationship between rainfall and SSTs in the tropical oceanicbasins. We synthesise the results and offer some possible explanations for their occurrence in Section 4.
2. RAINFALL AND SST DATA SETS
2.1. Rainfall data set and rainfall distribution in the Amazon basin
Monthly rainfall data were provided by the Agencia Nacional de Energia Electrica (ANEEL), as well asby the National Meteorological Services of Brazil (INMET), Bolivia (SENAMHI), and Ecuador (INAMHI).
The data set has been controlled and homogenized by the ‘regional vector method’ (Hiez, 1977; Hiezet al., 1992), which models the rainfall observation in a region in the form of relevant indexes of the monthlyrainfall and coefficients related to each rain gauge. 879 out of approximately 1400 rain gauges located in theAmazon basin or in the vicinity were selected by the method and clustered into 50 homogeneous regions.The method was also used to correct monthly rainfall and to fill gaps in the rainfall information. The methodwas not applied in the Andean areas because the rain gauge density was too low to represent the high spatialvariability of the rainfall in these regions. For the 248 rain gauges finally selected for this study, 4.75% of themonthly data were obtained by filling in gaps and 3.92% were obtained from corrected data. The percentageof monthly missing data is 7%.
In the Brazilian Amazon basin, many of the rain gauge stations were installed in the mid 1970s, after thedevelopment of the Trans-Amazonian roads and population settlements (e.g. along the Porto-Velho–Cuibaaxis in Rondonia and along the Rio Branco on the Manaus–Venezuela axis). A quarter of the 248 stationsselected have data that begin between 1977 and 1980. That is one of the reasons for selecting the 1977–99period for the present study. Another reason is that the 1970s was an important period of time for oceanicchanges with the warming (cooling) of the southern (northern) Atlantic beginning in the early 1970s(Roucou, 1997) and the warming of the tropical Pacific beginning in 1976. In addition, Ronchail (1997)showed that a rupture appears at the beginning of the 1970s in the rainfall of the Amazonian lowlands ofBolivia, with negative anomalies during the 1950s and 1960s and positive anomalies during the 1970s and1980s. Thus, when observing these data sets on a decadal time scale, the 1977–99 period appears almosthomogeneous.
The spatial distribution of the stations is not random (Figure 1) but is organized along rivers and roads. Wechoose to use observed data rather than mean gridded data because the redundancy of stations in some placesis a way of verifying information robustness and because lack of data in other places is also a limitation.
Copyright 2002 Royal Meteorological Society Int. J. Climatol. 22: 1663–1686 (2002)

AMAZON BASIN RAINFALL VARIABILITY AND SST 1665
Figure 1. Location of the rain gauges and of the main Amazonian regions characterized by their rainfall regimes (see text)
Annual rainfall in the Amazon basin is generally above 2000 mm around the equator. There are two regionshaving a maximum above 3000 mm, one on the Atlantic coast and the other over the northwestern Amazon.Annual rainfall decreases from the equatorial regions towards the tropics and the Nordeste (under 1500 mm)and in the inner Andean valleys (under 1000 mm). Higher rainfall variability is generally associated with lowerrainfall totals; however, variability is high in the northwestern Amazon along the upper Rio Negro valley.
In order to take into account the different rainfall regimes in the Amazon basin, we computed anagglomerative hierarchical cluster analysis on the 12-monthly 1977–99 rainfall means. We used Ward’smethod. Cluster membership is assessed by calculating the total sum of squared deviations from the mean ofa cluster. The criterion for fusion is that it should produce the smallest possible increase in the error sum ofsquares (Wilks, 1995; Fielding, 2002).
Four regions were identified (Figure 1) whose rainy and dry seasons are consistent with those defined byKousky (1988), Horel et al. (1989), and Figueroa and Nobre (1990):
• The northern Amazon (NA) region, where a rainfall maximum is registered from April to August, whichcorresponds to a Northern Hemisphere position of the maximum of convection. There is no real dry season,
Copyright 2002 Royal Meteorological Society Int. J. Climatol. 22: 1663–1686 (2002)

1666 J. RONCHAIL ET AL.
as this region is very close to the equator. Figure 2(a) shows the small percentage of annual rainfall (lessthan 10%) received in December–February (DJF), and Figure 2(c) shows the large value (nearly 50%) ofJune–August (JJA) rainfall, particularly along the Rio Branco.
• The western Amazon (WA) region, where the maximum rainfall occurs from January to May, when thecontinental maximum of convection migrates towards the south. However, no real dry period is registeredand a bimodal equatorial regime is often identified. The percentage of rain does not vary much from onequarter to another (Figure 2(a)–(d)).
• The southern Amazon (SA) region, where the rainy season is from October to April, December and January,corresponding to the southernmost position of the maximum of convection in South America. Figure 2(a)shows that DJF receives nearly 50% of the annual rain, whereas JJA is dry (Figure 2(c)); however, inthe southwestern basin the winter rainfall can reach 5 to 15% of the annual amount, and the percentageremains under 5% in the southeast. Advection of cold air along the Andes and associated fronts (DeOliveira and Nobre, 1986; Ronchail, 1989; Seluchi and Marengo, 2000) are responsible for this unusualwinter percentage.
Figure 2. Percentage of annual rainfall during (a) DJF, (b) MAM, (c) JJA, (d) SON
Copyright 2002 Royal Meteorological Society Int. J. Climatol. 22: 1663–1686 (2002)

AMAZON BASIN RAINFALL VARIABILITY AND SST 1667
• The northeastern Amazon (NEA) region, including the area extending from the mouth of the Amazon untilManaus, with its rainy season from December to May when the maximum of convection migrates towardsthe north (Figure 2(a) and (b)).
As a new cycle begins in September, with the beginning of a rainy or rainier season in the SouthernHemisphere, the period from September to August has been chosen as the hydrological year. As each seasonis associated with a peculiar feature in one or more regions, we shall use rainfall data integrated over 3-monthperiods (DJF, March–May (MAM), JJA, and September–November (SON)).
2.2. SST data
The SST data set is from the Climatic Prevision Centre of the National Oceanic and AtmosphericAdministration (CPC-NOAA). Monthly SSTs (1950–2000) are provided for Nino3 (5 °S–5 °N, 150–90 °W)in the equatorial Pacific Ocean, the NATL (5–20 °N, 60–30 °W) and the SATL (0–20 °S, 30 °W–10 °E)(Figure 3(a)–(c)). The southern Atlantic and the Pacific SSTs have a similar annual cycle, which is out of phasewith the cycle of the northern Atlantic SSTs. Maximum and minimum temperatures occur at the end of therespective summer and winter seasons. The southern Atlantic is the coldest oceanic basin and has a large andregular annual amplitude (Figure 3(a)). The PAC SST has the strongest interannual variability (Figure 3(c)).
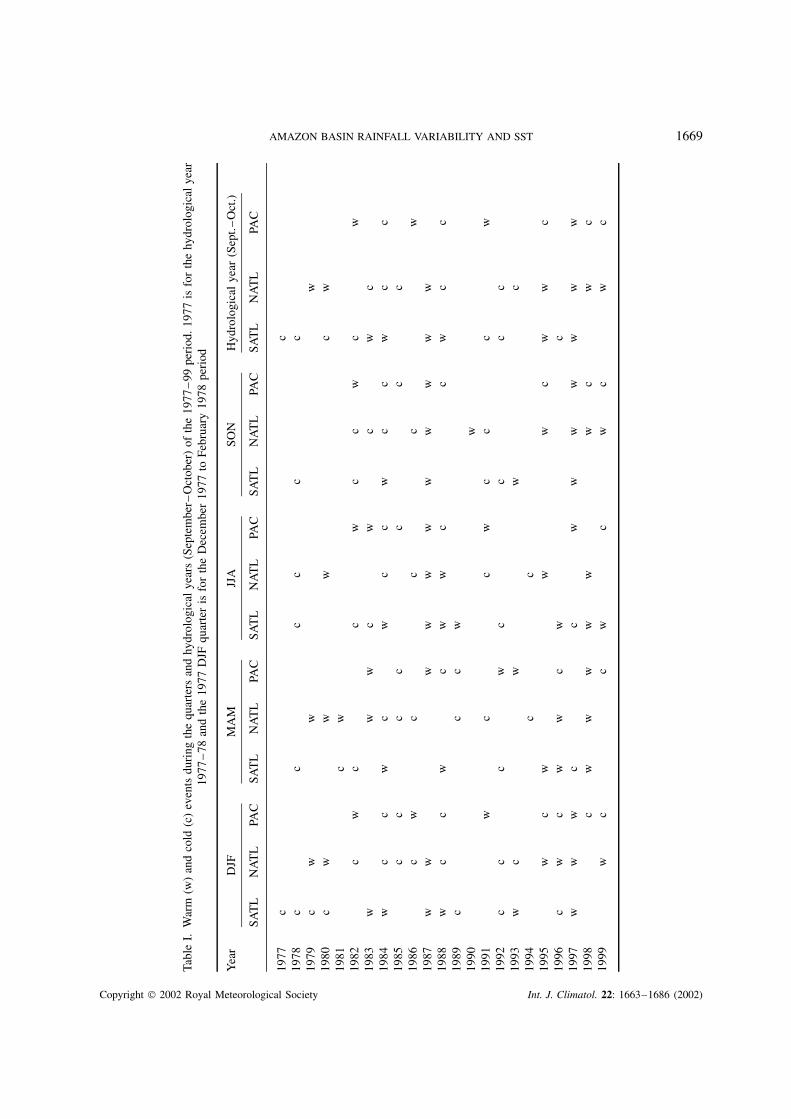
SST anomalies computed over the 1977–99 period (standardized values) are used to define anomalous yearsand quarters in the oceanic basins; they appear in Table I. Cold and warm years and quarters in the tropicalAtlantic and in the Pacific (Nino3 block is used) are those with SST anomalies exceeding three-quarters ofthe standard deviation. El Nino and La Nina events are consistent with those described by Trenberth (1997).
On an interannual time scale, the SATL SST anomalies are inversely correlated with the Nino3 SSTs(Figure 4). The correlation between both series is −0.47; it is significant at the 0.05 level. NATL SST andNino3 SST anomalies are not correlated. In the Atlantic Ocean, opposite anomalies of the northern andsouthern basin SSTs can be observed, as in 1980–81, 1983–84, and 1984–85; but the same-sign anomaliesare often simultaneous in both Atlantic basins during the 1977–99 period, as in 1987–88 and 1992–93.This results in no correlation between SST anomalies in the northern and the southern tropical Atlanticoceans (Figure 4). Therefore, even though a dipolar oscillation has been proposed in the tropical Atlantic,little evidence for a coherent signal appears in this work, on an interannual time scale, as has been shownby Houghton and Tourre (1992) and Enfield and Mayer (1997). For these reasons, NATL and SATL SSTanomalies will be treated separately.
3. TIME–SPACE ASSOCIATIONS BETWEEN RAINFALL AND SST ANOMALIES
These associations are analysed using two different approaches.First, starting with the rainfall anomalies (standardized values), we describe their main spatial patterns in
the Amazon basin using a cluster analysis, and we compute the SST anomalies corresponding to the differentclasses of rainfall anomalies. This approach has the advantage of taking into account all the years of the periodstudied, which includes many different kinds of rainfall anomaly structures. However, only a rough idea isgiven of the rainfall–SST relationships, as patterns of precipitation anomalies could probably be associatedwith factors other than SSTs.
Secondly, starting with the SST anomalies, we compute the rainfall anomalies corresponding to warm andcold events in the different oceanic basins, using composite analysis. This second approach gives a cleareridea of the relationships between tropical SST anomalies and rainfall anomalies in the Amazon basin.
These two cross-analyses are done in order to verify whether or not all rainfall anomaly patterns areassociated with SST anomalies.
3.1. Spatial organization of rainfall anomalies
In order to identify the main spatial patterns of rainfall anomalies in the Amazon basin, we computed acluster analysis on the monthly rainfall anomalies of each quarter, using Ward’s method (see description in
Copyright 2002 Royal Meteorological Society Int. J. Climatol. 22: 1663–1686 (2002)

1668 J. RONCHAIL ET AL.
20
22
24
26
28
3019
77
1978
1979
1981
1982
1984
1985
1986
1988
1989
1991
1992
1994
1995
1996
1998
1999
1977
1978
1979
1981
1982
1984
1985
1986
1988
1989
1991
1992
1994
1995
1996
1998
1999
months
aT
emp
erat
ure
(d
egre
es)
20
1977
1978
1979
1981
1982
1984
1985
1986
1988
1989
1991
1992
1994
1995
1996
1998
1999
20
22
24
26
28
30
months
b
Tem
per
atu
re (
deg
rees
)
22
24
26
28
30
months
c
Tem
per
atu
re (
deg
rees
)
Figure 3. Monthly 1977–2000 SSTs in the (a) NATL basin (5–20 °N, 60–30 °W), (b) SATL basin (0–20 °S, 30 °W–10 °E), and (c)Nino3 region (5 °S–5 °N, 150–90 °W)
Section 2.1). The main classes of rainfall anomalies are presented in Figures 5 to 8. The mean SST anomaliescorresponding to each class are shown in Table II.
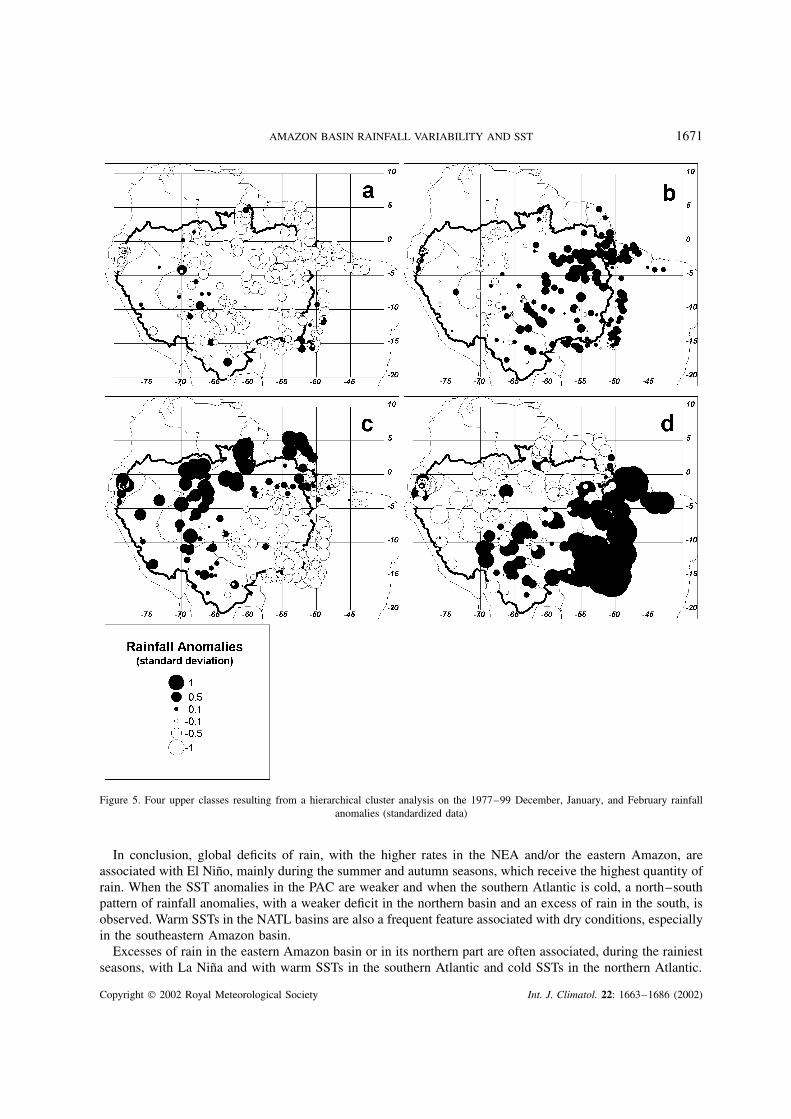
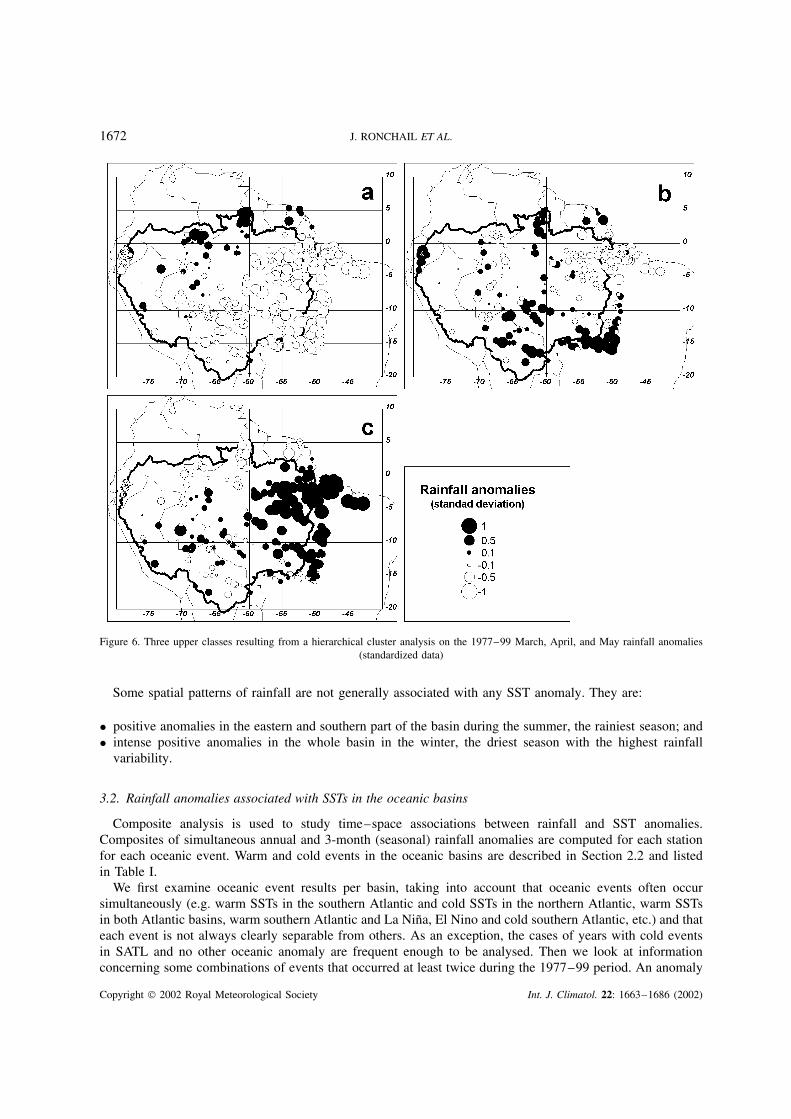
Three of the quarter periods present a class with negative rainfall anomalies encompassing the majorityof the Amazon basin (Figures 5(a), 6(a), and 8(a)). The negative anomalies are stronger in the northeasternbasin in the summer (Figure 5(a)) and in the eastern basin in the autumn (Figure 6(a)). They are associatedwith strong positive SST anomalies in the PAC (El Nino events; Table II). In autumn (Figure 6(a)) andspring (Figure 8(a)), important negative rainfall anomalies in the southeastern basin are also concomitantwith abnormal warm SSTs in the northern Atlantic.
Copyright 2002 Royal Meteorological Society Int. J. Climatol. 22: 1663–1686 (2002)
AMAZON BASIN RAINFALL VARIABILITY AND SST 1669
Tabl
eI.
War
m(w
)an
dco
ld(c
)ev
ents
duri
ngth
equ
arte
rsan
dhy
drol
ogic
alye
ars
(Sep
tem
ber–
Oct
ober
)of
the
1977
–99
peri
od.
1977
isfo
rth
ehy
drol
ogic
alye
ar19
77–
78an
dth
e19
77D
JFqu
arte
ris
for
the
Dec
embe
r19
77to
Febr
uary
1978
peri
od
Yea
rD
JFM
AM
JJA
SON
Hyd
rolo
gica
lye
ar(S
ept.
–O
ct.)
SAT
LN
AT
LPA
CSA
TL
NA
TL
PAC
SAT
LN
AT
LPA
CSA
TL
NA
TL
PAC
SAT
LN
AT
LPA
C
1977
cc
1978
cc
cc
cc
1979
cw
ww
1980
cw
ww
cw
1981
cw
1982
cw
cc
wc
cw
cw
1983
ww
wc
wc
wc
1984
wc
cw
cw
cc
wc
cw
cc
1985
cc
cc
cc
c19
86c
wc
cc
w19
87w
ww
ww
ww
ww
ww
1988
wc
cw
cw
wc
cw
cc
1989
cc
cw
1990
w19
91w
cc
wc
cc
w19
92c
cc
wc
cc
c19
93w
cw
wc
1994
cc
1995
wc
ww
wc
ww
c19
96c
wc
ww
cw
c19
97w
ww
cc
ww
ww
ww
w19
98c
ww
ww
ww
cw
c19
99w
cc
wc
wc
wc
Copyright 2002 Royal Meteorological Society Int. J. Climatol. 22: 1663–1686 (2002)

1670 J. RONCHAIL ET AL.
-2-1.5
-1-0.5
00.5
11.5
22.5
319
77
1978
1979
1980
1981
1982
1983
1984
1985
1986
1987
1988
1989
1990
1991
1992
1993
1994
1995
1996
1997
1998
1999
2000
Years
Tem
per
atu
re a
no
mal
ies
(sta
nd
ard
dev
iati
on
) NATL
SATL
Niño3
Figure 4. Annual 1977–2000 SST anomalies (standard deviation) in the NATL (5–20 °N, 60–30 °W), the SATL basin (0–20 °S,30 °W–10 °E), and the Nino3 region (5 °S–5 °N, 150–90 °W)
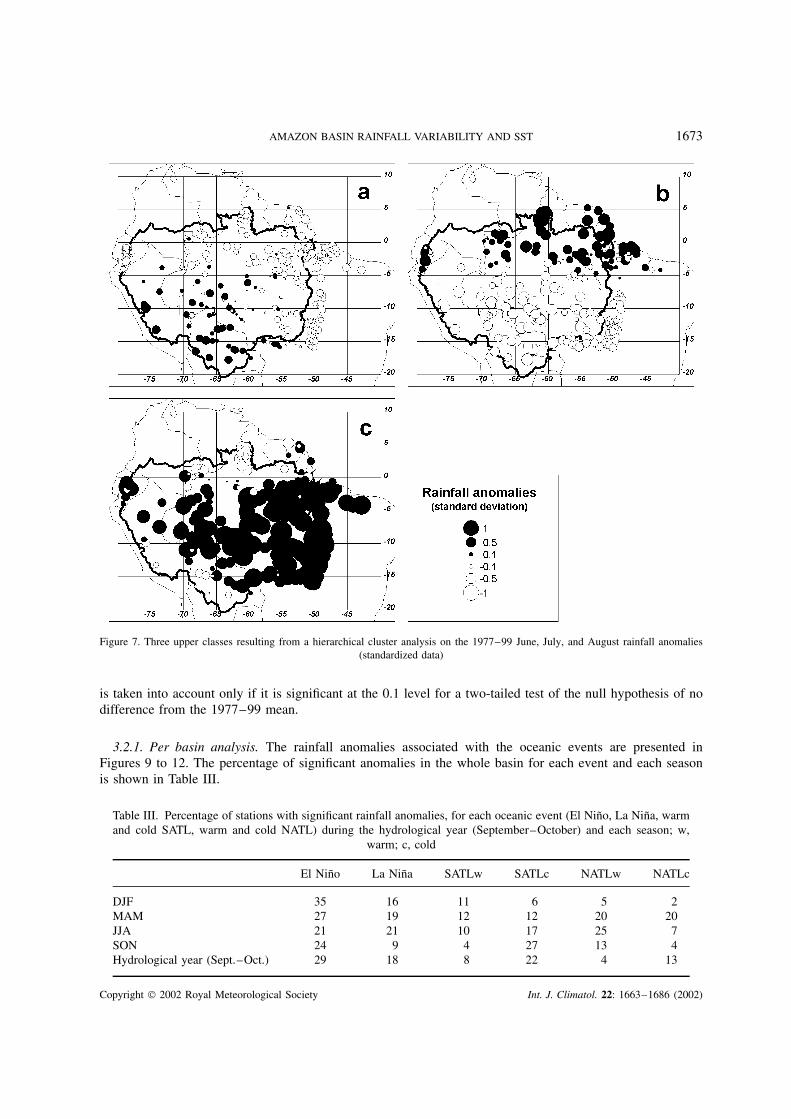
During autumn (Figure 6(b)), winter (Figure 7(a)), and spring (Figure 8(b)), slight negative (positive)anomalies in the NA (SA) basin are associated with small positive SST anomalies in the Pacific and coldanomalies in the southern Atlantic (Table II).
A cluster with excess of rain prevailing in the eastern basin can be found in summer (Figure 5(b)), autumn(Figure 6(c)), and spring (Figure 8(c)). This structure is associated in autumn and spring with warm SSTsin the southern Atlantic and with cold SSTs in the PAC (La Nina) and the northern Atlantic. In DJF thisstructure is poorly associated with SST anomalies.
In summer (Figure 5(c)) and winter (Figure 7(b)) a bipolar configuration, with an excess of rain in thenorthern part of the basin and a deficiency in the south, is associated with cold SSTs in the PAC (La Nina).
Other rainfall spatial structures with very strong excesses of rain in the eastern part of the Amazon basinin summer (Figure 5(d)) and in most of the basin in winter (Figure 7(c)) are rarely observed, so that theycannot be associated with any SST anomaly.
Table II. SST anomalies (in degrees) in the three oceanic basins corresponding toeach cluster. Each cluster has the name of the corresponding figure. The seasonal
cluster analyses are taken from monthly rainfall anomalies
class No. of months Nino3 NATL SATL
DJF Figure 5(a) 15 1.2 0.1 0.4Figure 5(b) 13 −0.1 −0.3 0.0Figure 5(c) 37 −0.6 0.2 −0.2Figure 5(d) 3
MAM Figure 6(a) 18 0.7 0.6 −0.2
Figure 6(b) 23 0.3 0.1 −0.5Figure 6(c) 26 −0.7 −0.4 0.5
JJA Figure 7(a) 34 0.4 0.1 −0.4
Figure 7(b) 24 −0.4 0.0 0.5Figure 7(c) 9
SON Figure 8(a) 23 0.0 0.3 0.1
Figure 8(b) 23 0.4 −0.1 −0.5Figure 8(c) 20 −0.3 −0.4 0.4
Copyright 2002 Royal Meteorological Society Int. J. Climatol. 22: 1663–1686 (2002)
AMAZON BASIN RAINFALL VARIABILITY AND SST 1671
Figure 5. Four upper classes resulting from a hierarchical cluster analysis on the 1977–99 December, January, and February rainfallanomalies (standardized data)
In conclusion, global deficits of rain, with the higher rates in the NEA and/or the eastern Amazon, areassociated with El Nino, mainly during the summer and autumn seasons, which receive the highest quantity ofrain. When the SST anomalies in the PAC are weaker and when the southern Atlantic is cold, a north–southpattern of rainfall anomalies, with a weaker deficit in the northern basin and an excess of rain in the south, isobserved. Warm SSTs in the NATL basins are also a frequent feature associated with dry conditions, especiallyin the southeastern Amazon basin.
Excesses of rain in the eastern Amazon basin or in its northern part are often associated, during the rainiestseasons, with La Nina and with warm SSTs in the southern Atlantic and cold SSTs in the northern Atlantic.
Copyright 2002 Royal Meteorological Society Int. J. Climatol. 22: 1663–1686 (2002)
1672 J. RONCHAIL ET AL.
Figure 6. Three upper classes resulting from a hierarchical cluster analysis on the 1977–99 March, April, and May rainfall anomalies(standardized data)
Some spatial patterns of rainfall are not generally associated with any SST anomaly. They are:
• positive anomalies in the eastern and southern part of the basin during the summer, the rainiest season; and• intense positive anomalies in the whole basin in the winter, the driest season with the highest rainfall
variability.
3.2. Rainfall anomalies associated with SSTs in the oceanic basins
Composite analysis is used to study time–space associations between rainfall and SST anomalies.Composites of simultaneous annual and 3-month (seasonal) rainfall anomalies are computed for each stationfor each oceanic event. Warm and cold events in the oceanic basins are described in Section 2.2 and listedin Table I.
We first examine oceanic event results per basin, taking into account that oceanic events often occursimultaneously (e.g. warm SSTs in the southern Atlantic and cold SSTs in the northern Atlantic, warm SSTsin both Atlantic basins, warm southern Atlantic and La Nina, El Nino and cold southern Atlantic, etc.) and thateach event is not always clearly separable from others. As an exception, the cases of years with cold eventsin SATL and no other oceanic anomaly are frequent enough to be analysed. Then we look at informationconcerning some combinations of events that occurred at least twice during the 1977–99 period. An anomaly
Copyright 2002 Royal Meteorological Society Int. J. Climatol. 22: 1663–1686 (2002)
AMAZON BASIN RAINFALL VARIABILITY AND SST 1673
Figure 7. Three upper classes resulting from a hierarchical cluster analysis on the 1977–99 June, July, and August rainfall anomalies(standardized data)
is taken into account only if it is significant at the 0.1 level for a two-tailed test of the null hypothesis of nodifference from the 1977–99 mean.
3.2.1. Per basin analysis. The rainfall anomalies associated with the oceanic events are presented inFigures 9 to 12. The percentage of significant anomalies in the whole basin for each event and each seasonis shown in Table III.
Table III. Percentage of stations with significant rainfall anomalies, for each oceanic event (El Nino, La Nina, warmand cold SATL, warm and cold NATL) during the hydrological year (September–October) and each season; w,
warm; c, cold
El Nino La Nina SATLw SATLc NATLw NATLc
DJF 35 16 11 6 5 2MAM 27 19 12 12 20 20JJA 21 21 10 17 25 7SON 24 9 4 27 13 4Hydrological year (Sept.–Oct.) 29 18 8 22 4 13
Copyright 2002 Royal Meteorological Society Int. J. Climatol. 22: 1663–1686 (2002)

1674 J. RONCHAIL ET AL.
Figure 8. Three upper classes resulting from a hierarchical cluster analysis on the 1977–99 September, October, and November rainfallanomalies (standardized data)
3.2.1.1. PAC: During an average September–August El Nino year, the rainfall total is smaller than the1977–99 mean at 82% of the stations of the basin. Significant negative anomalies are observed at 29% ofthe stations. They are located mainly north of 7 °S and east of 60 °W, in the NEA region, where 72% ofthe anomalies are significant (Figure 9(a)). In that region, the negative rainfall anomalies prevail during thewhole year, especially in summer at the peak of an El Nino event, but the mean annual anomaly is higher(−1.1 standard deviation) than the mean summer anomaly (−0.7 standard deviation).
The regions with significant anomalies vary during the year. They are spread across the whole Amazonbasin in summer: more than a third of the stations of the Amazon basin have significant negative anomalies(Figure (9b)). In autumn, the deficit of rain is an eastern Amazon feature (Figure (9c)) and a northern onein spring (not shown). Excesses of rain are observed in the Ecuadorian Amazon basin on an annual timescale; at many stations they are significant in autumn. On an annual time scale and in autumn and winter,non-significant positive anomalies are also found in the southwestern Amazon basin (Figure 9(a) and (c)).
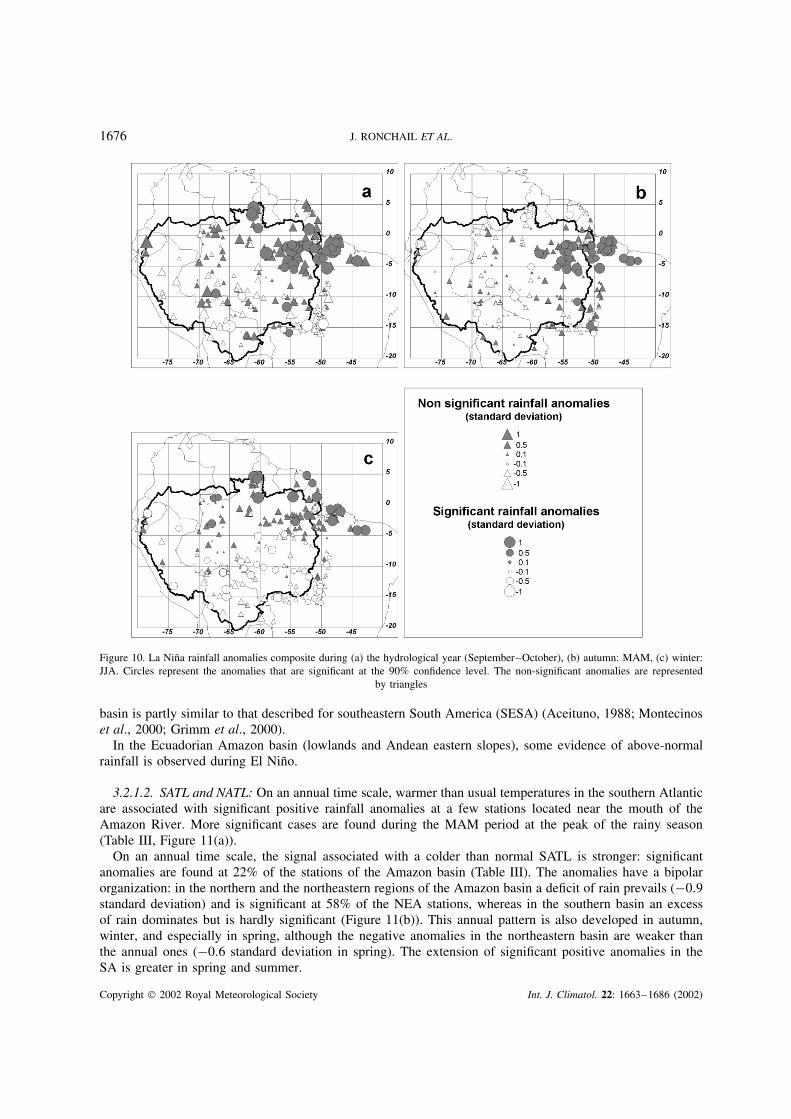
During a mean La Nina year, significant anomalies are observed at 18% of the stations of the Amazonbasin. Most of them are positive and located in the NEA region, east of 60 °W and north of 5 °S, where 38%of the anomalies are significant (Figure 10(a)). The mean annual anomaly in the NEA region is one standarddeviation. The 3-month analysis (Table III) shows that during La Nina positive rainfall anomalies prevailfrom summer until winter in the NEA region. The anomalies are located in the northern part of the basin insummer and in winter (Figure (10c)) and in its eastern part in autumn (Figure (10b)). Negative anomaliesare found in the SA and in the Peruvian Amazon basin on an annual time scale (Figure 10(a)). In winter,
Copyright 2002 Royal Meteorological Society Int. J. Climatol. 22: 1663–1686 (2002)

AMAZON BASIN RAINFALL VARIABILITY AND SST 1675
Figure 9. El Nino rainfall anomalies composite during (a) the hydrological year (September–October), (b) summer: DJF, (c) autumn:MAM. Circles represent the anomalies that are significant at the 90% confidence level. The non-significant anomalies are represented
by triangles
significant deficits of rain in the SA are observed at 23% of the stations (Figure 10(c)) and they contributegreatly to the strong percentage of significant anomalies (Table III).
In conclusion, the two phases of the SO are associated with opposite rainfall anomalies, mainly located inthe NEA basin. The deficit of rain during El Nino is nearly global in the NEA region during the whole yearand widely spread in the rest of the basin, particularly in summer. The excess of rainfall during La Nina isconfined to the NEA region, where it is significant at a small number of stations.
During El Nino events, the main anomalies are well defined during the whole year, suggesting that thereis a shorter than normal rainy season in the NEA. During La Nina the deficit is observed during the core ofthe rainy season, in summer and autumn, and in winter, suggesting an early end of the rainy season.
During El Nino and La Nina, rainfall anomalies in the Amazon basin have the same signs as thosedocumented for northern South America and for the Nordeste of Brazil. Moreover, they have the sameseasonality as those in neighbouring regions: in the eastern Amazon the anomalies are centralized around theautumn, as in the Nordeste (Aceituno, 1988; Uvo et al., 1998), and in the NA they occur from the borealsummer until the austral summer as in northern South America (Aceituno, 1988).
In a few locations of the SA, La Nina is associated with a deficit of rain, as already documented byRonchail (1998). In addition, excesses of rain are observed during some El Nino events (1982–83, 1991–92)in the SA, but are not significant for the 1977–99 period. As these last two results refer to the wintertime, therainfall anomalies could be attributed to a deficit (enhancement) of the activity of extra-tropical perturbationsduring La Nina (El Nino). It can be noticed that the ENSO-related rainfall variability observed in the SA
Copyright 2002 Royal Meteorological Society Int. J. Climatol. 22: 1663–1686 (2002)
1676 J. RONCHAIL ET AL.
Figure 10. La Nina rainfall anomalies composite during (a) the hydrological year (September–October), (b) autumn: MAM, (c) winter:JJA. Circles represent the anomalies that are significant at the 90% confidence level. The non-significant anomalies are represented
by triangles
basin is partly similar to that described for southeastern South America (SESA) (Aceituno, 1988; Montecinoset al., 2000; Grimm et al., 2000).
In the Ecuadorian Amazon basin (lowlands and Andean eastern slopes), some evidence of above-normalrainfall is observed during El Nino.
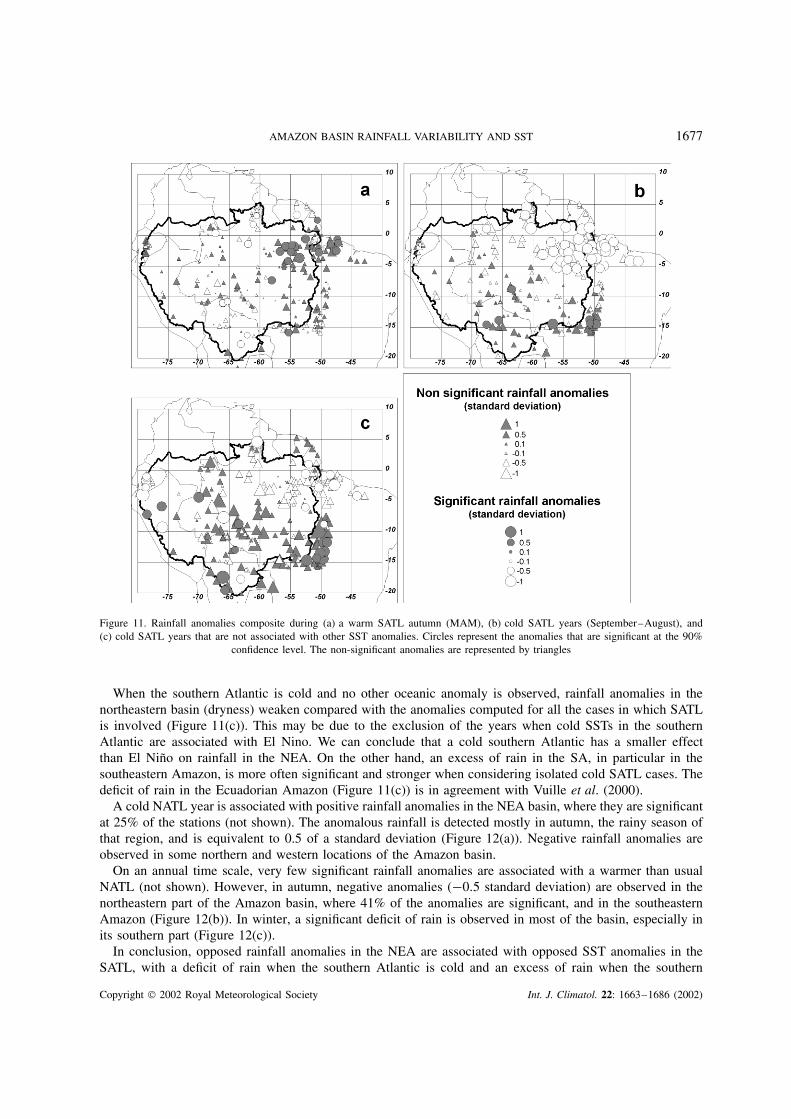
3.2.1.2. SATL and NATL: On an annual time scale, warmer than usual temperatures in the southern Atlanticare associated with significant positive rainfall anomalies at a few stations located near the mouth of theAmazon River. More significant cases are found during the MAM period at the peak of the rainy season(Table III, Figure 11(a)).
On an annual time scale, the signal associated with a colder than normal SATL is stronger: significantanomalies are found at 22% of the stations of the Amazon basin (Table III). The anomalies have a bipolarorganization: in the northern and the northeastern regions of the Amazon basin a deficit of rain prevails (−0.9standard deviation) and is significant at 58% of the NEA stations, whereas in the southern basin an excessof rain dominates but is hardly significant (Figure 11(b)). This annual pattern is also developed in autumn,winter, and especially in spring, although the negative anomalies in the northeastern basin are weaker thanthe annual ones (−0.6 standard deviation in spring). The extension of significant positive anomalies in theSA is greater in spring and summer.
Copyright 2002 Royal Meteorological Society Int. J. Climatol. 22: 1663–1686 (2002)
AMAZON BASIN RAINFALL VARIABILITY AND SST 1677
Figure 11. Rainfall anomalies composite during (a) a warm SATL autumn (MAM), (b) cold SATL years (September–August), and(c) cold SATL years that are not associated with other SST anomalies. Circles represent the anomalies that are significant at the 90%
confidence level. The non-significant anomalies are represented by triangles
When the southern Atlantic is cold and no other oceanic anomaly is observed, rainfall anomalies in thenortheastern basin (dryness) weaken compared with the anomalies computed for all the cases in which SATLis involved (Figure 11(c)). This may be due to the exclusion of the years when cold SSTs in the southernAtlantic are associated with El Nino. We can conclude that a cold southern Atlantic has a smaller effectthan El Nino on rainfall in the NEA. On the other hand, an excess of rain in the SA, in particular in thesoutheastern Amazon, is more often significant and stronger when considering isolated cold SATL cases. Thedeficit of rain in the Ecuadorian Amazon (Figure 11(c)) is in agreement with Vuille et al. (2000).
A cold NATL year is associated with positive rainfall anomalies in the NEA basin, where they are significantat 25% of the stations (not shown). The anomalous rainfall is detected mostly in autumn, the rainy season ofthat region, and is equivalent to 0.5 of a standard deviation (Figure 12(a)). Negative rainfall anomalies areobserved in some northern and western locations of the Amazon basin.
On an annual time scale, very few significant rainfall anomalies are associated with a warmer than usualNATL (not shown). However, in autumn, negative anomalies (−0.5 standard deviation) are observed in thenortheastern part of the Amazon basin, where 41% of the anomalies are significant, and in the southeasternAmazon (Figure 12(b)). In winter, a significant deficit of rain is observed in most of the basin, especially inits southern part (Figure 12(c)).
In conclusion, opposed rainfall anomalies in the NEA are associated with opposed SST anomalies in theSATL, with a deficit of rain when the southern Atlantic is cold and an excess of rain when the southern
Copyright 2002 Royal Meteorological Society Int. J. Climatol. 22: 1663–1686 (2002)

1678 J. RONCHAIL ET AL.
Figure 12. Rainfall anomalies composite during (a) a cold NATL autumn (MAM), (b) a warm NATL autumn, and (c) a warm NATLwinter (JJA). Circles represent the anomalies that are significant at the 90% confidence level. The non-significant anomalies are
represented by triangles
Atlantic is warm, this last signal being much weaker than the former. In the SA basin, a widely spread butnon-significant excess of rain is observed when the southern Atlantic is cooler than normal.
In autumn, opposed rainfall anomalies in the NEA are associated with opposed SST anomalies in theNATL: an excess (a deficit) of rain is related to colder (warmer) northern Atlantic temperatures. Winter isdry in most of the basin when the northern Atlantic is warmer than usual.
3.2.2. Combined basin analysis. For the short 1977–99 period, it is normally difficult to encounter enoughsamples of specific combinations of events in the three oceanic basins to respond to the following questions:
• Is the El Nino-related deficit of rain in the NEA basin lower when warm SSTs prevail in thesouthern Atlantic?
• Or, on the contrary, is the deficit of rain reinforced when El Nino combines with cold SSTs in thesouthern Atlantic?
However, available data, as shown in Table IV, allow us to attempt to answer these and other related questions.The combined events are analysed on an annual time scale.
The combined effects of El Nino and cold SSTs in the SATL are a reinforcement of the negative anomaliesin the NEA (−1.3 standard deviation) compared with El Nino or cold SATL events (Figure 13(a)). This
Copyright 2002 Royal Meteorological Society Int. J. Climatol. 22: 1663–1686 (2002)

AMAZON BASIN RAINFALL VARIABILITY AND SST 1679
Table IV. Number of events and number and percentage of stations with significantanomalies for different combinations of oceanic events; w, warm; c, cold
Combined oceanic events No. of events Significant anomalies
No. %
SATLc + El Nino, 1982, 1991 2 71 29SATLw + NATLc, 1983, 1984, 1988 3 49 20SATLw + NATLw, 1987, 1995, 1997 3 24 10NATLw + Nina, 1995,1998,1999 2 47 19
is consistent with Molinier et al. (in press). In the SA, the occurrence of positive rainfall anomalies aremore frequent than during cases of El Nino (Figure 9(a)) and less frequent than during cases of cold SATL(Figure 11(b)). These results confirm that rainfall anomalies in the SA basin are associated with cold eventsin the southern Atlantic.
Cold SSTs in the NATL and warm SSTs in the SATL combine with efficiency as they are associated withpositive rainfall anomalies in the NEA that are stronger (1.1 standard deviation) and much more widelyextended than those associated with single cold NATL or warm SATL events (Figure 13(b)). This result isconsistent with the findings by Nobre and Shukla (1996).
The last two combined oceanic events are usually associated with inverse rainfall anomalies in the NEA(Table IV). In the first case, the excess of rain in NEA, usually associated with warm SSTs in the SATL, is stillapparent but spatially reduced and non-significant, and dry conditions, usually associated with warm SSTs inthe northern Atlantic, prevail in most of the southern basin (Figure 13(c)). In the second case (Figure 13(d)),a similar diagnosis can be made: the association of La Nina and warm SSTs in the NATL seems to reducethe excess of rain in the NEA and to reinforce the rainfall deficit in the southern basin, as has already beennoted by Pezzi and Cavalcanti (2001).
In conclusion, some oceanic events associated with the same (different) sign rainfall anomalies in the NEAdo increase (decrease) the rainfall anomaly when they are combined. This is consistent with the findings ofUvo et al. (1998) in the Nordeste.
4. FURTHER COMMENTS AND CONCLUSION
The relationships between tropical SST anomalies and rainfall anomalies in the Amazon basin have beenstudied during the 1977–99 period using cluster and composite analyses. Both of them show the principalcharacteristics of the Pacific and Atlantic SST-related rainfall anomalies. Most of the results of both analysesare consistent. However, when focusing on warm or cold oceanic events, the composite analysis moreaccurately describes rainfall anomalies associated with SST anomalies, and underlines the particular natureof the NEA. The cluster analysis gives equal importance to all the years of the 1977–99 period and to allthe stations of the Amazon basin. It is probable that the results have mixed together different signals andunderlines the complex nature of rainfall origins in certain regions of the Amazon basin. The cluster analysishas been useful in discovering patterns of rainfall anomalies that are not associated with tropical SSTs andalso, as is detailed further, that not all dry or wet events in the NEA are associated with SST anomalies.
The main results of the composite analyses are summarized in Figure 14. They are proposed for three ofthe four regions described in Section 2.1: NEA, NA, and WA. Ecuadorian stations have been excluded fromthe WA because they have some unique features. They are treated separately. The different behaviours of thesouthwestern and southeastern parts of the Amazon basin also justify the partitioning of these regions. Themean rainfall anomalies for each oceanic event and for each season are given for the six resulting regionsof the Amazon basin. The annual and seasonal standard deviations are provided in order to evaluate theanomalies in millimetres.
Copyright 2002 Royal Meteorological Society Int. J. Climatol. 22: 1663–1686 (2002)

1680 J. RONCHAIL ET AL.
Figure 13. Rainfall anomalies composite during the annual (September–August) following combinations: (a) El Nino + cold SATL,(b) warm SATL + cold NATL, (c) warm SATL + warm NATL, (d) La Nina + warm NATL. Circles represent the anomalies that are
significant at the 90% confidence level. The non-significant anomalies are represented by triangles
4.1. In the NEA basin
The main significant SST-related rainfall anomalies in the Amazon basin occur in the NEA basin, north of5 °S and east of 60 °W, i.e. in a near oceanic and equatorial position. This has already been documented byRoucou (1997) and is consistent with Liebmann and Marengo (2001) and Molinier et al. (in press).
Copyright 2002 Royal Meteorological Society Int. J. Climatol. 22: 1663–1686 (2002)

AMAZON BASIN RAINFALL VARIABILITY AND SST 1681
NEA Hyd. Year DJF MAM JJA SONEl Niño -1.1 -0.7 -0.6-0.6 -0.7La Niña 1 0.5 0.6 0.7SATL c -0.9 -0.5 -0.5 -0.6SATL w 0.5NATL c 0.9 0.5NATL w -0.5
STD 808 393 464 222 181
NA Hyd. Year DJF MAM JJA SONEl Niño -0.6 -0.6 -0.6La Niña 0.7 0.8SATL c -0.7 -0.6SATL wNATL cNATL w
STD 423 154 198 191 145
SE Amaz. Hyd. Year DJF MAM JJA SONEl Niño -1La NiñaSATL c
SATL c only 0.6SATL wNATL c 0.3NATL w
STD 376 246 161 35 130
SW Amaz. Hyd. Year DJF MAM JJA SONEl NiñoLa NiñaSATL c 0.5SATL wNATL cNATL w
STD 329 196 134 53 125
Ecuador Hyd. Year DJF MAM JJA SONEl Niño 0.33La NiñaSATL c
SATL c only -0.7SATL wNATL cNATL w
STD 200 76 96 53 70
WA Hyd. Year DJF MAM JJA SONEl Niño -0.6 -0.5 -0.5La NiñaSATL cSATL wNATL cNATL w
STD 329 172 203 190 160
-0.5-0.5
-0.4
-0.4-0.4
-0.4-0.5
-0.5-0.6
Figure 14. Main SST-related rainfall anomalies (standard deviation) in the Amazon basin, by region: c, cold; w, warm; ‘SATL c only’,cold events in the SATL that do not combine with other oceanic events. Underlined data mean that more than 40% of the stations havesignificant anomalies; non-underlined data mean that the percentage of stations with significant anomalies is between 20 and 40%. Bold
data are positive, italic data are negative. STD denotes standard deviation. The values of standard deviation are in millimetres
On an annual time scale, abnormally wet conditions in the NEA are associated with La Nina and relativelycold SSTs in the NATL, whereas a relative dryness is related to El Nino and cold SSTs in the SATL.
In autumn, warm events in the SATL (NATL) are also associated with positive (negative) rainfall anomaliesin the NEA. Generally, the strongest signals in the NEA are observed in autumn, the rainiest season, withthe exception of spring for cold events in the SATL and summer for El Nino (Figure 14).
El Nino events are associated with the strongest, the most widely spread, and the longest-lasting anomalies:on an annual time scale, more than 70% of the stations in the NEA have a significant deficit of rainfallhigher than one standard deviation. The beginning of the rainy season is delayed and its end occurs earlier,as mentioned by Marengo et al. (2001), so that the El Nino-related rainfall anomalies involve the whole year.The negative anomalies are further reinforced when El Nino is associated with cold SSTs in the SATL, asdescribed by Pezzi and Cavalcanti (2001) in a modelling experiment.
On the other hand, the rainfall anomalies associated with La Nina and SST anomalies in the Atlanticbasins are weaker and less widely spread in the NEA basin. The La Nina-related anomalies are observed
Copyright 2002 Royal Meteorological Society Int. J. Climatol. 22: 1663–1686 (2002)

1682 J. RONCHAIL ET AL.
during three quarters of the year (with a delayed ending of the rainy season), whereas other anomalies onlylast one or two quarters. The result is that the spatial and temporal impacts of oceanic events associatedwith excesses of rain are smaller than those associated with dryness. It is noticeable that the combination ofoceanic events associated with an excess of rain in the NEA, as cold SSTs in the NATL and warm SSTs inthe SATL, increases the positive rainfall anomalies, as commented on by Nobre and Shukla (1996). However,the combination of oceanic events associated with opposed rainfall anomalies in the NEA tends to minimizethe anomalies.
The ENSO-related rainfall anomalies in the NEA region are also observed in the nearby regions of theAmazon basin, in the summer, autumn and winter of the respective hemispheres. In the NA (in the NorthernHemisphere) both phases of the SO are important features, whereas only the El Nino phase is important in thesoutheastern Amazon (Figure 14). In consequence, one can observe a time–space continuity between the ElNino-related rainfall anomalies in the NEA, those in the NA and southeastern Amazon, and those in northernSouth America and in the Nordeste of Brazil. Furthermore, during the boreal summer and autumn of a coldSATL event, negative anomalies are registered in the NA as in NEA.
The current understanding of the associations between rainfall anomalies in northeastern Brazil and SSTsin the tropical ocean stems from Hastenrath and Heller (1977). They explained that Secas in the Nordeste areassociated with enhanced (weakened) surface pressure and relatively cold (warm) water in the SATL (NATL).The pressure anomaly field explains enhanced (weakened) southerly (northerly) trade winds, resulting in anorthward-displaced intertropical convergence zone (ITCZ). They also underlined the relationship betweenSecas and El Nino events in the Pacific. Aceituno (1988) described similar features associated with diminishedrainfall in the Amazon basin. Marengo (1992) noted the strong North Atlantic high, the accelerated northeasttrades during cold SST events in the northern Atlantic, and the enhanced boundary-layer moisture transportfrom the North Atlantic into the Amazon. Nobre and Shukla (1996) associated the negative (positive) rainfallanomaly in the Amazon region and in the Nordeste, during autumn, with an early withdrawal of the ITCZtoward the warm SSTs over the northern (southern) Atlantic. Kousky et al. (1984), followed by Marengoand Hastenrath (1993), described a direct relationship between the SST anomalies in the eastern Pacific andthe rainfall deficit in northeastern Brazil with, during El Nino years, a strong Walker-type circulation withsinking motion over the eastern Amazon, northeast Brazil and the PAC. Attempts to explain the ENSO–relatedSST variability in the tropical Atlantic Ocean were made by many. Among the most notable, Enfield andMayer (1997) emphasized the dynamics of trade winds and Hastenrath (2001) identified Atlantic upper-airmechanisms through which the ENSO affects surface pressure and SST fields in the tropical Atlantic.
When considering the results of the cluster and the composite analyses, it appears that some deficits andexcesses of rain in the NEA are not associated with SST anomalies in the tropical oceans. Table V displaysthe percentage of months with deficit or excess of rain in the NEA that occurs during oceanic events andthe percentage of months during ‘normal’ oceanic periods (without an SST anomaly). Dryness can hardlybe observed in summer when there is no SST anomaly, especially in the Pacific. On the other hand, duringthe other seasons of the year, nearly a third of the months with rainfall deficits in the NEA are observedduring ‘normal’ oceanic periods. In autumn, an excess of rain is closely related to oceanic events. However,in spring and summer, 50% of the wet months occur without an SST anomaly in the tropical Pacific andAtlantic oceans.
4.2. The SA and WA basins
There are few spatially coherent and/or significant SST-related rainfall signals in the WA and SA basins(Figure 14). According to Moron et al. (1995) and Fu et al. (1999), land surface condition variability in theNEA is limited and convection is more affected by the changes of the SST in the adjacent oceans. On theother hand, the weakness of the rainfall–SST relationships in the SA may be due to the fact that land surfacetemperatures vary greatly and thus control the convection. Also, synoptic factors are likely to be importantin the SA and WA, which explain rainfall variability.
Nonetheless, tendencies toward dryness have been identified during El Nino in the SA and WA (summer),during La Nina south of 10 °S (winter), and when the northern Atlantic is anomalously warm in the southern
Copyright 2002 Royal Meteorological Society Int. J. Climatol. 22: 1663–1686 (2002)

AMAZON BASIN RAINFALL VARIABILITY AND SST 1683
Table V. Percentage of months with deficit or excess of rain in the NEA that occurs duringwarm or cold oceanic events or during periods without an SST anomaly. The sums of thepercentages can be greater than 100%, as a rainfall anomaly can be associated with morethan one SST anomaly. Rainy and dry months are those defined by the cluster analysis
Rain deficit in NEA
El Nino Cold SATL Warm NATL Without SST anomalies
DJF 60 13 33 13MAM 44 22 44 28JJA 30 30 21 42SON 26 35 22 30
Rain excess in NEA
La Nina Warm SATL Cold NATL Without SST anomalies
DJF 22 22 33 58MAM 39 36 43 21JJA 26 43 35 26SON 40 20 10 45
basin. A tendency toward an excess of rain is observed south of 10 °S when the southern Atlantic is cold(Figure 14). Specific SST-related rainfall anomalies are observed in eastern Ecuador: excess of rain duringEl Nino and deficit when the southern Atlantic is anomalously cold. Regional–global factors, such as SSTvariability, may interfere with the local and synoptic factors providing rainfall in the WA and SA.
The activity of extra-tropical perturbations, which is an important synoptic factor of rainfall variabilityin the southwestern Amazon and WA (Virji and Kousky, 1983; de Oliveira and Nobre, 1986; Ronchail,1989; Garreaud and Wallace, 1998; Liebmann et al., 1999; Seluchi and Marengo, 2000) help explain theENSO-related rainfall variability in these regions as it does in southeastern South America (SESA). InSESA, during El Nino (in spring and during the following winter), abnormally wet conditions have beenexplained by mid-latitude blocking in the southeastern Pacific combined with an intense subtropical jet thatfavoured the maintenance of persistent active frontal systems (Kousky et al., 1984; Aceituno, 1988). Cazeset al. (1996) associated the wet El Nino conditions with a northward shift of the extra-tropical cyclonictrajectories due to blocking in the southeastern Pacific. Dry conditions during La Nina are associated withinverse atmospheric conditions.
The SA and WA are at the boundary between SESA and the NEA, two regions where the ENSO signals arestrong and inverse. Consequently, the El Nino-related signal in the southwestern Amazon and WA is weaklysignificant on an annual time scale, probably because the rainfall anomalies oscillate between an excess ofrain associated with an intense frontal activity during the colder period of the year, as occurs in SESA, anda deficit of rain in summer at the core of the El Nino activity in the NA. During La Nina, weak activity ofthe extra-tropical perturbations could explain the deficit of rain in the SA, as is found in SESA. These resultsare consistent with those of Ronchail (1998) concerning the lowlands of Bolivia.
Rainfall in the SA is also dependent on the northwesterly flow (northerly trade winds deviated by theAndes) and on the moisture transport from the NATL, as hypothesized by Marengo (1992). Some evidence ofthat relationship is shown in our work. During warm NATL events, negative rainfall anomalies in the wholeAmazon basin may be explained by negative pressure anomalies above the warm northern Atlantic watersand by the weak trade winds resulting in a lack of moisture advection. Moreover, in winter, the local lack ordecrease of moisture, in particular in the southern basin, could explain why the warm NATL-related drynessis particularly important during this season. However, as seen earlier, the total amount of rainfall is very lowin winter. A few raindrops can misleadingly exaggerate anomalies. In any event, this result is consistent withMolinier et al. (in press), who found a negative correlation between rainfall and NATL SST anomalies in
Copyright 2002 Royal Meteorological Society Int. J. Climatol. 22: 1663–1686 (2002)

1684 J. RONCHAIL ET AL.
the southwestern part of the Amazon basin. The upcoming studies of the meteorological community on thelow-level jet to the east of the Andes should provide more elements about Atlantic SST-related meridionalmoisture transport in South America.
In the southwestern Amazon, an excess of rainfall is observed during cold events in the southern Atlantic,mainly in summer and spring. This is consistent with the fact that the 1990s floods in the Mamore River(Bolivia) occurred simultaneously with cold SSTs in the southern Atlantic (Ronchail and Bourrel, 2001).Moreover, cold events in the southern Atlantic that do not combine with other oceanic events are associatedwith some significant excess of rain in the southeastern Amazon. This merits further investigation ontropospheric conditions (wind, geopotential height, etc.) that associate the SST variability over the southernAtlantic Ocean and rainfall variability in the SA, as has been done for the SESA region by Barros et al. (2000)and Robertson et al. (2000). For instance, excesses of rain in the southeastern Amazon basin (Figure 5(d)) havebeen associated with strong low-level westerly wind anomalies at a tropical latitude and with negative SSTanomalies in the SATL and in the subtropical southwestern Atlantic, an area that is outside the oceanic domainthat has been considered in the present work (Ronchail and Cochonneau, 2002). In addition, all the studiesconcerning the South American convergence zone and its variability (e.g. see Nogues-Peagle and Mo, 1997;Liebmann et al., 1999) are important steps toward the comprehension of rainfall structures that are associatedwith tropical SSTs and those that are not associated with tropical SSTs, as shown in the cluster analysis.
The relationship between the oceanic warm or cool events and the rainfall anomalies, especially for thenorthern Amazon area, has already been commented on. In our work we provide some additional resultsabout the well-defined northeastern region of the Amazon basin, with emphasising on quantitative results, onseasonal aspects, and on the combined effects of SST anomalies. The different behaviours of the NEA basinand the other regions of the Amazon basin are commented on. The SST-related rainfall anomalies in the SAand WA are few, except in southeastern Amazon where the El Nino signal is strong. Otherwise, the weaksignals that dominate often occur during the driest part of the year, so that they are hardly perceptible on theannual time scale.
As it is not possible to individualize certain oceanic signals during the 1977–99 period, further investigationcovering a longer period and involving more oceanic events is needed. Further investigations that involvethe tropical and extra-tropical atmosphere and ocean SSTs in the global ocean are needed to understand therainfall variability in the SA and WA and that part of the rainfall variability in the NEA that is not associatedwith tropical SSTs.
ACKNOWLEDGEMENTS
Special thanks are given to Henri Laurent, Patricio Aceituno, and to other reviewers of this paper for theirhelpful comments.
NOTE
1. Agencia Nacional de Energia Electrica (ANEEL); Institut de Recherche pour le Developpement (IRD); Universidade de Brasilia(UnB).
REFERENCES
Aceituno P. 1988. On the functioning of the southern oscillation in the South American sector: surface climate. Monthly Weather Review116: 505–524.
Barros V, Gonzalez M, Liebmann B, Camilloni I. 2000. Influence of the South Atlantic convergence zone and South Atlantic surfacetemperature on interannual summer rainfall variability in southeastern South America. Theoretical and Applied Climatology 67:123–133.
Cazes G, Pisciottano G, Terra R. 1996. Climate variability in southeastern South America and anomalous circulation patterns duringNovember: simulation with a AGCM. In: Actas VII Congresso Latinoamericano e Iberico de Meteorologia, Buenos Aires, Argentina;335–336.
De Oliveira AS, Nobre CA. 1986. Interactions between frontal systems in South America and tropical convection over the Amazon.In: Preprints, Second International Conference on Southern Hemisphere Meteorology, Wellington. American Meteorological Society:Boston, MA; 56–59.
Enfield DB, Mayer A. 1997. Tropical Atlantic sea surface temperature variability and its relation to El Nino–southern oscillation.Journal of Geophysical Research 102: 929–945.
Copyright 2002 Royal Meteorological Society Int. J. Climatol. 22: 1663–1686 (2002)
AMAZON BASIN RAINFALL VARIABILITY AND SST 1685
Fielding AH. 2002. Cluster analysis: an online tutorial. http://asio.jde.aca.mmu.ac.uk/multivar/ca.htm. [Last accessed 6th September,2002].
Figueroa SN, Nobre CA. 1990. Precipitation distribution over central and western tropical South America. Climanalise 6: 36–40.Fu R, Zhu B, Dickinson RE. 1999. How do atmosphere and land surface influence seasonal changes in the tropical Amazon? Journal
of Climate 12: 1306–1321.Garreaud R, Wallace J. 1998. Summertime incursions of midlatitude air into subtropical and tropical South America. Monthly Weather
Review 126: 2713–2733.Grimm AM, Ferraz SET, Gomes J. 1998. Precipitation anomalies in southern Brazil associated with El Nino and La Nina events.
Journal of Climate 11: 2863–2880.Harzallah A, Rocha de Aragao J, Sadourny R. 1996. Interannual rainfall variability in northeast Brazil: observation and model simulation.
International Journal of Climatology 16: 861–878.Hastenrath S. 2001. Upper air mechanisms of the southern oscillation in the tropical Atlantic sector. Journal of Geophysical Research
105: 14 997–15 009.Hastenrath S, Heller L. 1977. Dynamics of climatic hazards in northeast Brazil. Quarterly Journal of the Royal Meteorological Society
110: 77–92.Hiez G. 1977. L’homogeneite des donnees pluviometriques. Cahiers ORSTOM, serie Hydrologie 14: 129–172.Hiez G, Cochonneau G, Sechet P, Fernandes UM. 1992. Application de la methode du vecteur regional a l’analyse de la pluviometrie
annuelle du bassin amazonien [Application of the regional vector method to the analysis of annual pluviometry of the Amazon basin].Veille Climatique Satellitaire 43: 39–52.
Horel JD, Hahmann AN, Geisler JE. 1989. An investigation of the annual cycle of convective activity over the tropical Americas.Journal of Climate 2: 1388–1403.
Houghton RW, Tourre YM. 1992. Characteristics of low-frequency sea surface temperature fluctuations in the tropical Atlantic. Journalof Climate 5: 765–771.
Kousky VE. 1988. Pentad outgoing longwave radiation climatology for the South American sector. Revista Brasileira de Meteorologia3: 217–231.
Kousky VE, Kayano MT, Cavalcanti IFA. 1984. A review of the southern oscillation: oceanic, atmospheric circulation changes andrelated rainfall anomalies. Tellus A 36: 490–504.
Liebmann B, Marengo JA. 2001. Interannual variability of the rainy season and rainfall in the Brazilian Amazon basin. Journal ofClimate 14: 4308–4317.
Liebmann B, Kiladis G, Marengo J, Ambrizzi T, Glick J. 1999. Submonthly convective variability over South America and the SouthAtlantic convergence zone. Journal of Climate 12: 1877–1891.
Marengo J. 1992. Interannual variability of surface climate in the Amazon basin. International Journal of Climatology 12: 853–863.Marengo J, Hastenrath S. 1993. Case studies of the extreme climatic events in the Amazon basin. Journal of Climate 6: 617–627.Marengo J, Nobre CA, Sampaio G. 1998. On the associations between hydrometeorological conditions in Amazonia and the extremes
of the southern oscillation. Bulletin de l’Institut Francais d’Etudes Andines 27: 789–802.Marengo J, Liebmann B, Kousky V, Filizola N, Wainer I. 2001. Onset and end of the rainy season in the Brazilian Amazon basin.
Journal of Climate 14: 833–852.Molion LCB. 1987. Climatologia dinamica da regiao Amazonica: mecanismos de precipitacao. Revista Brasileira de Meteorologia 2:
107–117.Molion LCB. 1993. Amazonian rainfall and its variability. In: Hydrology and water Management in the Humid Tropics. Cambridge
University Press: Cambridge; 99–111.Molinier M, Guyot JL, de Oliveira E, Guimaraes V. 1996. Les regimes hydrologiques de l’Amazone et de ses affluents. In: Hydrologie
tropicale: geoscience et outil pour le developpement. IAHS publication 238. IAHS: Paris; 209–222.Molinier M, Ronchail J, Guyot JL, Cochonneau G, de Oliveira E, Guimaraes V. In press. Hydrological variability in the Amazon
drainage basin and African tropical basins. Hydrological Processes.Montecinos A, Diaz A, Aceituno P. 2000. Seasonal diagnostic and predictability of rainfall in subtropical South America based on
tropical Pacific SST. Journal of Climate 13: 746–758.Moron V, Bigot S, Roucou P. 1995. Rainfall variability in subequatorial America and Africa and relationships with the main sea-surface
temperature modes (1951–1990). International Journal of Climatology 15: 1297–1322.Moura AD, Shukla J. 1981. On the dynamics of droughts in northeast Brazil: observations, theory and numerical experiments with a
general circulation model. Journal of the Atmospheric Sciences 38: 2653–2675.Nobre P, Shukla J. 1996. Variations of sea-surface temperature, wind stress and rainfall over the tropical Atlantic and South America.
Journal of Climate 9: 2464–2479.Nogues-Peagle J, Mo KC. 1997. Alternating wet and dry conditions over South America in summer. Monthly Weather Review 125:
279–291.Pezzi LP, Cavalcanti IFA. 2001. The relative importance of ENSO and the tropical Atlantic sea surface temperature anomalies for
seasonal precipitations over South America: a numerical study. Climate Dynamics 17: 205–212.Rao V, Hada K. 1987. Characteristics of rainfall over Brazil: seasonal variations and connections with the southern oscillation. INPE
4432-PRE/1234, Sao Jose dos Campos, Brazil.Robertson AW, Mechoso CR, Kim Y. 2000. The influence of Atlantic sea surface temperature anomalies on the North Atlantic
oscillation. Journal of Climate 13: 122–138.Rogers JC. 1988. Precipitation variability over the Caribbean and tropical Americas associated with the southern oscillation. Journal of
Climate 1: 172–182.Ronchail J. 1989. Advecciones polares en Bolivia: caracterizacion de los effectos climaticos. Bulletin de l’Institut Francais d’Etudes
Andines 18: 65–73.Ronchail J. 1997. Interdecadal variability of rainfall in Bolivia and sea-surface temperatures. In: Preprints for the Fifth International
Conference on Southern Hemisphere Meteorology and Oceanography,7–12 April, Pretoria, South Africa. American MeteorologicalSociety: Boston, MA.
Copyright 2002 Royal Meteorological Society Int. J. Climatol. 22: 1663–1686 (2002)

1686 J. RONCHAIL ET AL.
Ronchail J. 1998. Variabilite pluviometrique en Bolivie lors des phases extremes de l’Oscillation Australe du Pacifique (1950–1993).Bulletin de l’Institut Fancais d’ Etudes Andines 27: 687–698.
Ronchail J, Bourrel L. 2001. Enchentes, chuvas e circulacao atmosferica na bacia amazonica boliviana. In: Communication to CongremetVIII–Climet IX, 7–11 May, Buenos-Aires.
Ronchail J, Cochonneau G. 2002. Main patterns of summer rainfall variability and associated circulation in western and southernAmazon. In: Communication to the VAMOS/CLIVAR Conference on South American Low-level Jet , Santa Cruz de la Sierra, Bolivia,5–7 February.
Roucou P. 1997. Impact des temperatures de surface oceanique d’echelle globale sur la dynamique de l’atmosphere et les precipitationstropicales en Amerique du Sud a l’est des Andes: diagnostic et simulation numerique. Thesis of the Centre de Recherche deClimatologie, ESA5080 CNRS/Universite de Bourgogne, France.
Seluchi M, Marengo J. 2000. Tropical–midlatitude exchange of air masses during summer and winter in South America: climatic aspectsand examples of intense events. International Journal of Climatology 20: 1167–1190.
Trenberth KE. 1997. The definition of El Nino. Bulletin of the American Meteorological Society 78: 2771–2777.Uvo CB, Repelli CA, Zebiak SE, Kushnir Y. 1998. The relationships between tropical Pacific and Atlantic SST and northeast Brazil
monthly precipitation. Journal of Climate 11: 551–562.Virji H, Kousky VE. 1983. Regional and global aspects of low latitude frontal penetration in Amazonas and associated tropical activity.
In: Preprints, First International Conference on Southern Hemisphere Meteorology, Sao Jose dos Campos. American MeteorologicalSociety: Boston, MA; 215–220.
Vuille M, Bradley RS, Keimig F. 2000. Climate variability in the Andes of Ecuador and its relation to tropical Pacific and Atlantic seasurface temperature anomalies. Journal of Climate 13: 2520–2535.
Wilks DS. 1995. Statistical Methods in the Atmospheric Sciences. Academic Press: San Diego.
Copyright 2002 Royal Meteorological Society Int. J. Climatol. 22: 1663–1686 (2002)