interagency ecological program for the san … synopsis of issues in developing the san joaquin...
TRANSCRIPT
CONTENTS
2 Of Interest to Managers
3 CALFED Compendium
5 Interagency Ecological Program Quarterly Highlights—Winter 2001
News From Around the Estuary
16 Simplified Conversions Between Specific Conductance and Salinity Units for Use with Datafrom Monitoring Stations
18 Results of 2000 Salt Marsh Harvest Mouse Surveys in Suisun Marsh
20 Suisun Marsh Mapping
21 Preliminary Analysis of Long-term Benthic Community Change in Grizzly Bay
Contributed Papers
23 Progress and Development of Delta Smelt Culture: Year-end Report 2000
29 Synopsis of Issues in Developing the San Joaquin River Deep Water Ship Channel Dissolved Oxygen TMDL
36 Announcements
38 Paper Accepted for Publication in Canadian Journal of Fisheries and Aquatic Sciences
39 Delta Inflow, Outflow, and Water Project Operations
Interagency Ecological Program for the San Francisco Estuary
IEP NEWSLETTER
V O LU M E 1 4 , N U M B E R 1 , W I N T E R 2 0 0 1
2 IEP Newsletter
Of Interest to Managers
OF INTEREST TO MANAGERS
Zach Hymanson, [email protected]
Salt Marsh Harvest Mouse Surveys in Suisun Marsh
Patty Finfrock reports on results of the 2000 saltmarsh harvest mouse (SMHM) surveys in eight SuisunMarsh conservation areas totaling over 1,300 acres (seepage 18). The SMHM is a threatened species and thesesurveys are regularly completed to determine the status ofthe SMHM in Suisun Marsh. Results from 2000 suggestthe SMHM is well distributed throughout the conserva-tion areas, but SMHM abundance declined from 1999 lev-els. These declines are attributed to “the natural cyclicrhythm of rodent populations.” In 1999 and 2000, DWRstaff also collected hair follicle samples from capturedmice. These samples will be used to develop geneticmarkers to allow for more definitive identification ofSMHM and the co-occurring common western harvestmouse. Genetic markers will also be used to test the valid-ity of morphological characteristics now used in speciesidentification and to determine if inbreeding is occurring.
Long-term Changes in Grizzly Bay Benthos
Heather Peterson is analyzing benthic communitydata and physical data from the DWR EnvironmentalMonitoring Program to understand the factors responsiblefor changes in the benthos of Grizzly Bay (see page 21).Results show the introduction of the Asian clam had a pro-found effect on the composition of the benthic commu-nity. Establishment of the Asian clam has also affectedhow the community changes in response to physical fac-tors associated with water year type and X2. Heather’swork, along with the work of other researchers, clearlyshow the dramatic effects introduced species can have onthe biota in San Francisco Estuary.
Suisun Marsh Habitat Mapping
Todd Keeler-Wolf and others report on an 18-monthsurvey to document and classify habitats in the SuisunMarsh (see page 20). Accurate information of this type isessential to the management and conservation of this spe-cial management area. This latest survey was completedusing new GIS technology and satellite imagery. Resultswill be used to answer habitat-based questions as well asfacilitate future project planning. Comparisons with ear-lier surveys will provide information on how marsh vege-tation has changed with time.
Delta Smelt Culture Progresses
Bradd Baskerville-Bridges and others report on theprogress in successfully mass-culturing delta smelt (seepage 23). Several physical improvements in the culturefacility along with results of experiments aimed at opti-mizing culture conditions and delta smelt survival high-light year 2000 accomplishments. Developing soundmethods for the mass culture of this threatened species isan ideal way to provide delta smelt for research withoutfurther diminishing the natural stock. In addition, theresults of this work have provided important informationabout the life history and reproductive biology of deltasmelt.
Development of a Dissolved Oxygen TMDL for the San Joaquin River
G. Fred Lee and Anne Jones-Lee provide a synopsisof the situation and issues important to developing a totalmaximum daily load (TMDL) for the San Joaquin River(see page 29). This stakeholder driven process is requiredby the Central Valley Regional Water Quality ControlBoard, which classified the San Joaquin River DeepWater Ship Channel as impaired in 1994 due to thechronic reoccurrence of low dissolved oxygen levels inthis stretch of the river. The process described in this arti-cle exemplifies the type of approach that is necessary toresolve many of the long-standing concerns in the Sacra-mento-San Joaquin Delta.
IEP Newsletter 3
CALFED COMPENDIUM
CALFED SCIENCE CONFERENCE SUMMARY REPORT
Randy [email protected]
A summary of the October 3-5, 2000 CALFED Sci-ence Conference is available at http://www.iep.water.ca.gov/calfed/sciconf/. A very limitedsupply of hard copies is also available. For those withoutweb access, a hard copy can be obtained by calling LyndaParrish at (916) 227-7533, or contacting her by e-mail [email protected].
The 50-page report, written by Randy Brown, FredNichols, and Larry Smith, provides conference planningdetails, recommendations about future conferences, con-ference highlights, and brief summaries of individual pre-sentations. The website also includes abstracts of oral andposter presentations, the affiliation of the 800 plus attend-ees and rapporteurs’ notes from individual technical ses-sions.
BAY-DELTA SCIENCE CONSORTIUM
Randy [email protected]
For the past several months a small group of scientistshas met about every four to six weeks to discuss sciencecoordination in the Bay-Delta and the merits of someinfrastructure changes. The impetus for these discussionscame from IEP’s need to consider new office and labora-tory space for Stockton and Sacramento scientists andadministrators and CALFED’s need for science coordina-tion to support adaptively managed restoration. InitiallyCALFED asked Perry Herrgesell and me to develop a pro-posal to acquire a Delta site that would house what we ini-tially called the CALFED Science Center. We establisheda small advisory committee to help evaluate various sitesand provide guidance as to facilities needed to house staff,laboratories, storage, maintenance, etc.
The science center discussions evolved into exploringways to achieve better science coordination, with newfacilities in the Delta and on the UC Davis campus beingpart of the mix. We agreed on the tentative consortiumtitle, suggested by Jeff Mount of UC Davis, and alsoagreed to limit our scope to the Bay-Delta. Finally, wethought it appropriate to include outreach as an essentialprogram element. At our January meeting, Steve Barbata(Delta Science Center at Big Break) and John Cain (Nat-ural Heritage Institute) described their vision for the DeltaScience Center at Big Break—a center with integratededucation, science, and restoration goals. This center, withsecured funding from Propositions 12 and 13 and othersources, will complement the proposed consortium’s sci-ence and outreach efforts.
The advisory committee has expanded in recentmonths and now includes representatives from the Rom-berg Tiburon Center, the San Francisco Estuary Institute,the Point Reyes Bird Observatory, the Delta Science Cen-ter at Big Break, CALFED, USGS, UCD, DWR, and theUSFWS. Stakeholder members are from the Natural Her-itage Institute and the Metropolitan Water District ofSouthern California.
The group’s present activities center around develop-ing plans for new facilities in the Delta (mainly field ele-ments) and on campus at Davis (senior scientists andmanagers) and stimulation of working partnerships.Chuck Armor, Zach Hymanson, and Brian Cole are work-ing with USGS, DFG, USFWS and DWR managers toassess staff assignments to the two locations and facilitiesneeded at each site. Jeff Mount drafted a Memorandum ofUnderstanding intended to foster communications andcoordination among Bay-Delta science organizations.Kim Taylor of CALFED drafted core principles for theconsortium. The team is also learning more about activi-ties of watershed groups, such as the Sacramento RiverWatershed Program, to help determine how watershedprograms can be closely linked with those in the Bay andDelta. Although not a direct group responsibility, KimTaylor is working with the UC Sea Grant Program toestablish a fellowship program for graduate students andpost-doctoral associates to help agency and other scien-tists analyze historical databases, approach questions of
4 IEP Newsletter
CALFED Compendium
mutual interest to agencies, the academic community andstakeholders, and publish the results.
I need to emphasize that the discussions are in theconceptual stage, but there is mutual good will andmomentum to move forward on this process. Althoughsome IEP and agency staff are likely to move in the nextfew years, there are numerous economic and institutionalissues to be resolved before anyone actually moves intonew facilities of the Science Consortium. Science coordi-nation through something like the Bay-Delta ScienceConsortium is more promising. There is general agree-ment that it is needed and CALFED can help make it areality by providing some of the necessary incentives (akamoney).
CALFED NON-NATIVE INVASIVE SPECIES PROGRAM
Kim Webb, [email protected]
The CALFED Bay-Delta Program was established todevelop a long-term solution to the problems affecting theBay-Delta system. The CALFED Ecosystem RestorationProgram’s (ERP) goal is to restore ecological processesand to increase and improve aquatic and terrestrial habi-tats to support stable, self-sustaining populations ofdiverse and valuable species.
We have come to recognize the threat nonnative inva-sive species represent to healthy ecosystems and restora-tion efforts. As part of the ERP, the U.S. Fish and WildlifeService has accepted the responsibility of developing,implementing, and coordinating a Nonnative InvasiveSpecies (NIS) Program in the San Francisco Bay-Deltaestuary which includes terrestrial as well as aquatic spe-cies. This program, with the coordination of CALFEDstaff, agencies and interested stakeholders, focuses on theSan Francisco Bay-Delta, the Sacramento and SanJoaquin rivers, and associated watersheds. The programhas three objectives:
1. Develop a long-term strategy to manage NIS in theBay-Delta estuary and watersheds.
2. Support prevention-oriented management andresearch projects to prevent or minimize addi-tional NIS from being introduced into the Bay-Delta estuary and watersheds.
3. Support control-oriented management andresearch projects to eradicate or manage NIS oncethey have arrived and prevent or delay their prolif-eration.
The NIS Program has already accomplished manytasks, including the formation of Agency and TechnicalWork Teams, the development of NIS Strategic andImplementation Plans, and the implementation of severalNIS prevention and control projects. Several agencies andorganizations are represented on the teams:
Local or Academic Affiliates
• University of California, Davis• University of California, Berkeley• Bodega Marine Lab• Delta Protection Commission• The Bay Institute• East Bay Regional Parks
California State Agencies
• Department of Fish and Game• Department of Water Resources• Department of Food and Agriculture• San Francisco Regional Water Quality Control
Board• Department of Boating and Waterways
Federal Agencies
• Environmental Protection Agency• Fish and Wildlife Service• Department of Agriculture• Geological Survey• Bureau of Reclamation
Approved projects include control of purple loos-estrife (a flowering wetland plant), Spartina species (cordgrasses), and Arundo donax (a bamboo-like plant). Pre-vention projects include outreach and education to the pet,aquarium, and nursery industries, an invasive plant guide-book for restoration projects, and a zebra mussel detectionand education project. Research projects will be focusingon ballast water and Potamocorbula amurensis (an Asianclam). Additional articles on specific NIS issues andprojects will follow in future editions of this newsletter.For further information, contact Kim Webb at (209) 946-6400, ext. 311, or [email protected].
IEP Newsletter 5
IEP QUARTERLY HIGHLIGHTS—WINTER 2001
SAN FRANCISCO BAY FISHERIES MONITORING
Kathy Hieb, [email protected]
We continued to sample fish and invertebratesmonthly with midwater and otter trawls in the last quarterof 2000. Newsworthy information included a record catchof the introduced goby, Tridentiger barbatus, in October2000. We collected 59 fish, with the majority of fish in thelower Sacramento River (salinity <2.5‰). Most of thefish collected were less than 22 mm TL. We collected fourT. barbatus in November and 27 in December. This three-month total of 90 fish is substantially higher than the 66collected since November 1997.
We have also noticed a significant overlap in the dis-tributions of Cancer magister (Dungeness crab) and Erio-cheir sinensis (Chinese mitten crab) in fall and winter. Forexample, in December 2000, C. magister were common inthe upper San Pablo Bay channel and Carquinez Strait(bottom salinity 22.5‰ to 25.8‰) while E. sinensis weremost common from the western end of the Strait to ChippsIsland (bottom salinity 9.2‰ to 24.5‰). From late fallthrough winter, C. magister stage for their emigration fromthe bay, as they move from the shoals to the channel.Meanwhile, E. sinensis migrates from the rivers and Deltato brackish water to reproduce. Through the winter, thecenter of the E. sinensis distribution moves slightly down-stream, as ovigerous females are found at higher salinities(mean = 16.9‰) than either adult males (mean = 10.2‰)or non-ovigerous females (mean = 10.9‰). Although mostC. magister are >85 mm carapace width by December(which is larger than most E. sinensis), it is not known ifthis distributional overlap affects C. magister. Also,E. sinensis is reported to die soon after reproduction, withmales dying soon after mating and females dying after theeggs hatch.
Preliminary 2001 abundance indices for selected estu-arine species, including the shrimp Crangon fran-ciscorum, Dungeness crab, longfin smelt, and starryflounder will be reported in the status and trends (spring2001) issue of the IEP Newsletter.
DELTA FLOW MEASUREMENT
Richard N. Oltmann, [email protected]
Eleven of the 12 continuous flow-monitoring stationssuccessfully collected data throughout the quarter withoutextended periods of missing data. Unfortunately, the sta-tion on the Sacramento River downstream of GeorgianaSlough was down for approximately a month during theIEP DCC-PWT Delta Cross Channel (DCC) study. Thestation failed due to a fatigued underwater transducercable; the cable was replaced on December 11.
Cathy Ruhl became the Delta flows contact person forthe USGS in January. Cathy has been working for theUSGS on various Bay-Delta sediment projects for the lastthree years with Dave Schoellhamer. Cathy will continueto keep everyone informed of Delta flow measurementactivities via this quarterly update.
Delta Cross Channel Study
The six UL-ADCPs that were deployed on September5 in the vicinity of the DCC as part of the DCC study(refer to last quarters report) were recovered during theweek of December 18. Numerous flow measurementswere made during the deployment period at the DCC, andNorth Fork and South Fork Mokelumne UL-ADCP sites.These measurements will be used to flow calibrate theUL-ADCPs. Because the Sacramento River flow wasfairly constant over the three-month deployment period,the DCC UL-ADCP was redeployed in the hope that theSacramento River flows will increase, but will remain lessthan 25,000 cfs (triggers the closure of the DCC gates) sothe flow splits in the vicinity of the DCC can be furtherinvestigated at slightly higher flow levels than those thatoccurred during the previous three months.
Several fish movement studies were conducted over atwo-week period during the middle of November thatincluded the release and recapture of spray-dyed salmonsmolts, the tracking of radio tagged salmon, and the use ofacoustics to determine fish distribution. Additional hydro-dynamic data were collected during these fish movement
6 IEP Newsletter
IEP Quarterly Highlights—winter 2001
studies, including velocity profile measurements at vari-ous fish locations, the tracking of drogues released at thesame time and location as the fish, and high density veloc-ity profile mapping at the junction of the DCC and theSacramento River. The velocity profile mapping data willbe used in conjunction with the velocity profile data col-lected by the three UL-ADCPs deployed in the Sacra-mento River at the junction with the DCC. These threeUL-ADCPs will not be flow calibrated but will providecontinuous velocity-profile data to monitor the hydrody-namics at the junction during DCC gate operation, andgive information about how the velocity variations mightaffect fish passage.
The DCC hydrodynamic work described was donejointly by USGS and DWR Central District staff withfunding provided by CALFED and the IEP.
NEOMYSIS AND ZOOPLANKTON
Jim Orsi and Lee Mecum, [email protected]
The most abundant copepod over the last quarter was,as usual, Limnoithona tetraspina. This small cyclopoidcopepod reached a maximum density of 91,645 m-3 in theentrapment zone in October. Another similar cyclopoidcopepod, Oithona davisae, was more abundant than usual,reaching 6,957 m-3at Martinez. High salinity intrusionprobably brought O. davisae upstream, as it is a lower bayspecies that had an abundance of 26,021 m-3 in San PabloBay in October. The large predatory copepod, Tortanus dex-trilobatus, was also more abundant than usual in Suisun Baydue to the same cause.
The second most abundant copepod was Pseudodiap-tomus forbesi, a calanoid that is an important fish food. Itspeak abundance was 16,121 m-3 in the Sacramento Riverat Sherman Island; however, it was generally much lessabundant than this. Eurytemora affinis made its seasonalreappearance in November at several stations from theentrapment zone to Stockton on the San Joaquin River andSherman Island on the Sacramento River. Sinocalanusdoerrii was not abundant but did show an annual peak inSeptember. Acartiella sinensis looked like it might havedisappeared from the system, but “reappeared” in Octoberand November. The native Diaptomus and Cyclops cope-pods were rare.
Cladocerans were also unusually rare. No Daphniawere taken in October and few were caught in Septemberand November. Rotifers were less abundant than usual.
No Neomysis mercedis were seen. However, Acanth-omysis bowmani was fairly abundant with a peak of 74 m-3
in the Sacramento River at Sherman Island in October. Thismysid was present from San Pablo Bay where three individ-uals were taken in September, to Stockton. Its peak abun-dance was in the entrapment zone in September. It is notknown why A. bowmani can thrive in fall when N. mercedisdisappears. Neomysis mercedis was once common in fall,but declining phytoplankton abundance resulted in its dis-appearance in that season.
JUVENILE SALMON MONITORING
Rick Burmester, [email protected]
Monitoring efforts increased in October for the fallsampling period. Lower Sacramento River seining col-lected one adult chinook (at Wards Landing), 11 winter-run sized, and two late fall-run sized chinook in Novem-ber and December. The Sacramento area beach seinebegan on October 17, with five fall/spring, two late fall,and three winter-run chinook captured for the quarter. Allsites on the San Joaquin River were sampled with thebeach seine in September, but no chinook were capturedthis season. A new seine site on the San Joaquin River,four miles upstream from the mouth of the TuolumneRiver, has been added to better understand the contribu-tion from the Merced River.
To better target larger less abundant races, Kodiaktrawling replaced midwater trawling at Sacramento onOctober 4, with four late-fall sized chinook salmon cap-tured in December. Due to very low flows on the SanJoaquin River, Kodiak trawling has not been possible atMossdale. Trawling at Chipps Island collected 14 adultchinook, 19 fall-run and 13 late fall-run chinook juvenilesbetween September and December.
Similar to last year, significant storms that tend tobring juvenile chinook down into the Delta did not mate-rialize in the fall. A minor fish trigger in which theKnights Landing Catch Index and Sacramento CatchIndex both exceeded 3.0 occurred on December 21, andthe Delta Cross Channel (DCC) gates were closed for a

IEP Newsletter 7
few days. Otherwise the DCC gates were open most of thequarter since the bulk of the fish have not been seen yet.
Fyke trapping for adult fish was conducted betweenOctober 11 and November 15 to evaluate the potentialeffect of a through-Delta facility, connecting the Sacra-mento River with Snodgrass Slough, on adult anadromousfish. Two traps, ten foot in diameter by 20 feet long, wereset in both Georgiana Slough and in the DCC. Captures inGeorgiana Slough included 21 chinook, one adipose-clipped steelhead, and 28 striped bass. Although lower innumbers, fish were captured in the DCC, with three chi-nook salmon, one adipose-clipped steelhead, and onestriped bass taken. Other resident fish were captured inboth the Georgiana Slough and DCC traps.
To evaluate the potential fish protection benefits of atidal gate operation of the DCC, some coded-wire taggedlate fall-run chinook were used as part of a juvenile chi-nook diversion study. Modeling has shown that openingthe DCC only on a flood tide could provide nearly all ofthe water quality benefits that continuous opening wouldprovide. The study was designed to determine if such anoperation strategy might also provide fish protection. Fishwere released in mid-November, upstream of the DCC ondifferent tides and recovered continuously for two daysvia midwater trawling in the DCC and on the SacramentoRiver just downstream from the DCC. The experimentwas repeated one week later.
Recovery patterns from the DCC-Sacramento Riverstudy will be examined with respect to tide and day-nightcycle. Preliminary results show that no fish were recov-ered during the day at either trawl site, most likely due tohigh water clarity. These results, along with hydroacoustic(USBR) and hydrodynamic (USGS) data collected willalso be analyzed. A session on this work is scheduled forthe IEP workshop at Asilomar.
For a thorough review of the season’s catches, see themonitoring summary report at http://165.235.108.8/usfws/monitoring/report.asp.
HYDRODYNAMICS OF NORTH BAY
Jon R. Burau, [email protected]
Two major field efforts were concluded during thisreporting period. The first involved the recovery of a large
network of self-contained oceanographic equipmentdeployed in the Grizzly Bay area. This equipment wasdeployed in September 1999 to study shallow-channelexchange processes by continuously monitoring waterlevels, current speeds, temperatures, salinities, and turbid-ities. The equipment was recovered June 2000. The pri-mary objective for this nine-month data set was to monitorthe exchange of water, salt, and suspended sedimentbetween Grizzly Bay and the channels of Suisun Bay. Sec-ondary objectives were (1) to quantify Suisun Marsh-Grizzly Bay exchange, including the effects of SuisunMarsh Salinity Control Gate operation on this exchange,and (2) to document a possible bathymetrically controlledestuarine turbidity maximum (ETM) near the northern tipof Ryer Island (Garnet Point). This study was fundedthrough the IEP and the Department of Interior’s Place-Based program and was conducted in collaboration withDave Schoellhamer, USGS. The data from this large efforthave been processed and preliminary analyses havebegun. Draft reports are expected sometime this fall.
Personnel and equipment associated with the hydro-dynamics of North Bay study element also significantlycontributed to the design and execution of the Delta CrossChannel fish passage study described in the “DeltaFlows” study element (see page 3). Finally, we’ve contin-ued to operate 12 self-contained salinity sensors that aredeployed on the estuary bed in the channels of North Bay.Since December 1997, these sensors have continuouslymonitored the temporal evolution of the spatial structurein the near-bed salt and temperature fields from a siteadjacent to the city of San Francisco to a site in the Sacra-mento River near Collinsville. Two additional sites wereadded to this network in June 2000 to study the tidaltimescale compression and dilation of the near-bed saltfield on the seaward side of Pinole Shoal and on the sea-ward side of the Benicia Bridge.
This IEP study element has also continued a strongcollaborative relationship with academic colleagues atStanford University, UC Berkeley and UC Davis. Thesecollaborations have leveraged small IEP investments infield resources towards greatly increasing our understand-ing of a wide range of physical processes. For example,two Ph.D. theses from this collaboration were recentlycompleted. Jessica Lacy published work on Honker Bayentitled “Circulation and transport in a semi-enclosedestuarine subembayment” at Stanford University underthe direction of Stephen Monismith. John Warner pub-lished work on the Napa-Sonoma marsh complex entitled
8 IEP Newsletter
IEP Quarterly Highlights—winter 2001
“Barotropic and baroclinic convergence zones in tidalchannels” at UC Davis under the direction of Geoff Schla-dow. In addition, results from these collaborations werealso presented at a series of scientific conferences this fall.
Two talks were presented at the 6th International Con-ference on Nearshore and Estuarine Cohesive SedimentTransport Processes on September 4-8, 2000, in Delft, theNetherlands. They were titled, “Tidal asymmetry of erod-ibility at a site in San Francisco Bay, USA” by M.L. Bren-nan1, D.H. Schoellhamer2, J.R. Burau2, and S.G.Monismith1, and “Transfer of cohesive sediment betweenthe bed and water column at a site in San Francisco Bay,USA” by D.H. Schoellhamer2, J.R. Burau2,M.L. Brennan1, S.G. Monismith1. The conference pro-ceedings will be published as a series of peer reviewedpapers in book form. Additionally, the “Effects of TidalCurrent Phase at the Junction of Two Straits” byJ.C. Warner3, S.G. Schladow3, D.H. Schoellhamer2, andJ.R. Burau2 was presented at the 10th International Bien-nial Conference on Physics of Estuaries and Coastal Season October 7-11, 2000, in Norfolk, Virginia. Both paperswill appear in a peer-reviewed special issue of Continen-tal Shelf Research and Journal of Marine Systems.
Finally, three of the 15 posters presented at the Estua-rine Circulation, Mixing, and Modeling session of theAmerican Geophysical Union’s 1999 fall meeting, heldDecember 13-17, 1999, in San Francisco, California, wereat least partially funded by the IEP. These included“Effects of tidal current phase at the junction of twostraits” by J.C. Warner3, D.H. Schoellhamer2, J.R.Burau2, and S.G. Schladow3; “Lateral variability and sec-ondary currents in Suisun Cutoff, San Francisco Bay” byJ.R. Lacy1, J.R. Burau2, M.T. Stacey4, S.G. Monismith1;and “The vertical structure of the turbulent kinetic energybalance in a stratified estuary” by M.T. Stacey4, S.G.Monismith1, J.R. Burau2, J.R. Brennan1, J.R. Lacy1.
KNIGHTS LANDING JUVENILE SALMONID MONITORING
Bill Snider, DFGbsnider @dfg2.ca.gov
Juvenile salmonid emigration monitoring at KnightsLanding continued from October through December2000. Very few salmon have been collected apparentlydue to minimal changes in flow in the Sacramento River.Only 41salmon were collected between November 6 andthe end of December. Twenty-one of the 41 were collectedon December 20; 34 were collected between December 20and 26.
This year’s catch is comparable to that observed in thefall and winter of 1999. Within this period, less than 40fish were collected until mid-January when storm inducedflow increases eventually occurred. Since 1995, a major-ity of the late-fall- (>90%), winter-run- (>75%) andspring-run-sized salmon (>70%) catches at Knights Land-ing typically occurred during this first phase of emigration(November through early January). So far in 2000, only12 late-fall, 21 winter- and two spring-run-sized salmonhave been caught through December 31.
FALL MIDWATER TRAWL
Russ Gartz, [email protected]
The Fall Midwater Trawl Survey (FMWT) began inmid-September and was successfully completed in mid-December 2000. Four monthly surveys were conducted atthe following areas: San Pablo Bay, the Carquinez Strait,Suisun Bay, the lower Sacramento and the lower SanJoaquin rivers, and the eastern Delta. Some data are stillsubject to Quality Assurance and Quality Control proce-dures and so all indices (Table 1) and discussions of dis-tribution are preliminary.
1. Stanford University.2. U.S. Geological Survey.3. University of California, Davis.4. University of California, Berkeley.

IEP Newsletter 9
Young-of-the-Year Striped Bass
The fall index for striped bass decreased by 28% from541 in 1999 to 389 in 2000. Striped bass were widely dis-tributed in the estuary with the exception of San PabloBay, where they were only caught during the October Sur-vey. Striped bass were only caught in the Carquinez Straitduring the November and December Surveys. The major-ity of catches were made in Suisun Bay, the Sacramentoand San Joaquin rivers, and the eastern Delta.
Delta Smelt
The fall index for delta smelt decreased by 12% from864 in 1999 to 757 in 2000. The distribution for deltasmelt was more constrained than it was for striped bass.Delta smelt were only caught in the Carquinez Strait dur-ing the September survey and were not caught in SanPablo Bay or the eastern Delta in any of the surveys. Deltasmelt were consistently caught in Suisun Bay and the Sac-ramento and San Joaquin rivers during all four surveyswith the following exceptions. Delta smelt were notcaught in the Sacramento River during the September sur-vey and were not caught in the San Joaquin River duringthe October survey.
Young-of-the-Year Sacramento Splittail
The fall index for Sacramento splittail decreased by87% from 39 in 1999 to 5 in 2000. The FMWT onlycaught six young-of-the year (YOY); descriptions of theirrelative distribution are inappropriate.
Longfin Smelt
The fall index for longfin smelt decreased by 34%from 5,242 in 1999 to 3, 438 in 2000. The highest concen-trations of longfin smelt were in Suisun Bay during allfour surveys and they were consistently caught in SanPablo Bay, the Carquinez Strait, and the SacramentoRiver. Only during the November and December Surveyswere longfin smelt caught in small numbers in the SanJoaquin River. No longfin smelt were caught in the easternDelta.
American Shad
The fall index for American shad increased by 6%from 715 in 1999 to 761 in 2000. American shad distribu-tion was wide and highly variable in the estuary during the2000 FMWT, with American shad being caught in allareas during the September, October, and November sur-veys. American shad were not caught in the San JoaquinRiver during the December survey.
DEVELOPING A DIAGNOSTIC KEY FOR IDENTIFYING LARVAL OSMERIDS
Lenny Grimaldo, DWR; Alicia Seesholtz, DWR; Lisa Lynch, DFG; Johnson Wang, National Environmental Sciences; and Brent Bridges, [email protected]
We have identified several distinct characteristicsbelieved to be unique to delta smelt and wakasagi at vari-ous life stages (yolk sac to 14 mm standard length). Weare now in the process of measuring the variability amongthese characteristics from wild larvae (verified to specieswith genetic analysis) and larvae reared at the culturefacilities. The specimens are being photographed usingImagePro Plus. To date, we have completed a morphomet-ric analysis on approximately 60 photographed larvaefrom three different stages of interest (4 to 6 mm, 6.1 to10 mm and 10.1 to 12 mm and larger). We will completean inventory of preserved specimens from DFG and the
Table 1 Monthly and fall indices of abundance for various species caught in the 2000 and 1999 Fall Midwater Trawl Surveysa
Species and year Sep Oct Nov Dec Fall indexStriped bass
2000 93 156 90 50 389
1999 154 68 134 185 541
Delta smelt
2000 430 128 56 143 757
1999 198 380 114 172 864
Longfin smelt
2000 1,635 48 940 815 3,438
1999 1,953 2,736 330 223 5,242
Sacramento splittail
2000 0 4 1 0 5
1999 24 3 12 0 39
American shad
2000 253 326 125 57 761
1999 346 155 145 69 715a Indices for 2000 are preliminary and subject to change.
10 IEP Newsletter
IEP Quarterly Highlights—winter 2001
CVP to determine how many additional samples we willneed to collect from the wild this spring. We plan to col-lect wakasagi from Folsom Lake during January and Feb-ruary 2001. We also will attempt to collect delta smeltfrom the field this spring. Through genetic analysis, wewill verify the stock of osmerids collected in the Delta anduse these collections as voucher specimens for key devel-opment and validation.
SPLITTAIL INVESTIGATIONS
Randall D. Baxter, [email protected]
Field sampling to identify juvenile splittail riverinehabitat ended abruptly September 25. Sampling endedearly on the last day of the study phase before implemen-tation of selective sampling. So we could not determine ifjuvenile splittail could still captured in the area or wereconcentrated in a few select locations. As mentioned inthe summer quarterly highlights, only two juvenile split-tail were captured during the study phase of this year’ssampling, whereas over 300 juveniles were captured inthe same area during the training period earlier in the sum-mer. A suitable alternate boat was not available, so we didnot determine if our limited splittail catch resulted fromtheir low numbers and ability to avoid the net or becausewe missed sampling habitats where they were concen-trated.
SHERMAN ISLAND AGRICULTURAL DIVERSION EVALUATION
Matt Nobriga, Zoltan Matica, and Alicia Seesholtz, [email protected]
We are preparing a draft report of our 2000 samplingat side-by-side screened and unscreened diversionsiphons in Horseshoe Bend. Our primary conclusions arethat (1) entrainment through the screened diversion wassignificantly lower than through the unscreened diversion,and (2) there are very apparent tidal and diel (day-night)effects on fish entrainment, but different species respondin different ways to these cycles. The second conclusionhas important implications for managing unscreeneddiversions to protect suites of species and for particletracking modeling of small fishes.
TOWNET SURVEY
Russ Gartz, [email protected]
We conducted four, biweekly surveys during the 2000Townet Survey (TNS): survey 1 (June 23–27), survey 2(July 7–11), survey 3 (July 21–25), and survey 4 (August4–8). Each survey lasted five days and sampled 32 sta-tions with up to three, ten-minute, oblique tows. Indices ofabundance were calculated using 31 stations.
Results from surveys 1 through 4 are reported hereand are restricted to young-of-the-year (YOY) fish. Forstriped bass, YOY includes all bass ≤99 mm FL. For deltasmelt, YOY includes all smelt ≤69 mm FL. Only twostriped bass >99 mm FL and only six delta smelt>69 mm FL were caught during the 2000 TNS. Index cal-culations for striped bass are described in Chadwick(1964) and Turner and Chadwick (1972); the samemethod was used for delta smelt.
As the 2000 TNS was a relatively “long” survey it ispossible to detect spawning events. The following arehypothesized trends for a single spawning event: (1) con-sistently decreasing abundance, (2) consistently increas-ing size (FL), and (3) a constant growth rate (givenconstant conditions). Growth rates were calculated as[(mean lengthsurvey n+1) – (mean lengthsurvey n)]/14 days.Other observed trends could indicate multiple spawningevents.
The distribution of striped bass and delta smelt isdescribed by partitioning the 31 stations used in the indexinto six areas and calculating the percentage of surveyindex for that area/survey. The areas are MontezumaSlough, Suisun Bay, the Sacramento River, the SanJoaquin River, the East Delta, and the South Delta.
Striped Bass
The 2000 TNS detected one spawning event of stripedbass. Mean length of striped bass increased with each sur-vey in a relatively smooth progression while the surveyindex consistently decreased (Table 1). The resultinggrowth rates are surveys 1–2, 0.58 mm/day; surveys 2–3,0.92 mm/day; and surveys 3–4, 0.66 mm/day. Althoughnot constant, the growth rates are reasonable for stripedbass observed by the TNS. A visual inspection of length-frequency plots (Figure 1) gives further indication of asingle spawning event.

IEP Newsletter 11
Figure 1 Length-frequency plots for YOY striped bass for townet surveys 1–4, 2000
The distribution of striped bass showed little variationduring the 2000 TNS with the exception of the largechange in percentage of index occurring between surveys3 and 4 in Montezuma Slough (Table 2). Striped bass weremainly distributed in Montezuma Slough, Suisun Bay,and the Sacramento and San Joaquin rivers (Table 2). Thefraction of index set in the East Delta was never more than
10% for any survey and only during Survey 1 were stripedbass caught in the South Delta (Table 2). The large changein percentage of index in Montezuma Slough could indi-cate a shift in distribution. However, the absolute catchduring survey 4 was only 15 fish less than for survey 3(Table 1), hinting at the possibility of better survival forYOY striped bass in Montezuma Slough than in otherparts of the estuary.
Delta Smelt
The 2000 TNS detected at least two major spawningevents for delta smelt. Although mean length did increasewith each survey, there was an abrupt change between sur-veys 2 and 3 (Table 1). The corresponding growth ratesare surveys 1–2, 0.11 mm/day; surveys 2–3, 0.56 mm/day;and surveys 3–4, 0.07 mm/day. Abundance was relativelystable until survey 4 when it decreased by 45% from thesurvey index set during survey 3 (Table 1). Theseobserved trends are inconsistent for a single, spawningevent. An inspection of the length-frequency plots indi-cates at least two spawning events (Figure 2).
0
20
40
60
80
100
120
140
10 15 20 25 30 35 40 45 50 55 60 65 70 75 80 85 90
FORK LENGTH (mm)
FREQ
UENC
Y
0
5
10
15
20
25
30
35
40
45
10 15 20 25 30 35 40 45 50 55 60 65 70 75 80 85 90
FORK LENGTH (mm)
FREQ
UENC
Y
0
1
2
3
4
5
6
7
8
9
10 15 20 25 30 35 40 45 50 55 60 65 70 75 80 85 90
FORK LENGTH (mm)
FREQ
UENC
Y
0
2
4
6
8
10
12
14
10 15 20 25 30 35 40 45 50 55 60 65 70 75 80 85 90
FORK LENGTH (mm)
FREQ
UENC
Y
SURVEY 1,
06/23 - 06/27
SURVEY 2,
07/07 - 07/11
SURVEY 3,
07/21 - 07/25
SURVEY 4,
08/04 - 08/08
Table 1 Mean length, standard deviation, sample size, and survey indices for striped bass and delta smelt during tow-net surveys 1–4, 2000
Survey 1 Survey 2 Survey 3 Survey 4Striped bass
Mean length (mm FL) 21.9 30.0 42.9 52.1
SD (mm) 7.0 9.8 12.5 11.7
N 958 547 149 134
Survey index 15.5 13.1 3.3 2.9
Delta smelt
Mean length (mm FL) 31.7 33.2 41.0 42.0
SD (mm) 7.3 8.3 8.0 8.8
N 186 227 213 159
Survey index 7.8 8.1 7.8 4.3
12 IEP Newsletter
IEP Quarterly Highlights—winter 2001
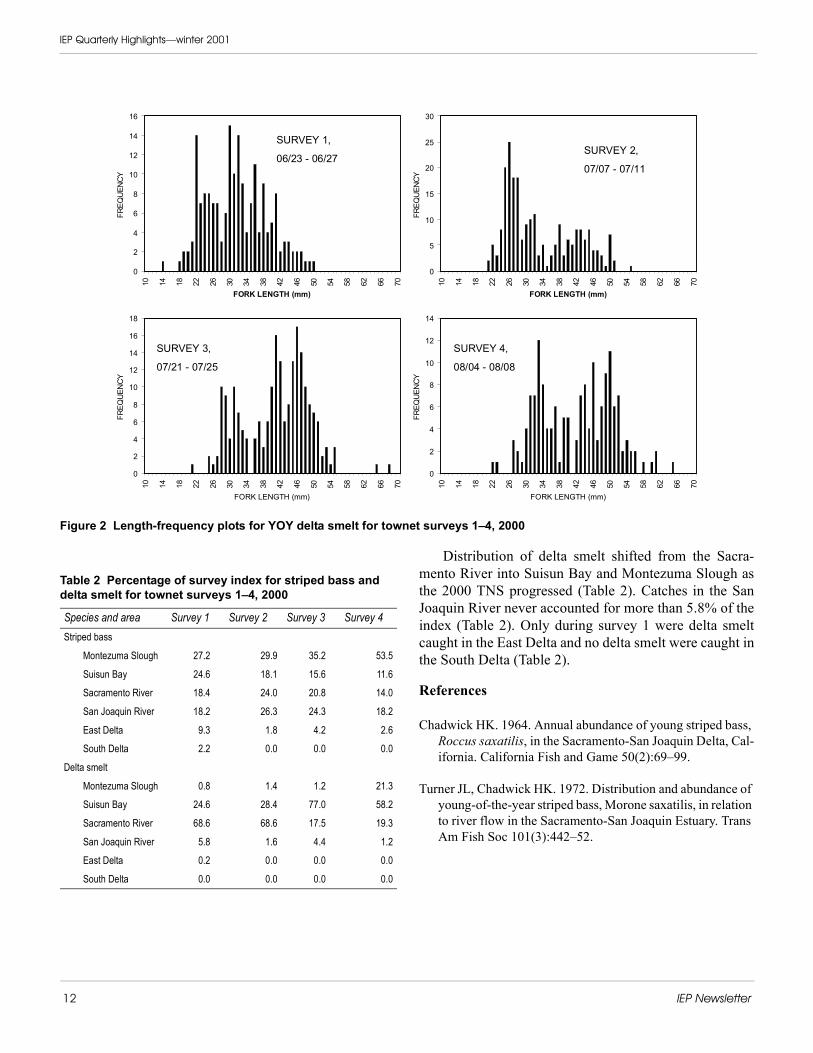
Figure 2 Length-frequency plots for YOY delta smelt for townet surveys 1–4, 2000
Distribution of delta smelt shifted from the Sacra-mento River into Suisun Bay and Montezuma Slough asthe 2000 TNS progressed (Table 2). Catches in the SanJoaquin River never accounted for more than 5.8% of theindex (Table 2). Only during survey 1 were delta smeltcaught in the East Delta and no delta smelt were caught inthe South Delta (Table 2).
References
Chadwick HK. 1964. Annual abundance of young striped bass, Roccus saxatilis, in the Sacramento-San Joaquin Delta, Cal-ifornia. California Fish and Game 50(2):69–99.
Turner JL, Chadwick HK. 1972. Distribution and abundance of young-of-the-year striped bass, Morone saxatilis, in relation to river flow in the Sacramento-San Joaquin Estuary. Trans Am Fish Soc 101(3):442–52.
0
2
4
6
8
10
12
14
16
10 14 18 22 26 30 34 38 42 46 50 54 58 62 66 70
FORK LENGTH (mm)
FREQ
UENC
Y
0
5
10
15
20
25
30
10 14 18 22 26 30 34 38 42 46 50 54 58 62 66 70
FORK LENGTH (mm)
FREQ
UENC
Y
0
2
4
6
8
10
12
14
16
18
10 14 18 22 26 30 34 38 42 46 50 54 58 62 66 70
FORK LENGTH (mm)
FREQ
UENC
Y
0
2
4
6
8
10
12
14
10 14 18 22 26 30 34 38 42 46 50 54 58 62 66 70
FORK LENGTH (mm)
FREQ
UENC
Y
SURVEY 1,
06/23 - 06/27SURVEY 2,
07/07 - 07/11
SURVEY 3,
07/21 - 07/25
SURVEY 4,
08/04 - 08/08
Table 2 Percentage of survey index for striped bass and delta smelt for townet surveys 1–4, 2000
Species and area Survey 1 Survey 2 Survey 3 Survey 4Striped bass
Montezuma Slough 27.2 29.9 35.2 53.5
Suisun Bay 24.6 18.1 15.6 11.6
Sacramento River 18.4 24.0 20.8 14.0
San Joaquin River 18.2 26.3 24.3 18.2
East Delta 9.3 1.8 4.2 2.6
South Delta 2.2 0.0 0.0 0.0
Delta smelt
Montezuma Slough 0.8 1.4 1.2 21.3
Suisun Bay 24.6 28.4 77.0 58.2
Sacramento River 68.6 68.6 17.5 19.3
San Joaquin River 5.8 1.6 4.4 1.2
East Delta 0.2 0.0 0.0 0.0
South Delta 0.0 0.0 0.0 0.0
IEP Newsletter 13
DISSOLVED OXYGEN LEVELS IN THE STOCKTON SHIP CHANNEL
Casey Ralston and Stephen P. Hayes, [email protected]
Dissolved oxygen concentrations in the Stockton ShipChannel (channel) are closely monitored during the latesummer and early fall of each year because levels candrop below 5.0 mg/L, especially in the eastern portion ofthe channel. Several factors are thought to contribute todissolved oxygen decrease in this area including low SanJoaquin River inflows, warm water temperatures, highbiochemical oxygen demand (BOD), reduced tidal circu-lation, and intermittent reverse flow conditions in the SanJoaquin River past Stockton. Low dissolved oxygen levelscan cause physiological stress to fish and inhibit upstreammigration of salmon.
Monitoring of dissolved oxygen levels in the Channelwas conducted seven times by vessel between August 14and November 14, 2000. During each of the monitoringruns, 14 sites were sampled from Prisoner’s Point in thecentral Delta to the Stockton Turning Basin. Dissolvedoxygen and water temperature data were collected foreach site at the top and bottom of the water column duringebb slack tide using traditional discrete (Winkler titration)and continuous monitoring (Hydrolab DS-3 multiparame-ter surveyor or Seabird 9/11 multiparameter sensor)instrumentation. Monitoring by vessel is supplemented byan automated multiparameter water quality recording sta-tion near Burns Cutoff at the western end of Rough andReady Island. This site captures diel variation in dissolvedoxygen levels, and indicated that early morning dissolvedoxygen levels were often lower than values recorded laterin the day throughout the fall monitoring period.
A dissolved oxygen sag (levels of 5.0 mg/L or less)rarely occurred in the Channel during the monitoringperiod, although depressed levels (between 5.1 and6.0 mg/L) persisted in August and September. As in pre-vious years, dissolved oxygen levels in the western por-tion of the channel from Prisoner’s Point toDisappointment Slough were relatively high and stablethroughout the study period, and ranged from 6.7 to11.2 mg/L. Dissolved oxygen levels within the centralchannel from Columbia Cut to Fourteen Mile Sloughranged from 4.5 to 9.2 mg/L. Levels dropped below5.0 mg/L on August 14 at Lights 28 and 34 and on
September 26 at Lights 18 and 19. The lowest dissolvedoxygen level (4.5 mg/L) occurred in August when tem-peratures were warmest (22.8 to 25.7 °C) and San JoaquinRiver flows were lowest (less than 2,000 cfs past Verna-lis). In the eastern portion of the channel from BuckleyCove to the eastern end of Rough and Ready Island, thedissolved oxygen depression persisted in August and Sep-tember, with levels improving to greater than 6.0 mg/L byearly October. The dissolved oxygen levels in this regionranged from 5.0 to 10.3 mg/L.
By October 26, 2000, dissolved oxygen levelsthroughout the channel had recovered to 8.0 mg/L orgreater. This sustained improvement was verified onNovember 14. Significantly cooler water temperatures(11.7 to 13.0 °C) and maintenance of adequate SanJoaquin River inflows (average daily inflows past Verna-lis of approximately 2,000 cfs) appear to have contributedto the maintenance of acceptable dissolved oxygen levelsin the channel.
YOLO BYPASS FLOODPLAIN STUDY
Bill Harrell and Ted Sommer, [email protected]
We began the fish sampling season for the YoloBypass Program with the installation of a fyke trap in theperennial Toe Drain channel in late September 2000. Thiswill be the second season we tested this gear type forcatching adult fish. Last year’s sampling effort provideddata on adult species composition, timing and duration offish migration into the Yolo Bypass relative to differentphysical conditions. These results will be presented as aposter for the upcoming IEP Workshop (Asilomar, March2001) and as a paper for the Riparian Habitat and Flood-plain Conference (Sacramento, February 2001).
Native fish caught from October through Decemberincluded five adult chinook salmon (mean fork length729 mm), five Sacramento suckers (mean fork length482 mm), and three Sacramento splittail (mean forklength 348 mm). As with last season, there has been a sur-prising number of adult striped bass: 117 striped bass(mean fork length 574 mm) have been captured sinceOctober. Other species include black crappie, carp,threadfin shad, and white catfish.
14 IEP Newsletter
IEP Quarterly Highlights—winter 2001
Similar to previous sampling years, the fish researchcomponent of the study will also include the use of arotary screw trap and a number of beach seine stations.The screw trap was installed near the base of the YoloBypass in the Toe Drain in early January 2001 and will beoperated 5 to 7 days per week, depending on catch anddebris load. Beach seine sampling will be conducted at anumber of locations in and around the perimeter of thefloodplain on a monthly basis until floodplain inundation.During inundation beach seine stations will be sampledweekly.
In addition, we plan to release a total of 200,000coded wire tagged salmon in groups of 50,000 into boththe Yolo Bypass and the Sacramento River during Febru-ary. These paired releases will provide additional informa-tion about floodplain salmon residence time, growth andsurvival.
UPPER ESTUARY CHINESE MITTEN CRAB RESEARCH PROJECTS
Tanya Veldhuizen and Cindy Messer, [email protected], [email protected]
Two research projects are focused on Chinese mittencrabs in the Sacramento-San Joaquin Delta—one project(Chinese Mitten Crab Habitat Use Study) is evaluatingmitten crab habitat use and the other (Mitten CrabBenthos Impact Study) is evaluating the effects of mittencrabs on the benthic invertebrate community.
For the Chinese Mitten Crab Habitat Use Study, weused “crab condos” and baited traps to collect mitten crabsin the Delta. Sampling with crab condos occurred prima-rily at Sherman Lake, Horseshoe Bend, and Frank’s Tractfrom July through December 2000. The crab condos werevery successful at attracting juvenile crabs (total numberof condos set = 496; total crab catch = 139). Mitten crabsizes ranged from 8 to 41 mm carapace width (CW), withan average size of 25 mm CW. Mitten crab catch increasedin August (average number of crabs per condo or CPUE =1.14, peaked in October (CPUE = 2.26, and declinedsharply in December (CPUE = 0.08). Preliminary analysisindicates mitten crabs are more common in shallow (0.5to 2 m) areas with submerged or emergent aquatic vegeta-tion, followed by deep (over 5 m) channel areas. Mittencrabs were less common in shallow areas with no vegeta-tion and in shallow riprapped areas.
Sampling with baited traps occurred Februarythrough December 2000. Baited traps were not successfulat collecting mitten crabs (total number of baited trapsset = 1,871, total crab catch = 8). We simultaneouslyfished baited traps and crab condos at Horseshoe Bendand Sherman Lake to confirm that local mitten crab den-sity was not a factor in trapping success. On both sam-pling occasions, crabs were collected with crab condosbut not with baited traps. Of the mitten crabs captured,four were collected in channels 3 to 5 m deep, two werecollected in channels over 5 m deep, and two were col-lected in shallow areas with dense aquatic vegetation.
For the Mitten Crab Benthos Impact Study, we usedotter trawls to conduct monthly sampling from April 2000through November 2000. Sampling took place at DWR’shistorical benthic monitoring sites. Originally, nine siteswere sampled, but the number was reduced to seven(Suisun Bay, Grizzly Bay, Collinsville, Twitchell Island,Sherman Lake, Rio Vista, and Rock Slough) due to exten-sive debris and other safety hazards at two of the sites.Objectives of this first phase of the study were to deter-mine crab presence at the benthic sites and the success rateof otter trawling as a sampling method. To date, 11 crabshave been collected at five of the sites. Two crabs havebeen collected in Suisun Bay near Martinez (D6), onefemale measuring 54 mm CW and one male measuring46 mm CW. Five crabs have been collected in the Sacra-mento River at Collinsville (D4), two females (56 and33 mm CW) and 3 males (57, 12, and 19 mm CW. One50 mm CW male crab was collected in the San JoaquinRiver near Twitchell Island (D16) and a newly molted60 mm CW male crab was collected in Rock Slough(D28A) near Holland Tract. Two crabs were also collectedin the Sacramento River just below the Rio Vista Bridge(D24); both crabs were male measuring 27 and 66 mmCW.
In addition to otter trawling, a brief enclosure studywas conducted during September. The purpose of thispilot study was to determine an appropriate enclosuredesign for mitten crab retention. This second phase of theMitten Crab Benthos Impact Study will examine directeffects of the mitten crab on the benthic community andwill commence in spring 2001.

IEP Newsletter 15
SHALLOW WATER METHODS STUDY
Mike Chotkowski, USBR; Matt Nobriga, DWR; and Randy Baxter, [email protected]
In 2000, we conducted preliminary field work forminnow seine, seine-depleted block net, and electrofish-ing methods. These are the primary technologies beinginvestigated in this study. Most field time was expendedon test-runs of the experiments we have selected for gearefficiency evaluation; the remaining time was spentexploring monitoring methodology issues, especially theselection of field protocol for the minnow seine in varioussituations. Six field sites on the Sacramento River (westbank 3 km south of Rio Vista; east shore of DeckerIsland), San Joaquin River (Venice Cut Island and adja-cent ship channel), Mildred Island interior, and LibertyIsland interior were adopted for the study. The projectdatabase, to date representing 300 seine hauls, 52 block-net samples, and 30 electrofishing samples, is now com-plete and error-checked, thanks to the much-appreciatedefforts of Randy Baxter.
Formal gear efficiency tests of seine, blocknet, andelectrofishing technologies under likely use scenarios willbe completed in 2001. We will also experiment with achannel-blocking fyke trap technique that may be usefulin more saline tidal marshes around San Francisco Bay,and will investigate other technologies as time permits.
PREDATOR-PREY DYNAMICS STUDY
Matt Nobriga, DWR, and Mike Chotkowski, [email protected]
This study relies in part on pairing prey samples col-lected during the course of the Shallow Water MethodsStudy with predator samples collected contemporane-ously by gillnet in adjacent nearshore areas. In 2000,paired predator and prey samples were collected on 16dates (June through October) at five stations: all the sitesemployed by the Shallow Water Methods Study exceptLiberty Island.
All predator stomach analyses and data entry for 2000are complete, and the database is currently being error-checked. Sample sizes for the year are: 164 striped bass
(53 to 512 mm SL), 102 largemouth bass (51 to 458 mmSL), 54 Sacramento pikeminnow (72 to 512 mm SL), 17black crappie (52 to 265 mm SL), and 7 channel catfish(103 to 468 mm SL).
2001 PROGRAMMATIC REVIEW OF THE IEP ENVIRONMENTAL MONITORING PROGRAM
Anke Mueller-Solger and Zachary Hymanson, DWR [email protected]
The IEP Environmental Monitoring Program (EMP)is undergoing a programmatic review under the directionof the IEP Water Quality Project Work Team. The EMP iscarried out in compliance with State Water Right DecisionD-1641 controlling exports and operations of the StateWater Project and Central Valley Project. The main objec-tive of the EMP is to monitor the effects of water projectoperation on water quality and lower trophic levels. Forthe past 30 years, the monitoring program has routinelycollected data on traditional water quality constituents,phytoplankton, zooplankton, and benthos in the Delta,Suisun Bay, and San Pablo Bay. It provides long-termenvironmental information to IEP agencies as well as toother data users. Now beginning its fourth decade, theprogram is faced with many new challenges and opportu-nities such as its interaction with CALFED and the emer-gence of new technologies and information needs. The2001 review offers a unique chance to launch a reinvigo-rated environmental monitoring program for the 21st cen-tury.
Participants in the 2001 review of the IEP EMP willinclude invited technical experts, stakeholder representa-tives, the IEP Science Advisory Group (SAG), and EMPstaff. According to the current plan prepared by the WaterQuality PWT, participants review the plan over the courseof three to four large meetings and in small subject areateams starting in March 2001. The subject area teams willproduce technical subject area reviews and monitoringplans. These will be synthesized into a comprehensivereview summary and a draft monitoring plan which willthen be discussed and finalized in follow-up meetings byall review participants and the SAG. EMP staff have pre-pared an information package for review participants thatincludes a historical overview of the IEP EMP and adescription of its current design. The package will be dis-tributed to review participants pending final IEP approvalof the review process.

16 IEP Newsletter
IEP Newsletter 17
NEWS FROM AROUND THE ESTUARY
SIMPLIFIED CONVERSIONS BETWEEN SPECIFIC CONDUCTANCE AND SALINITY UNITS FOR USE WITH DATA FROM MONITORING STATIONS
Larry Schemel, USGS, Menlo [email protected]
The U.S. Geological Survey, Bureau of Reclamation,and the California Department of Water Resources main-tain a large number of monitoring stations that record spe-cific conductance, often referred to as “electricalconductivity,” in San Francisco Bay Estuary and the Sac-ramento-San Joaquin Delta. Specific conductance unitsthat have been normalized to a standard temperature areuseful in fresh waters, but conversion to salinity units hassome considerable advantages in brackish waters of theestuary and Delta. For example, salinity is linearly relatedto the mixing ratio of freshwater and seawater, which isnot the case for specific conductance, even when valuesare normalized to a standard temperature. The PracticalSalinity Scale 1978 is based on specific conductance, tem-perature, and pressure measurements of seawater andfreshwater mixtures (Lewis 1980 and references therein).Equations and data that define the scale make possibleconversions between specific conductance and salinityvalues.
This article presents a simplified conversion to salin-ity units for use with specific conductance data from mon-itoring stations that have been normalized to a standardtemperature of 25 °C and an equation for the reverse cal-culation. Although these previously undocumented meth-
ods have been shared with many IEP agencies over thelast two decades, the sources of the equations and data areidentified here so that the original literature can beaccessed.
Specific conductance is expressed in units of Siemensper centimeter at the temperature of the measurement(note that the term “specific” refers to 1 cm-cell geometryrather than a temperature of 25 °C, which is a commonerror). Rather than reporting specific conductance valuesat ambient water temperatures, values recorded by mostinstruments are normalized to a standard temperature of25 °C using an average temperature coefficient of abouttwo percent per degree Celsius. This procedure greatlyfacilitates interpretation of data, but it can be a potentiallylarge source of error when ambient temperatures are muchlower than 25 °C. In general, salinity values computedfrom normalized data are not as accurate as values com-puted from ambient measurements of specific conduc-tance and temperature. The simplified conversions shownbelow assume that specific conductance values have beennormalized to a temperature of 25 °C and that pressurecorrections are unnecessary at shallow water depths.
SPECIFIC CONDUCTANCEAT 25 °C TO SALINITY CONVERSION
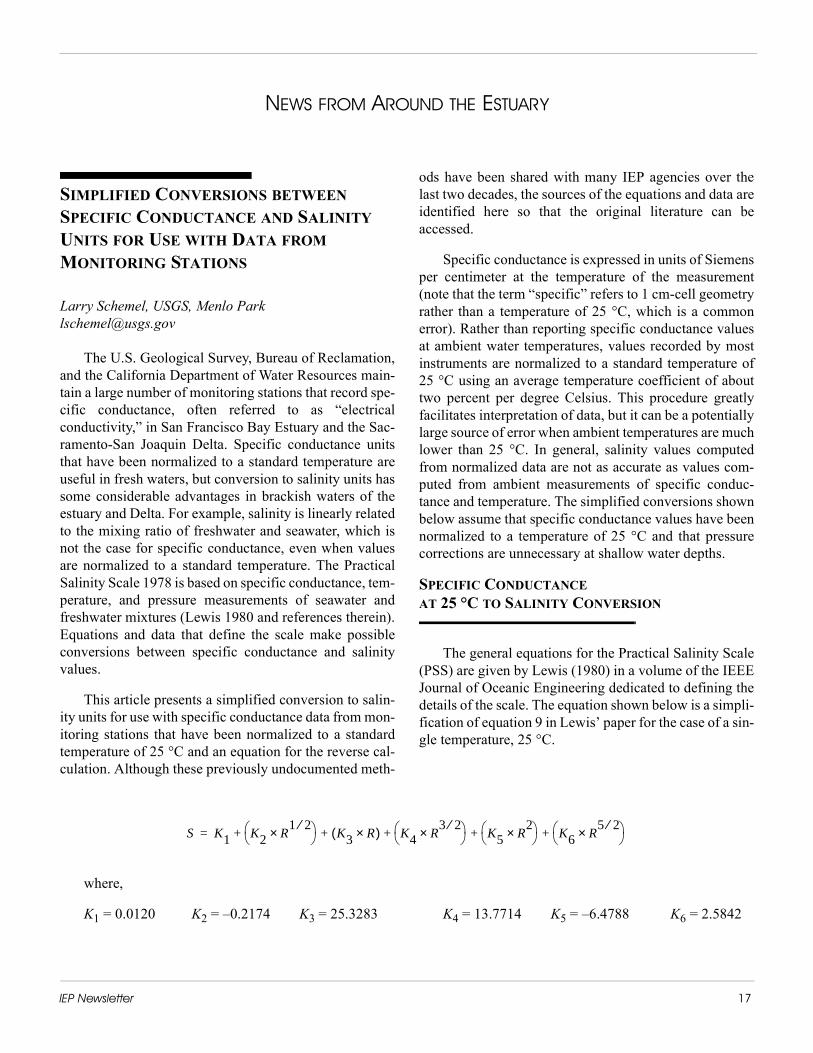
The general equations for the Practical Salinity Scale(PSS) are given by Lewis (1980) in a volume of the IEEEJournal of Oceanic Engineering dedicated to defining thedetails of the scale. The equation shown below is a simpli-fication of equation 9 in Lewis’ paper for the case of a sin-gle temperature, 25 °C.
where,
K1 = 0.0120 K2 = –0.2174 K3 = 25.3283 K4 = 13.7714 K5 = –6.4788 K6 = 2.5842
S K1 K2 R1 2⁄×� �
� � K3 R×( ) K4 R3 2⁄×� �
� � K5 R2×
� �� � K6 R
5 2⁄×� �� �+ + + + +=
18 IEP Newsletter
News from Around the Estuary
Terms were combined to create the new set of coeffi-cients, Kn. The R variable is the ratio of the sample spe-cific conductance at 25 °C to that of standard seawater(salinity = 35) at the same temperature (53.087 milliSie-mens per centimeter; Poisson [1980] and referencestherein). The first step in using the equation is to dividethe sample values by the standard seawater value, produc-ing conductivity ratios for each sample. Although this stepcould have been incorporated into the coefficients of theequation, the R values, which range from about 0 (fresh-water) to 1 (standard seawater), provide a check that thesample data are in the correct units. Salinity values areunitless in this scale. However, since most scientists areused to seeing the parts per thousand (‰) unit for salinity,
values for the PSS are often followed by “psu” (practicalscale units) for clarity.
SALINITY TO SPECIFIC CONDUCTANCEAT 25 °C CONVERSION
Calibrations of field instruments often require the cal-culation of specific conductances from laboratory sali-nometer values. In some cases it is necessary to use thegeneral equations for calculating specific conductance atambient temperatures from salinity, as given by Poisson(1980). For the case where specific conductance at 25 °Cis needed, Poisson’s equation 15 can be simplified to thefollowing expression.
where,
J1 = –16.072 J2 = 4.1495 J3 = –0.5345 J4 = 0.0261
Terms were combined to create the new set of coeffi-cients, Jn. Specific conductance at 25 °C, X25,S, is calcu-lated in microSiemens per centimeter. S is the practicalsalinity value.
Since both conversions require the input of severalcoefficients, it is most likely that the user will create a pro-gram or macro for multiple calculations. After doing this,the equations should be checked by using the data near25 °C provided by Poisson (1980, Table 1, multiply con-ductivity ratio values by 53087 for specific conductancevalues at 25 °C in microSiemens per centimeter). The PSS1978 was established for the salinity range of 2 to 42. Sub-sequent equations proposed by Hill and others (1986) thatextend the scale to lower salinity values appear unneces-sary for field studies, in part because most values arechanged by less than 0.01 psu, which is beyond the reso-lution of most field instruments.
REFERENCES
Hill KD, Dauphinee TM, Woods DJ. 1986. The extension of the Practical Salinity Scale 1978 to low salinities. IEEE Journal of Oceanic Engineering OE–11(1):109–12.
Lewis EL. 1980. The Practical Salinity Scale 1978 and its ante-cedents. IEEE Journal of Oceanic Engineering OE-5(1):3-8.
Poisson A. 1980. Conductivity/salinity/temperature relation-ship of diluted and concentrated standard seawater. IEEE Journal of Oceanic Engineering OE–5(1):41–50.
X25 S, S 35⁄( ) 53087( )× S S 35–( ) J1 J2 S1 2⁄×� �
� � J3 S×( ) J4 S3 2⁄×� �
� �+ + +×+=
IEP Newsletter 19
RESULTS OF 2000 SALT MARSH HARVEST MOUSE SURVEYS IN SUISUN MARSH
Patty Finfrock, [email protected]
The California Department of Fish and Game andCalifornia Department of Water Resources have beenconducting annual surveys of the endangered salt marshharvest mouse (Reithrodontomys raviventris halicoetes,SMHM) in Suisun Marsh since 1998. The goal is to deter-mine if the mice are present, and to make inferences abouthabitat suitability.
All surveys were conducted on DFG lands managedas SMHM habitat. These areas have either been desig-nated as SMHM Conservation Areas to meet require-ments of the Suisun Marsh Plan of Protection or mitigatefor effects of DWR projects. There are currently eightconservation areas totaling more than 1,300 acres. Three
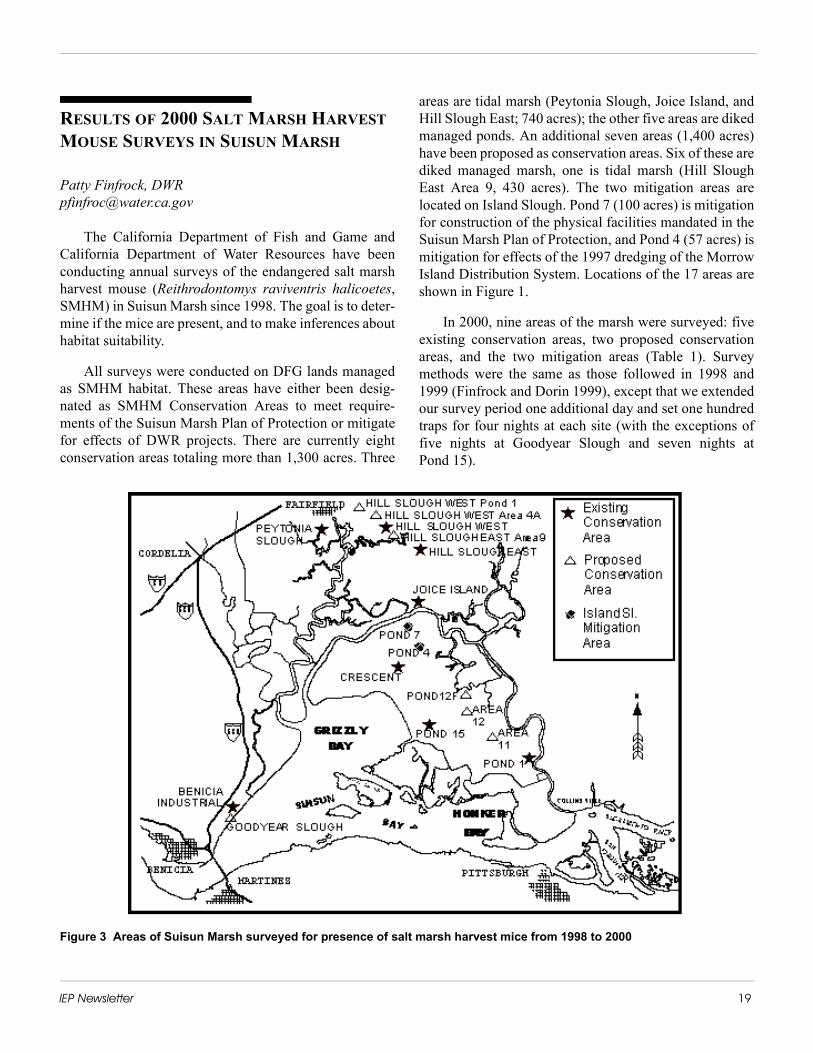
areas are tidal marsh (Peytonia Slough, Joice Island, andHill Slough East; 740 acres); the other five areas are dikedmanaged ponds. An additional seven areas (1,400 acres)have been proposed as conservation areas. Six of these arediked managed marsh, one is tidal marsh (Hill SloughEast Area 9, 430 acres). The two mitigation areas arelocated on Island Slough. Pond 7 (100 acres) is mitigationfor construction of the physical facilities mandated in theSuisun Marsh Plan of Protection, and Pond 4 (57 acres) ismitigation for effects of the 1997 dredging of the MorrowIsland Distribution System. Locations of the 17 areas areshown in Figure 1.
In 2000, nine areas of the marsh were surveyed: fiveexisting conservation areas, two proposed conservationareas, and the two mitigation areas (Table 1). Surveymethods were the same as those followed in 1998 and1999 (Finfrock and Dorin 1999), except that we extendedour survey period one additional day and set one hundredtraps for four nights at each site (with the exceptions offive nights at Goodyear Slough and seven nights atPond 15).
Figure 3 Areas of Suisun Marsh surveyed for presence of salt marsh harvest mice from 1998 to 2000

20 IEP Newsletter
News from Around the Estuary
SMHM were captured in all areas surveyed exceptone mitigation area at Island Slough (Table 1). Six areaswere surveyed in both 1999 and 2000, and trap success(total number of SMHM captured/total number of trapsset) was lower at all six areas in 2000. This is not surpris-ing given the large numbers of SMHM captured in 1999;populations were probably at their peak last year, and arenow declining in the natural cyclic rhythm of rodent pop-ulations.
The SMHM looks very similar to the common west-ern harvest mouse (Reithrodontomys megalotis), whichinhabits both marsh and upland habitats. There are severalcharacteristics that are used to distinguish between thetwo (Shellhammer 1984). However, during 1999 and2000, many captured harvest mice displayed characteris-tics intermediate between the two species and weretermed “unknown harvest mice.” These results led DWRto contract with Dr. Francis Villablanca at Cal Poly SanLuis Obispo to conduct a genetic study of harvest mice inthe Suisun Marsh. This study will develop genetic mark-ers to identify the two species, test the validity of the mor-phological characteristics currently used in speciesidentification, and determine if the two species are inter-breeding. The genetic material used in the study will befrom hair follicles collected from captured mice; we col-lected samples in 1999 and 2000. Preliminary results ofthe genetics study are expected by fall 2001.
REFERENCES
Finfrock P, Dorin M. 1999. 1999 Monitoring of the endangered salt marsh harvest mouse in Suisun Marsh. IEP Newsletter 12(4):51–3.
Shellhammer HS. 1984. Identification of salt marsh harvest mice, Reithrodontomys raviventris, in the field and with cra-nial characteristics. California Fish and Game 70(2):113-20.
Table 1 Results of salt marsh harvest mouse surveys in Suisun Marsh, 1998–2000
Location
Trap success(No. of SMHM captured/No. of traps set)
1998 1999 2000
Existing conservation areas
Benicia Industrial 0.093 0.083 0.052
Peytonia Slough 0.040 0.030
Hill Slough West 0.020
Joice Island 0.000 0.010
Crescent 0.013 0.333 0.090
Pond 15 0.023 0.057
Pond 1 0.030 0.020 0.007
Hill Slough East 0.000 0.003
Proposed conservation areas
Goodyear Slough 0.060 0.040
Hill Slough West Pond 1 0.230
Hill Slough West Area 4A 0.050
Area 11 0.160
Pond 12F 0.210
Area 12 0.110
Hill Slough East Area 9 0.080 0.037
Mitigation areas
Island Slough Pond 4 0.010
Island Slough Pond 7 0.063 0.000

IEP Newsletter 21
SUISUN MARSH MAPPING
Todd Keeler-Wolf, DFG; Mehrey Vaghti, DFG; and Alan Kilgore, Office of Emergency [email protected]
Introduction
Suisun Marsh, one of the largest brackish marshes inthe United States, has recently been intensely inventoried,and mapped for vegetation at a detailed scale, in keepingwith national standards for mapping and classifying veg-etation. The process is complete and the data are nowavailable for distribution on compact disc.
This undertaking is the culmination of an 18 monthsurvey to learn, document, and classify habitats in themarsh. The marsh has been inventoried before, roughly ona three year cycle since the mid-1980s. This effort, like theeffort in 1991, produced a GIS dataset.
This latest inventory used new GIS technology. Satel-lite imagery was used to quickly create habitat strata in themarsh. Field samples were collected using a stratified ran-dom sampling. Global Positioning Satellites systems wereused to document field sample locations. These field sam-ples were used to develop a classification system and toprovide ground truth for the map. Aerial photographswere digitized and registered to map projection and arepart of the dataset. An accuracy assessment of interpretedvegetation types was also performed. Approximately 260samples were tested by field verification.
The map data may be used by resource managers witha minimum of computer and software configuration. Thedata are designed to be used, analyzed, and displayed withArcView GIS software (Trademark ESRI), but may alsobe viewed with free ArcExplorer software or Adobe’sAcrobat Reader.
The data may be used to support general ecologicalunderstanding of the marsh. Questions such as “Howmany acres of pickleweed exist and where are they?” canbe answered simply. The mapping classification can fur-ther break down the type of pickleweed and other vegeta-tion to a number of sub-categories called vegetationassociations. For example there are nine different catego-ries of pickleweed based on the mixture of other plant spe-cies associated with pickleweed. Further detail on the
average amount of vegetative cover in six categories andthe height of the vegetation are also available for the morethan 31,000 individual mapped polygons.
The map may be used with other spatial data collectedin the field as well, such as salt marsh harvest mouse trap-ping locations. Project management planners may use thedata to see how much habitat exists on particular parcelsegments. Scientists may want to use habitat data has aspatial strata to decide where to conduct field samples infuture studies. New habitat protection areas may be eval-uated quickly using the information in this map. Forexample, where would be a good place to locate a new saltmarsh harvest mouse set aside area? Can adverse effectsbe minimized by placing new projects strategically so thatsensitive resources are not affected? Several invasiveplants that dominate vegetation stands are mapped,including Lepidium latifolium (Perennial pepperweed),Arundo donax (giant reed), Cortaderia jubatum (pampasgrass) and Phragmites australis (common reed). Mapscan be produced showing the location of these vegetationtypes.
Future studies may add some temporal aspects to thisdata. How has vegetation distribution and abundancechanged over time? Plans include evaluating newer aerialphotography annually and incorporating change into the“living map” of the marsh. There are also plans to go backinto the archives of aerial photos from previous missionsand re-map vegetation from the 1980s to discover theamount and direction of change in vegetation over time.All of this information will provide more solid groundsfor sustained management of the marsh. These types ofassessment are made possible because of the standardizedmethods of mapping and classification that are beingemployed.
In spring 2001, a brown bag seminar will be held todemonstrate use of the map and its associated products.Contact Terri Gaines, DWR, at [email protected] fordetails. In addition, a poster at the IEP Workshop in Marchwill demonstrate the map.
22 IEP Newsletter
News from Around the Estuary
PRELIMINARY ANALYSIS OF LONG-TERM BENTHIC COMMUNITY CHANGE IN GRIZZLY BAY
Heather Peterson, San Francisco State University and USGS, [email protected]
Multivariate analyses of benthic community datafrom the DWR compliance monitoring site D7 in GrizzlyBay and physical data from the San Francisco Estuaryshow community change to be related to environmentalvariability and the introduction of Potamocorbula amu-rensis in the upper estuary. DWR site D7 has been consis-tently sampled since 1977 and provides a rare long-termbenthic data set. These data chronicle the benthic assem-blage in Grizzly Bay from 1977 through 1999. During thisperiod there have been many environmental and biologi-cal changes including an extreme drought (1977), anextended drought (1987-1992), several El Niño cycles,and the introduction (fall 1986) of the clam P. amurensisto the estuary.
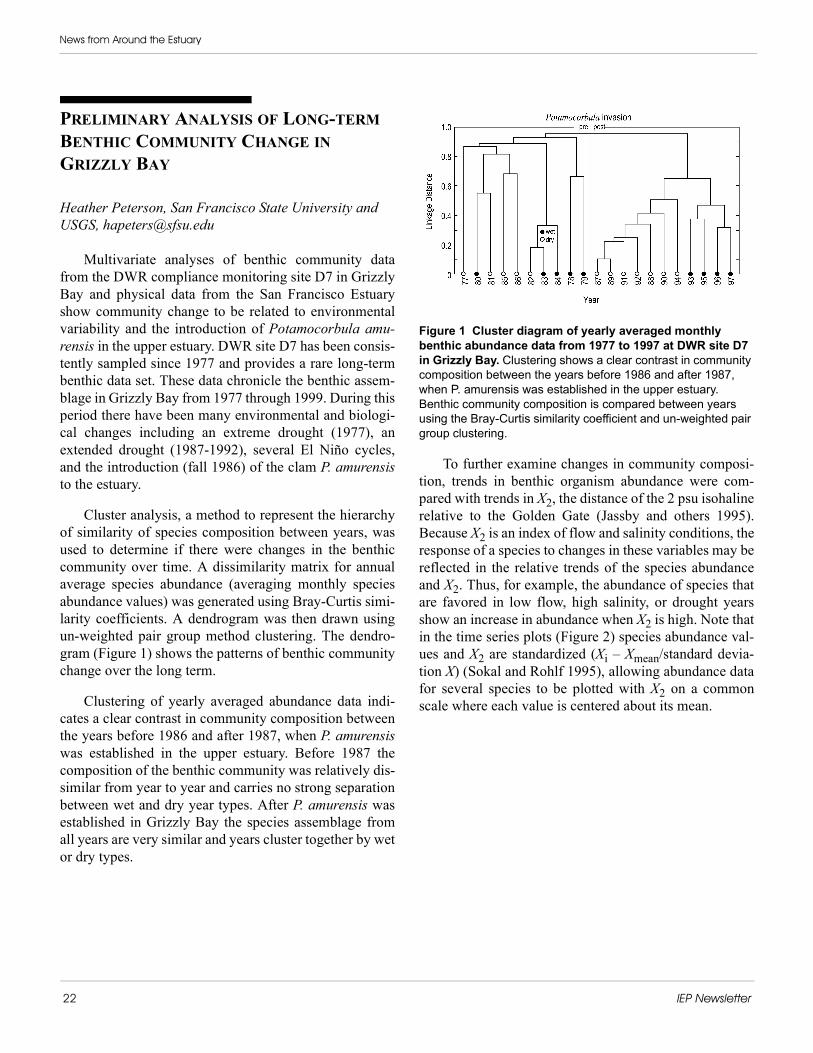
Cluster analysis, a method to represent the hierarchyof similarity of species composition between years, wasused to determine if there were changes in the benthiccommunity over time. A dissimilarity matrix for annualaverage species abundance (averaging monthly speciesabundance values) was generated using Bray-Curtis simi-larity coefficients. A dendrogram was then drawn usingun-weighted pair group method clustering. The dendro-gram (Figure 1) shows the patterns of benthic communitychange over the long term.
Clustering of yearly averaged abundance data indi-cates a clear contrast in community composition betweenthe years before 1986 and after 1987, when P. amurensiswas established in the upper estuary. Before 1987 thecomposition of the benthic community was relatively dis-similar from year to year and carries no strong separationbetween wet and dry year types. After P. amurensis wasestablished in Grizzly Bay the species assemblage fromall years are very similar and years cluster together by wetor dry types.
Figure 1 Cluster diagram of yearly averaged monthly benthic abundance data from 1977 to 1997 at DWR site D7 in Grizzly Bay. Clustering shows a clear contrast in community composition between the years before 1986 and after 1987, when P. amurensis was established in the upper estuary. Benthic community composition is compared between years using the Bray-Curtis similarity coefficient and un-weighted pair group clustering.
To further examine changes in community composi-tion, trends in benthic organism abundance were com-pared with trends in X2, the distance of the 2 psu isohalinerelative to the Golden Gate (Jassby and others 1995).Because X2 is an index of flow and salinity conditions, theresponse of a species to changes in these variables may bereflected in the relative trends of the species abundanceand X2. Thus, for example, the abundance of species thatare favored in low flow, high salinity, or drought yearsshow an increase in abundance when X2 is high. Note thatin the time series plots (Figure 2) species abundance val-ues and X2 are standardized (Xi – Xmean/standard devia-tion X) (Sokal and Rohlf 1995), allowing abundance datafor several species to be plotted with X2 on a commonscale where each value is centered about its mean.
IEP Newsletter 23
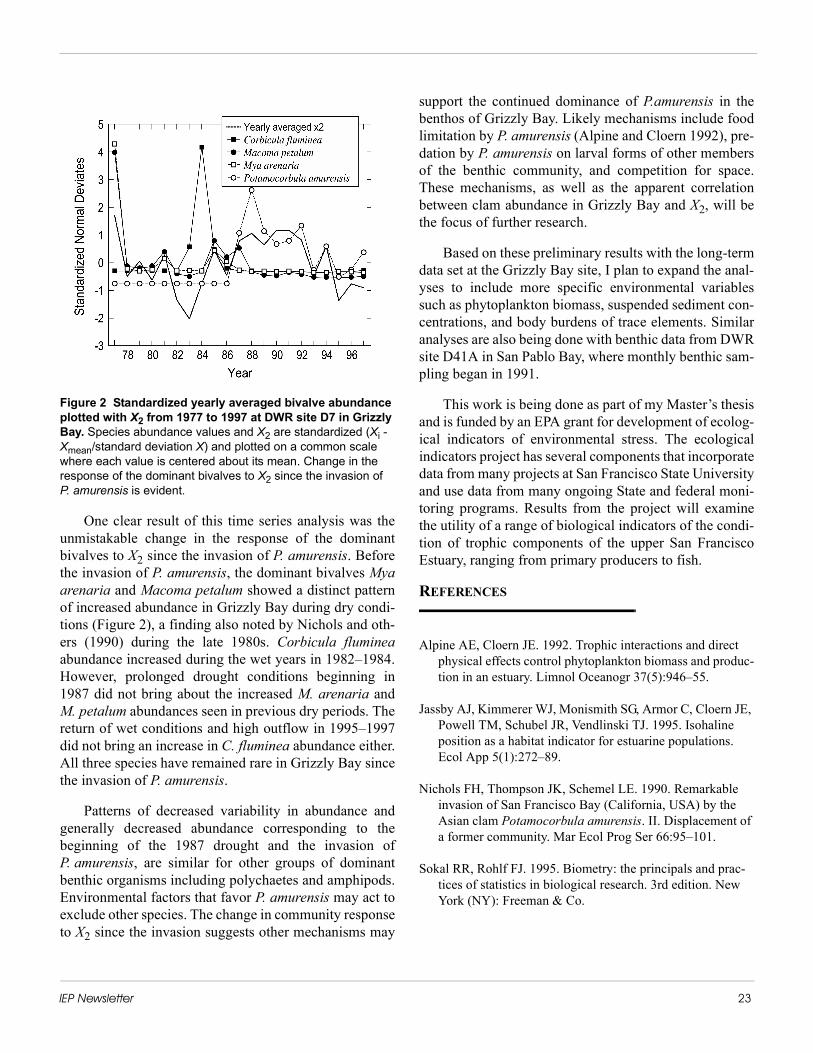
Figure 2 Standardized yearly averaged bivalve abundance plotted with X2 from 1977 to 1997 at DWR site D7 in Grizzly Bay. Species abundance values and X2 are standardized (Xi - Xmean/standard deviation X) and plotted on a common scale where each value is centered about its mean. Change in the response of the dominant bivalves to X2 since the invasion of P. amurensis is evident.
One clear result of this time series analysis was theunmistakable change in the response of the dominantbivalves to X2 since the invasion of P. amurensis. Beforethe invasion of P. amurensis, the dominant bivalves Myaarenaria and Macoma petalum showed a distinct patternof increased abundance in Grizzly Bay during dry condi-tions (Figure 2), a finding also noted by Nichols and oth-ers (1990) during the late 1980s. Corbicula flumineaabundance increased during the wet years in 1982–1984.However, prolonged drought conditions beginning in1987 did not bring about the increased M. arenaria andM. petalum abundances seen in previous dry periods. Thereturn of wet conditions and high outflow in 1995–1997did not bring an increase in C. fluminea abundance either.All three species have remained rare in Grizzly Bay sincethe invasion of P. amurensis.
Patterns of decreased variability in abundance andgenerally decreased abundance corresponding to thebeginning of the 1987 drought and the invasion ofP. amurensis, are similar for other groups of dominantbenthic organisms including polychaetes and amphipods.Environmental factors that favor P. amurensis may act toexclude other species. The change in community responseto X2 since the invasion suggests other mechanisms may
support the continued dominance of P.amurensis in thebenthos of Grizzly Bay. Likely mechanisms include foodlimitation by P. amurensis (Alpine and Cloern 1992), pre-dation by P. amurensis on larval forms of other membersof the benthic community, and competition for space.These mechanisms, as well as the apparent correlationbetween clam abundance in Grizzly Bay and X2, will bethe focus of further research.
Based on these preliminary results with the long-termdata set at the Grizzly Bay site, I plan to expand the anal-yses to include more specific environmental variablessuch as phytoplankton biomass, suspended sediment con-centrations, and body burdens of trace elements. Similaranalyses are also being done with benthic data from DWRsite D41A in San Pablo Bay, where monthly benthic sam-pling began in 1991.
This work is being done as part of my Master’s thesisand is funded by an EPA grant for development of ecolog-ical indicators of environmental stress. The ecologicalindicators project has several components that incorporatedata from many projects at San Francisco State Universityand use data from many ongoing State and federal moni-toring programs. Results from the project will examinethe utility of a range of biological indicators of the condi-tion of trophic components of the upper San FranciscoEstuary, ranging from primary producers to fish.
REFERENCES
Alpine AE, Cloern JE. 1992. Trophic interactions and direct physical effects control phytoplankton biomass and produc-tion in an estuary. Limnol Oceanogr 37(5):946–55.
Jassby AJ, Kimmerer WJ, Monismith SG, Armor C, Cloern JE, Powell TM, Schubel JR, Vendlinski TJ. 1995. Isohaline position as a habitat indicator for estuarine populations. Ecol App 5(1):272–89.
Nichols FH, Thompson JK, Schemel LE. 1990. Remarkable invasion of San Francisco Bay (California, USA) by the Asian clam Potamocorbula amurensis. II. Displacement of a former community. Mar Ecol Prog Ser 66:95–101.
Sokal RR, Rohlf FJ. 1995. Biometry: the principals and prac-tices of statistics in biological research. 3rd edition. New York (NY): Freeman & Co.
24 IEP Newsletter
Contributed Papers
CONTRIBUTED PAPERS
PROGRESS AND DEVELOPMENT OF DELTA SMELT CULTURE: YEAR-END REPORT 2000
Bradd Baskerville-Bridges, Joan Lindberg,Joel Van Eenennaam, and Serge DoroshovUC Davis, Dept. of Animal [email protected]
INTRODUCTION
Delta smelt, Hypomesus transpacificus, are endemicto the Sacramento-San Joaquin Estuary in northern Cali-fornia. Due to decline of the wild population since theearly 1980s, delta smelt were listed as threatened by bothState and federal agencies by 1993. Factors contributingto the decline are thought to include one or more of thefollowing: the prolonged drought in the 1970s, loss ofshallow water habitat, entrainment into State and federalwater diversion facilities, competition with non-nativespecies, contaminant concentrations in the Delta, andchanges in zooplankton species and abundance (Moyleand others 1992; USFWS 1996).
Developing a method for the culture of this environ-mentally sensitive species was considered and approvedin 1992 as a way of providing a supply of smelt forresearch without further diminishing the natural stock.Initial progress was made at two different locations, theUniversity of California Davis campus and the StateWater Project’s (SWP) Fish Facility near Byron, Califor-nia; however, culture efforts were consolidated in 1998 atthe SWP Fish Facility (Lindberg and others 1998). Fund-ing has been intermittent since 1992, nevertheless theproject has expanded to include a larger broodfish facility,three recirculating larval and juvenile systems and a facil-ity to rear live prey for the larvae.
The interest in culturing delta smelt for experimentalpurposes is larger today than it was in 1993 and the naturalstock has not rebounded to meet the demand. Researchprograms have been placed on hold, or have used surro-gate species, until a sufficient supply of delta smelt couldbe provided. Researchers from a wide variety of disci-
plines have expressed interest in securing large numbersof delta smelt (100 to 5,000) to investigate fish screendesign improvement and testing at water-diversion facili-ties, and for toxicology, morphometrics, genetics, andbehavioral studies.
Our culture development program systematicallytests methodologies each year and incorporates the besttechniques. Over the past two years we have succeeded indeveloping methods to spawn and rear smelt from eggthrough the sensitive and prolonged larval period to thejuvenile and adult phases. We have also tested for factorsimportant to larval feeding behavior and report additionalfindings here. Further investigations of rearing tempera-ture effects and weaning larvae to prepared diets, plannedthis spring and summer, will enable us to improve produc-tion of juveniles in 2002. Over the next two years weanticipate meeting the goal of developing a reliable andtechnically feasible method for culturing delta smelt insupport of the research community.
COLLECTION AND REARING OF BROODFISH
Delta smelt broodfish were collected using a purseseine and a lampara net with the assistance of the Depart-ment of Fish and Game (DFG) and transported using tech-niques described by Swanson and others (1996). Fishwere collected in the lower Sacramento River betweenSherman Island and Chipps Island and taken to the culturefacility at the State Water Project site, Byron CA. Fatali-ties within 72 hours of capture were attributed to handlingstress. Mortality of broodfish (those surviving the first 72hours) over the past four years has been low through win-ter months (1% to 5%), but increased with spring spawn-ing (12% to 20%) (Table 1). Fatalities during thespawning season consisted largely of spent females.
The size of captured delta smelt ranged from 48.7 to61.0 mm from 1997–2000. Average fork length and bodyweight over all collection years were 54.4 ± 2.6 mm and1.16 ± 0.14 g, respectively (mean ± standard error of themean) (Table 1).
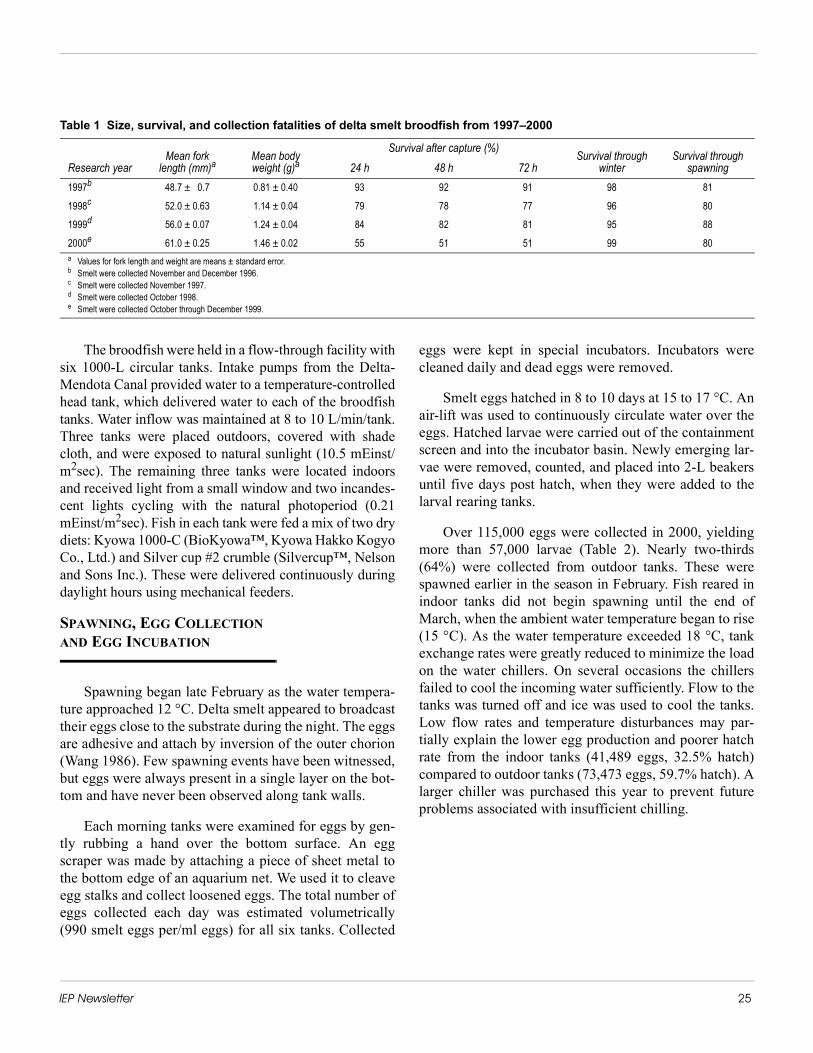
IEP Newsletter 25
The broodfish were held in a flow-through facility withsix 1000-L circular tanks. Intake pumps from the Delta-Mendota Canal provided water to a temperature-controlledhead tank, which delivered water to each of the broodfishtanks. Water inflow was maintained at 8 to 10 L/min/tank.Three tanks were placed outdoors, covered with shadecloth, and were exposed to natural sunlight (10.5 mEinst/m2sec). The remaining three tanks were located indoorsand received light from a small window and two incandes-cent lights cycling with the natural photoperiod (0.21mEinst/m2sec). Fish in each tank were fed a mix of two drydiets: Kyowa 1000-C (BioKyowa™, Kyowa Hakko KogyoCo., Ltd.) and Silver cup #2 crumble (Silvercup™, Nelsonand Sons Inc.). These were delivered continuously duringdaylight hours using mechanical feeders.
SPAWNING, EGG COLLECTIONAND EGG INCUBATION
Spawning began late February as the water tempera-ture approached 12 °C. Delta smelt appeared to broadcasttheir eggs close to the substrate during the night. The eggsare adhesive and attach by inversion of the outer chorion(Wang 1986). Few spawning events have been witnessed,but eggs were always present in a single layer on the bot-tom and have never been observed along tank walls.
Each morning tanks were examined for eggs by gen-tly rubbing a hand over the bottom surface. An eggscraper was made by attaching a piece of sheet metal tothe bottom edge of an aquarium net. We used it to cleaveegg stalks and collect loosened eggs. The total number ofeggs collected each day was estimated volumetrically(990 smelt eggs per/ml eggs) for all six tanks. Collected
eggs were kept in special incubators. Incubators werecleaned daily and dead eggs were removed.
Smelt eggs hatched in 8 to 10 days at 15 to 17 °C. Anair-lift was used to continuously circulate water over theeggs. Hatched larvae were carried out of the containmentscreen and into the incubator basin. Newly emerging lar-vae were removed, counted, and placed into 2-L beakersuntil five days post hatch, when they were added to thelarval rearing tanks.
Over 115,000 eggs were collected in 2000, yieldingmore than 57,000 larvae (Table 2). Nearly two-thirds(64%) were collected from outdoor tanks. These werespawned earlier in the season in February. Fish reared inindoor tanks did not begin spawning until the end ofMarch, when the ambient water temperature began to rise(15 °C). As the water temperature exceeded 18 °C, tankexchange rates were greatly reduced to minimize the loadon the water chillers. On several occasions the chillersfailed to cool the incoming water sufficiently. Flow to thetanks was turned off and ice was used to cool the tanks.Low flow rates and temperature disturbances may par-tially explain the lower egg production and poorer hatchrate from the indoor tanks (41,489 eggs, 32.5% hatch)compared to outdoor tanks (73,473 eggs, 59.7% hatch). Alarger chiller was purchased this year to prevent futureproblems associated with insufficient chilling.
Table 1 Size, survival, and collection fatalities of delta smelt broodfish from 1997–2000
Research yearMean fork
length (mm)aMean bodyweight (g)a
Survival after capture (%) Survival through winter
Survival through spawning24 h 48 h 72 h
1997b 48.7 ± 0.7 0.81 ± 0.40 93 92 91 98 81
1998c 52.0 ± 0.63 1.14 ± 0.04 79 78 77 96 80
1999d 56.0 ± 0.07 1.24 ± 0.04 84 82 81 95 88
2000e 61.0 ± 0.25 1.46 ± 0.02 55 51 51 99 80a Values for fork length and weight are means ± standard error.b Smelt were collected November and December 1996.c Smelt were collected November 1997.d Smelt were collected October 1998.e Smelt were collected October through December 1999.

26 IEP Newsletter
Contributed Papers
LIVE FOOD PRODUCTION
Rotifers
Rotifers (Brachionus plicatilis) were cultured similarlyto methods described by Baskerville-Bridges (1999) usinga three-day batch cycle. This promoted high productionwith a stable population. Rotifers were cultured in 120-Ltanks and were maintained at 23 to 24 °C and 15 g/L salin-ity. A “long term enrichment” (Olsen and others 1993) wasadministered, consisting of bakers yeast (36 g), DC Super-Selco (Inve Aquaculture, Inc.) (4 g), and water (2-L). Thiswas fed to the rotifers four times per day (2-L food/tank/day). Three subsamples from each culture tank were ana-lyzed daily to measure population growth. Rotifer densitywas calculated with a turbidity meter, prior to feeding,when the tanks were clear of food (Lindberg and others1999). The rotifer cultures were started at 25 million roti-fers and were harvested after three days at 40 to 50 millionrotifers. Three rotifer cultures were staggered, so that a tankcould be harvested each day. Twenty-five million rotiferswere used to start a new tank while the remaining rotiferswere harvested and fed to the larvae.
Artemia
Great Salt Lake brine shrimp (Artemia) were used forthe next phase of live food production. Large quantities(50 to 100 g) of Artemia cysts were de-capsulated (Camp-ton and Busack 1989) each week and stored in the refrig-
erator. Cysts were incubated in 15-L hatching vessels at30 °C and 30 g/L salinity. De-capsulation of the cystsincreased the hatch rate and prevented an accumulation ofcyst shells in the larval tanks. After hatching (18 to 24 h),Artemia nauplii were transferred to enrichment vessels at200,000 nauplii/L. They were enriched for 12 hours usingDC Super-Selco (0.4 g/L). Artemia were harvested usinga 150-mm sieve and were rinsed well to remove all lipidresidues from their surface.
Rotifers and Artemia were harvested once per day asneeded to meet the demands of the larvae. They were heldin the lab with aeration (18 to 20 °C) and were fed to thelarvae four times per day.
LARVAL REARING
Successful culture of delta smelt has not yet beenachieved on a large scale. The major bottleneck is the pro-duction of juveniles, due to high mortality during the lar-val period (Mager and others 1996). One of the problemsexperienced in previous years was lack of a clean watersource at our site. Water for the culture facility originatesfrom Clifton Court Forebay, a regulatory reservoir at thebeginning of the California Aqueduct. Wind mixing in theforebay results in a severely turbid water supply (20 to250 nepholometric turbidity units, NTU) for our systems,which is unacceptable for larval culture and production oflive prey organisms. The use of recirculation technology(Lindberg and other 1999) has overcome this problem andwe are able to successfully culture smelt through the lar-val period.
Culture Methods
Larval Facility and Daily Maintenance
The larval facility was expanded last year with threerecirculation systems to test temperature effects ongrowth and survival of smelt. Each system was equippedwith four to six larval rearing tanks (100 L), a mechanicalfilter (filter bags and a canister filter), a chemical filter(charcoal), and a biological filter (bio-media). Water foreach system was continuously chilled and passed throughan ultraviolet sterilizer prior to entering the tanks.
Water quality (temperature, ammonia, nitrite, oxygen,pH, and salinity) was monitored and recorded daily tomaintain safe and stable environmental conditions. Thelarvae were kept under conditions of continuous (24 h)
Table 2 Egg production from captive broodfish during the 2000 spawning season
Tank numberSpawning eventsa
Eggs collected
Eggs hatched
Indoor1 11 14,161 3,0822 16 14,170 5,5763 13 13,560 4,943
Outdoor4 22 19,313 12,6585 33 44,849 26,0346 7 9,311 5,157
Total 102 115,364 57,450Egg production inside 41,891 13,601
% inside 36.3 23.7Egg production outside 73,473 43,849
% outside 63.7 76.3a Spawning event: number of days that eggs were collected from the broodfish tanks during the
season.

IEP Newsletter 27
light and a salinity of 1 to 3 g/L. The larval tanks weresiphoned three to four times per week to remove uneatenfood. A preventative treatment was administered eachweek using formalin (25 mg/L) or an anti-bacterial agent(10-mg/L nitrofurazone or 10-mg/L Chloramine-T) forone hour.
Feeding Regime
Algae paste (Nannochloropsis oculata; MarineMicroalgae Cryopaste™, Reed Mariculture, Inc.) wasroutinely added to the tanks at each feeding to obtain a tur-bidity of 25 NTU (3 million algal cells/ml). At lower tur-bidity values, few rotifers were consumed. Rotifers andArtemia were enriched with DC Super Selco™ to improvetheir fatty acid composition. They were added to the tanksfour times daily (at 0800, 1200, 1600, and 2000 h) tomaintain sufficient prey densities (5 rotifers/ml, 3Artemia/ml) within the tanks. Rotifers were fed to smeltlarvae at first feeding (5 days post hatch); Artemia werefed to larvae when they attained a length of 10 mm. Roti-fers and Artemia were fed to larvae for two weeks andthen discontinued.
Larval Experiments
Stocking Density
The use of higher stocking densities was investigatedin larger tanks this year to increase the production of juve-niles. Last year we determined that delta smelt were goodcandidates for high-density culture using smaller tanks(20-L), as it did not have any adverse effects on survivalor growth. This year larvae were placed into 80-L tanks at20, 40, and 80 larvae/L for a 60-day feeding trial (15 °C).Three replicates of each treatment were evaluated. Twentysubsamples were removed from each tank every 10 daysfor length measurements. High stocking density had noeffect on growth and survival during the feeding trial. Lar-vae from all treatments attained a length of 16 mm by theend of the study (Figure 1). The use of high stocking den-sity can greatly improve production efforts by reducingthe number of tanks that require daily maintenance.
Figure 1 The effect of stocking density on length (mean ± SE) of delta smelt larvae from 6 to 60 days post hatch (3 replicates, 20 sub-samples per tank). There were no significant differences (P > 0.05) detected using analysis of variance.
Water TemperatureThis past season a preliminary study was performed
to investigate the effect of temperature on growth and sur-vival of smelt larvae. A feeding trial was conducted for 60days and larvae were maintained in six tanks at 14 °C,17 °C and 20 °C. We evaluated two replicates per treat-ment. Twenty subsamples were removed from each tankevery 10 days for length measurements. By day 60 posthatch, larvae at 17 °C were significantly larger (17.8 mm)than larvae reared at 14 °C (14.1 mm) (Figure 2). Larvaein warm water treatment (20 °C) experienced goodgrowth for the first 30 days and were 14.4 mm by day 40.Larvae in 17 °C and 14 °C did not grow to this size untilday 50 and 60, respectively. Unfortunately, equipmentwas not adequate for maintaining steady temperatures forthe 20 °C treatment. Large daily temperature fluctuationsresulted in high mortality and the treatment was discontin-ued due to lack of animals. We intend to repeat this exper-iment with new equipment that can maintain watertemperatures.
Figure 2 The effect of temperature on length (mean ± SE) of delta smelt larvae from 6 to 60 days post hatch (2 repli-cates, 20 subsamples per tank). Treatments with different let-ters at each time interval were significantly different (P < 0.05).
0
5
10
15
20
0 10 20 30 40 50 60Time (days post hatch)
Stan
dard
leng
th (m
m)
20 larvae/L40 larvae/L80 larvae/L
0
5
10
15
20
0 10 20 30 40 50 60Time (days post hatch)
Stan
dard
leng
th (m
m)
20 C17 C14 C
a
ba
abb
bb

28 IEP Newsletter
Contributed Papers
Feeding Behavior
Smelt larvae require a turbid environment to elicit afirst feeding response and consume few rotifers in clearwater (Mager and others 1996; Lindberg and others 1998,1999). Addition of algae to rearing tanks, or “greenwatertechnique,” has also been beneficial during the larvalperiod for other species. This has been attributed to sup-pressing the development of harmful bacteria (Skjermoand Vadstein 1993), maintaining enrichment of zooplank-ton (Reitan and others 1993), increasing visual acuity forfeeding (Boehlert and Morgan 1985; Naas and others1992), and stabilizing water quality (Houde 1975).
Algal cells appear to play a physical role, which aid infeeding for smelt larvae. Turbid conditions provide bettercontrast between the prey and their background, allowingthe larval predator to better capture its prey (Boehloertand Morgan 1985). In repeated trials we have observed anincrease in feeding incidence (number of larvae eating)and intestinal fullness (number of prey/larvae) withincreased turbidity (Lindberg and others 1999, 2000).This year three substrates (algae, silt, and bentonite) wereused to investigate the effect of turbidity on feedingbehavior.
Larvae (7 days old) were distributed (20 larvae/bea-ker) among 54 two-liter beakers with aeration andallowed to acclimate overnight. Treatments (algae, silt, orbentonite) were administered the following day to gener-ate six levels of turbidity (0, 6.25, 12.5, 25, 50, and100 NTU) for each treatment. Larvae were acclimated fortwo hours before addition of live prey (10 rotifers/ml) tothe beakers. Larvae were fixed in 5% formalin after feed-ing for two hours. Feeding incidence then was comparedfor each substrate.
The number of larvae feeding increased with increas-ing turbidity level for all three substrates (Figure 3).Nearly 80% of the larvae initiated feeding at higher tur-bidity levels (>25 NTU) when algae or bentonite wasused. A lower feeding response was observed with silt andclear water. The lower feeding response with silt wasunexpected, due to its high abundance in the Delta. Toomuch silt may adversely effect some other aspect of thelarvae’s biology (for example, a negative effect on thegills), thereby decreasing their motivation to feed.
Figure 3 The effect of turbidity on feeding incidence (mean ± SE) of delta smelt larvae (3 replicates, 20 sub-sam-ples per tank). Three substrates (algae, silt, and bentonite) were used to create turbid conditions. NTU: nepholometric tur-bidity units. Treatments with different letters were significantly different (P < 0.05).
CONCLUSIONS
We have made numerous improvements to our facilityand are better able to culture all life stages of the deltasmelt. Our broodfish facility was equipped with threeadditional tanks in an attempt to increase the productionof eggs. Fish in the outdoor tanks began spawning earlierand produced considerably more eggs during the season.During the past season we successfully cultured 2,000juveniles (20 to 40 mm).
0 20 40 60 80 100
Clear water
6.25
12.5
25
50
100
Number of larvae eating (%)
Algae(NTU)
A
dbc
b
aa
c
0 20 40 60 80 100
Clear water
6.25
12.5
25
50
100
Number of larvae eating (%)
Silt(NTU)
B
a
aab
bb
b
0 20 40 60 80 100
Clear water
6.25
12.5
25
50
100
Number of larvae eating (%)
Bentonite(NTU)
C
bb
aba
aa

IEP Newsletter 29
Compromised water flow and temperature fluctua-tions appeared to have a negative effect on the broodfish,especially for the indoor tanks, and resulted in lower eggproduction compared to previous years. Many of the juve-niles died due to inefficient water cooling, resulting inlarge daily fluctuations in tank temperature. New equip-ment is being installed to avoid similar problems and weanticipate much higher production this coming year.
Culture of delta smelt at high stocking densities withlarger tanks has helped to increase production of juve-niles. There were no negative effects of high stocking den-sity on survival and growth and minimizing the number oftanks requiring daily maintenance has reduced workload.
Smelt larvae appear to be tolerant of a wide range oftemperatures, but are not tolerant of high daily tempera-ture fluctuations. During a 60-day feeding trial, larvaegrew at a faster rate at 17 °C than at 14 °C and thereappears to be further enhancement of growth at 20 °C.
Smelt larvae require turbid conditions to elicit a firstfeeding response. Particles appear to play a physical role,by providing contrast between prey and background.Feeding incidence increased with increasing turbidityusing three substrate types (algae, silt and bentonite).Increased feeding response was not as great with silt com-pared to algae and bentonite. The reasons for this were notidentified.
For spring 2001, we have purchased new equipmentenabling better control over water temperature for thebroodfish and larval tanks. We will continue to investigatedifferences in growth and survival of smelt larvae rearedat three temperatures. We will also test larvae at variousages for their ability to wean to prepared food to improvethe transition from larval to juvenile phases. In 2002, weplan to implement best rearing methods and develop aproduction protocol.
ACKNOWLEDGEMENTS
Funding for this work has been provided by theDepartment of Water Resources, Bureau of Reclamation,IEP, and the CALFED Bay-Delta Program. Delta smeltbroodfish were collected with the assistance of theDepartment of Fish and Game.
REFERENCES
Baskerville-Bridges B. 1999. Studies on rearing and early weaning of Atlantic cod (Gadus morhua) larvae onto com-mercial and experimental microparticulate diets [Ph.D. dis-sertation]. University of Maine, Orono, ME, USA.
Boehlert GW, Morgan JB. 1985. Turbidity enhances feeding abilities of larval Pacific herring, Clupea harengus pallasi. Hydrobiologia 123:161–70.
Campton DE, Busack CA. 1989. Simple procedure for decapsu-lating and hatching cysts of brine shrimp (Artemia spp.). The Progressive Fish Culturist 51:176–9.
Houde ED. 1975. Effects of stocking density and food density on survival, growth and yield of laboratory-reared larvae of sea bream Archosargus rhomboidalis (L.) (Sparidae). J Fish Biol 7:115–27.
Lindberg JC, Baskerville-Bridges B, Van Eenennaam JP,Doroshov SI. 1998. Delta smelt culture: year-end report, 1998. California Department of Water Resources report (DWR B-81355). Sacramento, California.
Lindberg JC, Baskerville-Bridges B, Van Eenennaam JP,Doroshov SI. 1999. Development of delta smelt culture techniques: year-end report 1999. California Department of Water Resources report (DWR B-81581). Sacramento, Cal-ifornia.
Lindberg JC, Baskerville-Bridges B, Van Eenennaam JP,Doroshov SI. 2000. Update on delta smelt culture with an emphasis on larval feeding behavior. IEP Newsletter 13(3):45–9.
Mager RC, Doroshov SI, Van Eenennaam JP. 1996. Develop-ment of laboratory culture of delta smelt, Hypomesus trans-pacificus. California Department of Water Resources report (DWR B-59306). Sacramento, California. 65 p.
Moyle PB, Herbold B, Stevens DE, Miller LW. 1992. Life his-tory and status of delta smelt in the Sacramento-San Joaquin Estuary, California. Trans Amer Fish Soc 121(1):67–77.
Naas KE, Naess T, Harboe T. 1992. Enhanced first feeding of halibut larvae (Hippoglossus hippoglossus L.). Aquaculture 105:143–56.

30 IEP Newsletter
Contributed Papers
Olsen Y, Rainuzzo JR, Reitan KI, Vadstein O. 1993. Manipula-tion of lipids and w3 fatty acids in Brachionus plicatilis. Proceedings of the First International Conference on Fish Farming Technology. Trondheim, Norway: A.A. Balkema.
Reitan KI, Rainuzzo JR, Oie G, Olsen Y. 1993. Nutritional effects of algal addition in first feeding of turbot (Scophthal-mus maximus L.) larvae. Aquaculture 118:257–75.
Skjermo J. Vadstein O. 1993. The effect of microalgae on skin and gut bacterial flora of halibut larvae. Proceedings of the First International Conference on Fish Farming Technology, Trondheim, Norway: A.A. Balkema.
Swanson C, Mager RC, Doroshov SI, Cech JJ. 1996. Use of salts, anesthetics, and polymers to minimize handling and transport mortality in delta smelt. Trans Amer Fish Soc 125:326–9.
[USFWS] US Fish and Wildlife Service. 1996. Recovery plan for the Sacramento-San Joaquin Delta native fishes. Port-land (OR): U.S. Fish and Wildlife Service.
Wang JCS. 1986. Fishes of the Sacramento-San Joaquin Estu-ary and adjacent waters, California: a guide to the early life histories. Interagency Ecological Study Program for the Sacramento-San Joaquin Estuary Technical Report 9. Sacra-mento (CA): California Department of Water Resources. 626 p.
SYNOPSIS OF ISSUES IN DEVELOPING THE SAN JOAQUIN RIVER DEEP WATER SHIP CHANNEL DISSOLVED OXYGEN TMDL
G Fred Lee, PhD, PE, DEE; and Anne Jones-Lee, PhDG. Fred Lee & [email protected]
ABSTRACT
In 1994, the Central Valley Regional Water QualityControl Board (Board) classified the San Joaquin River(SJR) Deep Water Ship Channel (DWSC) “impaired”because dissolved oxygen (DO) concentrations routinelyfell below the water quality objective (standard or WQO)in the fall. This classification requires development of atotal maximum daily load (TMDL) to control loads andconditions that cause violations of the DO WQO.
In 1998, the Board classified the dissolved oxygenimpairment a high priority problem for correction. Staffcommitted to develop a TMDL plan for controlling theproblem and submit it to the U.S. Environmental Protec-tion Agency by June 2003. Furthermore, the Board, underthe Bay Protection Plan, agreed to allow a Steering Com-mittee of local vested interests help to develop the controlplan if they committed to provide Board staff all the ele-ments of the TMDL, including an implementation plan,by December 2002. If at any time the steering committeewas unable to do so then staff would resume control overthe development of the TMDL control plan.
This article presents an overview of the DWSC DOdepletion problem and many of the issues that are in needof consideration by the Steering Committee and Board indeveloping a technically valid, cost-effective TMDL thatwill enable compliance with the DO WQO. This article isa synopsis of a more extensive report by Lee and Jones-Lee (2000), which presents the issues that need to beaddressed in oxygen demand TMDL development andload allocation among stakeholders.

IEP Newsletter 31
BACKGROUND
As part of developing the Port of Stockton (Port), anavigation channel was dredged in the SJR through theDelta to Stockton (Figure 1). The SJR, just upstream ofStockton, is typically about 8 to 12 feet deep. It is a fresh-water, tidally influenced river with a three-foot tidal rangeand flow that typically ranges between 2,000 and4,000 cfs. The non-tidal flow during summer and fall ishighly regulated with net flow at Stockton, ranging fromnegative (upstream) flow associated with upstream diver-sions at Old River to net downstream flow between 100 to2,000 cfs. Beginning at the Port, the SJR DWSC isdredged to 35 feet deep to allow passage of ocean cargoships bringing bulk materials to Stockton.This dredginggreatly slows the net downstream transport rate of SJRwater. The first 15 miles of the DWSC can have a hydrau-lic residence time that varies from about 5 days at a netdownstream flow of 2,000 cfs to about 30 days at 100 cfs.
The relatively short hydraulic residence time of theDWSC has important implications for determining whenoxygen demand loads to the DWSC may potentially leadto violations of the DO WQO. With hydraulic residencetimes of less than one month, high winter and spring SJRflows and associated oxygen demand and nutrient loadsdo not significantly contribute to DO depletion within theDWSC during summer and fall. All oxygen demandadded during the winter and spring is flushed through theDWSC during this time.
Dredging the DWSC alters the oxygen demandassimilative capacity of the SJR for about 10 to 15 milesdownstream of the Port (critical reach) by increasing thehydraulic residence time of the water and by decreasingthe amount of re-aeration per unit volume of the channel.Also, greater water volume in the DWSC as a result ofdredging dilutes the dissolved oxygen photosyntheticallyproduced by algae. Further, the effect of sediment oxygendemand (SOD) is diluted for the same reason. These fac-tors, coupled with diversions by the State and federalwater projects (CVP and SWP) and other municipal andagricultural intakes, lead to DO concentrations below theWQO. The WQO is 6 mg/L from September throughNovember and 5 mg/L from December through August.While DO depletions below the WQO is critical in sum-mer and fall, there also can be violations at other times,such as during spring low flow.
CHARACTERISTICS OF THE SAN JOAQUIN RIVER WATERSHED
The San Joaquin River is one of California’s primaryrivers. It originates in the central Sierra Nevada, flowsthrough the San Joaquin Valley and into the Delta, whereit mixes with the Sacramento River before discharginginto upper San Francisco Bay or being diverted by theCVP and SWP. The SJR drains the San Joaquin Valleybetween Fresno and Stockton. It has a 7,345 sq mi water-shed that contains about one million acres of irrigatedagriculture (Kratzer and Shelton 1998). The primarycrops are fruits and nuts (almonds), corn, pasture, and cot-ton. The SJR watershed includes the metropolitan areas ofStockton, Modesto, Merced, and Fresno, and numerousdairies and feedlots. The current estimated urban popula-tion in this watershed is approximately two million and, ata growth rate of two percent per year, is expected to dou-ble to about four million people by 2040.
Upon entering the San Joaquin Valley floor, SJRwater quality deteriorates due to agricultural, municipal,and industrial stormwater runoff; wastewater discharges;municipal, industrial, and husbandry activities; and natu-ral and riparian runoff or drainage. In addition to addingoxygen requiring substances (carbonaceous and nitroge-nous biochemical oxygen demand [BOD]), the dischargescontribute substantial amounts of nutrients (N and P com-pounds), which can support algal growth. The dead algaeare a source of oxygen demand in the DWSC where flowsin the SJR at Vernalis represent a significant part of theflow into the DWSC. (Vernalis is located about 30 milesupstream of the DWSC.) Located between Vernalis andthe DWSC, the Old River diversion can at times divertsubstantial flow into the South Delta.
Also, it is possible that detritus (dead plant and animalremains and waste products like manure) derived from theSJR watershed contributes to the oxygen demand presentat Vernalis and, under certain SJR flow and diversion con-ditions, exerts oxygen demand in the DWSC. The SJR atVernalis typically has several milligrams per liter ofnitrate N and about 0.1 to 1 mg/L soluble orthophosphateP. These nutrients can support substantial algal biomass(20 to 100 µg/L chlorophyll a) in the SJR at Vernalis andthe DWSC during summer.
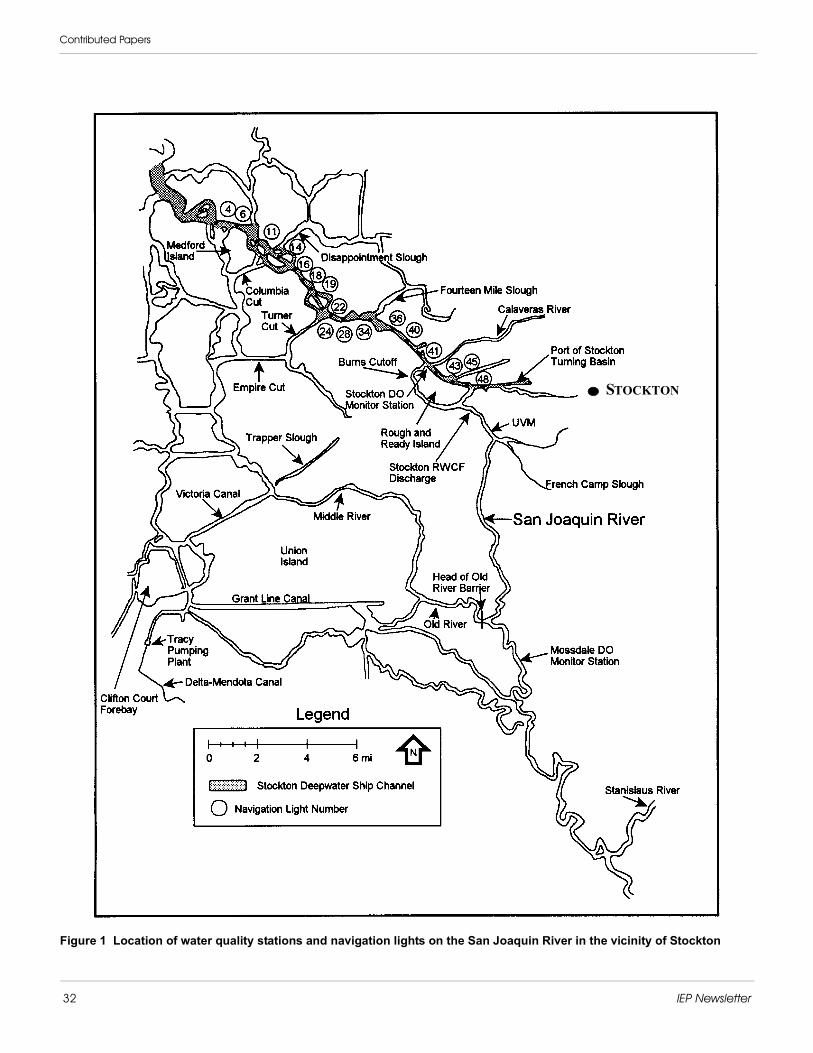
32 IEP Newsletter
Contributed Papers
Figure 1 Location of water quality stations and navigation lights on the San Joaquin River in the vicinity of Stockton
STOCKTON
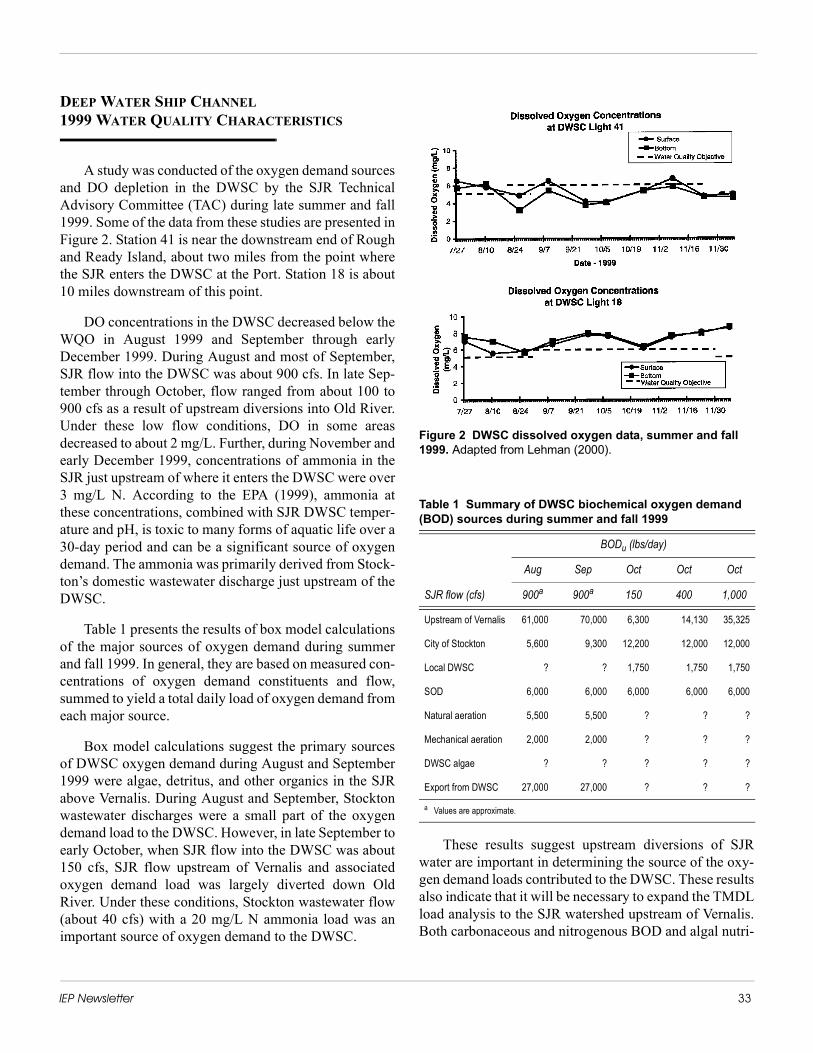
IEP Newsletter 33
DEEP WATER SHIP CHANNEL1999 WATER QUALITY CHARACTERISTICS
A study was conducted of the oxygen demand sourcesand DO depletion in the DWSC by the SJR TechnicalAdvisory Committee (TAC) during late summer and fall1999. Some of the data from these studies are presented inFigure 2. Station 41 is near the downstream end of Roughand Ready Island, about two miles from the point wherethe SJR enters the DWSC at the Port. Station 18 is about10 miles downstream of this point.
DO concentrations in the DWSC decreased below theWQO in August 1999 and September through earlyDecember 1999. During August and most of September,SJR flow into the DWSC was about 900 cfs. In late Sep-tember through October, flow ranged from about 100 to900 cfs as a result of upstream diversions into Old River.Under these low flow conditions, DO in some areasdecreased to about 2 mg/L. Further, during November andearly December 1999, concentrations of ammonia in theSJR just upstream of where it enters the DWSC were over3 mg/L N. According to the EPA (1999), ammonia atthese concentrations, combined with SJR DWSC temper-ature and pH, is toxic to many forms of aquatic life over a30-day period and can be a significant source of oxygendemand. The ammonia was primarily derived from Stock-ton’s domestic wastewater discharge just upstream of theDWSC.
Table 1 presents the results of box model calculationsof the major sources of oxygen demand during summerand fall 1999. In general, they are based on measured con-centrations of oxygen demand constituents and flow,summed to yield a total daily load of oxygen demand fromeach major source.
Box model calculations suggest the primary sourcesof DWSC oxygen demand during August and September1999 were algae, detritus, and other organics in the SJRabove Vernalis. During August and September, Stocktonwastewater discharges were a small part of the oxygendemand load to the DWSC. However, in late September toearly October, when SJR flow into the DWSC was about150 cfs, SJR flow upstream of Vernalis and associatedoxygen demand load was largely diverted down OldRiver. Under these conditions, Stockton wastewater flow(about 40 cfs) with a 20 mg/L N ammonia load was animportant source of oxygen demand to the DWSC.
Figure 2 DWSC dissolved oxygen data, summer and fall 1999. Adapted from Lehman (2000).
These results suggest upstream diversions of SJRwater are important in determining the source of the oxy-gen demand loads contributed to the DWSC. These resultsalso indicate that it will be necessary to expand the TMDLload analysis to the SJR watershed upstream of Vernalis.Both carbonaceous and nitrogenous BOD and algal nutri-
Table 1 Summary of DWSC biochemical oxygen demand (BOD) sources during summer and fall 1999
SJR flow (cfs)
BODu (lbs/day)
Aug Sep Oct Oct Oct
900a 900a 150 400 1,000
Upstream of Vernalis 61,000 70,000 6,300 14,130 35,325
City of Stockton 5,600 9,300 12,200 12,000 12,000
Local DWSC ? ? 1,750 1,750 1,750
SOD 6,000 6,000 6,000 6,000 6,000
Natural aeration 5,500 5,500 ? ? ?
Mechanical aeration 2,000 2,000 ? ? ?
DWSC algae ? ? ? ? ?
Export from DWSC 27,000 27,000 ? ? ?
a Values are approximate.
34 IEP Newsletter
Contributed Papers
ents derived from irrigated agriculture are potentiallyimportant sources of oxygen demand that enter theDWSC.
The City of Stockton supported Chen and Tsai (1997)in the development of a mathematical model of oxygendemand and DO effects in the DWSC. This model, withappropriate modification, will be used to develop an oxy-gen demand TMDL as a function of SJR flow through theDWSC. In addition, another model is being developed torelate oxygen demand and nutrients discharged to the SJRand its tributaries upstream of Vernalis to oxygen demandin the DWSC.
TMDL DEVELOPMENT AND ALLOCATION
A Technical Advisory Committee of the SJR DOTMDL Steering Committee is developing the SJR DWSCoxygen demand TMDL. Excessive DO depletion in theDWSC has been a long-standing problem. Brown & Cald-well (1970) determined that the DWSC could assimilate40,000 lbs/day BODu. Since then, the SJR DWSC hasbeen deepened by an additional five feet, which furtherreduces its oxygen demand assimilative capacity. Further,Brown & Caldwell’s estimated allowable BODu load didnot include the safety factor required in TMDL develop-ment. Work is underway as part of a “strawman” effort todevelop preliminary estimates of the allowable oxygendemand load to the DWSC considering the effect of SJRflow through the DWSC on DO depletion for a given oxy-gen demand load.
Some relief from this oxygen demand load reductionmay be achieved by increasing SJR flow through theDWSC. In summer and fall 1998, SJR flow through theDWSC was over 2,500 cfs and DO in the DWSC did notfall below the WQO. However, there is concern that thesehigh SJR flows lead to DO depletion elsewhere in the cen-tral Delta. Similarly, the diversion of SJR flow down OldRiver could be causing low DO in the South Delta. Bothof these issues will need to be examined in determininghow SJR flows into the DWSC affect DO depletion.
Another important factor to consider in developingthe TMDL is the population increase in the SJR DWSC.This population increase will increase the demand forwater, wastewater discharges, and oxygen demand load tothe SJR DWSC.
CALFED provided $866,000 during 2000 for theTechnical Advisory Committee to conduct additionalstudies needed to define the relationship between oxygendemand load to the DWSC and DO depletion below theWQO. The Steering Committee is submitting a DirectedAction proposal to CALFED in 2001 to continue fieldstudies devoted to evaluating the relationships betweendischarge of oxygen demanding substances to the DWSCand the resulting DO depletion that occurs in the DWSCas a function of SJR flow through the DWSC.
STEERING COMMITTEE RESPONSIBILITIES
The Steering Committee is composed of stakeholdersin the SJR watershed. The committee will need to resolvea variety of issues in developing and implementing theTMDL. The committee will need to establish an appropri-ate DO TMDL goal and evaluate how current standardsshould be interpreted. The EPA (1986, 1987) has indi-cated that DO depletion between 4 and 5 mg/L primarilyaffects the rate of fish growth; however, the effect of DOconcentrations between 4 and 5 mg/L on fishes of theDWSC, San Joaquin River, and the Delta needs morestudy. There could be a large difference between a “worstcase-based” DO goal versus an “average” daily water col-umn DO goal.
The allocation of the oxygen demand load andresponsibility among dischargers in the DWSC watershedwill be a challenging task. The Steering Committee mustcomplete this allocation by December 2002 to meet theBoard’s deadline. Failure to meet this deadline will resultin the Board establishing the TMDL allocation.
Another important issue that will need to be addressedby the Steering Committee and stakeholders is how to bal-ance the control of oxygen demand constituents, includ-ing aquatic plant nutrients that develop into algae thatexert an oxygen demand in the DWSC, with the signifi-cantly reduced assimilative capacity of the DWSC associ-ated with upstream of DWSC diversions of SJR water forthe City of San Francisco, other communities and variousirrigation districts, as well as the development and main-tenance of the 35-foot navigation channel through the SanJoaquin River to the Port of Stockton. The diversions ofSJR water and the 35-foot navigation channel signifi-cantly adversely affect the ability of the DWSC to acceptoxygen-demanding materials without violations of theDO water quality objective.

IEP Newsletter 35
Some of the DO depletion problems in the DWSCcould be achieved through aeration of the SJR DWSC.The Steering Committee and stakeholders will need toconsider how the construction and operation of the aera-tors would be funded.
Below are issues that need to be further addressed ordefined:
• Export and loss of BODu, CBOD, NBOD, algae, N and P between source-land runoff, discharges, and DWSC.
• Additional oxygen demand and nutrient loads to the SJR between Vernalis and Channel Point in the DWSC
• Effects of SJR flow at Vernalis and in the DWSC on DWSC DO depletion.
• Factors controlling SJR flow through the DWSC on DO depletion below WQOs.
• Significance of DWSC DO depletions below 5 mg/L on fish growth rates in the DWSC.
• Significance of DO depletions below 6 mg/L in serving as a inhibitor of chinook salmon immigra-tion.
• Cost of controlling N, P, NBOD and CBOD from wastewater, stormwater runoff, and irrigation return (tail) water.
• Development of a reliable model for a given SJR DWSC flow to establish an oxygen demand TMDL?
• Management of increasing urbanization in the SJR DWSC watershed for potentially increased oxy-gen demand load.
Further information on the issues pertinent to the DOdepletion problem in the DWSC is discussed by Lee andJones-Lee (2000) and Jones & Stokes (1998).
ACKNOWLEDGMENT
The authors acknowledge the assistance provided bythe SJR DO TMDL TAC in developing the SJR DOTMDL Issues report upon which this synopsis of issues isbased. We also wish to acknowledge the reviewers of thisreport, especially Dr. Chris Foe, CVRWQCB; Dr. Gary
Litton, University of the Pacific; Kevin Wolf of KevinWolf Associates and Dr. C. Kratzer of the USGS.
REFERENCES
Brown & Caldwell. 1970. City of Stockton, Main Water Quality Control Plant, 1969 Enlargement and Modification Study; Part 2: Benefits of proposed tertiary treatment to San Joaquin River water quality. San Francisco, California.
Chen CW, Tsai W. 1997. Evaluation of alternatives to meet the dissolved oxygen objectives for the lower San Joaquin River. Prepared for the State Water Resources Control Board on behalf of the City of Stockton Municipal Utilities Department by Systech Engineering, Inc. San Ramon, Cali-fornia.
Jones & Stokes Associates. 1998. Potential solutions for achiev-ing the San Joaquin River dissolved oxygen objectives. Pre-pared for De Cuir & Somach and the City of Stockton Dept. of Municipal Utilities by Jones & Stokes Associates. Sacra-mento, California.
Kratzer CR, Shelton JL. 1998. Water quality assessment of the San Joaquin-Tulare Basins, California: analysis of available data on nutrients and suspended sediment in surface water, 1972-1990. U.S. Department of the Interior, U.S. Geologi-cal Survey, Professional Paper 1587.
Lee GF, Jones-Lee A. 2000. Issues in developing the San Joaquin River Deep Water Ship Channel DO TMDL. Report to the SJR DO TMDL Steering Committee and the Central Valley Regional Water Quality Board. El Macero, Califor-nia.
Lehman P. 2000. Results of the 1999 field study in the Stockton Deep Water Channel for August and September. Draft sum-mary #1, preliminary data.
[EPA] U.S. Environmental Protection Agency. 1986. Ambient water quality criteria for dissolved oxygen. EPA 440/5-86-003. Washington DC: EPA Office of Water Regulations and Standards.
[EPA] U.S. Environmental Protection Agency. 1987. Quality criteria for water. EPA 44/5-86-001. Washington, D.C: EPA Office of Water Regulations and Standards.
[EPA] U.S. Environmental Protection Agency. 1999. Water quality criteria: notice of availability, 1999 update of ambi-ent water quality criteria for ammonia; notice, Part VI. Fed-eral Register 64:245, FRL-6513-6.
36 IEP Newsletter
Announcements
ANNOUNCEMENTS
RICK OLTMANN, MR. DELTA FLOWS, RETIRES
Randy [email protected]
After almost 31 years with the Geological Survey,Rick Oltmann retired in early January. After graduatingfrom Sacramento State in 1971 with a degree in civil engi-neering, Rick honed his flow measurement skills in USGSassignments in Colorado and Oregon. Fortunately for ushe returned to California in 1974 and began a long andfruitful career in the Sacramento-San Joaquin Delta.
Between 1974 and 1980 Rick worked on and devel-oped the first mathematical flow model of the reach of theSacramento River between Sacramento and Hood. Duringthe 1976–1977 drought the model was used to calculateflows at Freeport.
In 1979 Rick and his colleagues installed the first con-tinuous flow measuring station in the Delta. The station,located at Freeport, used state of the art Ultrasonic Veloc-ity Meter (UVM) technology. This technology hasbecome the standard continuous flow measuring tech-nique at such key Delta stations as the Sacramento Riverat Rio Vista and the San Joaquin River near Jersey Point.Since 1985, Rick headed up the USGS-IEP hydrodynamicfield program.
During his long career Rick had many outstandingtechnical accomplishments, perhaps foremost of whichhas been to provide a continuous (except when field mon-itoring sites are damaged by wayward barges and logs)indirect measurement of Delta outflow. However, hisgreatest contribution may have been to convey complexhydrodynamic information to audiences with widelyvarying technical backgrounds. This ability is of particu-lar importance in the Delta where biologists, engineersand managers must use hydrodynamic and biological datato manage environmental resources and water supplies. Iespecially appreciate his frequent, well written and readerfriendly contributions to this newsletter.
I am sure I speak for all IEP and others around theBay-Delta in thanking Rick for all his hard work and inwishing him an enjoyable retirement.
ESTUARINE RESEARCH FEDERATION
Randy [email protected]
As mentioned in the previous newsletter, Wim Kim-merer, Fred Nichols, and Randy Brown have been dis-cussing formation of a California affiliate of the EstuarineResearch Federation, tentatively called the CaliforniaEstuarine Research Society or CAERS. Formation of aCalifornia chapter has been encouraged by ERF head-quarters and by other local affiliates, including the PacificEstuarine Research Society, which mostly serves Wash-ington State estuarine scientists. To help us better under-stand how to establish and operate the new group, ERFheadquarters has asked the affiliates to send us theirbylaws and other relevant information. A scientist work-ing for the Southern California Coastal Water ResearchProject is joining us in these discussions.
To facilitate discussion among affected scientists inthe Bay area, Wim, Fred, and I will host an informal for-mation discussion at the upcoming IEP Workshop at Asi-lomar. We will select a time and location and will post anannouncement on the conference center bulletin board.Although we are leaning towards forming a Californiaaffiliate, and scheduling meetings in conjunction withother conferences and workshops (such as IEP), there aresome legal and administrative details we need to work outbefore taking this on. One of the key ingredients in form-ing a successful CAERS would be finding local coastaland estuarine scientists willing to help make it a produc-tive and worthwhile effort.
If you have any questions, please contact Wim([email protected]) or me ([email protected]).
IEP Newsletter 37
DON'T MISS THE UPCOMING AMERICAN FISHERIES SOCIETY ANNUAL MEETING
The Calfornia-Nevada Chapter and the HumboldtChapter of the American Fisheries Society will be holdingthe 35th Annual Meeting March 29-31, 2001 in SantaRosa, California. The meeting titled, “Progress and Con-tinuing Challenges in Conservation and Restoration ofAquatic Species” will feature two symposia, a plenarysession, ten technical sessions, and a poster session. Thesymposia and plenary session will provide information onhabitat and fish restoration, fish passage, and facilities toreduce fish losses. The technical sessions will cover arange of topics including marine, estuarine, and freshwa-ter fish ecology, abalone biology, conservation genetics,fluvial geomorphology, analytical tools for species resto-ration, and contaminant effects on aquatic species. Regis-tration materials can be obtained from the AFS web pageat http://www.afs-calneva.org or contact Lauren Buffaloeat (916) 227-1375 or [email protected].
INTERNATIONAL CONFERENCE ON RESTORING NUTRIENTS TO SALMONID ECOSYSTEMS
Richard [email protected]
While you’ve got that 2001 planner handy, be sure toschedule in the “Nutrient Conference.” This event will beheld April 24–26, 2001, in Eugene, Oregon, and willdefine the cutting edge of information on the dynamicsand application of nutrients in restoring salmon ecosys-tems. Interest has been exceptional, with more than 60presentations submitted, addressing a diverse range ofissues. Subjects include estimation of historic salmonescapements; dynamics among aquatic and terrestrial sys-tems; nutrient contributions of carcasses, riparian vegeta-tion, and artificial supplements; protocols for fertilizinglakes and streams in various Northwest ecotypes; methodsfor salmon carcass augmentation; water quality and pri-mary production effects of carcass decomposition; etc.
Plenary speakers include Jim Lichatowich (WA,USA), Takeshi Murota (Kyoto, Japan), and John Stockner(BC, Canada). Session chairs include: C. Jeff Cederholm,Robert Bilby, and Hal Michael (WA), Robert Lackey andBill Bakke (OR), Wayne Minshall (ID), Mark Wipfli(AK), Tom Reimchen (BC, Canada), and Lisa Thompson(CA). Besides interactive oral presentations, there will bea lively poster social featuring the Northwest’s bestmicrobrews. Student travel awards (up to $500) are avail-able via a simple application process. The registrationform, student award criteria, agenda, and further informa-tion are available on the conference web page. Or, you cancontact me at 541-496-4580 or [email protected].
A CONFERENCE ON SCIENCE, POLICY, AND CONSERVATION ACTION
Nicole [email protected]
“Managing River Flows for Biodiversity: A Confer-ence on Science, Policy, and Conservation Action” will beheld July 30 through August 2, 2001, at Colorado StateUniversity, in Fort Collins, Colorado. Please contactNicole Silk at [email protected] for more details. Don’t forgetto visit the website at www.freshwaters.org/conference!
38 IEP Newsletter
Paper Accepted for Journal Publication
PAPER ACCEPTED FOR JOURNAL PUBLICATION
YOLO BYPASS STUDY ACCEPTED FOR PUBLICATION IN THE CANADIAN JOURNAL OF FISHERIES AND AQUATIC SCIENCES
Lauren Buffaloe, [email protected]
Publishing scientific work is no easy task. However, five IEP-affiliated scientists commemorate the real millenniumby doing just that. Ted Sommer, Matt Nobriga, Bill Harrell, Wendy Batham, and Wim Kimmerer collaborated to reportthe results of the Yolo Bypass Study, initiated in 1997 as a product of an IEP project. The abstract and current referenceappear below. The authors gratefully acknowledge funding from CALFED and assistance from IEP staff including DWR(R. Kurth, R. Brown, C. Messer, K. Malchow, F. Feyrer, L. Grimaldo, D. McEwan, R. Miller, C. Peregrin, Z. Hymansonand S. Ford); USFWS (P. Brandes, M. Pierce and R. Burmester); DFG (V. Johannsen and S. Kawasaki), and consultants(W. Fields and W. Shaul). Please contact Ted Sommer ([email protected]) if you are interested in obtainingreprints.
Reference
Sommer, T.R., Nobriga, M., Harrell, B., Batham, W., and Kimmerer, W. 2001. Floodplain rearing ofjuvenile chinook salmon: evidence of enhanced growth and survival. Can. J. Fish. Aq. Sci. In press.
Abstract
In this study we provide evidence that the Yolo Bypass, the primary floodplain of the lower SacramentoRiver (California, USA), provides better rearing and migration habitat for juvenile chinook salmon(Oncorhynchus tschawytscha) than adjacent river channels. During 1998 and 1999 salmon sizeincreased substantially faster in the seasonally-inundated agricultural floodplain than the river, suggest-ing better growth rates. Similarly, coded-wire-tagged juveniles released in the floodplain were signifi-cantly larger at recapture and had higher apparent growth rates than a group concurrently released in theriver. Improved growth rates in the floodplain were in part a result of significantly higher prey consump-tion, reflecting greater availability of drift invertebrates. Bioenergetic modeling suggested that feedingsuccess was greater in the floodplain than the river, despite increased metabolic costs of rearing in thesignificantly warmer floodplain. Survival indices for floodplain coded-wire-tagged release groups weresomewhat higher than river groups, but the differences were not statistically significant. Growth, sur-vival, feeding success and prey availability were higher in 1998 than 1999, a more moderate flow year,indicating that hydrology affects the quality of floodplain rearing habitat. These findings support thepredictions of the flood pulse concept and provide new insight into the importance of floodplain forsalmon.

IEP Newsletter 39
DELTA INFLOW, OUTFLOW, AND WATER PROJECT OPERATIONS
Kate Le, DWR
From October through December 2000, San Joaquin River flow ranged between 2,000 cfs and 4,000 cfs, Sacramentoflow ranged between 10,000 cfs to 16,000 cfs, and the Net Delta Outflow Index (NDOI) ranged between 2,000 cfs and17,000 cfs (Figure 1). Precipitation in mid-October and mid-December resulted in increased Sacramento River flowsand NDOI, also shown in Figure 1. The largest precipitation occurred at the end of October, causing NDOI to increasedramatically from about 3,000 cfs to about 17,000 cfs. This storm, which resulted in high flows in the Sacramento River,did not increase flows in the San Joaquin River. High tides and Delta Cross Channel closures in late November and lateDecember caused the water projects to briefly reduce exports (Figure 2) to limit salinity intrusion in the South Delta.The late November 2000 increase in NDOI resulted from export reduction from both projects (Figures 1 and 2).
Figure 1 Flow in the San Joaquin (SJRV) and Sacramento (SACRV) rivers and Net Delta Outflow Index, Oct – Dec 2000
Figure 2 State Water Project (SWP) and Central Valley Project (CVP) exports, Oct – Dec 2000
0
2000
4000
6000
8000
10000
12000
14000
16000
18000
10/1/00 10/15/00 10/29/00 11/12/00 11/26/00 12/10/00 12/24/00
Flow
s (c
fs)
SACRV SJRV NDOI
0
2000
4000
6000
8000
10/1/00 10/15/00 10/29/00 11/12/00 11/26/00 12/10/00 12/24/00
Expo
rts (c
fs)
SWP CVP
Interagency Ecological Program for the San Francisco Estuary
IEP NEWSLETTER3251 S StreetSacramento, CA 95816-7017
For information about the Interagency Ecological Program, log on to our website at http://www.iep.water.ca.gov. Readers are encouraged to submit brief articles or ideas for articles. Correspondence, including submissions for publication, requests for copies, and mailing list changes shouldbe addressed to Lauren Buffaloe, California Department of Water Resources, 3251 S Street, Sacramento, CA, 95816-7017.
Interagency Ecological Program for the San Francisco Estuary
IEP NEWSLETTERChuck Armor, California Department of Fish and Game, IEP Program Manager & Editor
Zachary Hymanson, California Department of Water Resources, EditorLauren D. Buffaloe, California Department of Water Resources, Managing Editor
The Interagency Ecological Program for the San Francisco Estuaryis a cooperative effort of the following agencies:
California Department of Water ResourcesState Water Resources Control BoardUS Bureau of ReclamationUS Army Corps of Engineers
California Department of Fish and GameUS Fish and Wildlife Service
US Geological SurveyUS Environmental Protection Agency
National Marine Fisheries Service
BEFORE CITING INFORMATION HEREIN,CONSIDER THAT ARTICLES HAVE NOT RECEIVED PEER REVIEW.