interactivity - fachhochschule potsdam
TRANSCRIPT

Interactivity23 April 2020
University of Applied Sciences Potsdam Information Visualization
Marian Dörk
Iron Man 2
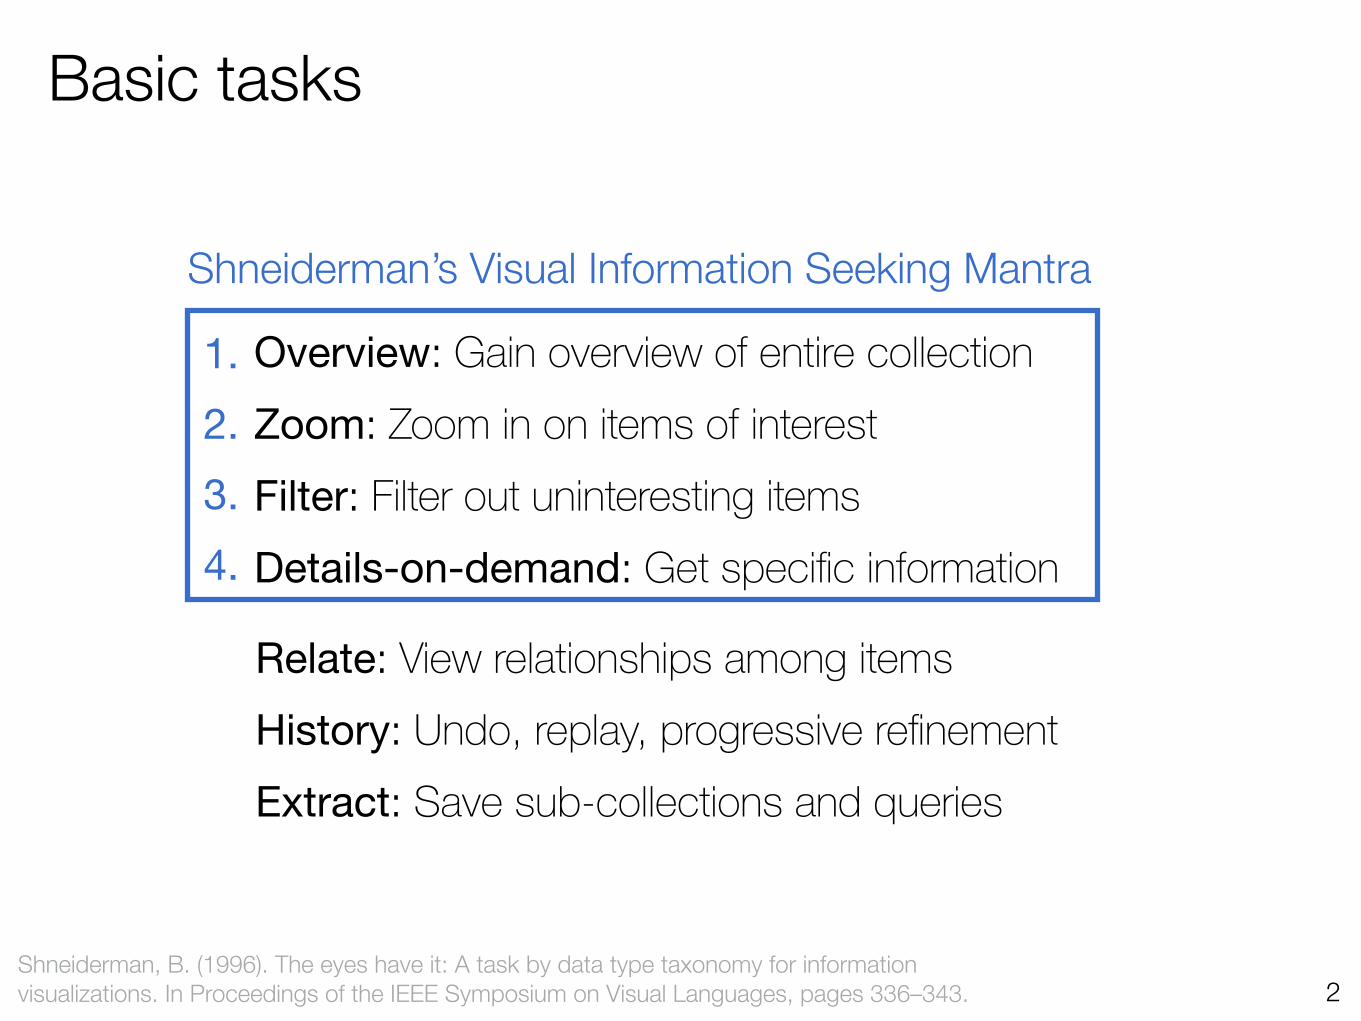
Basic tasks
2Shneiderman, B. (1996). The eyes have it: A task by data type taxonomy for information visualizations. In Proceedings of the IEEE Symposium on Visual Languages, pages 336–343.
Overview: Gain overview of entire collection Zoom: Zoom in on items of interest Filter: Filter out uninteresting items Details-on-demand: Get specific information
Relate: View relationships among items History: Undo, replay, progressive refinement Extract: Save sub-collections and queries
Shneiderman’s Visual Information Seeking Mantra
1.2.3.4.
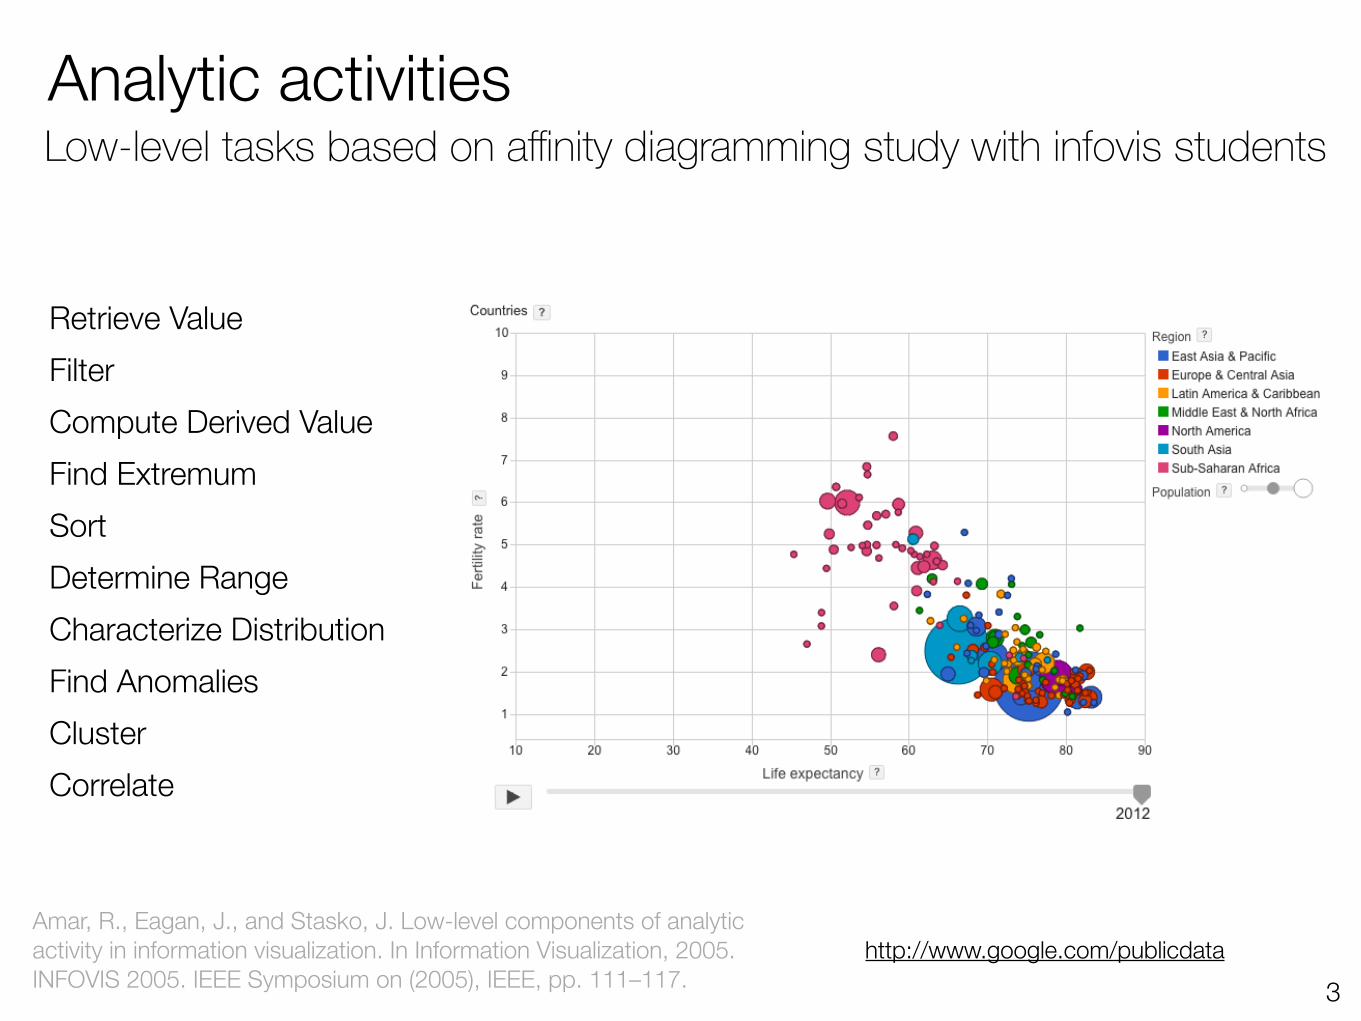
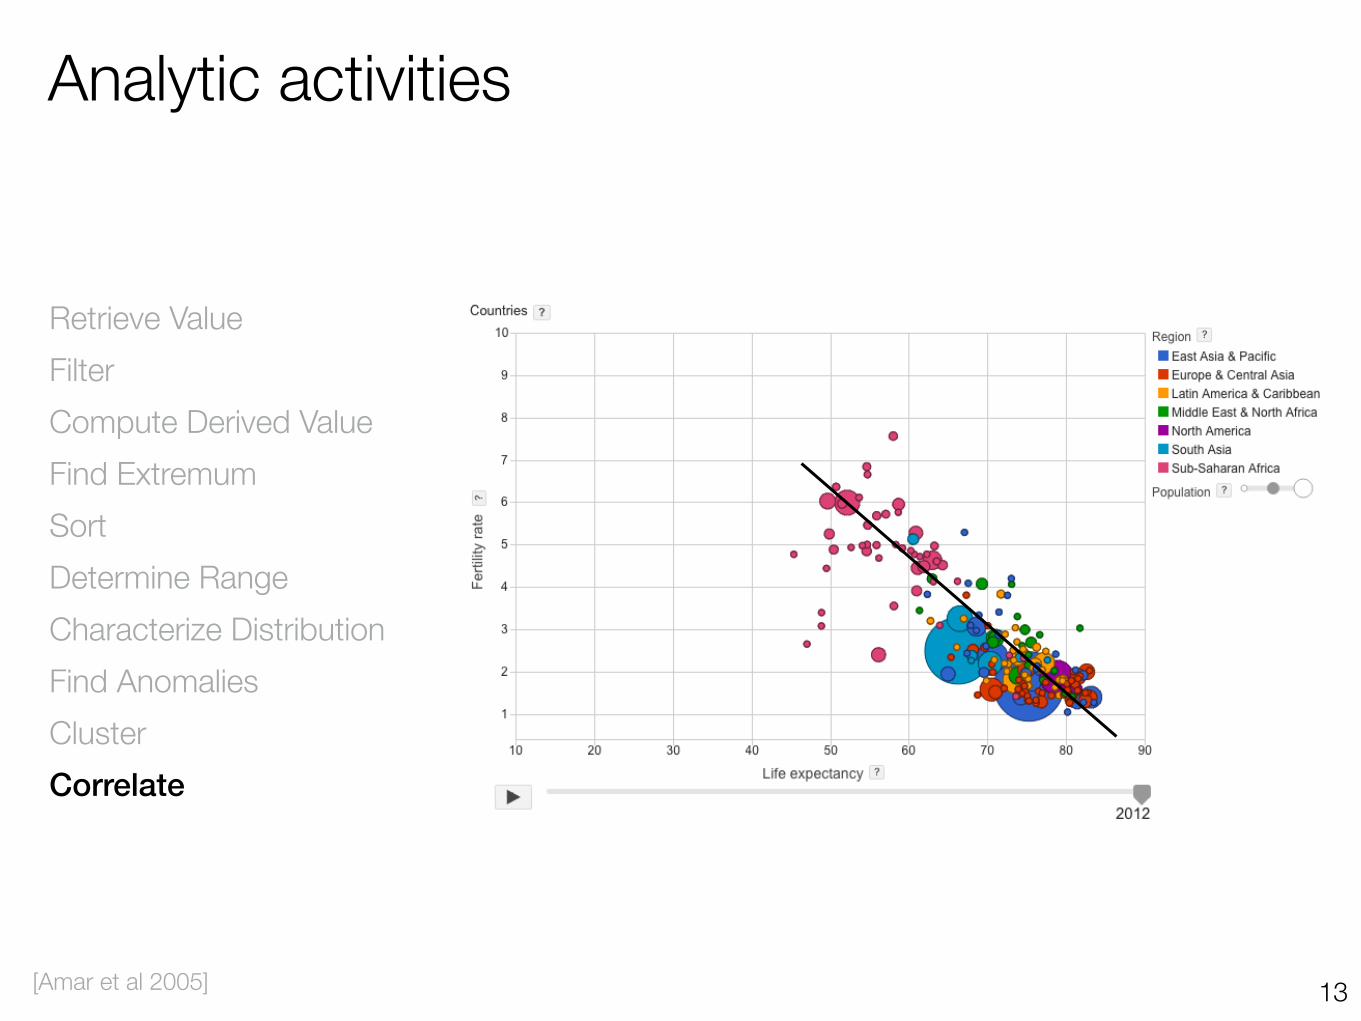
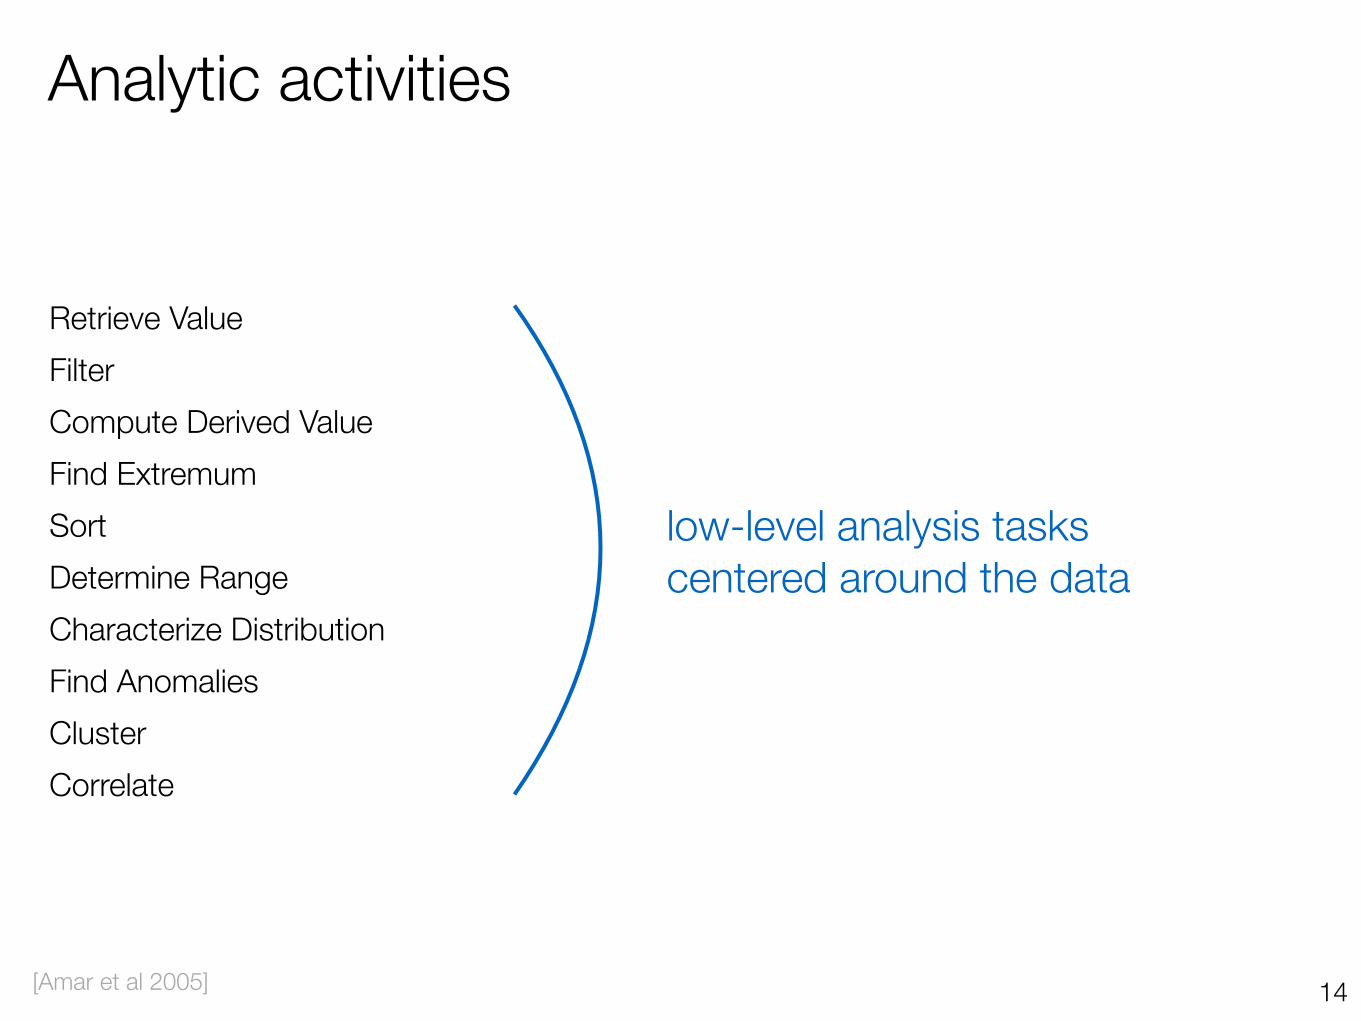
Analytic activities
Retrieve Value Filter Compute Derived Value Find Extremum Sort Determine Range Characterize Distribution Find Anomalies Cluster Correlate
3
Low-level tasks based on affinity diagramming study with infovis students
Amar, R., Eagan, J., and Stasko, J. Low-level components of analytic activity in information visualization. In Information Visualization, 2005. INFOVIS 2005. IEEE Symposium on (2005), IEEE, pp. 111–117.
http://www.google.com/publicdata
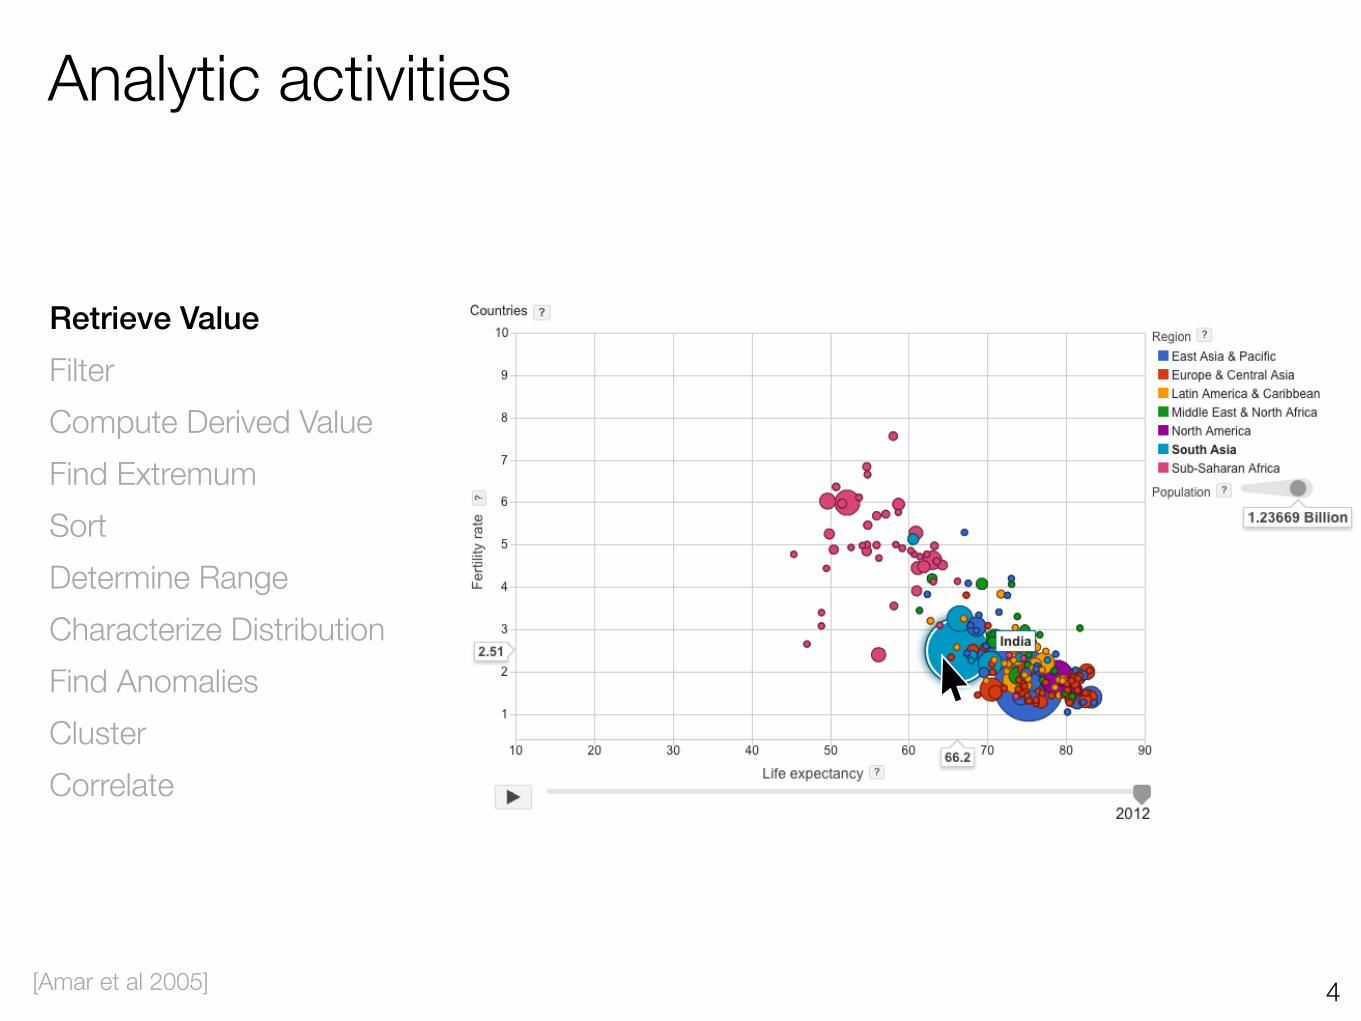
Analytic activities
4
Retrieve Value Filter Compute Derived Value Find Extremum Sort Determine Range Characterize Distribution Find Anomalies Cluster Correlate
[Amar et al 2005]
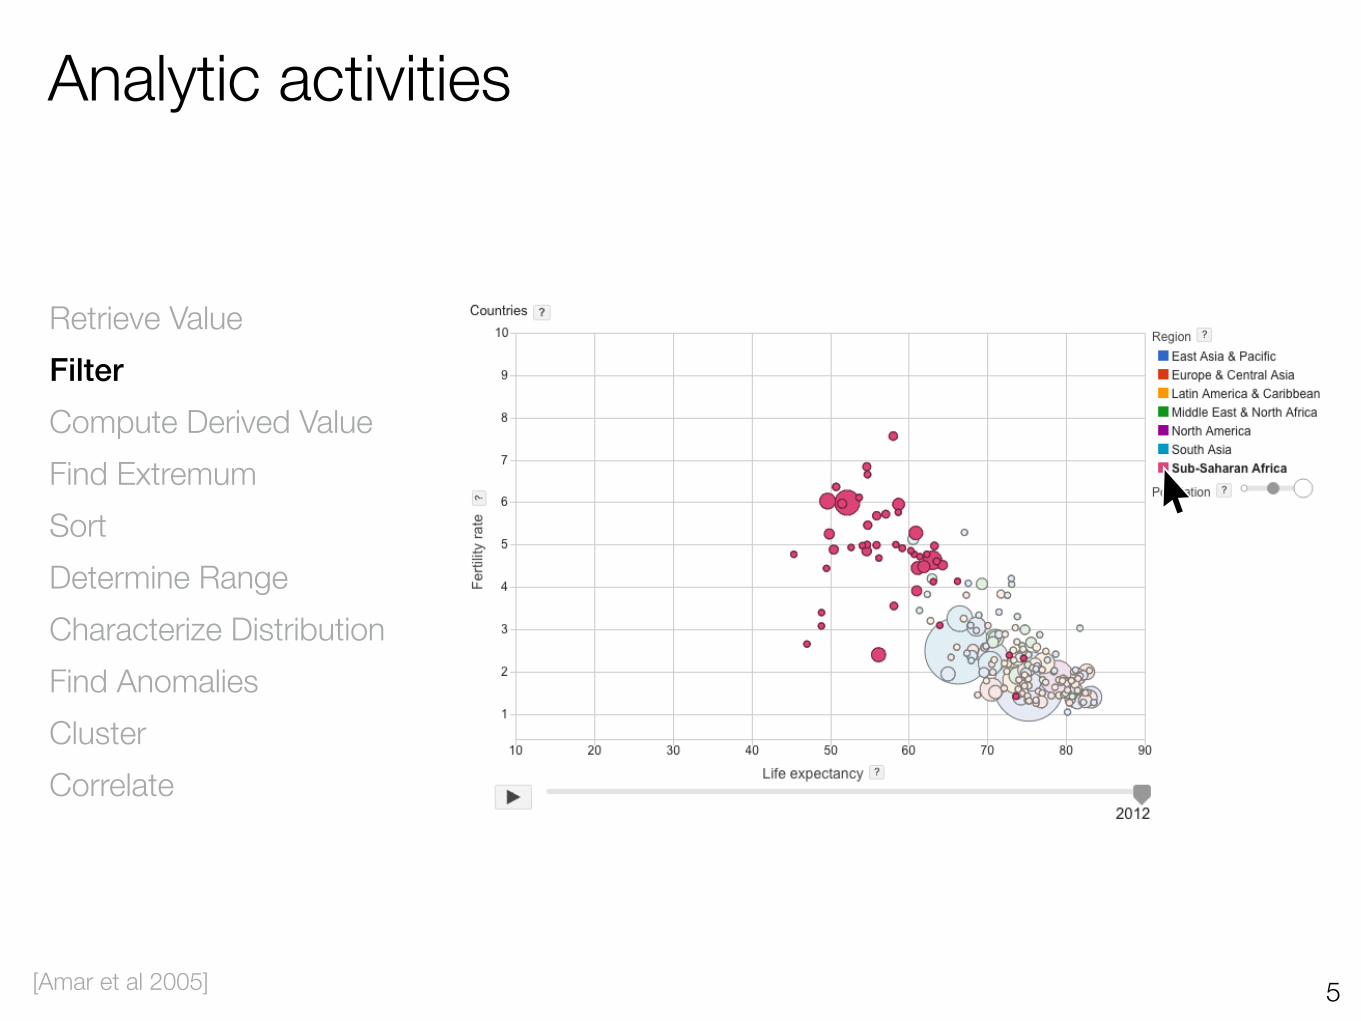
Analytic activities
5
Retrieve Value Filter Compute Derived Value Find Extremum Sort Determine Range Characterize Distribution Find Anomalies Cluster Correlate
[Amar et al 2005]
Analytic activities
6
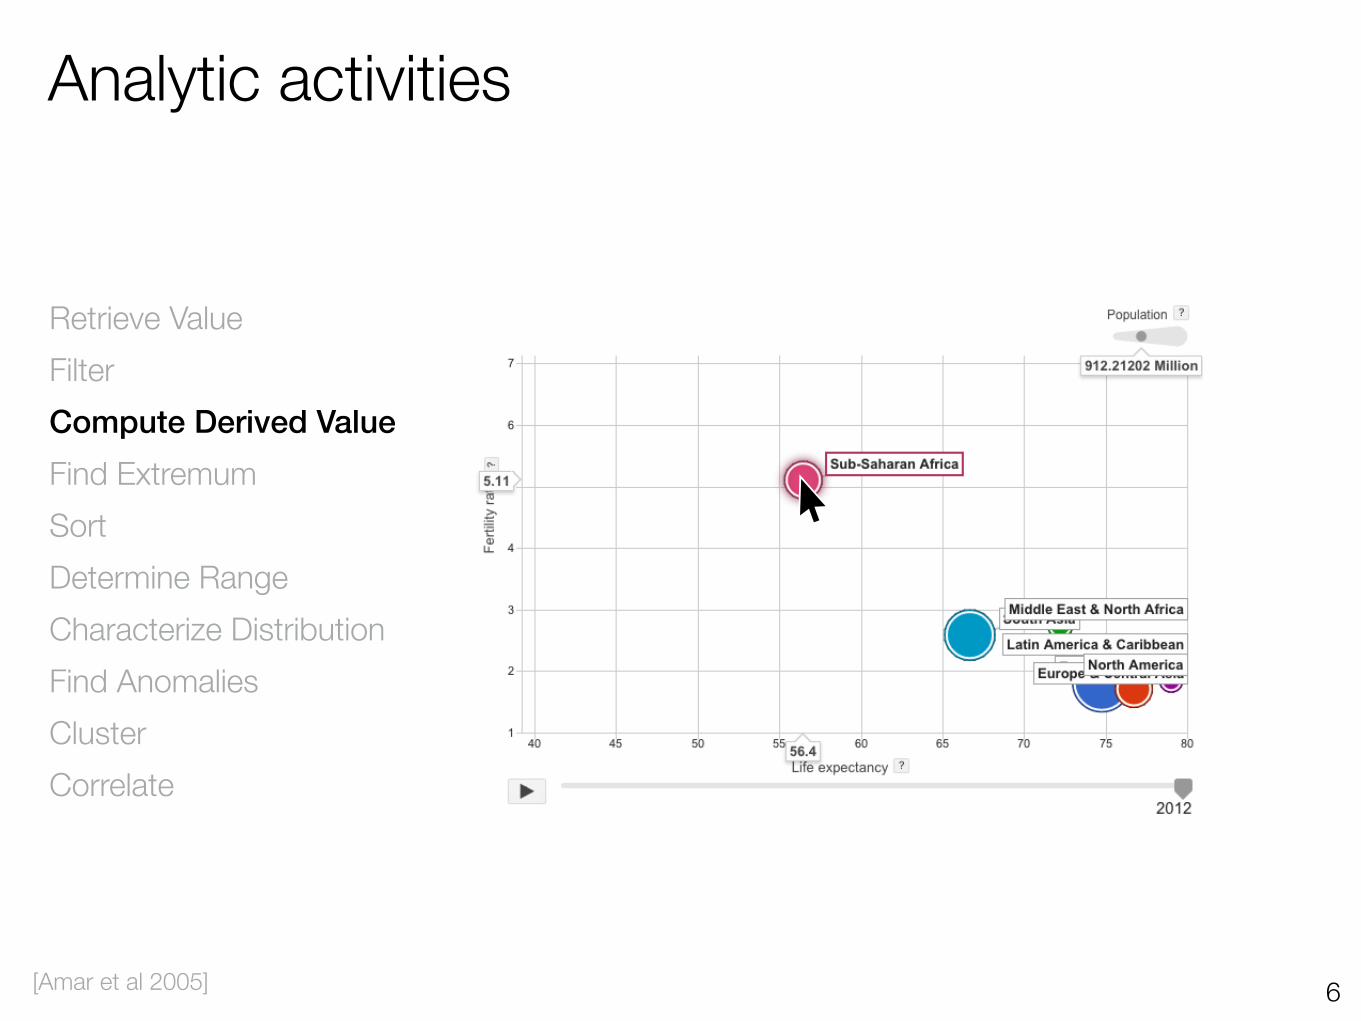
Retrieve Value Filter Compute Derived Value Find Extremum Sort Determine Range Characterize Distribution Find Anomalies Cluster Correlate
[Amar et al 2005]
Analytic activities
7
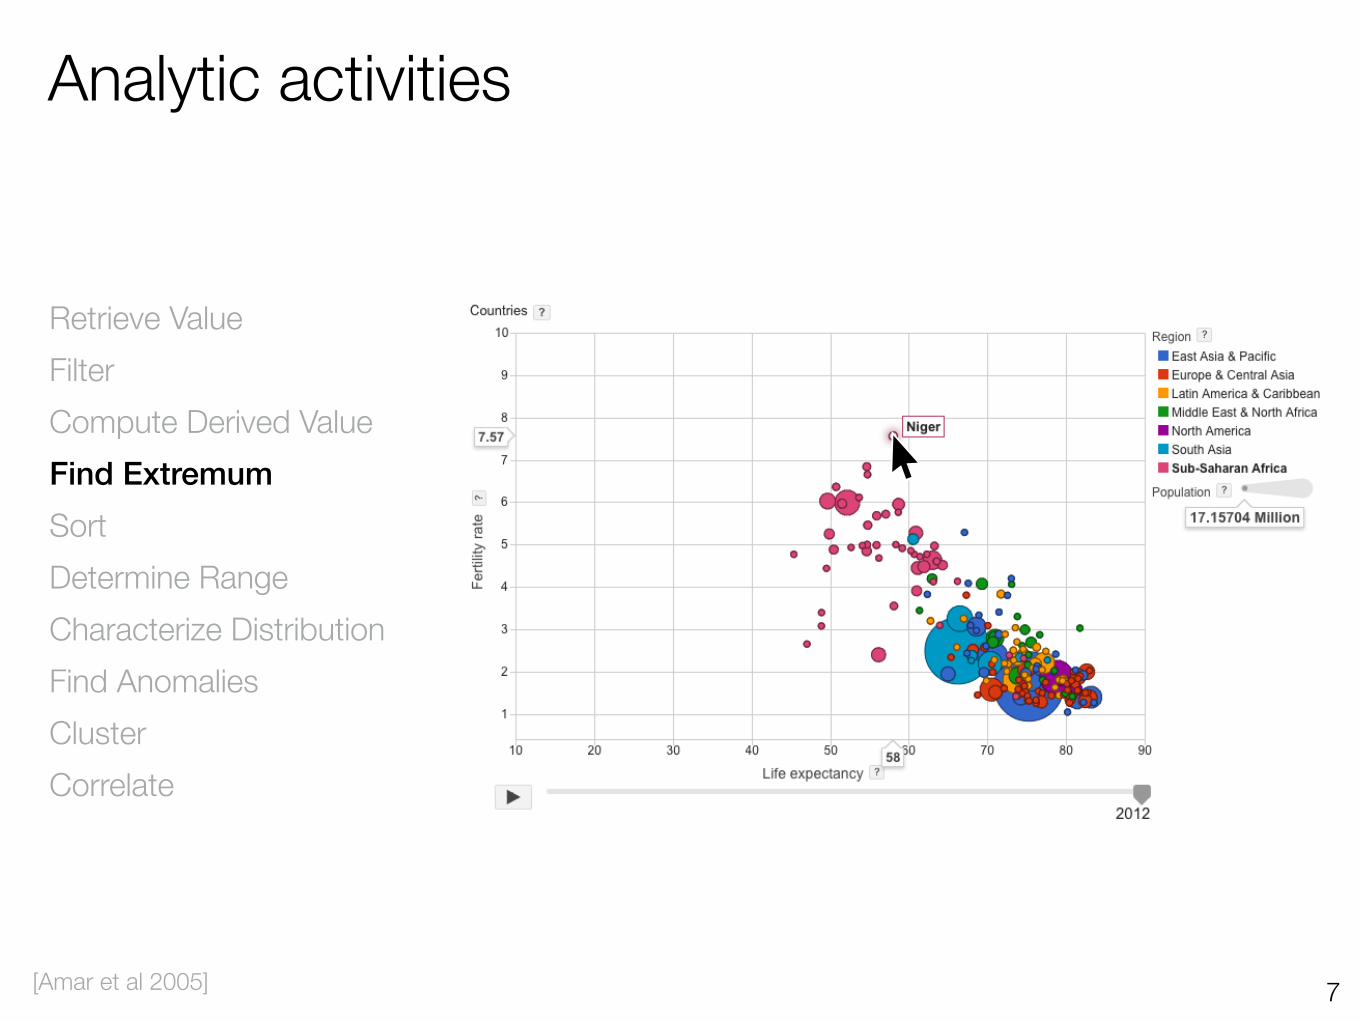
Retrieve Value Filter Compute Derived Value Find Extremum Sort Determine Range Characterize Distribution Find Anomalies Cluster Correlate
[Amar et al 2005]

Analytic activities
8
Retrieve Value Filter Compute Derived Value Find Extremum Sort Determine Range Characterize Distribution Find Anomalies Cluster Correlate
[Amar et al 2005]
Analytic activities
9
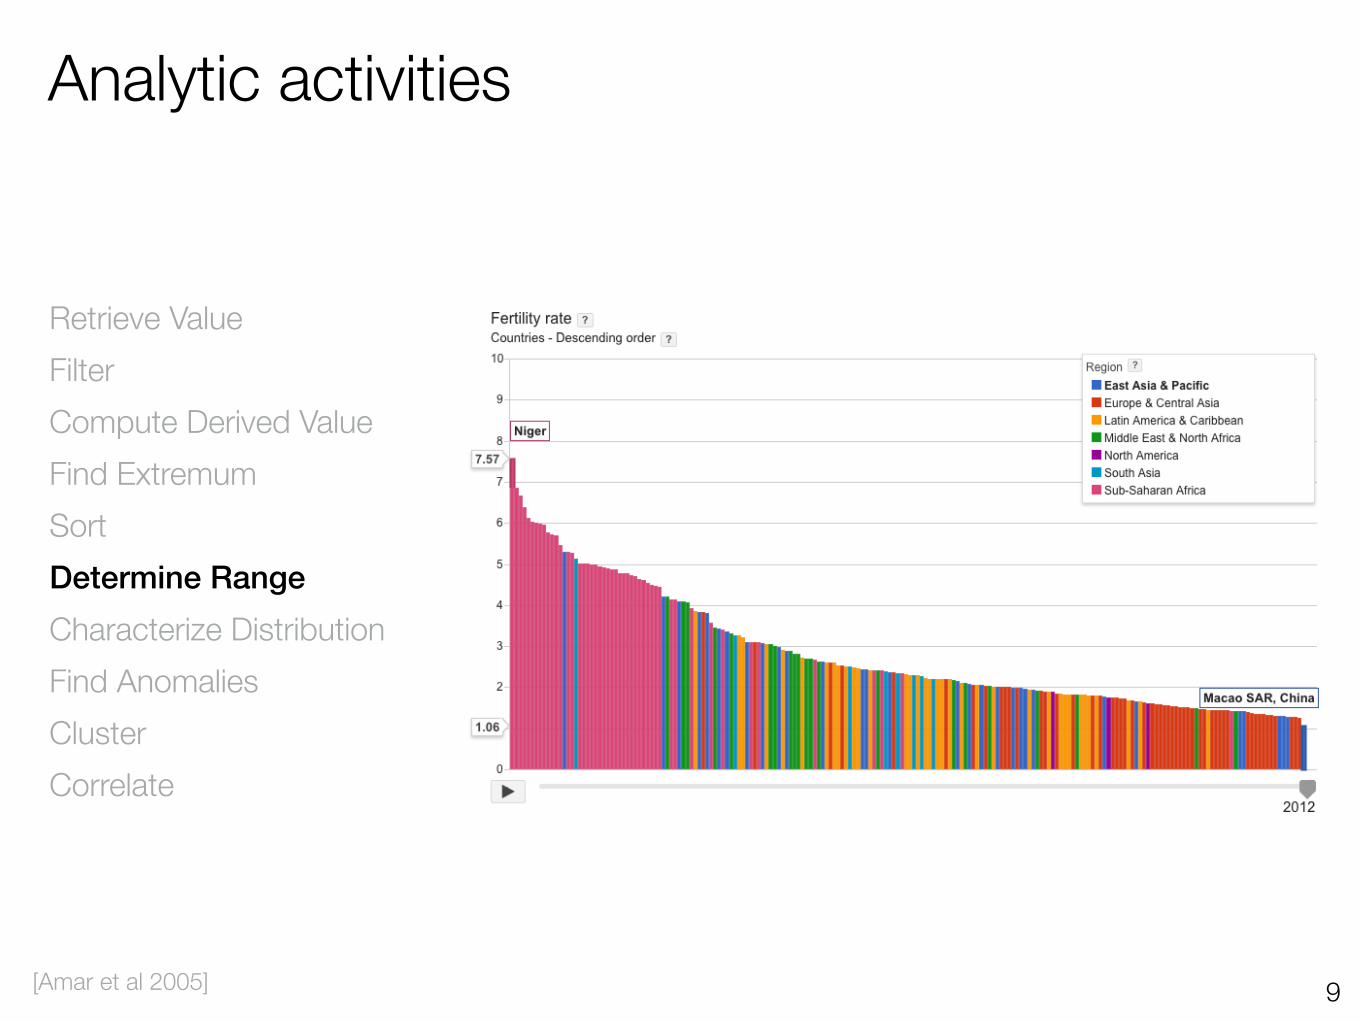
Retrieve Value Filter Compute Derived Value Find Extremum Sort Determine Range Characterize Distribution Find Anomalies Cluster Correlate
[Amar et al 2005]

Analytic activities
10
Retrieve Value Filter Compute Derived Value Find Extremum Sort Determine Range Characterize Distribution Find Anomalies Cluster Correlate
[Amar et al 2005]
Analytic activities
11
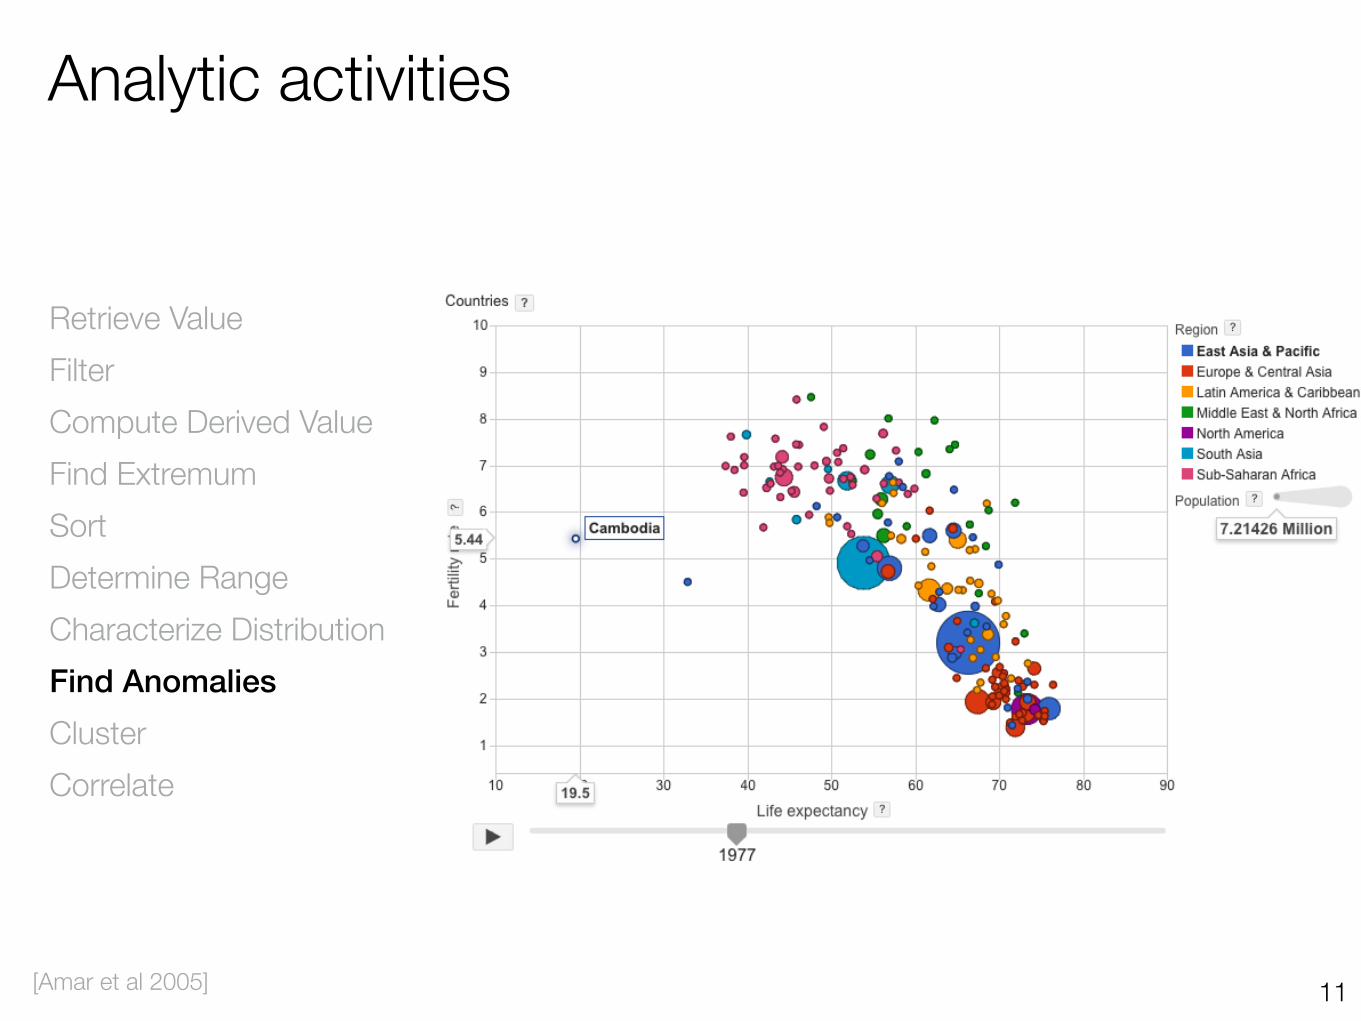
Retrieve Value Filter Compute Derived Value Find Extremum Sort Determine Range Characterize Distribution Find Anomalies Cluster Correlate
[Amar et al 2005]

Analytic activities
12
Retrieve Value Filter Compute Derived Value Find Extremum Sort Determine Range Characterize Distribution Find Anomalies Cluster Correlate
[Amar et al 2005]
Analytic activities
13
Retrieve Value Filter Compute Derived Value Find Extremum Sort Determine Range Characterize Distribution Find Anomalies Cluster Correlate
[Amar et al 2005]
Analytic activities
14
low-level analysis tasks centered around the data
Retrieve Value Filter Compute Derived Value Find Extremum Sort Determine Range Characterize Distribution Find Anomalies Cluster Correlate
[Amar et al 2005]
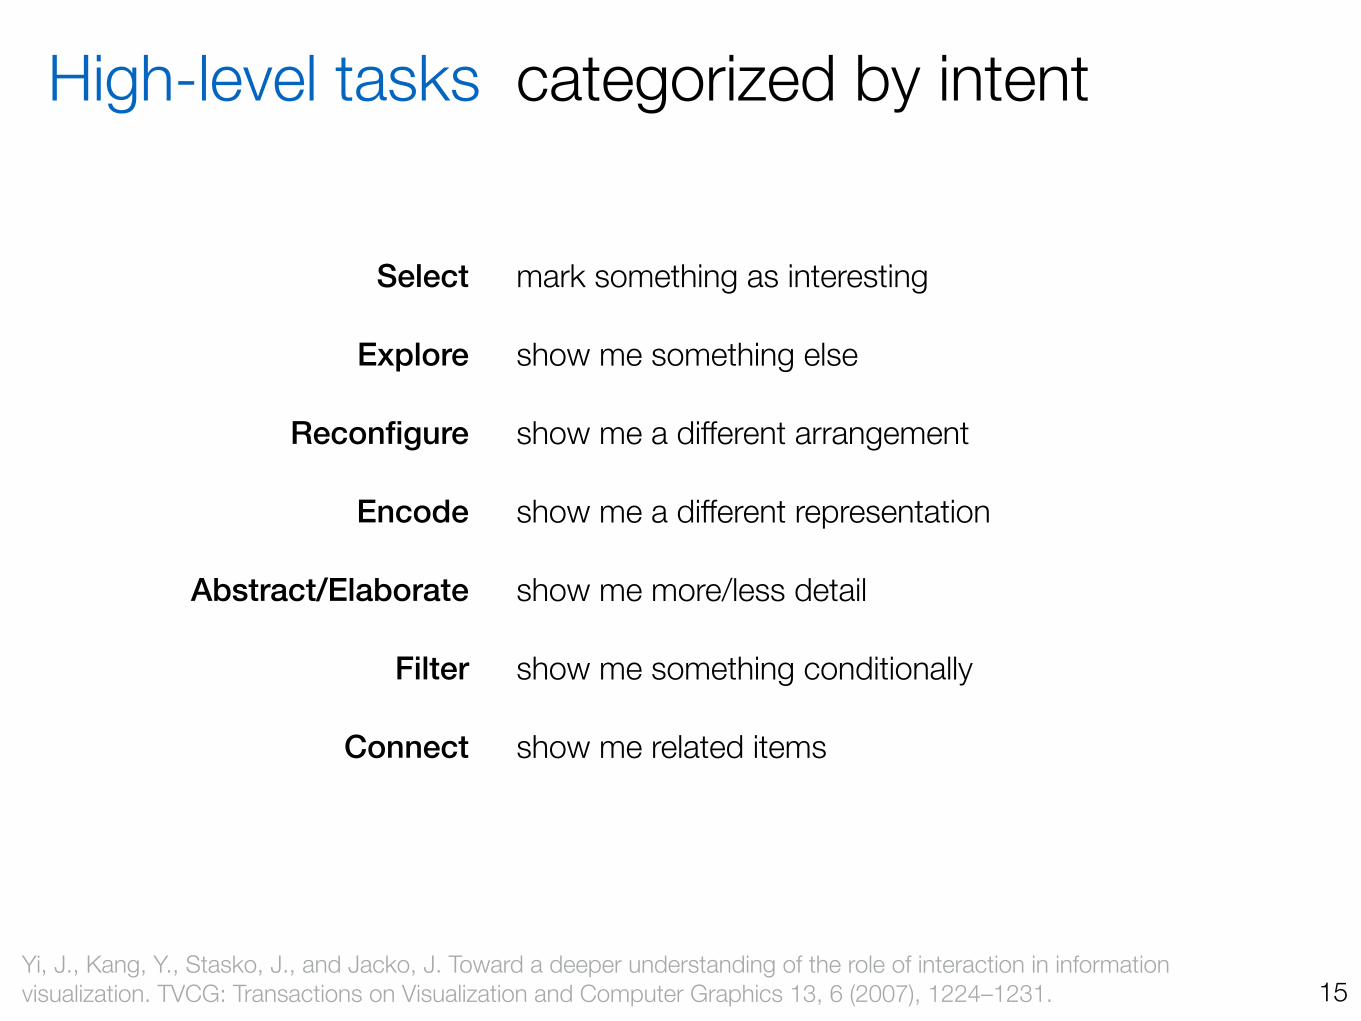
High-level tasks categorized by intent
Select
Explore
Reconfigure
Encode
Abstract/Elaborate
Filter
Connect
15Yi, J., Kang, Y., Stasko, J., and Jacko, J. Toward a deeper understanding of the role of interaction in information visualization. TVCG: Transactions on Visualization and Computer Graphics 13, 6 (2007), 1224–1231.
mark something as interesting
show me something else
show me a different arrangement
show me a different representation
show me more/less detail
show me something conditionally
show me related items
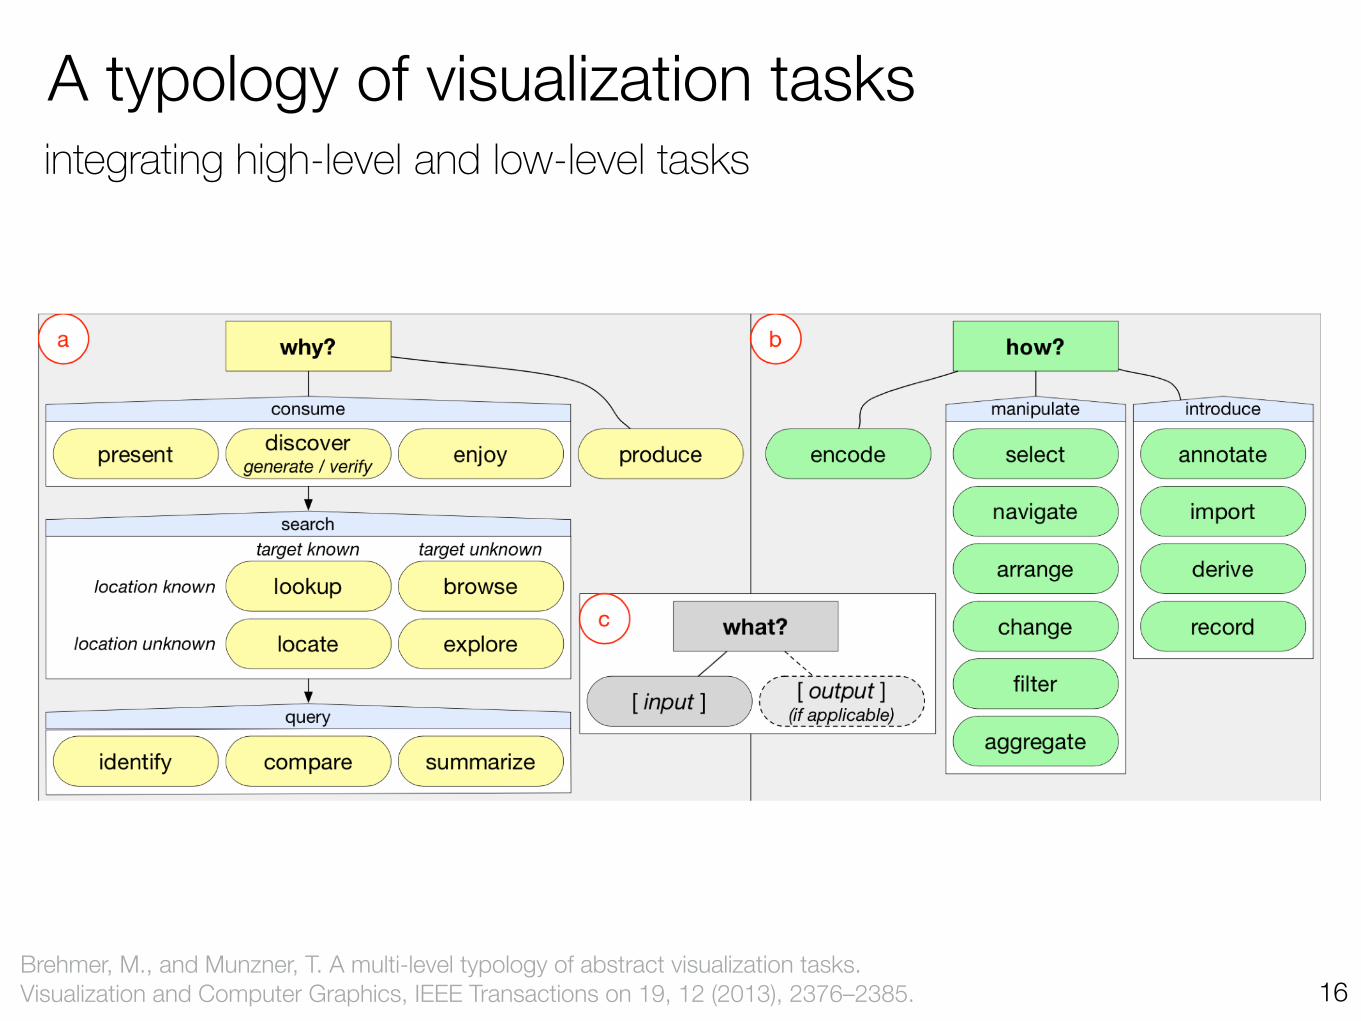
A typology of visualization tasks
16
integrating high-level and low-level tasks
Brehmer, M., and Munzner, T. A multi-level typology of abstract visualization tasks. Visualization and Computer Graphics, IEEE Transactions on 19, 12 (2013), 2376–2385.
Interaction techniques
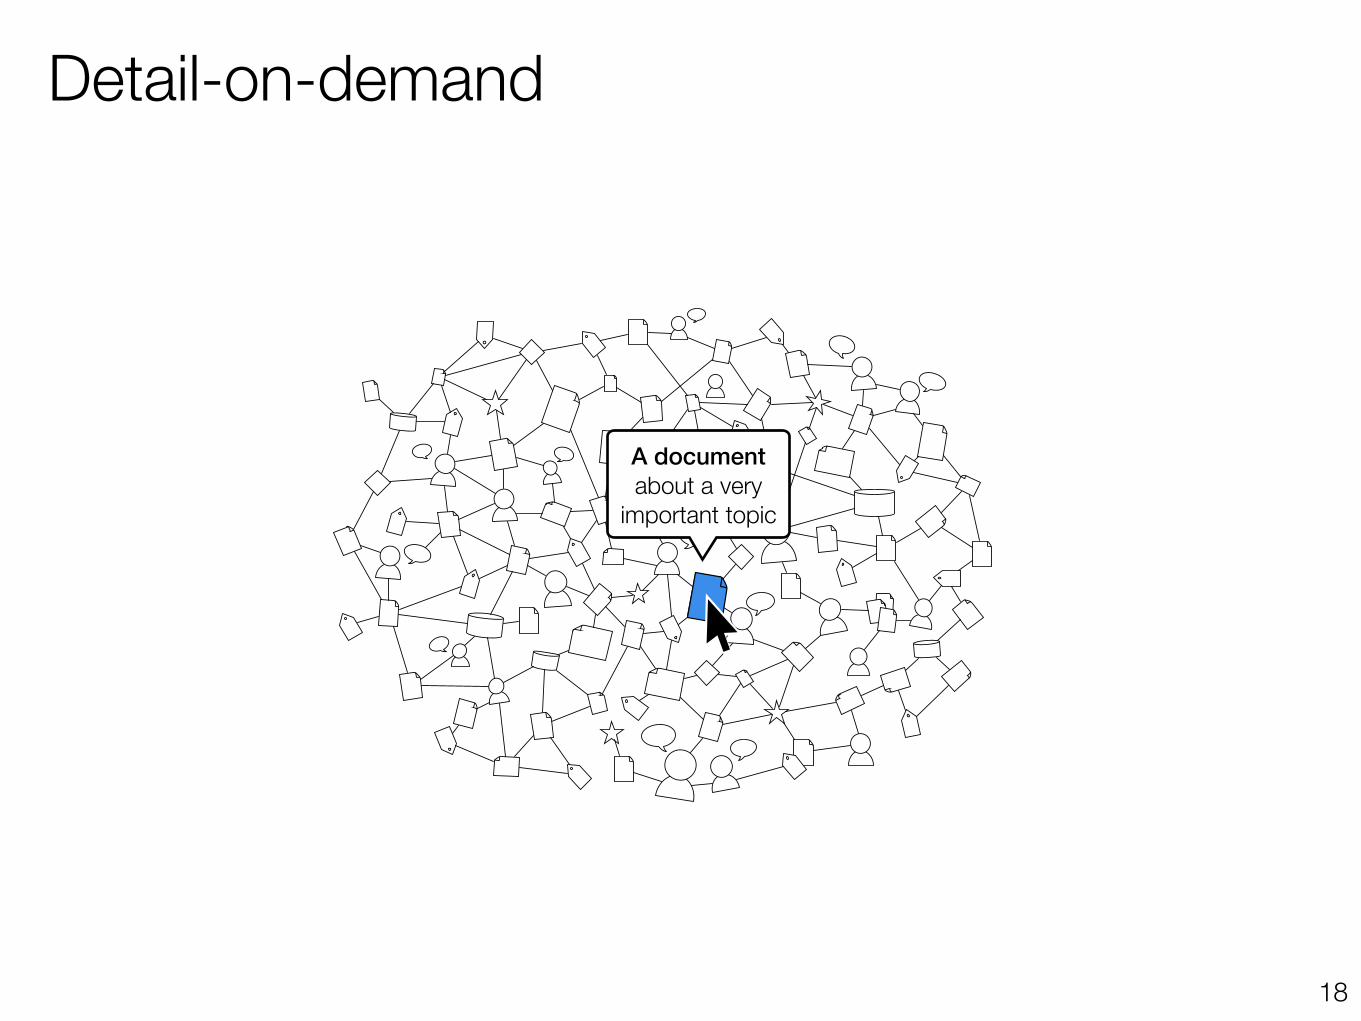
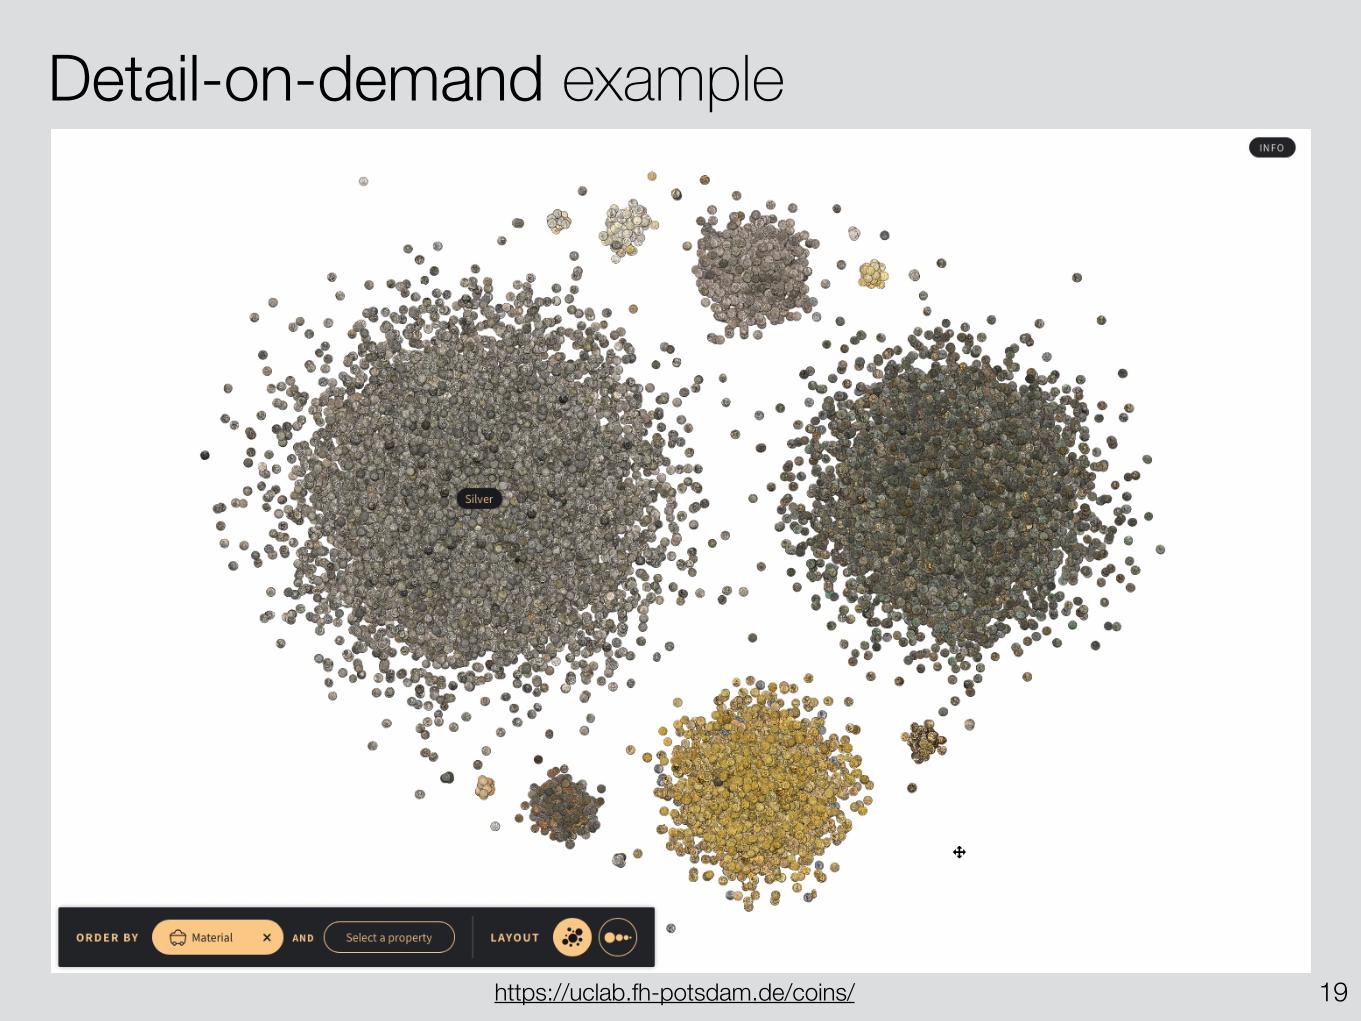
Detail-on-demand
18
A document about a very
important topic
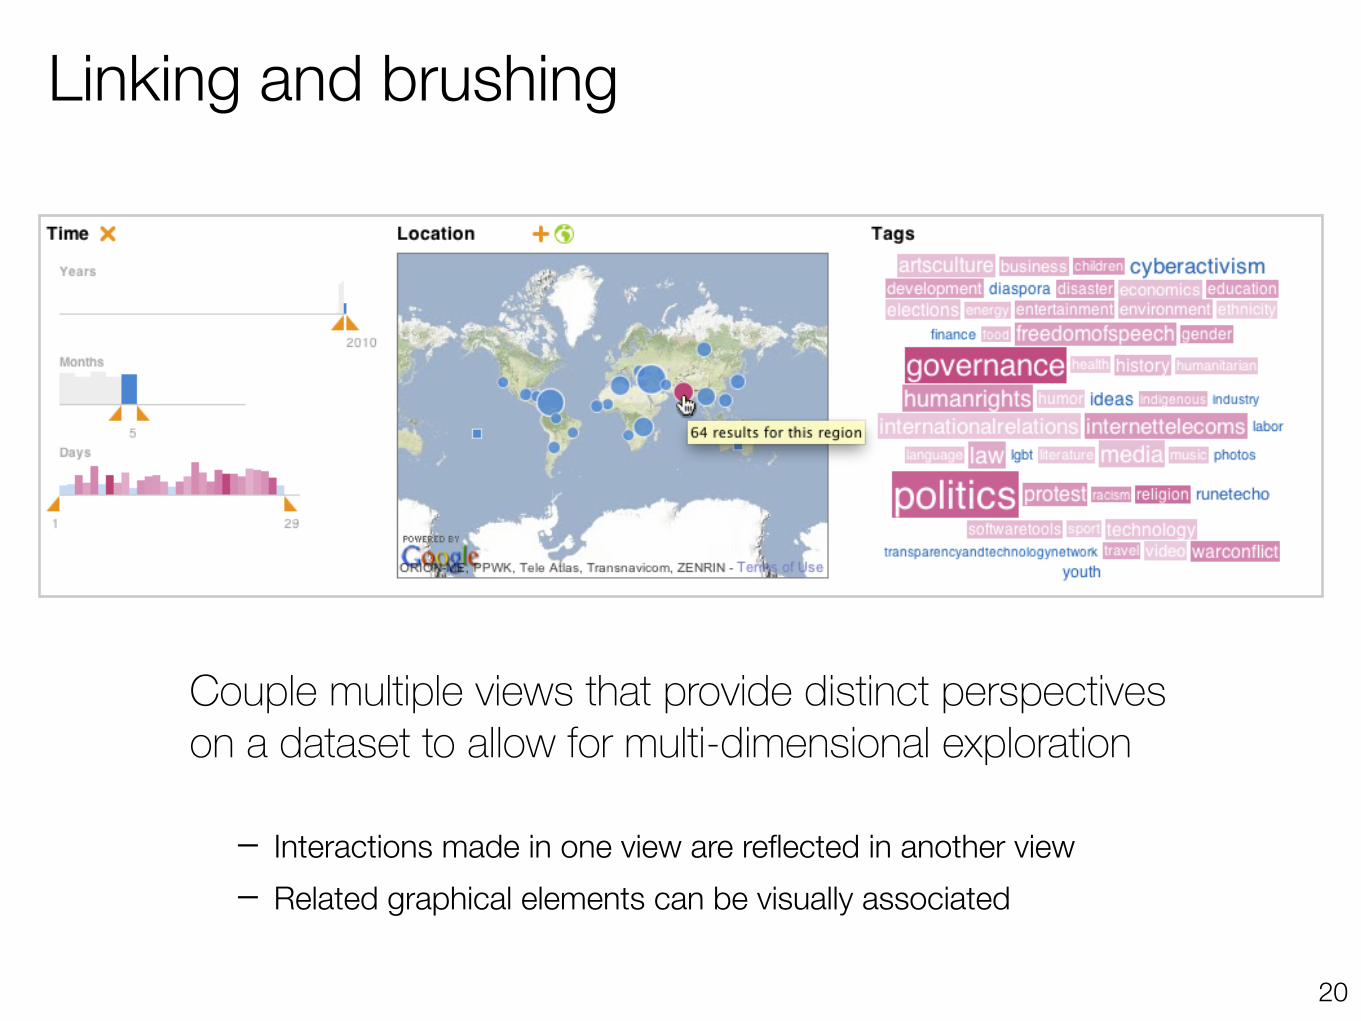
Linking and brushing
20
– Interactions made in one view are reflected in another view – Related graphical elements can be visually associated
Couple multiple views that provide distinct perspectives on a dataset to allow for multi-dimensional exploration
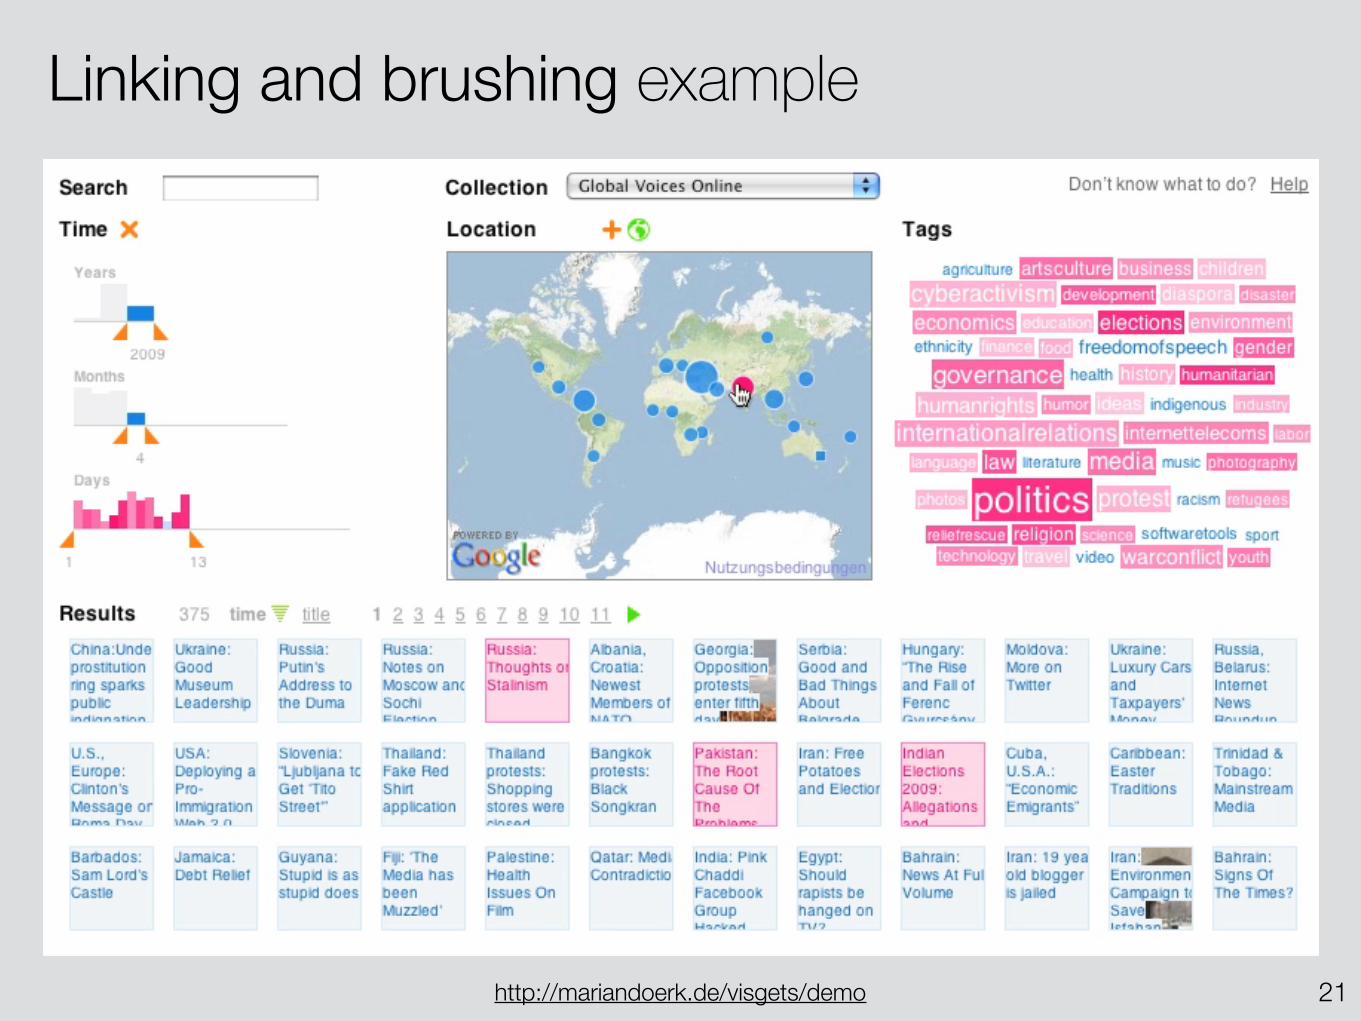
Linking and brushing example
21http://mariandoerk.de/visgets/demo
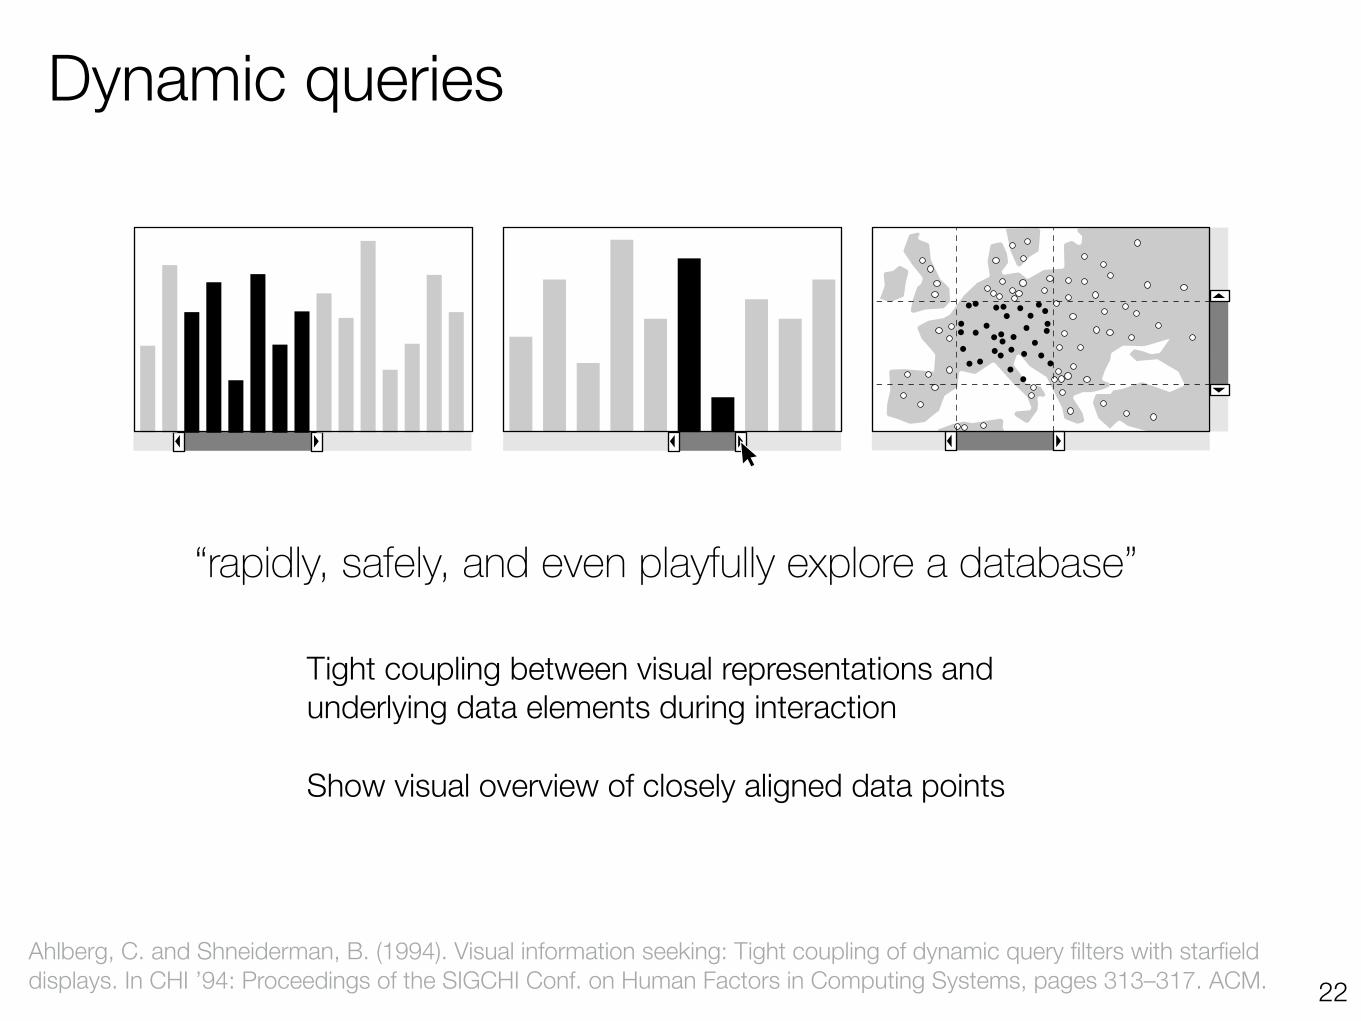
Dynamic queries
Tight coupling between visual representations and underlying data elements during interaction
Show visual overview of closely aligned data points
22Ahlberg, C. and Shneiderman, B. (1994). Visual information seeking: Tight coupling of dynamic query filters with starfield displays. In CHI ’94: Proceedings of the SIGCHI Conf. on Human Factors in Computing Systems, pages 313–317. ACM.
“rapidly, safely, and even playfully explore a database”
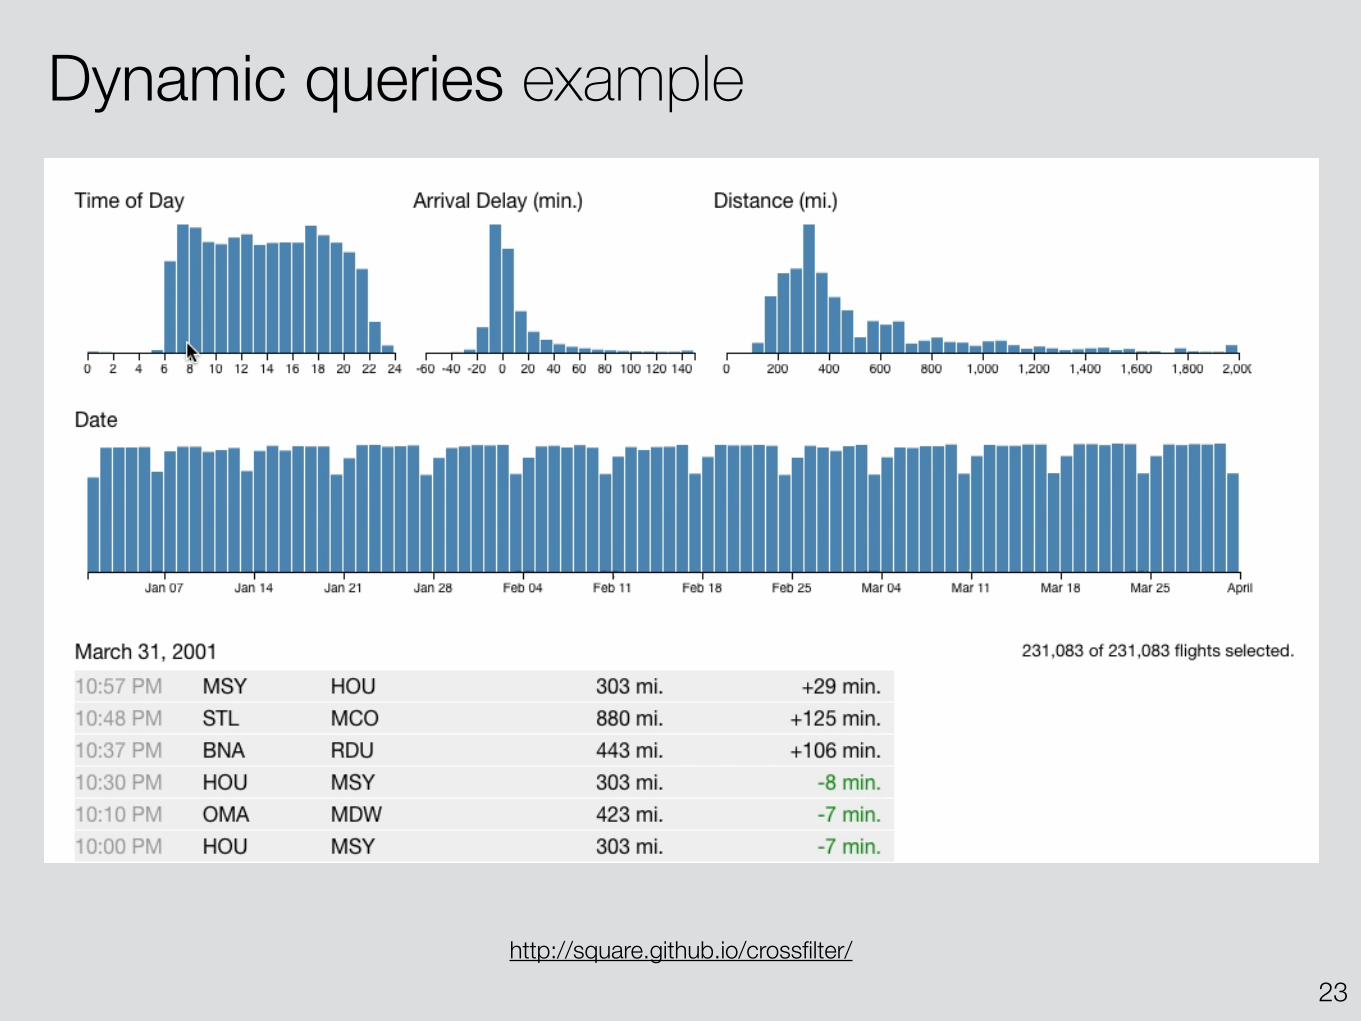
Dynamic queries example
23http://square.github.io/crossfilter/
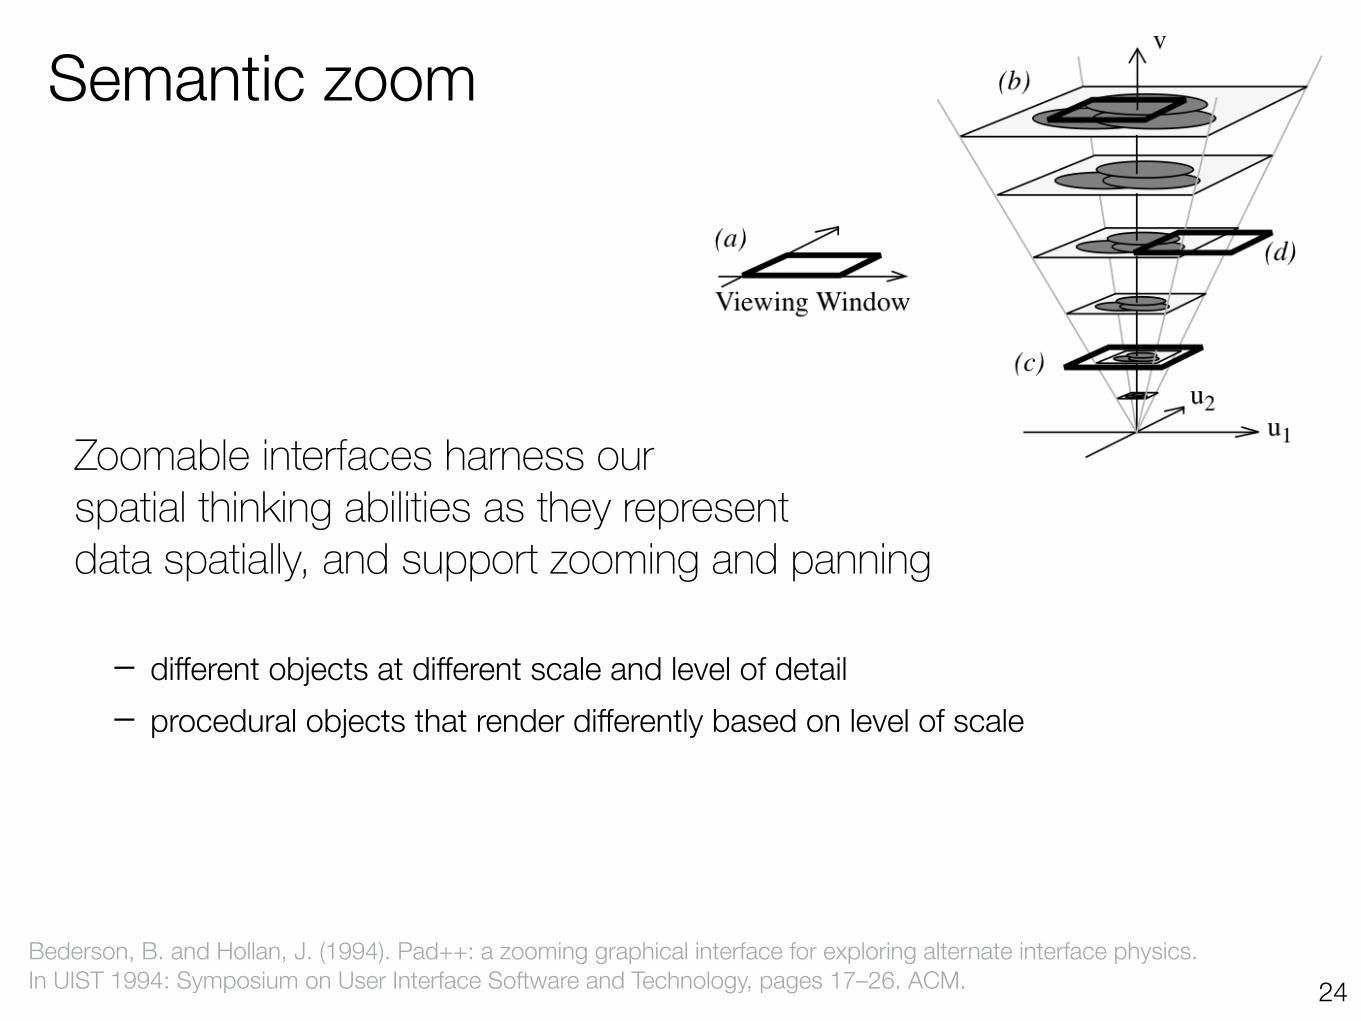
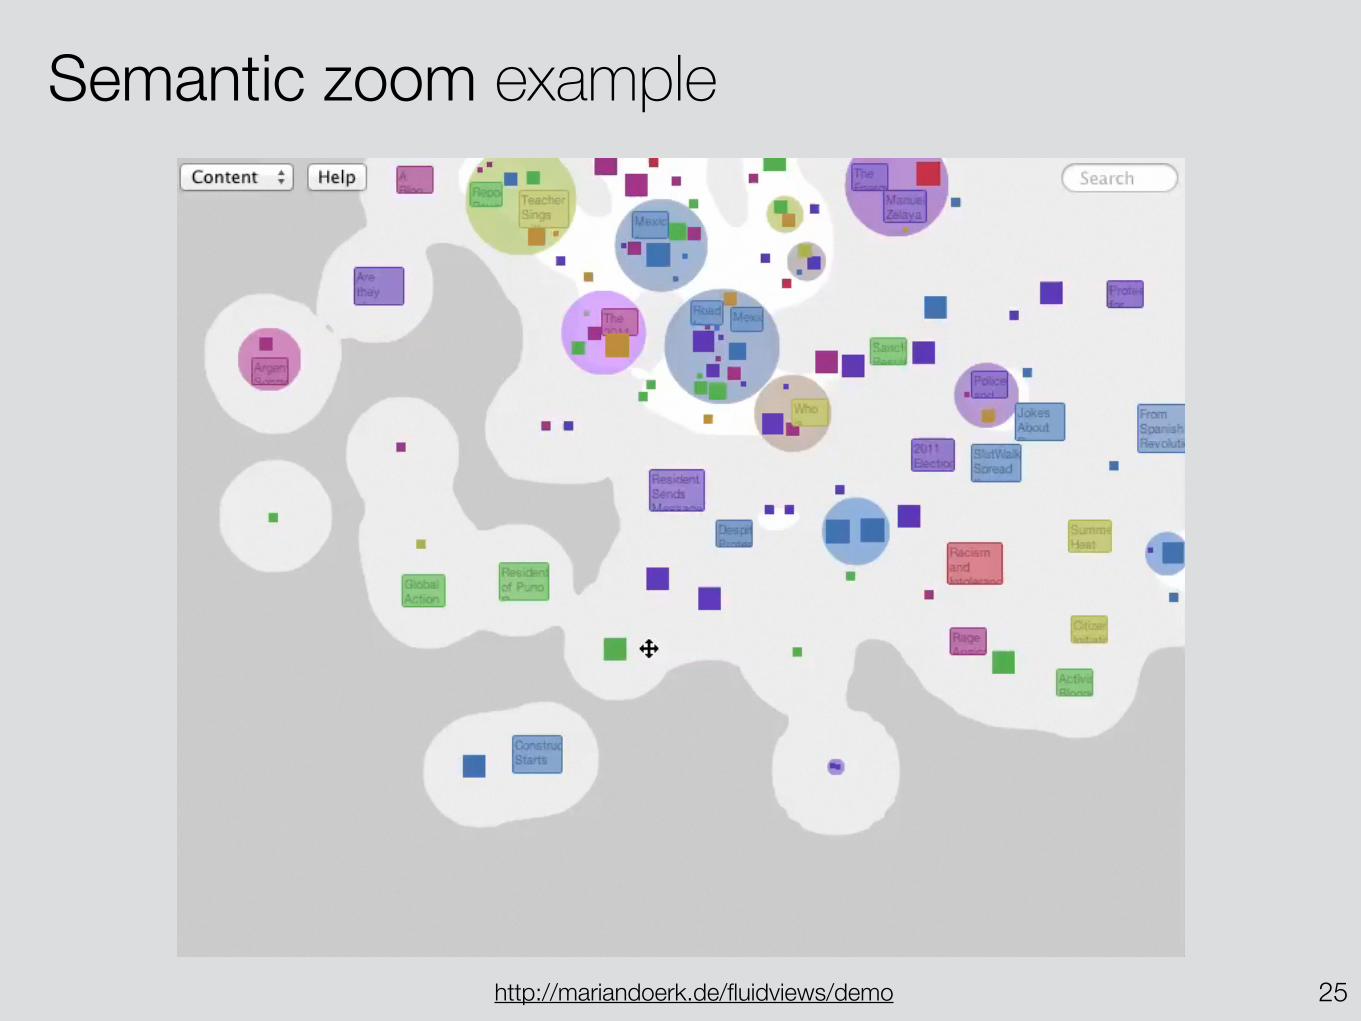
Zoomable interfaces harness our spatial thinking abilities as they represent data spatially, and support zooming and panning
– different objects at different scale and level of detail – procedural objects that render differently based on level of scale
Semantic zoom
24Bederson, B. and Hollan, J. (1994). Pad++: a zooming graphical interface for exploring alternate interface physics. In UIST 1994: Symposium on User Interface Software and Technology, pages 17–26. ACM.
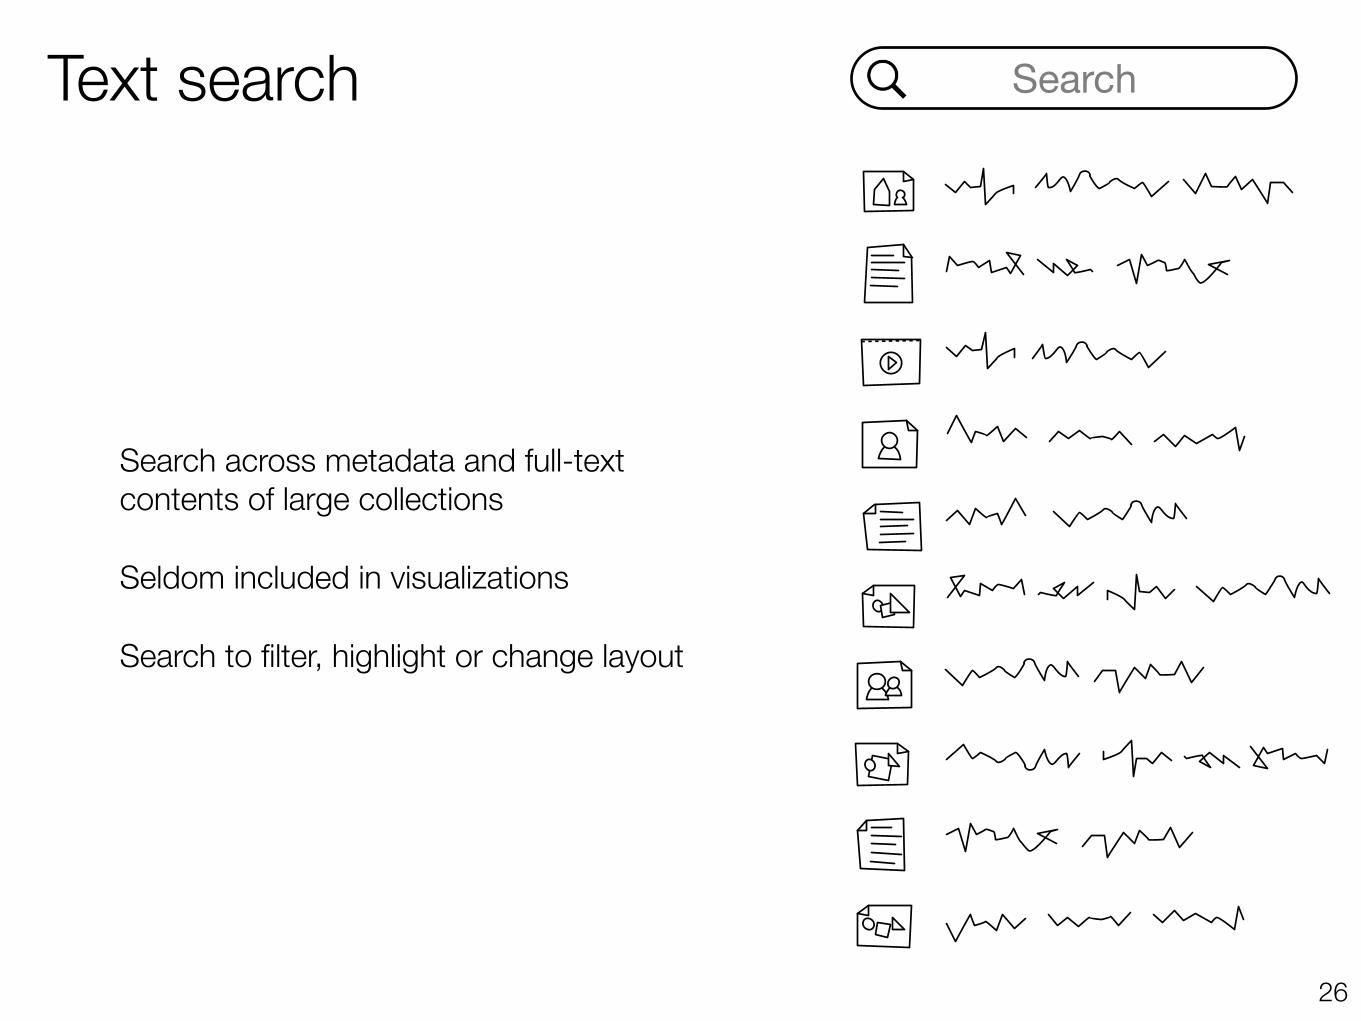
Text search
Search across metadata and full-text contents of large collections
Seldom included in visualizations
Search to filter, highlight or change layout
26
Search
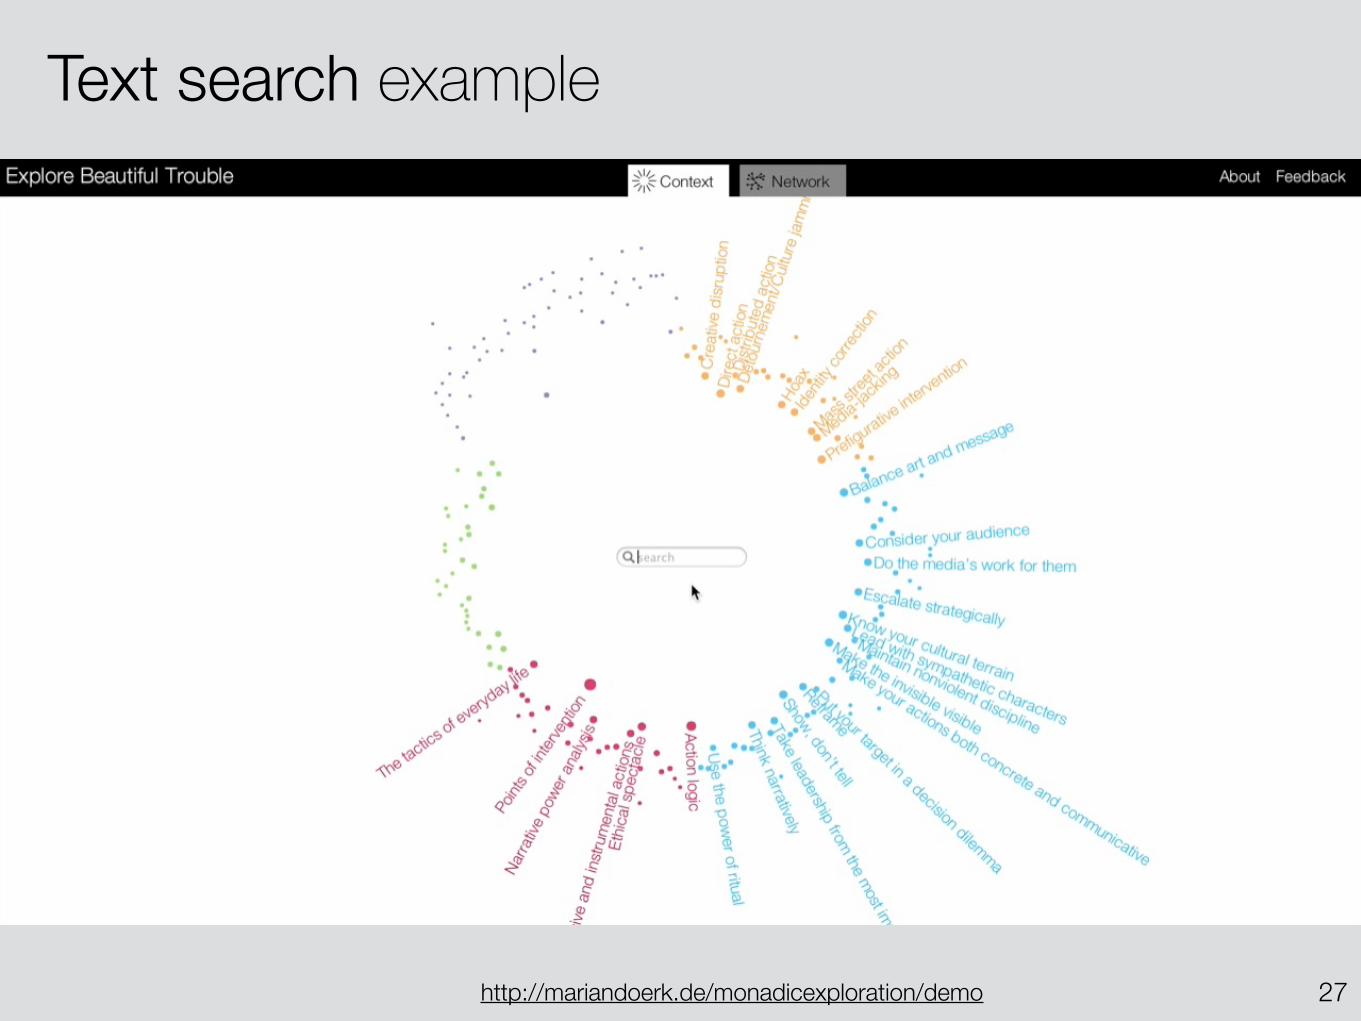
Text search example
27http://mariandoerk.de/monadicexploration/demo
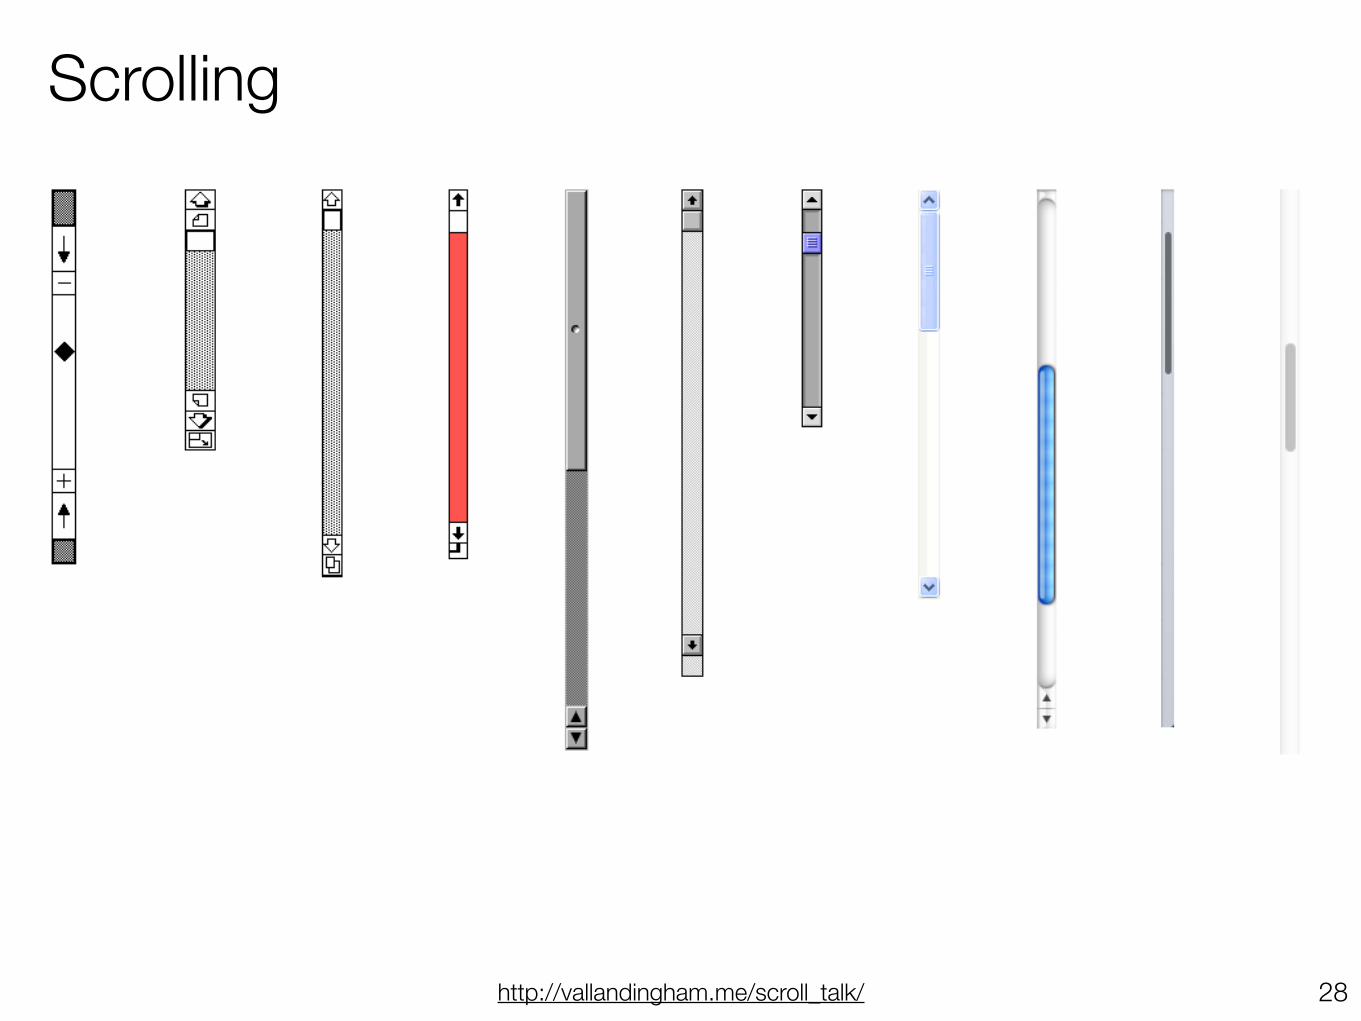
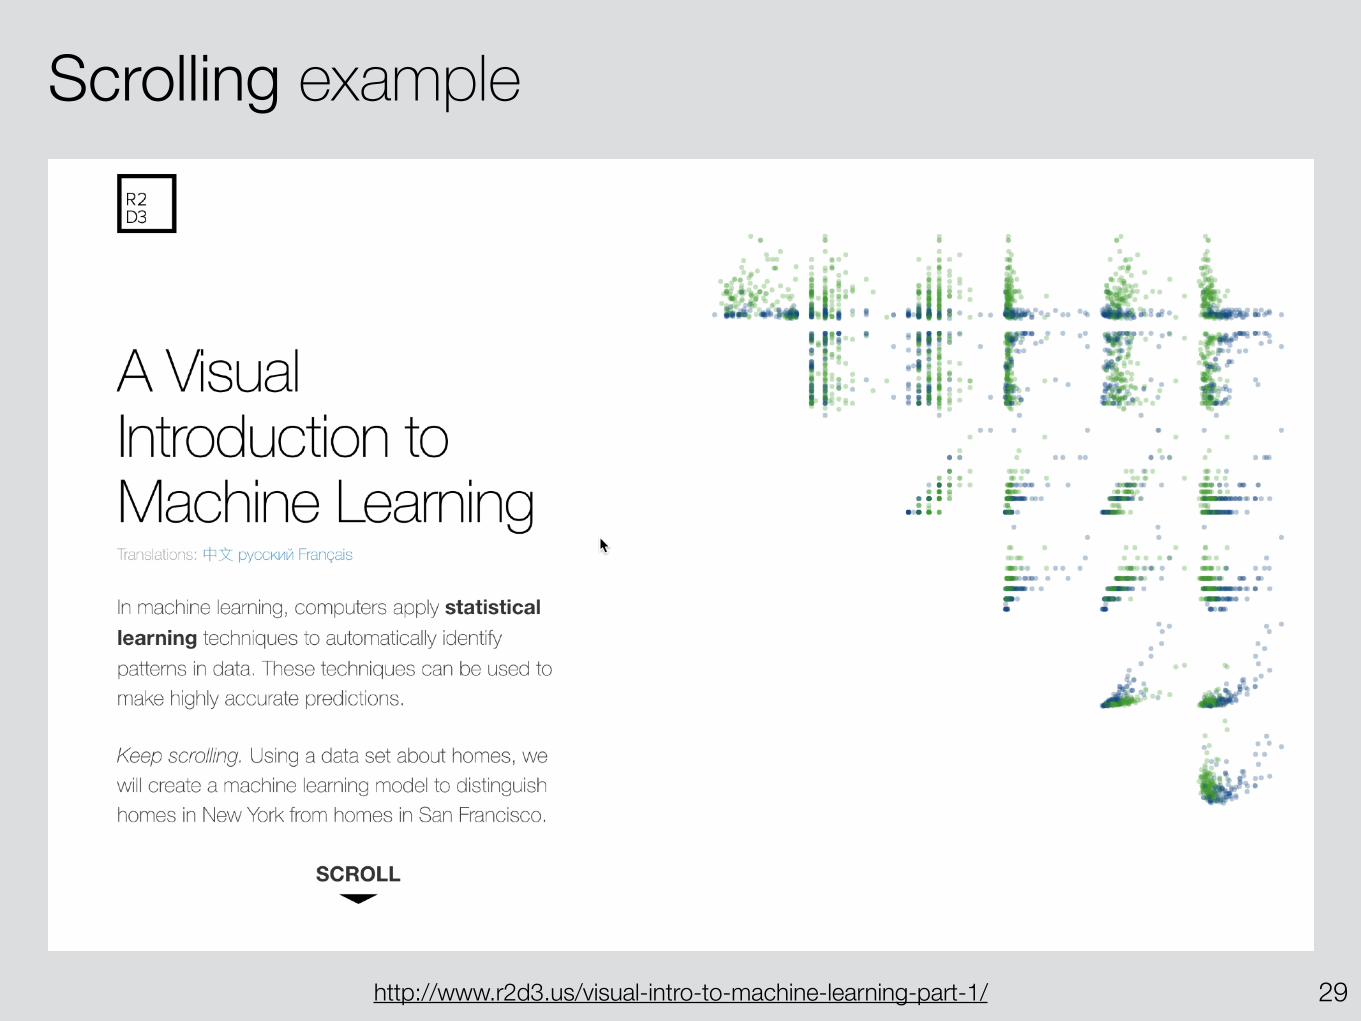
Scrolling example
29http://www.r2d3.us/visual-intro-to-machine-learning-part-1/
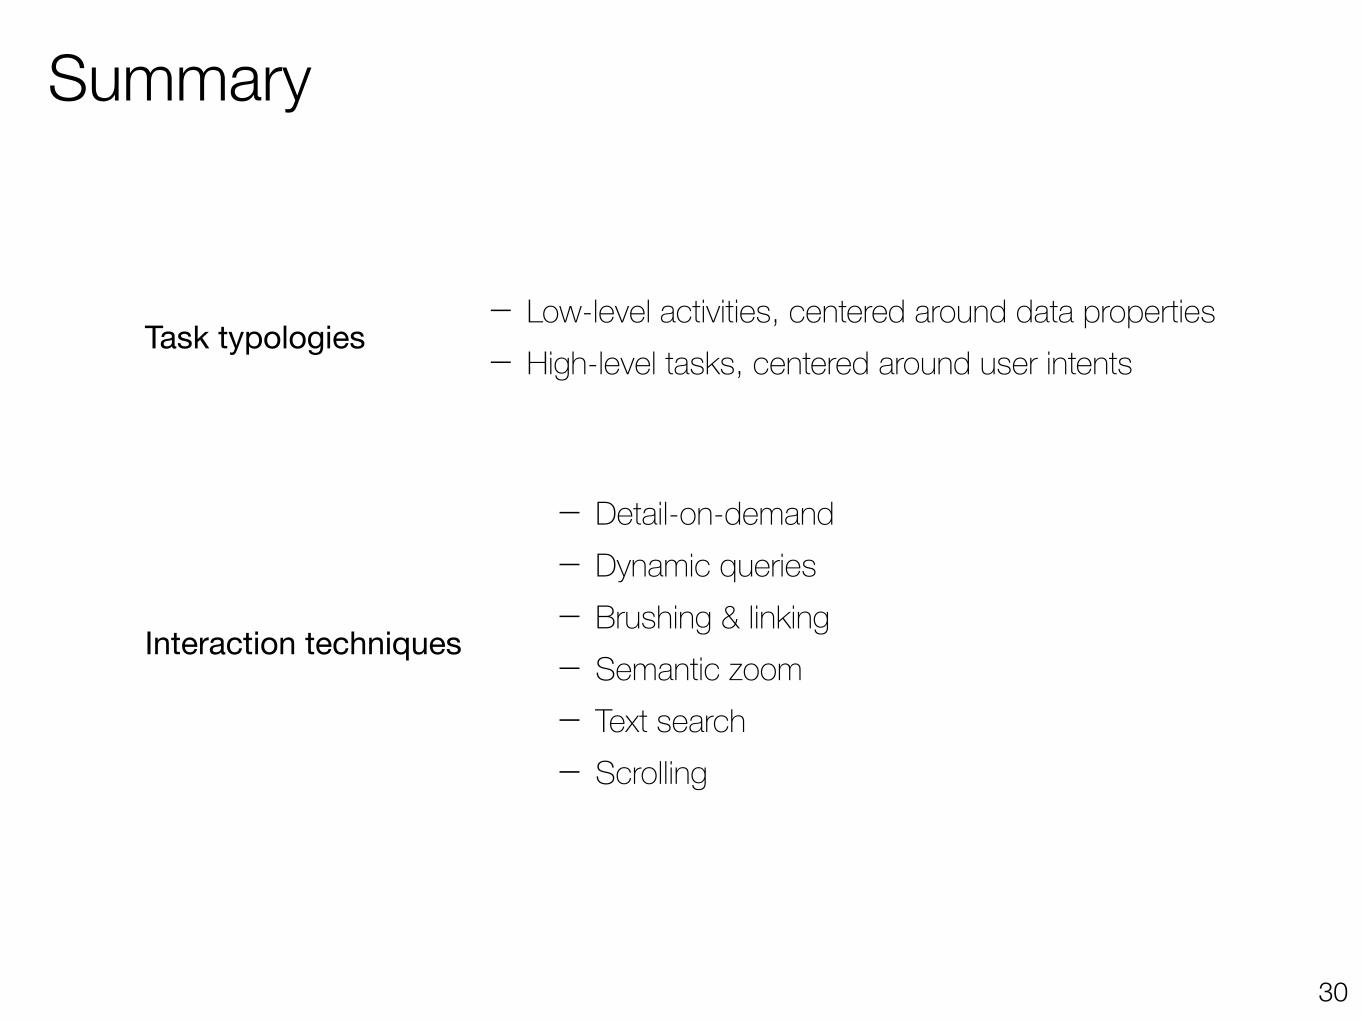
Summary
30
Task typologies– Low-level activities, centered around data properties – High-level tasks, centered around user intents
Interaction techniques
– Detail-on-demand – Dynamic queries – Brushing & linking – Semantic zoom – Text search – Scrolling
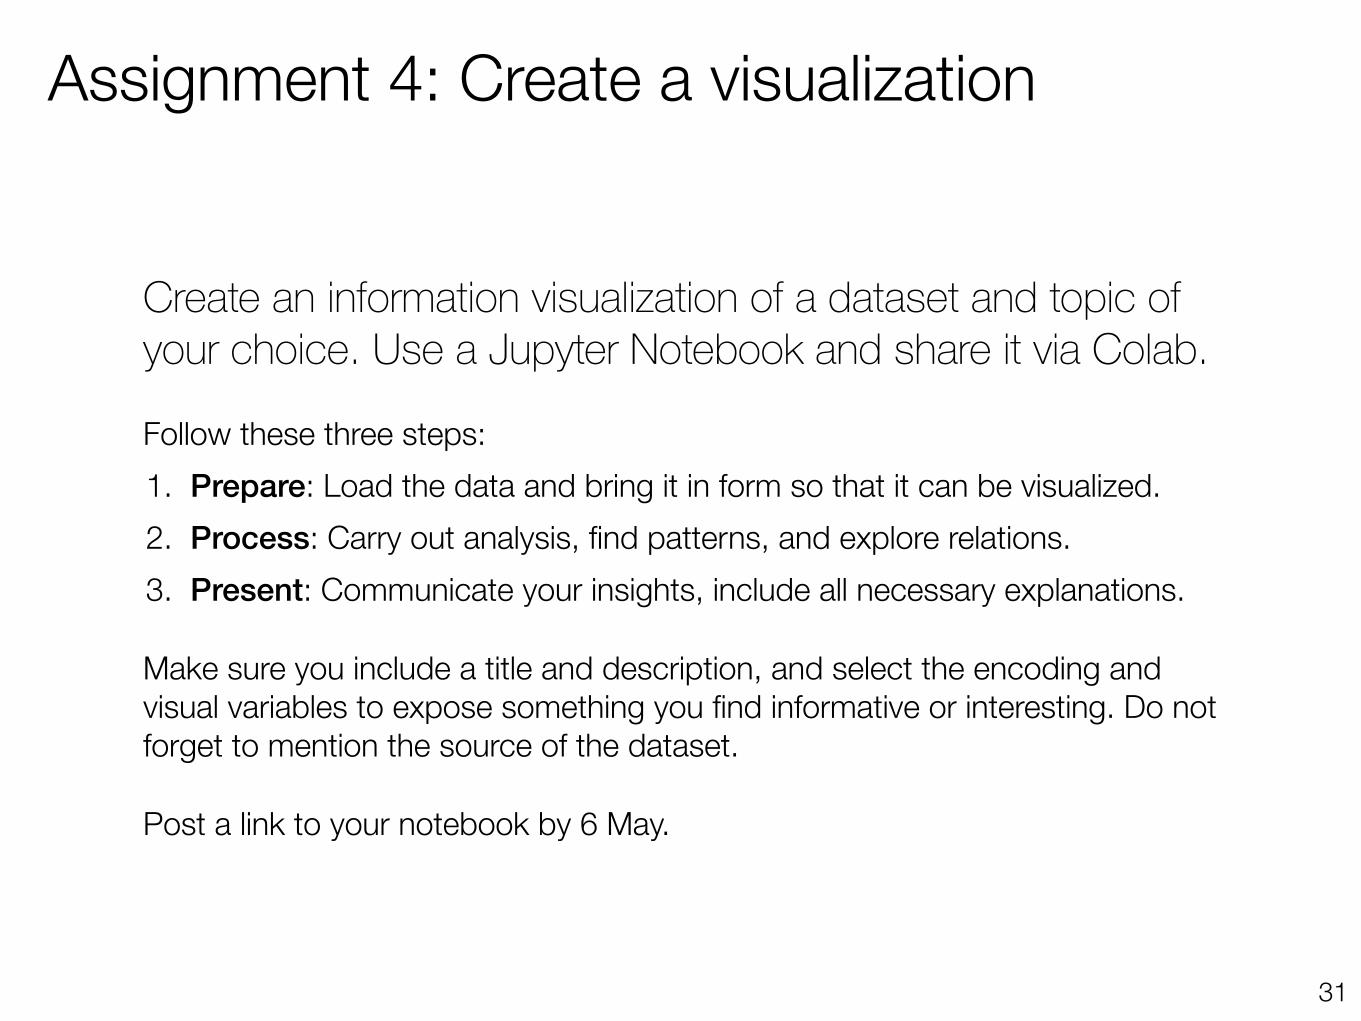
Assignment 4: Create a visualization
31
Create an information visualization of a dataset and topic of your choice. Use a Jupyter Notebook and share it via Colab.
Follow these three steps: 1. Prepare: Load the data and bring it in form so that it can be visualized. 2. Process: Carry out analysis, find patterns, and explore relations. 3. Present: Communicate your insights, include all necessary explanations.
Make sure you include a title and description, and select the encoding and visual variables to expose something you find informative or interesting. Do not forget to mention the source of the dataset.
Post a link to your notebook by 6 May.