interactive system design: an approach to digital …
TRANSCRIPT

AN APPROACH TO DIGITAL ARTS THROUGH
GRAU EN ENGINYERIA
INTERACTIVE SYSTEM DESIGN: AN APPROACH TO DIGITAL ARTS THROUGH
KINECT SENSOR PROGRAMMING
Ramírez Gómez
Curs 201
Director: JESÚS IBÁÑEZ MARTÍNEZ
GRAU EN ENGINYERIA DE SISTEMES AUDIOVISUALS
Treball de Fi de Grau
INTERACTIVE SYSTEM DESIGN: AN APPROACH TO DIGITAL ARTS THROUGH
KINECT SENSOR PROGRAMMING
Ramírez Gómez, Argenis
Curs 2012-2013
IBÁÑEZ MARTÍNEZ
SISTEMES AUDIOVISUALS
Treball de Fi de Grau


iii
Dedication
This project is dedicated to my family.
All this years have turn into an interesting journey of hard work and self-overcoming; you
have been the perfect travel mates. Thank you for filling my luggage with love and support, and
devote your best wishes to make me find happiness.


v
Acknowledgements First of all, I would like to express my gratitude to all the Jury members for serving as a
evaluators for this dissertation.
I would like to thank my supervisor Jesús Ibáñez Martínez for encouraging me in all the
bad moments, inspiring me with his enthusiasm and giving me all his attention considering
that I was abroad.
Thanks to Dr. van de Wetering and his Computer Science colleagues from Technische
Universiteit Eindhoven for their useful feedback about my projects ideas in a first testing
process.
I also want to thank my friend Antonio Lansaque who helped me with his support and
suggestions.
Special thanks goes to my colleagues Francois Riberi and Alba Magallón who help me
during the system testing while developing it.
Thanks also to Verónica Moreno for helping me to organize my ideas and making me
believe in myself with her advice.
I also want to thank all my friends with a special remark to Roger Fonollà and Desiré
Sobouti, who I knew no matter the distance, always have and always will be for me. Thanks
to Victoria Rey for being always by my side during last four years.
This project was developed with the effort of my family and friends, and to them I am
especially grateful. I feel so lucky to find encouragement, support and patience from my
parents Laura Gómez and Manuel Ramírez, who had to deal with my nerves and stress.
Special thanks to my sister, Laura Ramírez, for always being with me, for her help in this
project, support and strength. Thanks for being my role model during all this years.
Thank to all of them for being by my side during all this years, and make me who I am
today.


vii
Abstract Emerging interactive experiences have become really demanded by users that need to be
part of new applications where experts from different fields work together in order to
create a creative system based on Human-Technology Interaction and Digital Arts.
Exploring Interaction and creative Visualizations, the need to change the 'programmed'
experience into a more improvising one was the system design starting point. From here,
the aim of this project was to design and develop an interactive system, which introducing
audiovisual processing, interaction and creative graphics has turned into a new user based
system.
By tracking users position in a certain space and translating this data into flocking systems
of particles based on users themselves, this interactive multi-user system wanted to use
different technical disciplines in order to develop something new, efficient and with a low
cost.
The exploration of the application without knowing beforehand what could be done with
that, has been the success of this new system, where users could interact with each other
and feel that they are absolutely in control of the system by being mapped on it.
As a result, not only a new interactive experience has been developed; the system has
contributed to introduce new ways to integrate technology in design and fields such as
Technologies for the Stage or Digital Arts.
Keywords . - Human-Technology Interaction, Visualization, Audiovisual Processing, User Tracking,
Flocking, Kinect Sensor, Processing, Interactive System Design, Technologies for the Stage and Digital
Arts.

viii
Resumen La demanda de nuevas experiencias interactivas ha crecido considerablemente por parte de
usuarios que necesitan ser parte de nuevas aplicaciones donde expertos de diferentes
disciplinas trabajan juntos para crear sistemas creativos basados en Interacción Persona-
Maquina y Artes Digitales.
Explorando la interacción y la visualización creativa, la necesidad de convertir las
experiencias 'programadas' en unas más improvisadas ha sido el puntos de partida del
diseño de este sistema. A partir de aquí, el objetivo de este proyecto ha sido la creación de
un sistema interactivo que introduciendo procesamiento audiovisual, interacción y el uso de
gráficos creativos se ha convertido en un sistema basado en los usuarios.
Mediante el seguimiento de la posición de los usuarios en un determinado espacio, y
trasladando estos datos a la creación de un sistema de partículas basado en los mismos
usuarios, este sistema interactivo multiusuario se ha basado en el uso de diferentes
disciplinas técnicas para desarrollar algo nuevo, eficiente y a un bajo coste.
La exploración de la aplicación sin saber que esperar de ella de antemano ha sido el gran
éxito del sistema, en el cual los usuarios han podido interactuar entre ellos y sentirse con el
control del sistema siendo reflejados en el.
Finalmente, no sólo se ha creado una nueva aplicación interactiva, el sistema ha
contribuido en la introducción de nuevas formas de integrar tecnología en diseño y áreas
como las Tecnologías de Escena o las Artes Digitales.
Palabras clave.- Interacción Persona-Maquina, Visualización, Procesamiento Audiovisual,
Seguimiento de usuarios, Flocking, sensor Kinect, Processing, Diseño Sistema Interactivo, Tecnologías para
la Escena y Artes Digitales.

ix
Preface
During all my bachelor's degree many different topics have been studied but I had the
feeling that none of them could be used in real life neither be used together. We learned a
lot of things but we did not knew how to use them in our career.
The need of using everything I have learnt and turn it in a new single application was the
starting point of this project idea. I wanted to mix all the gained knowledge in order to
demonstrate myself that I know a lot of thing, and all this years have not being a waste of
time.
I have always had the feeling that all that my bachelor's offers me was not enough, I need
more creativity on it, but at the end I needed all the technological skills. At the end, during
my last year, thanks to my Erasmus experience, I could follow lots of courses that
integrated technology and engineering with creativity, so my inspiration was turned on, and
all the years without knowing my place in this field had finally an answer.
By developing a self-project idea I ensured my motivation and encourage myself to reach
all my goals; this way I could organize all my developments as I wish and integrate all my
favorite studied fields in one unique system.
It has been hard, but I have enjoyed every single part of this project.


xi
Summary
Page
Abstract vii
Preface ix
List of figures xiii
1. DESIGNING AN INTERACTIVE SYSTEM BASED ON USER
POSITION 1
1.1 Designing a new system 1
1.2 User Oriented System 1
1.3 The social experiment 2
1.4 Goals and Objectives 3
1.5 Planning 4
1.6 Technical Approach and requirements 4
2. THE KINECT SENSOR 5
2.1 Performance 5
2.2 Data Acquisition 6
2.3 User Detection and User Tracking 6
2.4 Position Determination 8
a) Depth 9
b) Width 10
2.5 Advanced Data Acquisition 11
a) Onset Detection 11
3. TRANSLATING DATA TO VISUALIZATION 13
3.1 Data from Kinect 13
3.2 Position coordinates and Particles position 13
3.3 Interactive zone 14
3.4 Generating Particles from USER 15
4. THE PARTICLES AND THE USER 17
4.1 Creating particles from users 17
4.2 Color Data 17
4.3 Subtracting Colors 18
4.4 Mapping Colors 20
5. VISUALIZATION: THE PARTICLES DESIGN 21
5.1 Creating particles 21
5.2 Shapes and Color 21
5.3 Behavior 22
5.4 Translating simplicity and complexity into organic system 23
xii
6. THE PARTICLE SYSTEM DESIGN 25
6.1 Particle System 25
6.2 Flocking Particles: Particle System as a group of agents 25
6.3 Flocking rules, simulation by Craig Reynolds 26
6.4 Adapting Flocking 27
7. INTERACTION DESIGN 29
7.1 System interaction 29
7.2 System Interactivity 29
7.3 System-Users events 30
7.4 Single-User events 30
7.5 Multi-User events 31
8. FROM DESIGN TO IMPLEMENTATION 35
8.1 System development 35
8.2 User Detection and Tracking 35
8.3 Particles (Boid and Flock class) 36
8.4 Focusing on User Interaction 37
8.5 Audiovisual Display 37
9. FROM LITERATURE TO A NEW SYSTEM 39
10. EVALUATION 41
10.1 Results and limitations 41
10.2 Applications 43
11. CONCLUSIONS 44
11.1 Further Work 47
References 49
ANNEXES 51
I. Project Charter 51
II. Project Plan 55
III. Sensor Overview 59
IV. UML class diagram 61

xiii
List of figures Page Figure 1. System placed in a room (screen + sensor). When the user pops
up, the system reacts 2
Figure 2. System is turned on after user detection, and generates a
visualization on the screen in the form of a particles system, that
is located in the screen at a position corresponding to the user's
position in the room. When the user moves, the particles move
and change its features.
2
Figure 3. Kinect structure. Source: Microsoft Kinect for Developers
website. 5
Figure 4. Video Data Kinect is able to get using its components through
the specific library. The combination of most of the sensors
inside Kinect camera provides an efficient user detection and
tracking.
5
Figure 5. Kinect outputs from Depth (left) and IR sensors (right). 6
Figure 6. 3D point cloud image obtained through the Kinect sensor
library from depth image and IR information processing. 6
Figure 7. User detection through scene analysis. Source: PrimeSense
website reference 7
Figure 8. User detection through scene analysis using stereo Algorithm
and Segmentation. 7
Figure 9. Correspondence between two parallel images scheme (left),
depth calculation from disparity scheme (centre) and stereo
system with point matches scheme (right). Source: University of
Illinois lecture "How the Kinect works".
7
Figure 10. PSI pose, user calibration pose (left) in order to detect all joint
from user body in user detection and tracking. Skeleton
detection (right). Source: "Making things see" 8
Figure 11. Center of mass detection. 8
Figure 12. Depth image (up left), used to determine the depth distance of
the user by evaluating one of the user pixels (up right) in the raw
depth data array (down). 9
Figure 13. Depth image perspective depending depth distance. 10

xiv
Figure 14. New coordinates from the center of the frame with real world
distance values, as shown in formulas above. 11
Figure 15. Onset detection. 11
Figure 16. Data Input from Kinect Processing to Particle system creation
and updating. 13
Figure 17. Interactive zone determination through Kinect vision limits. 14
Figure 18. Trigonometric manipulation expression to calculate the
minimum distance between camera and interactive zone. 14
Figure 19. Color segmentation. Source: Reference [8]. 15
Figure 20. Scene image from Kinect. 17
Figure 21. RGB image from Kinect sensor. 17
Figure 22. RGB component processing for color subtracting. 18
Figure 23. General subtraction. 18
Figure 24. Comparison between color subtracting methods. General
subtraction (left column) versus Local subtraction (right
column). 19
Figure 25. Local subtraction. 20
Figure 26. Previous conception of particles used in the system. 21
Figure 27. Previous visualization. 21
Figure 28. Final conception of particles used in the system with color
mapping (left) from user RGB image (right) 22
Figure 29. Agent dynamics. 22
Figure 30. Final conception of particles used in the system with size
beating, normal state(left) and beating event (right). 22
Figure 31. Flocking rules: Separation (Up), Alignment (center) and
Cohesion (Down). 25
Figure 32. Agent and its neighbors. 26
Figure 33. Separation. 27
Figure 34. Alignment 28
Figure 35. Cohesion 28

xv
Figure 36. Direct Interaction: User position determination controls system
data manipulation and Visualization. 29
Figure 37. Creation Event. Particles are born in the corners of the screen
and moves towards target position. 30
Figure 38. Going out Event. By user getting closer to any of the edges of
the interactive zone, particles cross the edges and travel to user
position again as they have been transported. 31
Figure 39. Multi-user system 31
Figure 40. 'LINES' Multi-User interaction examples 32
Figure 41. 'STICKINESS' Multi-User interaction examples. 32
Figure 42. 'ATTRACTION' Multi-User interaction examples. 33
Figure 43. Evolution from 'ATTRACTION' to 'EXPLOSION' Multi-User
interactions. Order: top-left, top-right, low-left, low-right 33
Figure 44. Stage platform. 44


1
1. DESIGNING AN INTERACTIVE SYSTEM BASED ON USER POSITION 1.1 Designing a new system
The faster technology improves, the more difficult it is to surprise users: they usually think
that they have already seen every technological improvement that can ever be made. Here
new creative applications and emerging experiences using new technologies have an
important role by designing and developing new systems.
As a result, technologies for the Stage and Digital Arts field are becoming more popular
nowadays in society, as well as user-experience systems with user-Interactive designs are
demanded a lot by people hungry for new technology developments; the aim of this project
is to use all these fields in order to explore what kind of applications I can achieve using
multimedia processing, Interaction and Data visualization.
Whether the user is comfortable with the designed system or not is the starting point
where the design of the system starts. One of the main points in the structured design of
this project is that it is not necessary for the user to know what he is going to do with the
system, this way ensures preconceived expectations and keep us away to bother users with
instructions. The main point of this system is to be autonomous, without calibration, only
using the dimensions of the interactive area that we want to use (room) as input.
To make it more simple, this system only uses the user location, so users are expected to
have the most comfortable interaction that can be made, they only have to move.
On the other hand, it is very important to consider which will be the project scope, this is
why using the cheapest technology possible have been considered, but always maintaining
the correct efficiency, good performance and results that we want to get.
Nevertheless, User position is not the only kind of interaction that can be used, we can add
some complexity to the system analyzing other ways the user can interact.
1.2 User Oriented System
As soon as the system is finished, it is important to figure out which is the intended
experience that the user is supposed to have, this is why the design of the user experience
has to be very accurate in order to achieve all the goals on its development.
The system is intended to be placed in a room, where the user has a specific area where he
can move. The data visualization system is shown on the wall while the user is interacting
with the system. It is not necessary to display the data visualization on the wall as long as it
can be also placed on the ground.

2
Figure 1.- System placed in a room (screen + sensor). When the user pops up, the system reacts
Figure 2.- System is turned on after user detection, and generates a visualization on the screen in the form of a particles system, that is located in the screen at a position corresponding to the user's position in the room. When the user moves, the particles move and change its features.
For better understanding of the system, the user interaction with the system is explained in
the Figures 1 and 2.
As you can see, the system is placed in a room, then when de user gets in, the system
detects him and starts the data processing in order to generate a proper visualization, and
begins to transform and translate user interaction.
Therefore, the system is supposed to detect the user and calculate certain parameters that
will determine how the visualization system works, in fact, how a particle system is created
and changes by updating it.
The most important data that the user gives the system is his position in the room, so
calculating his distance from the sensor, we are able to locate him in the system and
determine how the amount of particles will be. Therefore, when the user moves around the
room, the particles do the same, maintaining the correspondences between user position in
the room and their position in the visualization screen.
1.3 The social experiment
The main goal of this system developments is experimenting interaction between the
system and users, but what if the experiment is extended to interaction between users too?
The social experiment, hence, consists on letting users to interact with each other so as to
increase interest in the system. At the beginning multi-user configuration was not intended
to be implemented in the system, however plenty interactivity is strongly desired, and social
behavior between different users cannot be avoided.

3
Humans are social by nature, will then interact with each other if they had the possibility in
this system? Let's find out.
1.4 Goals and Objectives
By interpreting human interaction in a certain zone, the purpose of this project is to
process the information gained by a sensor of the user location in order to display an
attractive visualization of the data it gets, mixing different fields in technology and
engineering.
Choosing the best sensor for data acquisition is the first step that must be considered
depending on which kind of data we need or what are the processes that will be applied to
it in order to fulfill the main goal, in that case, user position determination while moving.
For instance, concerning image processing, user detection and tracking are very useful for
this system so as to guarantee a correct approximation of the exact position in the room.
Therefore, the most important data we have to process is a reliable user detection and user
tracking in order to make the system work efficiently, but without a big scope; so choosing
the correct sensor is not only a matter of a good performance, it is also important to
consider how can we take profit of the sensor.
Audiovisual processing has to be well performed in order to guarantee good data
acquisition and different visualization events creation, whether they are interactive or not.
Designing a good interactive experience will also be an important issue to be discussed
during the whole project development. Establishing the final user we can also design which
kind of interaction we want to program. In that project, for example, designing a system
for Digital Arts will be the main goal.
Furthermore, if we want to make this system attractive, data visualization will help to
guarantee the artistic and creative part of the project, and an appealing experience to the
user. Then, the creation of an attractive system is very important to achieve the main goal;
from now on, creating a particle system that will behave in a certain way depending on
users position and interaction with other users, that is really attractive to them, and can be
validated as a project involved in Digital Arts and Human Technology Interaction.
Interaction should be simple and attractive. If several interactive events are placed in the
system, transition between them have to be smooth enough to maintain balance across all
visualization events.

4
1.5 Planning
Goals and Objectives will be what determines the completion of our work but in every
project development process, a certain planning has to be done while designing it in order
to guarantee that all milestones and deadlines are reached. Sometimes goals and milestones
change while you are working, this is why a good planning is always required beforehand.
The document that contains all the information regarding objectives, planning and further
is the Project Charter (see ANNEX I), where all the information concerning the
development of this project was reflected before starting planning it.
Nevertheless, a few changes on original project idea have been done during planning and
execution, so new ideas and parts of the project can be modified in order to control and
trace that all results reached were planned and would help to achieve main goals and
objectives.
You can read Project Plan in ANNEX II to get a deeper insight of current project
planning.
1.6 Technical Approach and requirements
Translating the user interaction and the data acquisition from the sensor seems easy if we
do not take into account the multiple image processing steps that have to be taken, for
instance, user detection and tracking.
Nonetheless, if we do not relate this image processing to a visualization system and user
interaction, the system won't succeed in the fields it is determined for; in other words, all
approaches through all these fields are necessary in the development of a design like the
one this project is trying to achieve. However, we are missing one of the most important
parts, how do we get all the information?
Data acquisition is the starting point once the design of a system is done; then having made
the decision to develop a certain application, the kind of information desired to get is
already clear and the only decision that is left behind is the choice about which sensor we
are going to use.
During planning, several different acquisition systems have been considered, but only one
was feasible to make a good performance.
As long as the aim of this project is developing a system able to detect and track a user
easily in order to transform this data into a certain visualization, in the planning process,
different sensors were studied (see ANNEX III), but only Kinect sensor was able to
simply perform those task and provide further information about the scene.

5
Figure 4.- Video Data Kinect is able to get using its components through the specific library. The combination of most of the sensors inside Kinect camera provides an efficient user detection and tracking.
Figure 3.- Kinect structure. Source: Microsoft Kinect for Developers website.
2. THE KINECT SENSOR
2.1 Performance
Kinect is a motion sensing device developed by Microsoft for the Xbox 360 video game
console, though it is also recently developed for apps development for Windows.
The device contain a wide range of sensors that are useful as input in image processing
processes, such as an Infrared emitter or IR camera, a color sensor or RGB camera and the
IR Depth Sensor or Depth camera. It also has a Tilt Motor, an Accelerometer and 4
microphones, as you can see in Figure 3.
Due to the current release of Kinect drivers for developers, different kind of Kinect sensor
have been coming out, each one with different features. This project has been developed
with Kinect for Xbox sensor, which can capture frames of 640 per 480 pixels with a frame
rate of 30 fps. Moreover, its depth range is between 0.8 meters up to 7.5 meters; and the
vision angle is 57º for width and 43º for height. Additionally, its tilt motor can be placed
between an angle of ±27º.
Furthermore, devices with varying performance exist, working with different results in
human detection and tracking processes. More information about resulting limitations will
be discussed later.
See Figure 4 to get a better understanding of the data that the Kinect sensor actually gets,
and the processes that can be performed with it and are more interesting for this design. [1]

6
Figure 5.- Kinect outputs from Depth (left) and IR sensors (right).
Figure 6.- 3D point cloud image obtained through the Kinect sensor library from depth image and IR information processing.
2.2 Data Acquisition
In terms of Image Processing, Kinect sensor is a high level tool that provides us with many
useful information to be used in the system design. Once we know how we want to use the
sensor, it is time to check whether the output information that it give is useful or not for
our system inputs. For instance, a depth image and an IR image.
By using the information that it gets from the different sensors (as seen in Figure 4) we can
easily have access to a Depth image and an IR image as well as the RGB image that will be
helpful to enable user detection and tracking (see Figure 5).
Both images may be used with the Kinect
library in order to obtain not only the user
position in the frame, also it can give us a 3D
point cloud image (Figure 6), or even get the
user pixels in each frame.
Such information is what the library used to
perform user detection and user tracking. [2]
In fact, are those image processing processes
what we want to use in this system in order to
determine our visualization system.
2.3 User Detection and User Tracking
Kinect sensor drivers are provided by PrimeSense whether the access to the information
that the sensor give the computer is obtained by using the Kinect's library for Processing
(our programming environment), Simple-OpenNI. [3]

7
Figure 8.- User detection through scene analysis using stereo Algorithm and Segmentation .
Figure 9.- Correspondence between two parallel images scheme (left), depth calculation from disparity scheme (centre) and stereo system with point matches scheme (right). Source: University of Illinois lecture "How the Kinect works". [further information about those processes can be found following the references in this report]
Figure 7.- User detection through scene analysis. Source: PrimeSense website reference
Once all the data is ready to be processed,
Simple-OpenNI is able to analyze the scene so as
to identify the user and differentiate him from the
background. This scene is projected by invisible
IR light, and all together with the data captured
by the RGB camera (CMOS sensor), is processed
to obtain the depth image (see Figure 7).
Nonetheless, there are strong computer vision
calculations during the processes that allow the
system to locate the different user
correspondences and perform the user tracking.
By reading the data from the sensor, depth image
is obtained by calculating correspondences
between the different images the Kinect gets
through its cameras.
After segmentation, different depth values are set apart in distinct depth levels in order to
differentiate the user from the background (see Figure 8), then tracking can be done.
The strong Image Processing and Computer Vision processes happen while calculating the
results from Figure 8; it consists on the calculation of the matches between points from
both images in order to calculate the depth from disparity (See Figure 9).

8
Figure 10.- PSI pose, user calibration pose (left) in order to detect all joint from user body in user detection and tracking. Skeleton detection (right). Source: "Making things see" - by O'Reilly.[5] [Further information about calibration can be found in reference]
Figure 11.- Centre of Mass detection.
Further information about calculating the correspondences between the matches from the
different input images in the system has been discussed in the literature used as a reference
to develop this project. [4]
In terms of user tracking, Kinect library offers different options depending whether we
want to use the skeleton information or not. Calibrating the system turns into a must if we
want to perform skeleton tracking, this way we will obtain information about all skeleton
joint position of the user body, but we will need to ask the intended user to make the
known as PSI pose, see Figure 10.
If our intention is only to track the user, as it does in this project configuration, we do not
want to bother the user by calibrating the pose detection and we want to detect him as
soon as he appears into the interactive area in the room where we have placed the system;
then, we can use the centre of mass detection.
Centre of Mass detection is quicker than skeleton one
but is equally efficient, so there is not a huge difference
in user tracking performance, only in detection. As you
can see in Figure 11, user is detected with an unique
joint of his body corresponding to the centre of gravity
of himself. This kind of detection also accepts to use a
hand tracking method, so we are able to track two
different joints from users bodies.
Having detected the user, then we can start to get user position as one of the first
milestones proposed.
2.4 Position Determination
The main application is also the origin of the system, being able to determine user
coordinates in the scene to know the exact distance in real units where the user is; for that
reason, using coordinates in the frame that the Kinect library provide to the system is the
starting point. By knowing main Kinect sensor features as its calibration and configuration,
we can calculate users position in the room where the visualization display have been
placed.

9
Figure 12.- Depth image (up left), used to determine the depth distance of the user by evaluating one of the user pixels (up right) in the raw depth data array (down).
a) Depth
Knowing how far is the user from the sensor is simple as long as Kinect provide us with
the scene raw depth data; so by taking into consideration the depth image, and evaluating
one of the user pixels inside the depth map we can obtain the exact distance.
Depth image is an stereo image calculated by the given data from both Kinect depth
sensors, then we have to be sure which pixel we do want to evaluate. As you can see in the
following figure, for all the agents in the picture there are double contours caused by the
stereo calculation; those black pixels have infinite value. Then, we could find that the pixel
that we are evaluating that eventually is really close, we get that is in the infinite.
Nevertheless, Kinect sensor library can work with the raw depth data obtained directly
from the sensor, but it is place in a one-dimensional array (see Figure 12), then, we have to
consider this fact when we implement the final system.
To access the data inside raw depth array, is necessary to know which pixel we are
evaluating from the user, for instance Ux as X user coordinate in the frame, and Uy as Y
coordinate; then, is simple to know the exact distance, as long as the data we get is in
millimeters, and we only have to access to the values from raw depth data.
Considering the evaluating pixel as the joint given by the center of mass user detection, let
depthMap[ ] be the raw depth array of size (640x480) x 1, then 307200x1 values, due to
each row is placed after the previous one.
Then we access the corresponding position to get the depth value:

10
Figure 13.- Depth image perspective depending depth distance.
b) Width
The case of width is more complex, we do not previously
have a data structure containing the values that we want,
but we can calculate it, and to do so we have to convert
our user position values into real world distances.
It is true that distances are not the same as the user comes
closer to the camera, due to the camera view (see Figure
13), this is why for every depth value that the user is on
we calculate a different correspondence with width real
distances values.
In Computer Vision literature can be found [6] [7] that real distances can be calculated from
camera configuration values as it follows:
where [x, y, z] are the new unit coordinates for [X, Y, Z], Fx and Fy are Kinect focus
distance value, and Cx and Cy are the centre coordinates of the frame.
Considering we know from Computer Vision library references [7] that by default Kinect
focus is 525 units and is the same in both axis (Fx = Fy), Cx is half of the x axis frame size
(320), Cy is half of y axis frame size (240) and our coordinates while tracking are [x, y, z];
we can calculate the new coordinates [X, Y, Z] such as:
where Z is the depth value of the evaluated coordinate,
then, our new coordinate system in real world distances is:

11
Figure 14.- New coordinates from the center of the frame with real world distance values, as shown in formulas above.
Figure 15.- Onset detection.
At the end all distances found, are distances from
the center of the frame to the evaluated pixel (see
Figure 14), so it is constrained by the camera view
range to the scene.
Notwithstanding, is image processing data the only that is interesting in this system? Once
we have localize the user that is interacting with it, it is time to start designing interaction,
ad this is why, new interaction has to be introduced.
2.5 Advanced Data Acquisition
Until this moment only video sensors from Kinect have been used, and is true that the tilt
motor can be used to determine the position of the camera depending on the final system
configuration, but the audio features of the sensors can be used to add further data to this
interactive system.
The used Kinect library do not include functions to work with the microphone array, this is
why by using drivers from Microsoft Windows Kinect developers for Audio and existing
libraries for our programming environment, we can use the power of audio processing to
our system.
As long as from video the interesting data was where the user was going, in audio it is
followed a similar principle, Kinect sensor only hears what is happening, then on noisy
events it will get the environment audio information.
a) Onset Detection
An onset refers to an audio event when the amplitude rises from a low level (valued as
zero) to a really higher one (see Figure 15). Then by establishing a threshold you can get
information whether the audio peak
detected is an onset or not.
By scanning ambient sound we can
process all the data acquired by the
microphones in order to get an onset
detector modified as a peak detector that
will analyze users sounds while interacting.


13
Figure 16.- Data Input from Kinect Processing to Particle system creation and updating.
3. TRANSLATING DATA TO VISUALIZATION
3.1 Data from Kinect
From previous calculations with Kinect library
we have got several inputs to our Visualization
system. We are talking about User position, user
center of mass, RGB image and a special new
feature regarding audio processing to make an
onset/beating detection in order to modulate
shape sizes.
Then, starting with this data, see Figure 16, our
Particle systems will be created, and updated in
terms of position, color, and distinct behaviors,
such as the beating property.
3.2 Position coordinates and Particles position
Where are going to be located the particles is the first issue that we are going to discuss. As
it has been explained before, the particle system is supposed to move like the user, then we
will consider the window of the application in which the particle system can move as a
mapping of the floor of the room where the user is moving.
Then, here you have why we wanted to calculate the exact position of the user in the room.
The particle system position will be the same position of the user in the room, as you can
remember from Figure 1 and 2.
To translate all the particles to that point we only have to change the coordinates to the
current scale, from real distances in the interactive zone in the room to the active window
of the application while it is running.
In order to perform the transformation of position coordinates the following formula has
been used, where P is the value we want to transform from interval [MIN, MAX] to [min,
max] one.

14
Figure 17.- Interactive zone determination through Kinect vision limits.
Figure 18.- Trigonometric manipulation expression to calculate the minimum distance between camera and interactive zone.
3.3 Interactive zone
Only having the user position is not enough to make the system work; it is necessary to
determine an area, the interactive zone, where if the user gets in, the system starts to work,
and if not, all users detection are ignored. Using this method, we can prevent of Kinect
limited detections problems.
As you can see in Figure 17, it is important that all the limits of the area fits inside the
camera vision, then we have to calculate the minimum distance from the Kinect sensor
where our interactive zone fits. To do that we are using simple trigonometric formulas, see
Figure 18.
Considering Figure 18, we can determine that the distance we want to discover is b, then:
If we want, for instance, an Interactive zone of 2x2 meters, and we know that the angle of
Kinect vision is 57º, then we can determine that:
Using this results, only when the user is detected inside the interactive zone the
visualization system will react.

15
Figure 19.- Color segmentation. Source: Reference [8].
3.4 Generating Particles from USER
We want to determine with user position the particle system position, but it is not the only
thing that this user interaction can modify.
We also can say that users who are interacting with any system have a color set; not only
because they are wearing clothes of certain colors, it can be also their skin or the reflections
of the environment.
Then, interesting data such as the called in this project as user colors, is a way of
subtracting colors as if a kind of color segmentation is being used.
For instance, imagine that we have the following image and its segmentation (Figure 19), by
analyzing the segmentation we can say that the picture is blue and green.
Then, same kind of subtraction of colors is intended to be done with users for the system
visualization.
The last feature that the user controls about particle system is the beating effect. While
interacting with the system, users make noise, but is when a really noisy event is registered
by the sensor and is part of an onset detection that will bump the size of every shape. With
this kind of audio processing we are not only using all Kinect features, we are adding a little
bit more of interaction to our designed system.


17
Figure 20.- Scene image from Kinect.
Figure 21.- RGB image from Kinect sensor.
4. THE PARTICLES AND THE USER
4.1 Creating particles from users
Interacting is then what users will do with the system, but how is this interaction
visualized?
The creation of a particle system based on users who are using the system is the triggering
interactive event of it. The particle system are a bunch of agents in a form of a ball with
certain dynamic (explained in following chapters) that take the color components from the
image obtained by Kinect sensor where user appear in order to map user colors (colors that
user have in their clothes) into agents colors. With this kind of visualization users are not
able to recognize themselves in the particle system, so it cannot be considered as an avatar,
is an identity by itself and is the main element in the visualization part of the system.
However, before creating the particle system, data acquisition have to be considered.
4.2 Color Data
How color from the user is obtained, filtered and selected is the main point to solve before
creating the particles. This is why several strategies have been considered.
The main problem is recognizing which are the colors from the users and which ones are
from the background. Kinect sensor by using segmentation for its human detection and
tracking is able to provide us with the scene image, a
video string where user is extracted from depth image
and submitted into a new frame where the user shape
is colored and the background is black (see Figure 20).
From the scene image and using the correspondences
between all images in the Kinect sensor output, we
will be able to know which pixels are intended to
store user color pixels.
Subtracting colors from the RGB image obtained through the sensor camera then is only a
matter of correspondences at first, but is color from a video camera totally the same that
we perceived? Obviously not, in all frames we can find reflections, diffuse components and
saturations, so all data that we access will not have
the same value as we perceived; then, this color
data need to be processed to get real values, as
discussed in references [9].

18
Figure 22.- RGB component processing for color subtracting.
Figure 23.- General subtraction.
For instance, in Figure 21, the walls are kind of white; but, if we check the value of one of
those white pixels, we will get that the wall is actually yellow, or some cases with a high red
component. This is due to lightning.
Although real colors cannot be read, RGB image pixel values can be processed by
increasing their brightness to get a more vivid and real color. By calculating the brightness
of each pixel and the value of each color component of the pixel in the RGB channel, a
weighting factor modifies each pixel value.
Being [r, g, b] the color components of a pixel p, and brightness the brightness value of p:
r' = r · fac g' = g · fac b' = b · fac
where,
fac =
Being this factor fac the ratio between the
maximum brightness and the current one.
This way, colors from the image can be
improved as we can see in Figure 22, getting
bright and more vivid for this project
application.
4.3 Subtracting Colors
Now that colors can be identified, we have to be able to read user colors, then 2 methods
have been used for this purpose; general subtraction and local subtraction.
It is called subtraction to the process of taking colors from the evaluated image and store
them in a data structure in order to be used in a later context.
[1] General subtraction : By comparing scene image and RGB image, for every pixel without a
black value, the position of this pixel is stored and translated into the RGB image in order
to take the RGB correspondence. This way, first subtracted colors are taken from the head,
and most of them are skin colors, that processed with the previous method are considered
as red colors.
Furthermore, lots of reflections are being analyzed as good
colors to represent the user, which give us results that are not
true, and are not part of the user colors, only the background
reflection on him, then this results are not good enough to take
them as final results, as you can see in Figure 23.
This is why Local subtraction have been considered.

19
Figure 24.- Comparison between color subtracting methods. General subtraction (left column) versus Local subtraction (right column).
20
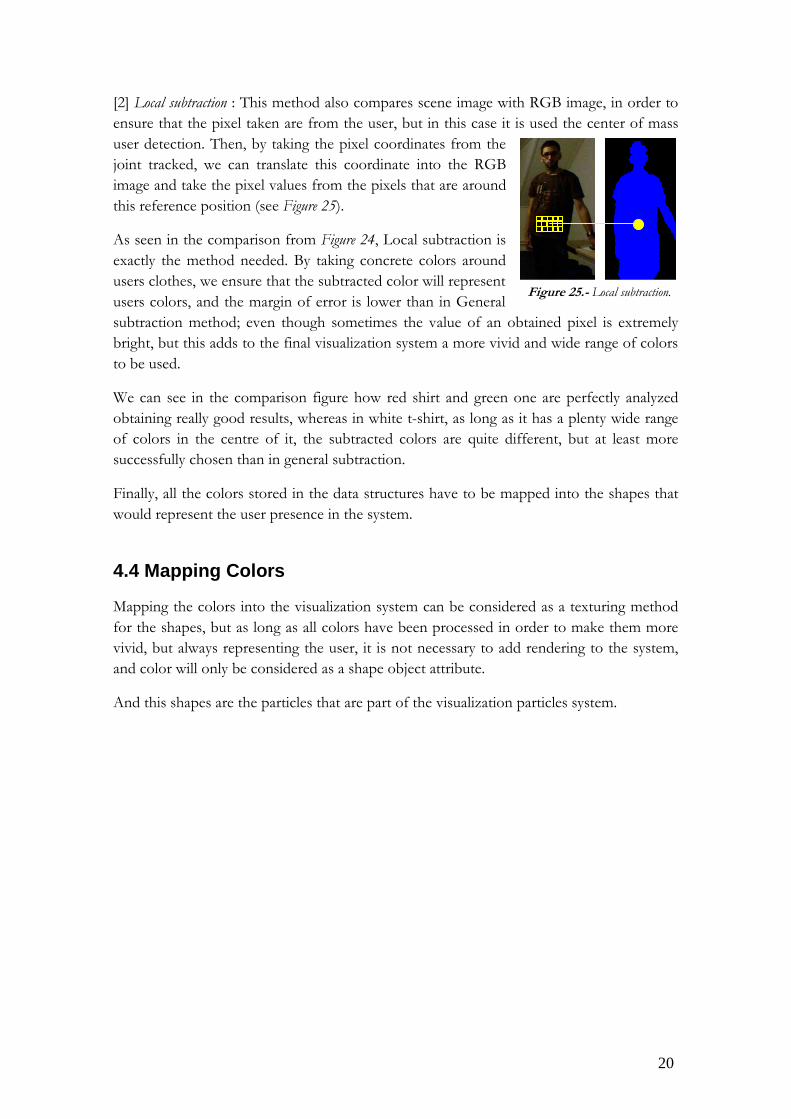
Figure 25.- Local subtraction.
[2] Local subtraction : This method also compares scene image with RGB image, in order to
ensure that the pixel taken are from the user, but in this case it is used the center of mass
user detection. Then, by taking the pixel coordinates from the
joint tracked, we can translate this coordinate into the RGB
image and take the pixel values from the pixels that are around
this reference position (see Figure 25).
As seen in the comparison from Figure 24, Local subtraction is
exactly the method needed. By taking concrete colors around
users clothes, we ensure that the subtracted color will represent
users colors, and the margin of error is lower than in General
subtraction method; even though sometimes the value of an obtained pixel is extremely
bright, but this adds to the final visualization system a more vivid and wide range of colors
to be used.
We can see in the comparison figure how red shirt and green one are perfectly analyzed
obtaining really good results, whereas in white t-shirt, as long as it has a plenty wide range
of colors in the centre of it, the subtracted colors are quite different, but at least more
successfully chosen than in general subtraction.
Finally, all the colors stored in the data structures have to be mapped into the shapes that
would represent the user presence in the system.
4.4 Mapping Colors
Mapping the colors into the visualization system can be considered as a texturing method
for the shapes, but as long as all colors have been processed in order to make them more
vivid, but always representing the user, it is not necessary to add rendering to the system,
and color will only be considered as a shape object attribute.
And this shapes are the particles that are part of the visualization particles system.

21
Figure 26.- Previous conception of particles used in the system.
Figure 27.- Previous visualization.
5. VISUALIZATION: THE PARTICLES DESIGN
5.1 Creating particles
All data acquisition of the system has been done and has been stored in distinct data
structures in order to be used in the particles creation.
From the user, the system gets users position in the interactive zone, users colors and
ambient noise, now it is time for the particles to use this information in order to give values
to particles position, shape, color or even behavior.
Particles are created as soon as a user is detected in the system, and a different groups of
particles are created per each user. By placing a group of shapes in the visualization screen
user will be able to see how graphics are created because of him.
One of the main reasons for this attribution of ownership is due to the particles position
translation from the user position in the room.
It is obvious that users have a 3 dimensional coordinates in the space, then, by standing
inside the system it takes his coordinates (only x and y) as explained before and uses the
real distances between user position and camera view to give the particles a position in the
visualization display.
Particles will use user position in the screen as if particles were just in the same position of
the user in the interactive zone. In other words, screen is the room coordinate mapping, or
a visualization of the room activity. Then if there are two users in the room, interacting
with the system, two particles system will be in the visualization display.
5.2 Shapes and Color
Particles were intended to consist on a bunch of different shapes
interacting with each other with a certain behavior, it was intended to be
as simple as attractive to the user, as long as it does not represent any
avatar, so the user will not be expecting anything from it and there is no
risk for the user to be upset.
Main conception of the visualization system was to use this kind of variety
of shapes to be really appealing to users (see Figure 26 and 27), by using
diversity of geometrics with distinct features.
Finally, using a random function to create different kind
of shapes in 2D and geometrics in 3D was changed to the
use of simple circles, but all particles conceptions had a
common feature, color.

22
Figure 28.- Final conception of particles used in the system with color mapping (left) from user RGB image (right)
Figure 30.- Final conception of particles used in the system with size beating, normal state(left) and beating event (right).
Figure 29.- Agent dynamics.
Colors are subtracted from the user as it was explained in previous chapters, then by giving
shapes the attribute to be in the stored colors the particles group look in the same colors as
the user who is interacting with the system (see Figure 28).
5.3 Behavior
Once colors have been specified, particles behavior is the most important thing to be
considered next. Every shape in the particles group have kinetic or dynamic features that
will allow them to move around independently one from the others.
By giving each agent a position that is being updated by a
velocity vector (see Figure 29), all particles move through the
visualization system. In order to keep all the shapes inside the
same group orbits and limits were established, but as you will
see in following sections this was changed by adding more
complex behavior to the system.
Moreover, all shapes are created with a random size, but this is subjected to a certain
beating modification. By reading the values from Kinect microphones, a peak detection has
been used to add an instant change of size when the system hears a strong noise. This new
feature add the particles live, by reacting with the environment noise (see Figure 30).

23
5.4 Translating simplicity and complexity into organic system
Object oriented programming help us to generalize the particle agent by using an Object
class that will help to create a group of agents easily as long as all have similar attributes.
That procedure during the programming process not only generalized the particle system it
also let us use multiple particle systems at the same time, so it was a matter of time that the
designed system turns from a simple single user system into a multi-user system, that
guaranteed more complex visualization and interactive experience.
Nevertheless, after the first conception of the particles, while testing the visualization
responses, particles shapes were defined as really straight forms with non smooth
movement; then, the system was not really attractive and some fixations were added.
In order to give all the agents more organic form an behavior a single geometric is used for
all particles. Symmetries from circles give the system an organic semblance and make the
movement smoother, but it was the introduction to a flocking particles system which gave
elegance and appealing creativity to the visualization system.


25
Figure 31.- Flocking rules: Separation (Up), Alignment (center) and Cohesion (Down).
6. THE PARTICLE SYSTEM DESIGN
6.1 Particle System
All the particles have been told to remain in 'groups', that will be determined by each user
who is interacting with the system; so, per user, a bunch of particles is created. From now
on, each bunch or group of particles will be called Particles System, that is part of the
response the system will give the users as they are interacting with it.
A Particles System is created by a group of agents or boids, as seen in literature [10] [11], and
will have a particular behavior not only with the user interaction, also with the other agents
in the group, allowing us to define them as a flock.
6.2 Flocking Particles: Particle System as a group of agents
By using flocking, all particles of this particle System are subjected to a group behavior,
they move as a flock with a common direction, similar speed, and without leaving the rest
of boids in the group apart.
Comparing this Particle System with a common flock (in a real environment), for instance
a birds flock, three rules have been determined (Reynolds [12]), which determine for every
agent in the group a preservation of the following three concepts (Figure 31):
[1] Separation: Avoidance of collision steering the agent further
from the other agents. A separation value based on the distance
between each other that will guarantee that none of them collide
with the others.
[2] Alignment: All agents travel with a similar speed, based on an
average speed in the group, that will maintain position inside the
group to move as a flock and its direction.
[3] Cohesion: Steer to move towards the average position of
closest agents, it consists on not being apart from the center of
the group, this will guarantee that all agents in a flock follow the
same direction as a group, in particular if the target destination
changes.
Defining those three behaviors, mostly seen in nature, Craig
Reynolds, defined three rules to meet the standards in a
computer simulation of flocking.

26
Figure 32.- Agent and its neighbors.
6.3 Flocking rules, simulation by Craig Reynolds
In fact Reynolds declared that Flocking was a group behavior of a number of agents with a
common objective, so they move together in large numbers towards the same point. The
three rules that he introduced are:
[1] "Flock Centering": Agents attempt to stay close to the other agents in the group that are
close inside a flock neighborhood, so they are 'flockmates', in order to be together as a
group.
[2] "Obstacle Avoidance": Agents avoid collisions with nearby flockmates and environment
obstacles.
[3] "Velocity Matching": Agents attempt to match their velocity with the closest mates in
order to move with same speed and direction.
All those statements establish three different behaviors that each agent will take into
account while interacting with other agents in the same group; here we have another
definition to understand the concepts of separation, alignment and cohesion, explained
before. Using this configuration of behaviors, all flocks are settled as a net; this is why
controlling all this features and different characteristics of a flocking system have been
studied as lattices and solving them with graph algorithms [10].
Then a group of agents can be considered as a graph G = (V, Ε) where V are a set of
vertexes and Ε the edges between the vertexes. Every agent have its dynamics such as:
= p
= u
where, qi is the position of the agent i, pi is its velocity and ui
the control input (acceleration). Then a number of spatial
neighbors for each agent can be settled by using:
Ni = { j є V: ||qj - qi|| < r}
being the interaction range r > 0. Will be this neighborhood where all the flockmates of a
single agent are, and where each agent will interact with the others by satisfying flocking
rules.
Every agent have a position and a velocity that will determine the movement and the
dynamics, but it is the acceleration which decides the dynamics behavior and position
update.

27
Figure 33.-Separation
Then, acceleration is the control unit of the movement, and following the three flocking
rules, can be defined as:
u = fg + fd + f
where,
fg : gradient-based term, position variation.
fd : velocity consensus term or damping force.
f : navigational feedback due to group objective (migration towards destination).
We can consider all those components from the control unit equation as forces that modify
agents velocity and position; then they turn acceleration into a steering force.
Even though flocking algorithm is quite clear, a few modification have been made to
adapts the three rules to the current designed system.
6.4 Adapting Flocking
All Flocking rules Reynolds settled for Flocking simulation are quite necessary to maintain
the order between all agents, but sometimes a little modification has to be introduced in
order to get the desired result. This is why all flocking statements are preserved on their
own concept, but the meaning has changed:
[1] Separation as 'Excitement' statement : All agents try to maintain the separation between
the others in the same flock, avoiding collision, but by introducing the minimum distance
as short as the agents size, the system would allow superposition and would create a
bouncing effect between all the agents, enhancing the movement softly as an excitement
behavior. Then:
only if ||qj - qi|| < minimum distance, and:
Therefore, all separation force per each agent is based on the addition of the distance
between the other flockmates that are closer than the minimum distance, this is why the
resultant force is divided by the total of flockmates that are breaking separation rule.
[2] Alignment as 'Move alone but stay together' statement : All agents have their own
velocity chosen randomly, but this would be changed in order to stay together in the flock.
Then by keeping a similar velocity for all agents would be guaranteed that they don't go
further than the maximum distance in the flock, hence flockmates always stay together.

28
Figure 34.-Alignment
Figure 35.-Cohesion
Then:
Only if the agents are inside the flock and being:
Alignment force is hence the average sum of velocities from the other agents which are
interacting inside the flock with the evaluated agent.
[3] Cohesion as 'Follow the common target' statement : it seems that the main point of this
flocking system is staying together, but what makes the system relate the user to the
particles is that the flock moves exactly towards user position. Then by using the translated
position of the user as a target direction, all agents will move as a group towards this exact
position. Then:
where tq is the target position, and only if agents are inside the flock
and being:
That is why cohesion force is the vector force that takes the agents position and leads it to
the target position.
Furthermore, so as to calculate the resultant force, all the forces are weighted to gain
different behaviors between the agents of the flock, then:
u = (α·fg) + (β·fd) + (ω·f )
where α, β and ω are the weighting factors per each force; settled in the main configuration
of the system as α = 20, β = 1 and ω = 20. Taking Separation and Cohesion as the
strongest forces in our system for preserving the excitement of the agents in the flock and
the correct tracking of the target position.
The steering resultant force then, is calculated from the addition of all three rules; this is
the control unit, deduced for every agent in the flock to be added to their own velocity, but
it has also to be constrained to a maximum force value and a maximum speed, preventing
reaching really high velocities that are out of control.
However, all this parameters can be changed just to obtain distinct behaviors for the
system. From here, different interactive events have been designed.

29
Figure 36.-Direct Interaction: User position determination controls system data manipulation and Visualization.
7. INTERACTION DESIGN
7.1. System interaction
Interaction is maybe the most important part in this system, this is why different kind of
interactive event have been declared. Until now, only general interaction has been declared.
Direct interaction (Figure 36) was deduced by determining user position in the system
actuator zone, then the basic interaction of moving around for the user was the trigger for
the designed system. Data from the user is received and manipulated according to this
interaction dependence, and so does the visualization system creation.
Although this designed product interaction or system interaction event is the main part of
this project, in order to develop a more enjoyable and beautiful interactive experience an
indirect interaction has been also design. We will refer to this kind of interaction as the
System Interactivity.
7.2 System Interactivity
Interaction is what make this system attractive for users. As it has been established in the
main purpose for developing this design, all users want to be surprised by the interactive
experience, so you have to consider what are they possibly going to do with it, and try to
map this behavior into a curious, beautiful and surprising interactive reaction in
visualization.
Analyzing the system scope, it was clear what users would do with it in a preconceived
configuration. They would:
[1] Go inside the system actuation interactive zone.
[2] Move around to interact with the system on the perceived response of the system on
their apparition.
[3] Leave the system actuation interactive zone.
Then, by being other users using the system at the same time,

30
Figure 37.-Creation Event. Particles are born in the corners of the screen and moves towards target position.
[4] Try to use all the system responses on users apparition to join visualizations.
And of course, they will:
[5] Try to trick the system.
With this analysis, three different interaction events have been considered; System-Users
events, Single-User events and Multi-User events.
7.3 System-Users events
System-User events are those interactive events designed only by considering the presence
of users in the system and their moving activity; so it only refers to interaction 2 in the list
above, but can be divided in three different interactive visualizations that have been
explained in previous chapters:
[1] On apparition : When users start to use the system, the particle system, base on
themselves is created.
[2] While moving : By changing their position, users update the target position of particles,
then this is the dynamics event actuator, and the particle system follows smoothly the
target point.
[3] Noise : Using Kinect microphones, ambient sound is evaluated; when users voices,
background noise or other sounds, reach a peak, the size of articles is changed for an
instant. By using this onset detection, the system wants to induce the feeling of particles
excitement by using sound.
7.4 Single-User events
Single-User events are the interactive events that take place while users are interacting with
the system, then it refers to all the interactions that they can do by their own. Events can
be divided in two different activities:
[1] On creation : (Figure 37) When the particle system is created, it does not appear in the
user position mapping instantly, all
particles are placed in the corners on
the screen and due to their flocking
features move towards the target
position.
This configuration makes the system
more organic, letting users think that
they are who control the particles
system, and not inducing them to feel
that they 'ARE' the particle system.

31
Figure 38.- Going out Event. By user getting closer to any of the edges of the interactive zone, particles cross the edges and travel to user position again as they have been transported.
Figure 39.- Multi-user system.
All particles are elements by themselves and have an identity, their main feature is
following, behave and be like the user, but not being them.
By creating this 'being born' event, we can be sure that the system will not create an avatar
for user which they can be uncomfortable with.
[2] On going out attempt : (Figure 38) When users think that the interactive experience have
offered them everything possible for the system, their response for this thought is ending
the activity by leaving the interactive zone. This behavior means whether the system have
satisfied their expectations or they do not found it interesting nor attractive anymore.
Preventing their first attempt to leave the experience, by getting closer to the edges of the
interactive zone, particles will be able to transfer their position through the limits to the
other side of the screen, and then approaching their position again to users target position.
By letting particles break the limits of the visualization, the system wants to catch the user
attention again and prevent their departure. The movement of particles thanks to their
flocking features is really soft, so the programmed sensation is really attractive.
7.5 Multi-User events
Multi-User events take place when more than one user is interacting with the system (Figure
39). Basing this kind of interaction on the distances between users, designed interaction
have been divided in four different modules, with nice
visualizations that will also try to prevent some activities the user
might use to trick the system.

32
Figure 40.- 'LINES' Multi-User interaction examples.
Figure 41.- 'STICKINESS' Multi-User interaction examples.
Distances activate all those new events when users are less than 1.5 meters far from each
other.
Social interaction is the origin of the following events:
[1] 'LINES' : (Figure 40) Users start to be close enough to start the interaction. In this first
attempt of social interaction lines from one system particle to the other are drawn in order
to suggest the user that something happen when you get closer to other user.
Every agent position in one system will be one of the endings of the line that goes until the
other system agent position in the correspondingly order of agents in the system. For
instance, being qiA the position of agent i in system A, and qjB the position of agent j in
system B, lines will be drawn between qiA and qjB for i,j only if i = j.
Choosing the concept of lines was due to the simplicity of this form as the origin of every
shape; any geometric shape is a mixture of lines, then using the simile of line as the
beginning of something, for us will be the beginning of the Multi-User interaction.
[2] 'STICKINESS' : (Figure 41) Users keep going closer than in the previous mode, then all
lines turn into curves using the same position points between agents from both particle
systems. Plane surfaces with curved shape are drawn in this visualization.
All the particles movement and velocity mixed with the curves generates a perception of
stickiness between both particle systems; this fact suggest the user, after experimenting the
soft change between 'LINES' and 'STICKINESS' that there are many more things to
explore in this social interaction, more visual responses can happen, and users know that if
they continue getting closer one to the other.

33
Figure 43.- Evolution from 'ATTRACTION' to 'EXPLOSION' Multi-User interactions. Order: top-left, top-right, low-left, low-right
Figure 42.- 'ATTRACTION' Multi-User interaction examples.
Stickiness suggest attraction and curiosity to keep on experimenting with this interactive
system.
[3] 'ATTRACTION' : (Figure 42) This new visualization comes when users try to be even
closer, as in real life and depending on your culture, being really close to a person means
intimacy, so if you don't feel comfortable with the other person, tension might increase.
That is the starting point of 'ATTRACTION', where separation, alignment and cohesion
weights from the flocking features of each particle system are increased in order to steer all
the particles into the user position mapping point; and curves are still drawn.
Particles velocity and dynamic properties makes that both systems start to shake a little bit,
then you can have the feeling that tension is increasing due to the attraction between both
systems and the tentative to get closer is served.
However, what if users get too close that Kinect sensor is not able to discriminate one user
that the other, then only a single user will be mapped. By reaching this level, user is
enjoying the system and wants to see more. This possible problem in interaction is what
next step tries to solve.
[4] 'EXPLOSION' : The last social interaction module tries to amaze users, they need to
forget about being closer and get immersed into the system visualization. Then by doing
the last step towards the other user particles get together and suddenly feel an 'explosion'
(Figure 43).

34
This visualization can prevent Kinect sensor default confusion in joining two different
users as a single one by both being too close to each other. Using this unexpected
visualization, consisting on increasing velocity and separation in particles system flocking
features, the system creates an state of movement grazing chaos but preserving the system
elegance. This way, and coming from an evolution of visualization every step more tens
and with a small scope, user is left with nothing else but admiration of what is happening.
Mixing all those feeling that we can extract from the distinct visualization, is true that the
user orientation of the system has been achieved successfully, and there is nothing more
than translating the whole design into the final visualization.

35
8. FROM DESIGN TO IMPLEMENTATION
8.1 System development
Data acquisition and the system design are already done, then only programming the
different methods will be the final step in this new system development.
The whole system has been programmed using Processing as programming environment,
with the use of open Frameworks and the Kinect library Simple-OpenNI, as we have
already mentioned. Nevertheless, other libraries, such as Minim library for audio processing
in Processing has also been used.
Object oriented programming has been used as well in order to guarantee a multiuser
system implementation. By creating classes for every single element in the system we
simplify all task in the design.
A complete UML class diagram of the implemented system is provided in ANNEX IV.
The main function of the system is where Kinect sensor develops all its processes in order
to get the data acquisition; then it involves the user position determination, Flock
initialization and updating of the graphics in the visualization system.
All data is sent to the other classes that form the different object in the system, such as
User, Boid, Flock, Colors or InteractionFlock.
However, how are all the methods implemented?
8.2 User Detection and Tracking
In terms of user detection and tracking two method has been discussed, but at the end
centre of mass detection was used for the implementation of the designed system.
Using this kind of detection we have achieved the goal of detecting the user as soon as he
comes into the interactive zone; this way the system is really efficient and fulfill the
assigned task.
Nonetheless, this kind of tracking also only let us work with the centre of mass, not giving
information about all the other user skeleton joints.
All detection and tracking in image processing method has been performed by the already
given library Simple-OpenNI, so our task was only to get familiar with the data the system
give us, and knowing how to control tracking method in order to get the correct user
position. Fortunately there are lots of books and online references where we can learn how
to use the library [2] [3] [5] [13].

36
With user information a User class has been created to store all the values per each user
interacting with the system. Important data is user position and user index reference, which
will determine which user is the 'owner' of which particle system.
User class is the one that translates user position in Kinect frames to real world distances
and then visualization units.
8.3 Particles (Boid and Flock class)
We refer to any Agent as a Boid in the Flock or particle system, this way we can preserve
notations given in literature [10] [12].
This is then the graphical part, or visualization system of this project. Processing is a useful
graphical programming tool, then most of the graphics have been programmed with the
graphical functions that this environment provides us with.
In terms of data storage, agents have been stored in a java ArrayList object in order to get
all the data more dynamically. Then Particles system or Flocks have been stored in a simple
array of class Flock.
Then we can determine a Flock class object, that will be created every time a user gets into
the interactive zone. By giving the Flock objects a concrete number of boids that this flock
will have, Flocks are in charge of creating all agents of class Boid and determine which
colors from users will be used as boids attributes.
For that reason a Colors class have been created in order to store all colors from user in a
java ArrayList and maintaining a correlation between shapes and colors.
Boid class then is the lower class in the graphical part of the system, but also the one that
controls the visualization. Boids have a position and a color, but also a velocity and a force
that is determined during flocking, and perform changes in visualization while interacting
with other flocks.
In fact, is in Boid class where Flocking algorithm is programmed. Per each boid separation,
alignment and cohesion are checked towards the rest of boids in the Flock. Is because of
this property that all agents have flocking attributes as Boid attributes.
It was easy to use this environment for the creation of the Particles system in order to
control in a more visual way all the parameters and features that the different shapes have
relating them to the user data, this is why complexity in the creation of the shapes has been
added; and beautiful results have been achieved.
A wide range of books and online reference about processing have been used to get an
insight into this environment programming [14] [15] [16] [17] [18].
Values, like the number of agents created or interactive zone size, have been given as static
values.

37
The system creates particle systems of 40 agents and the interactive system is narrowed in a
2x2 meters zone. Moreover, only a system for two users have been programmed.
8.4 Focusing on User Interaction
By adding all the connections between user interaction in the interactive zone and the
creation of the particles this system is focusing a little bit on User interaction and social
experience.
Interaction between user and the system while determining the position of the user and
mapping it into the visualization system is determined in Data acquisition and visualization
part, whereas interaction between users have an effect in every agent of a particle system,
and is programmed inside a InteractionFlock class.
InteractionFlock is formed from two different flocks that are interacting in the system and
contains all the methods to determine the distance between the center of both flocks and
whether there have to be a change in visualization due to the current interaction or not.
Then, all modules in multi-user interactive events are placed in this class, but modifications
on each flock are done by changing parameters per each boid.
Interaction design is a really very documented topic that has been referred in many books
and other resources [14] [17] [19].
Last but not least, by making loud noises we are applying a onset or peak detection with
sound processing. By using a special driver to get audio data and learning how to use
Processing Minim Library [20], audio processing task have been done.
This way, different kind of interaction and methods have been programmed inside the
system implementation.
8.5 Audiovisual Display
Where we are going to display the system takes an important part in the visualization, this
is why this designed system can be placed in whichever wall you want, but it is true that
user will be part of different experiences depending on the surface it is displayed.
The system has been designed to be displayed in the wall, then users will be able to move
around the room and only will have to look at the wall they have in front of them (only if
they are walking toward the wall where the system is displayed).
Nevertheless, a second implementation has been considered. Imagine displaying the
visualization in the ground, then users position would be the exact position as particle
system, and the interactive experience can be totally different and really enjoyable.

38
Of course the final application of the system has to be considered. If we want to use it in
an art gallery, as an art project or interactive activity both configuration can be chosen.
On the other hand, if the system is being used as a Technologies for the Stage application,
is better to use it in the back wall, where audience can see the results of artist movements,
for instance dancing steps, clearly.
** Application source code can be found in: https://docs.google.com/file/d/0B4AvtQwajRBqaE1HWTB2V3Q2V2M/edit?usp=sharing
*** Either videos about the system or Demos can be found in the following links:[1] http://www.youtube.com/watch?v=6tu5LAzSRGo
[2] http://www.youtube.com/watch?v=ThgAG-yUptQ
[3] http://www.youtube.com/watch?v=nQidIWQ-TBI

39
9. FROM LITERATURE TO A NEW SYSTEM
Despite of using several libraries, this system was developed without using a lot of already
implemented code. All libraries were only used to get the data, and then the manipulation
was implemented while programming all the methods. We can say that the system has been
programmed from scratch even though several functions where obtained from certain
libraries.
By learning through tutorials, books and some online references, programming with
libraries, designing the methods and devising some algorithms made the creation of the
system feasible.
About Simple-OpenNI library for Kinect and Processing, you can find a lot of information
on the Internet, this is why this was the chosen programming environment. There is a huge
community behind open application development with Kinect sensors and many online
references as well as really good books. You can learn through many literature how to use
and control data from the library, so it is easy to start from scratch if you want to. O'Reilly
book 'Making things see' [5] is a good example if you want to start learning how to program
with Kinect; from this book firsts steps with the system code were done.
About Minim library, it was interesting to learn how easy onset and beat detections are
calculated, even though the library is a little bit bad documented, you have access to official
online resources [14] [21] that are very helpful by teaching with some examples. On the other
hand you can also find examples related to this libraries in other books [17][18].
Audio processing, and in fact onset detection was something I have worked with in the
past, but in this interactive system implementation was only an extra part in order to add
some more functionality, so no further documentation has been mentioned. Indeed, audio
processing part has been the part with the less time spent.
To perform all the methods with Kinect special drivers has been installed. As long as
PrimeSense and OpenNI have not developed drivers for Kinect Audio and Processing
environment. This driver is provided by the official Kinect developer, Microsoft[21], that
recently has given all drivers for free, with a really good documentation.
Other libraries have been tried but as long as they did not fulfill the expectations are not
mentioned in this report.
What image processing is concern, many methods have been used, such as color
subtraction or user real position determination. Many references about Computer Vision [6]
[7] have been used to figure out how to solve the need of those problems, but in the case of
color subtracting it was testing with the frames manipulation what gave a real useful
answer.
Understanding calibration and applying correspondences between images is not an easy
task, but after attending to a 3D vision course, most of the topics were not hard to
comprehend; this is why only a few reference about using those methods have been
mentioned in this report.

40
Furthermore, the programming environment Processing was a tool which I have worked
with before, but many books [14][16][17][18] and courses have helped to develop more
sophisticated code, as well as the use of non trivial data structures and object-oriented
programming configuration of the whole system.
Flocking algorithm is one of the most programmed methods that you can find on the
Internet, but by studying reports about it [10] and checking official references [12], the
algorithm has been programmed also from scratch, but always with some reference code.
That way of working with the algorithm has helped to understand widely all the rules in
order to be used inside the system.
Finally, interaction, user experiences and possible applications in digital arts and many
more fields concepts that have been used in the project, are based not only in referenced
literature [17] and online resources; also personal creativity, learning activities in creative
programming and inspiring creative blogs [19] consultation, are the reason of the interactive
system development.
Working with the implementation of a new system has involved a exhaustive search of
resources, literature and reference about many topics, as long as the project involved many
fields of engineering, in order to design all processes before starting to program them.

41
10. EVALUATION
10.1 Results and limitations
Testing the system helped to find bugs in programmed code, as well as improve some
commands and methods that increases product feasibility. Even though many more things
can be done, that would improve the system, this final version is reacting quite well and
have reached all the milestones settled in planning.
By analyzing all parts of the system, I want to analyze which are the results obtained by
developing this interactive system, as well as the limitations that I have encountered while
designing and implementing it.
Many goals were settled and trying to mix several fields in a same project was quite risky,
by final results show that it was possible to involve many topics in the same system design.
Considering Kinect sensor used for development is second hand and first generation, it
was not ignored that many limitations would be found. Comparing to new releases from
Microsoft, tracking methods give a good result, but could be better by using a more
updated device. It is known that up to four users can be detected, but only two were able
to be tracked, this is why the system has been developed only for two users. Moreover,
new devices have a wider vision range, feature that our sensor have limited interaction
zones, but it has not difficult the system performance.
Designing the system while data was acquired made the initial project milestone to be
slightly changed several times. At the beginning of the system development, not much
information about all topics was clear, then by getting more used to work with all the data,
new features were designed.
User detection and tracking is a really long issue to discuss; as long as in this system centre
of mass user detection has been used we have resigned to the possibility to use user
skeleton joints, then wider and interesting ways of interaction have been totally dismissed.
Interaction was really limited and further development have been done to add more
complexity to the system. Nevertheless we win in efficiency while detecting user, only
needing them to go inside the interactive zone and being detected as soon as they appear in
it. This instantly detection of the user was one of the system requirement, then the
possibility to use calibration to get all the joint was not an option.
Center of mass detection also allows us to track a user hand, but after testing this
functionality, confusion between both users can be found while using the multi-users
mode; then this new feature was dismissed, only using user position to control the
interactive system.
Position determination algorithm is quite accurate, giving really exact results and measures
in real world, but it was not accurate for the preliminary system design, that wanted to
calculate distances inside the room.

42
The problem was really simple, and so was the solution. We wanted to calculate real
distances comparing users position to the room, but at the same time we wanted to
generalize those calculations to any room. Then not knowing room dimensions and having
a clearly limitation of camera vision range, it was impossible to get the wanted data. Then
the Interactive zone was designed.
The system is programmed to a certain interactive zone in order to generalize it and make
it more feasible to use, it is adapted to camera vision range and can be compared with the
real distances measurements obtained; after generalizing also room dimensions, any
interactive zone can be used, but always considering sensor limitations; for instance, a really
big room might not fit inside Kinect vision.
Adding sound to the system was a last minute addition, that was not considered at the
beginning the system development, but at the end as long as it was not really difficult to
use, and examples found in references were really useful, it was programmed giving the
final version of the system new features with good results.
While translating data to the visualization system, as soon as we got the user position
coordinates thanks to the translation function to map real world distances to visualization
screen distances, no problems were found; nor for establishing the interactive zone, where
the system would be placed.
Nevertheless, working with user colors and achieving good results was really difficult, but
testing with some self-created algorithms for pixel treatment the problem was solved with
good results at the end, even though it might give some bad results, but dependence in
lighting, noise and other influences are quite difficult to skip.
Particle system dynamics are quite good. By adding flocking to the particles behavior we
have solved previous problems with fluency in particles movement and needs to control
frame rate parameters. Then by using this smooth algorithm, visualization system has
gained more elegance with more fluent visualization and a better performance.
By adapting flocking to the system needs, better results with visualization system kinetics
have been obtained.
One of the best improvements was changing the particle different shapes configuration
into more organic use of circles; new configuration of visualization was perfectly joined
with flocking algorithm, color mapping and beating behavior. All agents in the system
gained the property of belonging, and correlation between all circles involved all agents as a
flock.
While using the multi-user system, we can see that it works really well for two users
interacting at the same time, and a third and a fourth users can be added, but not more.
Nevertheless, when more than two users are using the system, whether because the
interactive zone (used for testing) is really small or possible sensor limitations, the designed
system does not work properly and one of the user might disappear for a while.

43
As long as in the first conception of this project was not plan to detect more than one user,
the obtained results are better than expected, and in fact really good.
Whether the system is implemented in a bigger scale with more users, more sensors might
be necessary to use, and that would add unexpected costs to the project.
Due to the use of a single sensor which implements really strong processing methods,
comparing to more professional sensors, final application has been developed with huge,
well documented and very satisfying results with a very cheap technology, so the
development of an interesting powerful system has been implemented with minimum
resources.
Finally, interaction is really effective. First, correspondences between users and particle
systems are well performed letting the user experience with the system to be really fluent.
Thinking in user experience by setting the system into a user oriented one, is what raises
the project to another level. Already implemented interaction between users is really fluent,
intended to surprise and with smooth transitions. By testing it we can see amazing results
very inspiring, creative and with certain beauty.
All this designed interactive system, hence has turn into a really good user experience to be
tested with real great scale users in further work.
By organizing the system in object-oriented programming, the system can be easily adapted
into several different applications.
10.2 Applications
The aim of every project is to be useful in an oriented application. By focusing the system
design as a Digital Arts approach, it is reasonable that the main application is intended to
be used in this field.
Digital arts have turned creative programming into a real showcase of projects where
technology and design are mixed together to create beautiful applications. Nowadays many
blogs [15][19] and communities rises to share new creative applications used in artistic
workshops.
By introducing human-computer interaction to the system we are giving functionality to
the final result, letting the system having a meaning for users who interact with it, making
them feel this artistic and creative application; therefore we have created a Digital Arts
application.
Installing the system in a gallery, or any room where public have access, we can test the
system in a real environment as a Digital Arts exhibition.
Nevertheless, a more sophisticated system final display should be considered for a better
user experience.

44
Figure 44.- Stage platform.
Placing the system in a high stage platform, like in
Figure 44, visualization system display might be done
through a projection in the ground and sensor should
be place in a metallic structure in order to analyze the
whole scene.
Notwithstanding, projections have to come from below the stage, in order to prevent
projecting the visualization on users; then, the stage material have to be strong to resist
users walking on it, and translucent enough to display the system visualization.
By being the visualization in the same surface where the user is moving, system
performance and the whole interactive experience, can let users enjoy the application in a
really special way, provoking emotions and letting them play with the system in different
ways from the normal configuration in a wall.
On the other hand, not only Digital Arts can be an application for the system. As it was
mentioned before, we also can use it involved in a Technologies for the Stage project.
Technologies for the Stage is the field where Digital Arts are used with a concrete context.
This new field wants to integrate technology with design to create an application that used
by an artist, for instance an actor or a dancer, in order to use it as atrezzo that will include
more versatility to their job.
If our system is introduced in a dancing performance, using it as atrezzo, placing the
display system in the stage back wall, the results can be very different. The system can be
used to add creativity and originality to the show, let improvisation be in the same context
as the rest of the rehearsed show or even telling a story.
And are those kind of application which are changing artistic expressions, by letting
technology be involved in artistic projects.

45
11. CONCLUSIONS
By evaluating the work done, all the milestones that were settled has been achieved, and
different results has been reached.
Users location have been used to develop this new system. Only coming into the
interactive zone where the system is placed, it starts detecting them and displaying the
visualization response to the interaction.
Avoiding the preconception of telling users what they had to do with the system in order
not to create false expectation was good in terms of surprising the user when the system is
activated, but most of the time they did not know what they had to do with the system,
even the interaction was declared as the more simple possible (moving).
Then, so as to solve this problem in future uses of the system with new users, a little bit of
context should be provided.
The system has been developed with a wide scope conception, but with lowers resources
possible. Choosing Kinect sensor over other options, let the project be developed with a
reduced inversion, then a bass cost in execution and good results with its performance.
Only using one sensor to develop a complex system with powerful cheap technology let us
implement the system successfully.
User position is not only the only and final data for interaction that the system uses; also
sound and other possible behavior consideration were used so as to implementing new
usability in the system.
Several fields of technology and engineering were used during the development of the
system to give the user-oriented experience a good and attractive visualization, that has
been achieved.
In a more technical and deeper approach, thanks to Kinect sensor library, most of the
Image processing needed, such as user detection and tracking, was reliable and effective,
letting data acquisition process to be accurate. Moreover, used Kinect handicaps were not
any issue that affect the final version of the system.
Nevertheless, in a pre-conceived version of the project, 3D point cloud was intended to be
used; but having a lot of interesting data to be processed through other information source,
missing this part was not any problem.
Centre of mass user detection and tracking works extremely well letting the system
recognize users presence as soon as they get into the interactive zone, reaching this way
one of the goals of the project.
Position determination is really accurate, even though width calculations are considered
from the centre of camera vision instead of considering the room, but as long as the system
can only work with a determined interactive area, all measurements are good and valid.

46
It is true that the system does not use camera calibration issues. However, some parameter
related to that topic were used to get user position. We can see how not working with this
computer vision process does not invalidate working with calibration data.
Onset detection in audio processing provide the system more versatility and richness
referring to interaction. In the visualization system, peaks are barely noticed but they give
the geometrics more vivid behavior.
Position mapping from real scene to visualization display is well translated, but sometimes,
depending on where the audiovisual display is settled, it might be kind of awkward to use.
For example, while testing the system, as long as a huge projection was not accessible to
use, a laptop screen was used, so the effect was not seen in its whole configuration.
Interactive zone works well, although a really little area was used while testing.
Notwithstanding, position mapping and interactive condition subjected to the zone worked
well.
By generating particles from users, we gave the particles a mark-up. The main goal was to
develop a kind of visualization that with correspondences with users was able to represent
them but not turn into an avatar. Avatars usually upset users as long as their expectations
or self consideration; then, having an avatar that do not reflect what they are might make
them angry.
Moreover, the particle system has been created with extraordinary results. Taking users
colors to give them identity, and dynamic behavior to set their activity in order to give
them self-sufficiency, with a proper matter for existence.
These results made users who tested the system feel that particle systems exist on their own
while they tend to follow users position.
Flocking behavior has been really useful in terms of achieving an organic visualization. The
algorithm let the particle system react smoothly to all interactive impulses, and mixed with
symmetric shapes (circle) used, the dynamical feeling was really soft, hence, excellent.
Mixing own features with interactive events, all visualization systems were completed with
new behaviors. By using multi-user interaction, all visualization and their sudden and fluent
beautiful conception, new kind of visualization were achieved.
Users who tested the system express that the visualization was surprising, elegant and really
beautiful. All interaction events were considered as strong points in interaction, and the
effect that all visualization did was absolutely terrific.
Furthermore, working with object-oriented programming and different kind of data
structures was really thorough. Everything had to be really well connected in order to make
the system work properly.
Organizing all features and components in the system in classes helped to summarize the
system and settle a strong structure.

47
Referred literature helped a lot during the development of the system, helping to learn how
to use every single element in this design. However, all the system is a self-created original
idea and has been developed from scratch.
Having then good results, give the feeling that all goals have been achieved, and that a new
interactive system has been created using different knowledge acquired during all my
engineering training.
Nevertheless, new features, and improvements can be done in order to enhance the system
in a future Several further work tasks have been also proposed.
11.1 Further Work
Adding interaction to the system will be other further work that can be considered to be
done. First of all, as long as in centre of mass detection we cannot access to any additional
skeleton joint, it would be interesting to be able to track several users hands and interact
with their position. Also more users should be detected in the system and new ways of
interaction can be implemented.
The designed system was intended to be used in a Digital Arts context. I would like to
implement the same system by using user calibration in order to obtain the skeleton
information for a programmed visualization in the field of Technologies for the Stage, for
instance in a dancing performance with two dancers, then a wide range of interaction
between both particle system can be implemented introducing improvisation and giving the
chance to tell a story.
In terms of Audio Processing not everything has been done, I would like to try to
modulate the shape of the particles with the audio wave obtained by the Kinect
microphones, then, all particles would look like more alive than they do now. At this
moment only size of the shape is changed with sound interaction; in a further
implementation, shape size is not the only that changes, also the shape itself.
In a more advanced implementation, adding complex Image Processing features such as
smile detection, mood detection and similar methods will also be nice in order to control
the visualization processes, only in the Digital Arts application.
All in all, I am glad to say that all the goals and objectives that were established for this first
conception of the project has been achieved. Not only the system has been implemented,
further features like multi user and audio processing has been included.
The performance of the system is good and as soon as more implementations are done, it
would be tested with real users in order to determine the usability of the system, including
it in Digital Arts and Technologies for the Stage fields; so to as give a useful application to
the system.


49
References
[1] Hoiem, Derek. University of Illinois. "How the Kinect Works" Lecture slides available
from : http://courses.engr.illinois.edu/cs498dh/fa2011/lectures/Lecture%2025%20-
%20How%20the%20Kinect%20Works%20-%20CP%20Fall%202011.pdf
[Accessed March 2013]
[2] Kinect library reference SimpleOpenNI, online resources by learning Codasign.
Available in: http://learning.codasign.com/index.php?title=Reference_for_Simple-
OpenNI_and_the_Kinect
[3] Kinect library source, Simple-openni. Available in:
https://code.google.com/p/simple-openni/
[4] Lu Xiam, Chia-Chih Chen and J.K Aggarwal. Univeristy of Texas. "Human Detection
Using Depth Information by Kinect". Available from:
http://cvrc.ece.utexas.edu/Publications/HAU3D11_Xia.pdf [Accessed March 2013]
[5] Borenstein, Greg. "Making things see: 3D vision with Kinect, processing, Arduino
and MakerBot" (O'Reilly, 2012. 1st Edition)
[6] OpenCV documentation (vers. 2.4.5.0) . "Camera calibration With OpenCV".
Webpage link:
http://docs.opencv.org/doc/tutorials/calib3d/camera_calibration/camera_calibration.ht
ml
[7] Robot Operating Systems {ROS.org} (Webpage). "Kinect calibration". Webpage link:
http://www.ros.org/wiki/kinect_calibration/technical
[8] Chen, Junqing; Pappas Thrasyvoulos. "Adaptive perceptual color-texture image
segmentation". Available in : http://spie.org/x8899.xml?pf=true&ArticleID=x8899
[9] Lin, I-Chen. "Computer Vision 3: Color". Lecture available in:
http://caig.cs.nctu.edu.tw/course/CV09/Vision_3Color_S09.pdf
[10] Olfati-Saber, Reza; IEEE. "Flocking for Multi-Agent Dynamic Systems:
Algorithms and Theory".
[11] Olfati-Saber, Reza. "A Unified Analytical Look at Reynolds Flocking Rules".
[12] Reynolds, Craig. Online resources. Available in: http://www.red3d.com/cwr/
[13] Codasign Learning (Webpage). "Using the Kinect with Processing". Webpage link:
http://learning.codasign.com/index.php?title=Using_the_Kinect_with_Processing

50
[14] Shiffman, Daniel. "Learning Processing: A Beginner's Guide to Programming
Images, Animations and Interaction". Online resources:
http://www.learningprocessing.com/
[15] OpenProcessing network. http://www.openprocessing.org/
[16] Reas, Casey; Fry, Ben. "Getting Started with Processing: A Hands-on
introduction to making interactive Graphics" (O'Reilly, 2010. 1st Edition)
[17] Noble, Joshua J. "Programming interactivity: a designer's guide to processing,
Arduino and openFrameworks" (O'Reilly, 2012. 2nd Edition)
[18] Vantomme, Jan. "Processing 2: Creative Programmming Cookbook" (PACKT
publishing, open source*, 2012)
[19] Creative Applications Website: http://www.creativeapplications.net/
[20] Minim Library source. Available at: http://code.compartmental.net/tools/minim/
[21] Microsoft (Webpage). Microsoft Developers Network. "Kinect for Windows".
Webpage link: http://msdn.microsoft.com

51
ANNEX I : PROJECT CHARTER
PROJECT CHARTER
INTERACTIVE SYSTEM DESIGN FOR AUDIOVISUAL CONTROL USING
POSITION DETERMINATION
Bachelor's degree in Audiovisual Systems Engineering
Argenis Ramírez Gómez
1. IDEA / BACKGROUNDS / PROBLEM:
Human Position determination in a determined zone (floor) in order to map the captured
data (location) as an output of the system to use it over audiovisual system control. It is
important to notice that the position determination system is supposed to be able to track
the target location at any time.
Currently there are many sensor systems that can help to determine the location of a
person in a room, such as microphones/loudspeaker combination, special Cameras,
piezoelectric pressure sensors, ultrasonic, lasers, etc.
Those systems don’t guarantee the 2D location in a certain zone, only have been used to
create similar systems or more basic ones, or even have been used to develop a helpful tool
to this project.
The main problem is the decision on which tool will be useful in usability and cost terms,
so taking into consideration which kind of features each sensor or system gives to the
system, each option will be an important thing to study.
2. PURPOSE. DESCRIPTION:
By interpreting human interaction with floor in a certain zone, the purpose of this project
is to validate itself by introducing different results depending on distinct behaviors and
programmed modes. The idea not only want to introduce another way to visualize
interactively certain kind of information, for instance visual content, I would also like to
link it up as a project in the Technologies for the Stage field, that can be performed on a
dancing show, or on the other hand validated in Gamming field or Digital Arts field too.
Figure 1.- Audiovisual display of the designed system.

52
3. GOALS:
Validation of the position determination system on different interactive system designs in
distinct fields, such as Technologies for the Stage, Gamming, Digital Arts, etc.
4. RESULTS:
Creation of an interactive system using the 2D position determination that can be
interesting to be used in the fields explained above.
Position determination system development supposed to track the target’s location in a
certain zone.
5. SCOPE:
Hardware -- Chosen sensors and display equipment.
Software – Position Determination programmed method and validation/application
software where the method will be used.
6. STAKEHOLDERS:
Director: Jesús Ibáñez Martínez
7. CALENDAR:
STEP1: Structure organization of the project, Sensor decision, report of the decisions
made.
DATE: Before 2013 starts
STEP2: Chosen Sensor Programming + Position Determination Method Documentation
DATE: Mid-January 2013
STEP3: Position Determination Method Programming
DATE: March 2013
STEP4: Testing and validation
DATE: March 2013
STEP5: Writing report based on results
DATE: April Beginning 2013

53
STEP6: Applications (theoretical) Design
DATE: April 2013
STEP7: Writing Introduction and background report based on applications
DATE: May 2013
STEP8: Applications Programming
DATE: May 2013
STEP9: Testing + Report about Results on Application tests
DATE: May-June 2013
STEP10: Report Revision
DATE: June
8. RISKS:
Inability to overtake the position determination method which wouldn't rely on the project
main objective to be done, an interactive system development.
Wrong choice of the sensor to be used, would delay the whole process.
Not finding any useful application or without valor to users and audience would consider
the project a failure.
9. COSTS:
Sensor hardware costs and applications hardware costs if they are applied. The resultant
cost has to be the less possible.
10. BENEFITS:
Development of a useful method for position determination to be applied in an interactive
design that would enhance certain technologies in distinct fields of investigation.


55
ANNEX II : PROJECT PLAN
PROJECT PLAN
INTERACTIVE SYSTEM DESIGN:
AN APROACH TO DIGITAL ARTS THROUGH KINECT SENSOR
PROGRAMMING
Bachelor's degree in Audiovisual Systems Engineering
Argenis Ramírez Gómez
1. IDEA:
Designing an Interactive System based on User Position in a determined interactive zone
placed in a room or free space. Position data and other features extracted from users would
be the input of a visualization system oriented to human-technology Interaction systems
design.
2. PURPOSE:
Processing users position data in order to control an interactive system based on a creative
visualization.
By interpreting human interaction in a certain zone, the purpose of this project is to create
an interactive system by introducing different fields of knowledge in technology and
engineering.
The main application of the system will be a visualization system based on a particle system
that would translate users data into the display screen. Then, users by moving around the
interactive zone would be able to make the particle system follow them through the screen.
Translating real distances to screen display distances, all measurements of position will be
translated from real world to visualization units.
Using different audiovisual processing methods and interaction events, the system will be
oriented to a Digital Arts application in order to validate all results.
3. SCOPE:
Validation of the user position determination by controlling interactive visualization.
Creation of a visualization system oriented to user interactive experience.
Programming audiovisual processing methods in order to get all data needed for the
development of the system.

56
Design a new interactive system from scratch and validate it in Digital Arts application
field.
4. REQUIREMENTS:
Investigation in audiovisual processing and position detection in order to get all the needed
data acquisition for developing the visualization system.
Find the correct sensor, acquire it and learn how to use it, considering costs.
Design an interactive system based in human position determination with an interesting
visualization system related to user interactive experience in Digital Arts field.
Create a feasible new system that works properly in the application field and achieve all the
project goals.
Program the system and test it to validate its correct functioning.
Control all tasks and communicate advances to coordinator in order to ensure a good
development of the project.
5. SCHEDULE:
Several milestones have been settled:
- Designing the interactive experience application of the system.
- Identifying needed data.
- Plan the tasks.
- Acquire sensor and read literature to learn how to use it.
- Data acquisition structure planning.
- Position determination design.
- Position determination implementation.
- Position determination testing.
- Visualization design.
- Visualization documentation.
- Particle system design.

57
- Particle system implementation:
- Flocking algorithm documentation and development
- Color extraction
- Particle system creation
- Interaction design.
- Interaction development.
- Further implementations design
- Programming the system
- System testing
- Information gathering
- Report design
- Report development
- Report revision
- Project closure
6. COSTS:
Sensor costs and other hardware needs should be considered as low as possible so as to
design and develop a new feasible and cheap system.
7. QUALITY:
All system features should work perfectly, letting at least two users to be part of the system
interaction.
Position determination will be as accurate as possible.
Visualization system will be attractive to users and interactive events have to be designed
thinking in what users would do in the system.
8. RESOURCES:
Kinect sensor camera will be use to acquire most off the data. While Processing
programming environment will be the developing tool of the system.

58
9. RISKS:
Inability to overtake the position determination method which would not rely on the
project main objective to be done, then none of the following planned work can be
implemented.
Wrong choice of the sensor to be used, would delay the whole process.
Not finding any useful application or not without valor to users and audience would
consider the project a failure; then a good visualization system have to be programmed
taking into consideration project goals.
10. COMMUNICATIONS:
All results should be sent to the project coordinator.

59
ANNEX III : SENSOR OVERVIEW
- Microphone/Loudspeaker combination system: Distance calculation from a high frequency
sound sent through a loudspeaker and received by a microphone the user ‘wears’.
Triangulation of the sound received. It entails a dependency on wearing a microphone,
then the system cannot be extended to a usable system without bothering the user.
- Ultrasonic: Distance calculation by using ultrasonic sensors. The main problem is
resolution, there are 'non-visible' zones that have to be solved with the emplacement and
installation of many sensors in order to make the user location determination more
accurate, therefore, the more sensors you need the higher the final price is.
- Piezoelectric pressure sensors: Pressure sensors located on the floor can help to calculate where
the target is on the surface, but as in an ultrasonic system we need to use many sensors for
a high resolution.
- Lasers: User presence detection by interfering on laser rays. This system design encounter
the same problem as the systems explained before. As long as the resolution needed is the
maximal that is possible, it will not be feasible.
- Camera: Possibility to translate pixel distances to real distances and human detection and
tracking methods. It may require strong image processing components, but is a technology
cheap enough to solve with a good performance of the whole system.
Therefore cameras are the best option to work with, although what we are going to use is
more than a camera after all. Thanks to the already programmed libraries of the Kinect
sensor from Xbox by Microsoft, we are going to be able to access all its camera sensors to
achieve our already established objectives and goals.


61
ANNEX IV : UML class diagram