interactive model centric systems...
TRANSCRIPT
SSRR 2014 December 4, 2014 1
Interactive Model‐Centric Systems Engineering(IMCSE)
Progress and UpdatesBy
Dr. Adam M. Ross, MIT6th Annual SERC Sponsor Research Review
December 4, 2014Georgetown University
School of Continuing Studies640 Massachusetts Ave NW,
Washington, DC
www.sercuarc.org
SSRR 2014 December 4, 2014 2
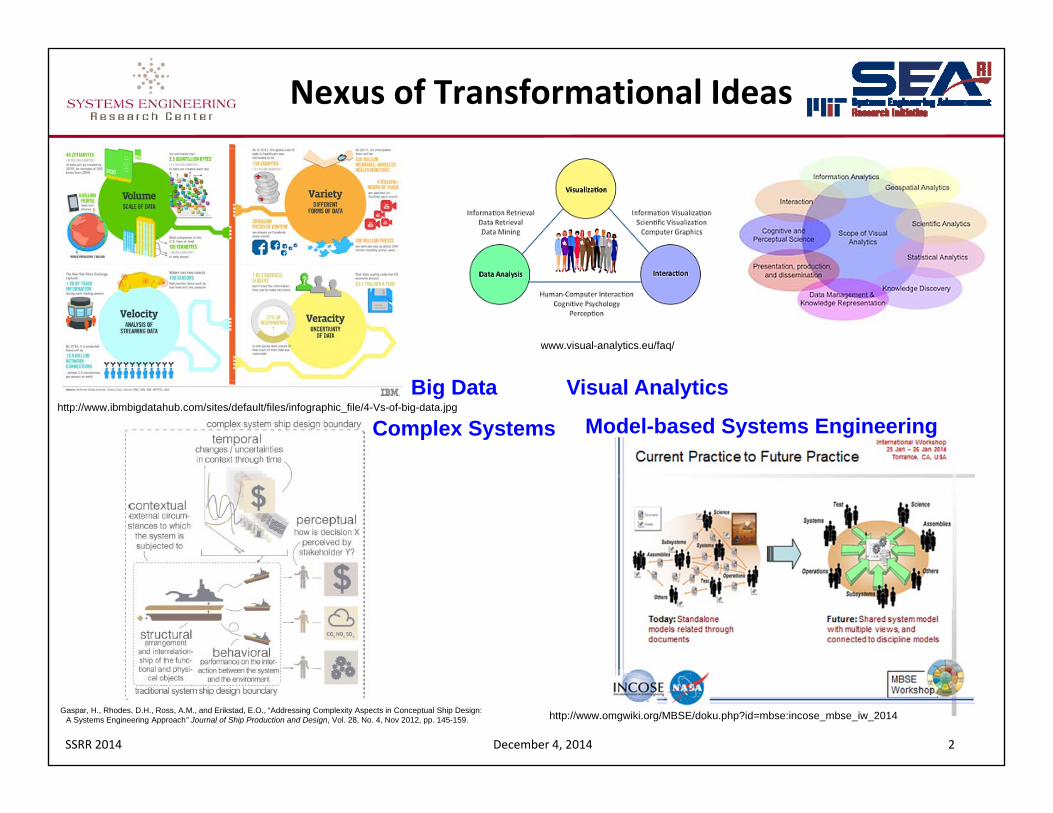
Nexus of Transformational Ideas
http://www.ibmbigdatahub.com/sites/default/files/infographic_file/4-Vs-of-big-data.jpg
www.visual-analytics.eu/faq/
Gaspar, H., Rhodes, D.H., Ross, A.M., and Erikstad, E.O., “Addressing Complexity Aspects in Conceptual Ship Design: A Systems Engineering Approach” Journal of Ship Production and Design, Vol. 28, No. 4, Nov 2012, pp. 145-159. http://www.omgwiki.org/MBSE/doku.php?id=mbse:incose_mbse_iw_2014
Big Data Visual Analytics
Complex Systems Model-based Systems Engineering
SSRR 2014 December 4, 2014 3
Merging the Four:Interactive Model‐Centric Systems Engineering
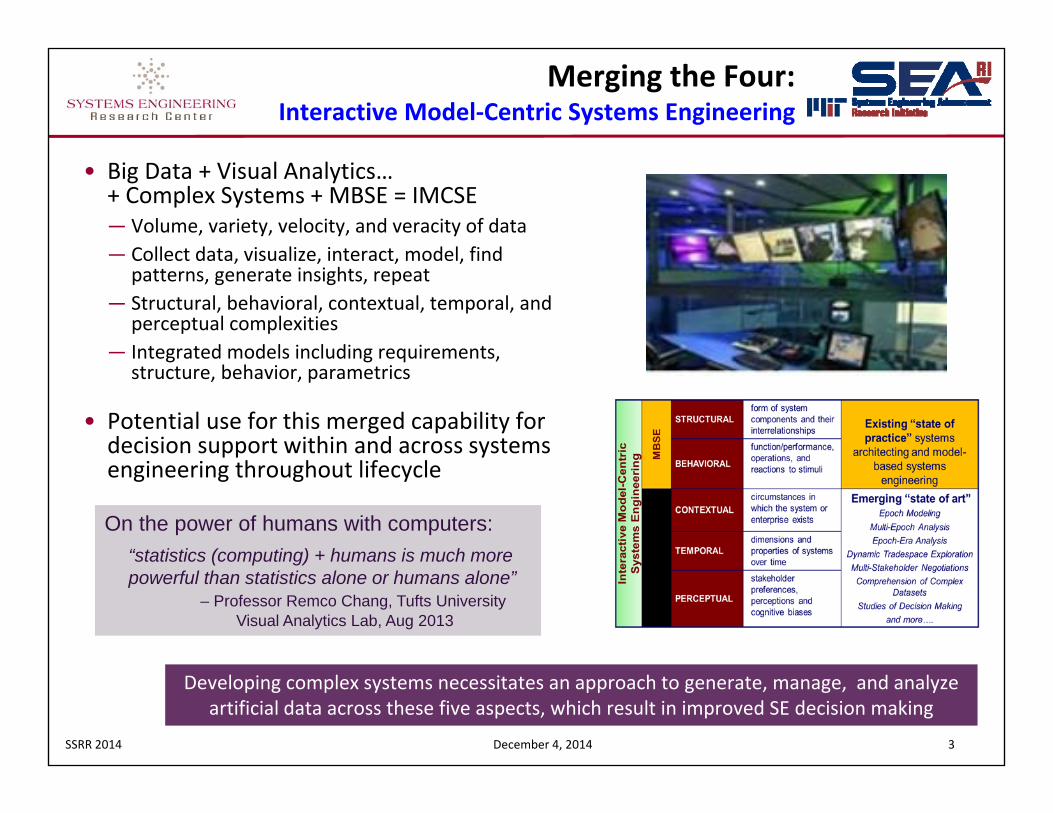
• Big Data + Visual Analytics…+ Complex Systems + MBSE = IMCSE― Volume, variety, velocity, and veracity of data― Collect data, visualize, interact, model, find
patterns, generate insights, repeat― Structural, behavioral, contextual, temporal, and
perceptual complexities― Integrated models including requirements,
structure, behavior, parametrics
• Potential use for this merged capability for decision support within and across systems engineering throughout lifecycle
Developing complex systems necessitates an approach to generate, manage, and analyze artificial data across these five aspects, which result in improved SE decision making
On the power of humans with computers:“statistics (computing) + humans is much more powerful than statistics alone or humans alone”
– Professor Remco Chang, Tufts University Visual Analytics Lab, Aug 2013
SSRR 2014 December 4, 2014 4
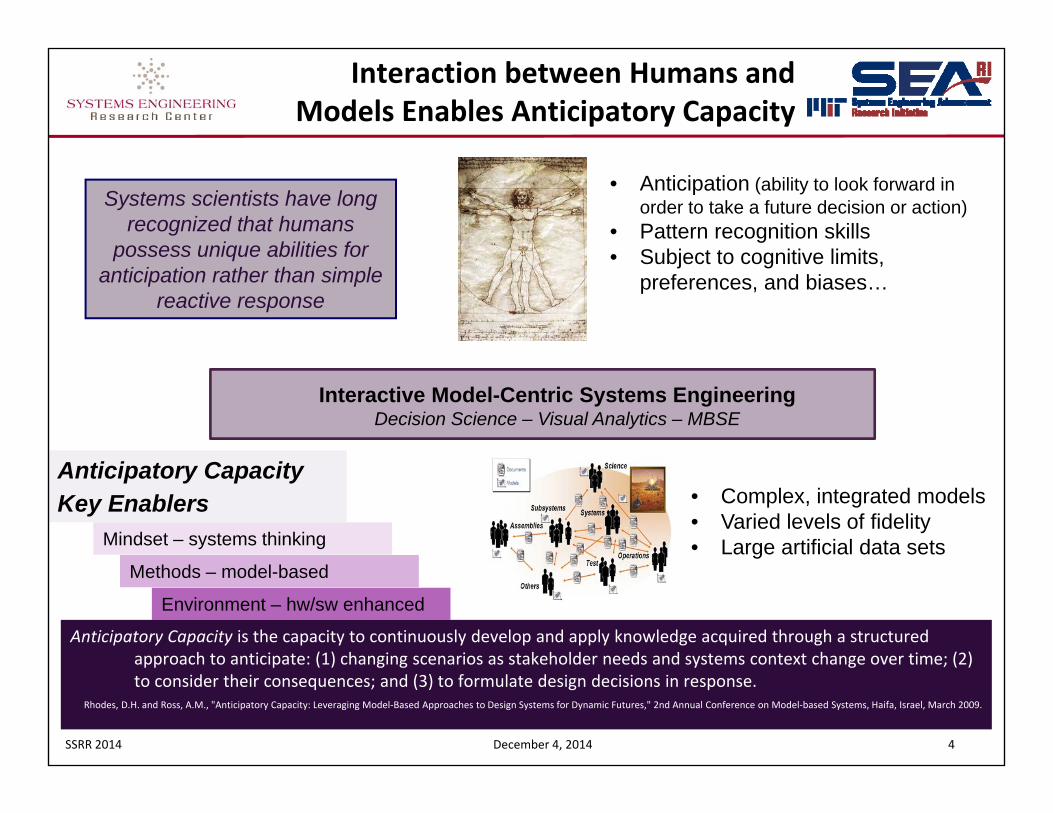
Interaction between Humans and Models Enables Anticipatory Capacity
Interactive Model-Centric Systems Engineering Decision Science – Visual Analytics – MBSE
• Anticipation (ability to look forward in order to take a future decision or action)
• Pattern recognition skills• Subject to cognitive limits,
preferences, and biases…
• Complex, integrated models• Varied levels of fidelity• Large artificial data sets
Anticipatory Capacity is the capacity to continuously develop and apply knowledge acquired through a structured approach to anticipate: (1) changing scenarios as stakeholder needs and systems context change over time; (2) to consider their consequences; and (3) to formulate design decisions in response.
Rhodes, D.H. and Ross, A.M., "Anticipatory Capacity: Leveraging Model‐Based Approaches to Design Systems for Dynamic Futures," 2nd Annual Conference on Model‐based Systems, Haifa, Israel, March 2009.
Systems scientists have long recognized that humans
possess unique abilities for anticipation rather than simple
reactive response
Mindset – systems thinking
Methods – model-based
Environment – hw/sw enhanced
Key EnablersAnticipatory Capacity
SSRR 2014 December 4, 2014 5
Vision for IMCSE Research Program
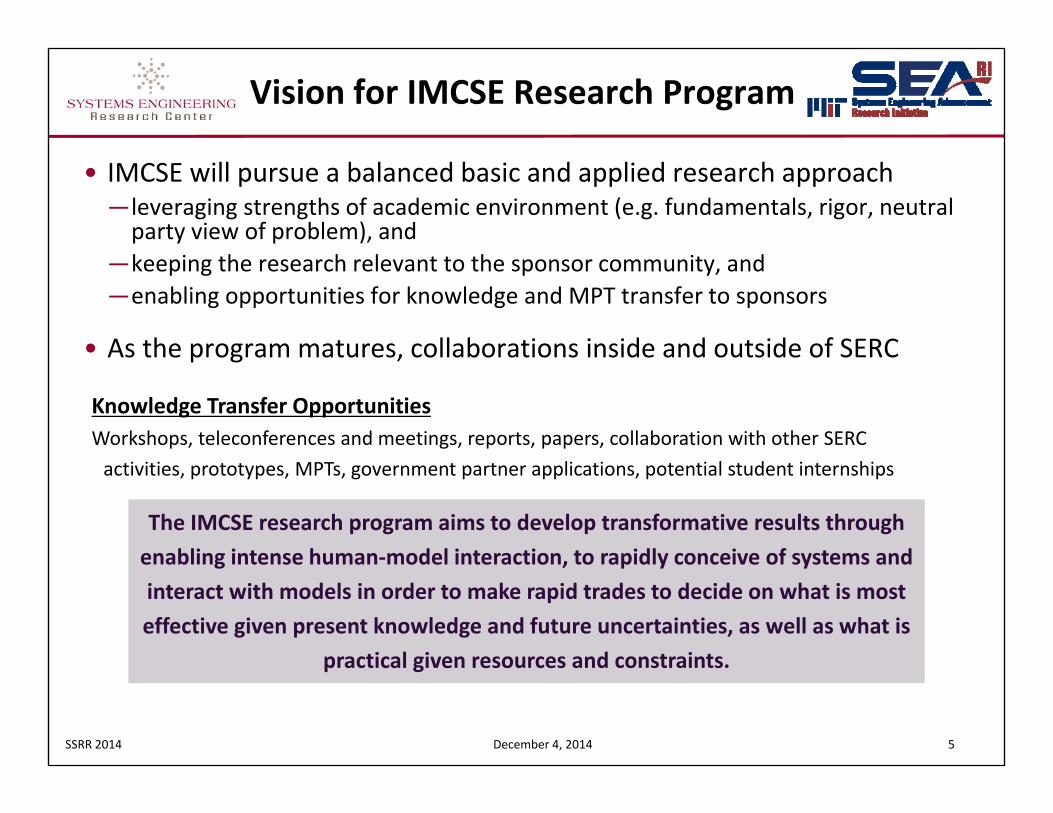
• IMCSE will pursue a balanced basic and applied research approach―leveraging strengths of academic environment (e.g. fundamentals, rigor, neutral party view of problem), and
―keeping the research relevant to the sponsor community, and―enabling opportunities for knowledge and MPT transfer to sponsors
• As the program matures, collaborations inside and outside of SERC
The IMCSE research program aims to develop transformative results through enabling intense human‐model interaction, to rapidly conceive of systems and interact with models in order to make rapid trades to decide on what is most effective given present knowledge and future uncertainties, as well as what is
practical given resources and constraints.
Knowledge Transfer OpportunitiesWorkshops, teleconferences and meetings, reports, papers, collaboration with other SERC activities, prototypes, MPTs, government partner applications, potential student internships
SSRR 2014 December 4, 2014 6
Approach in Three Thrusts
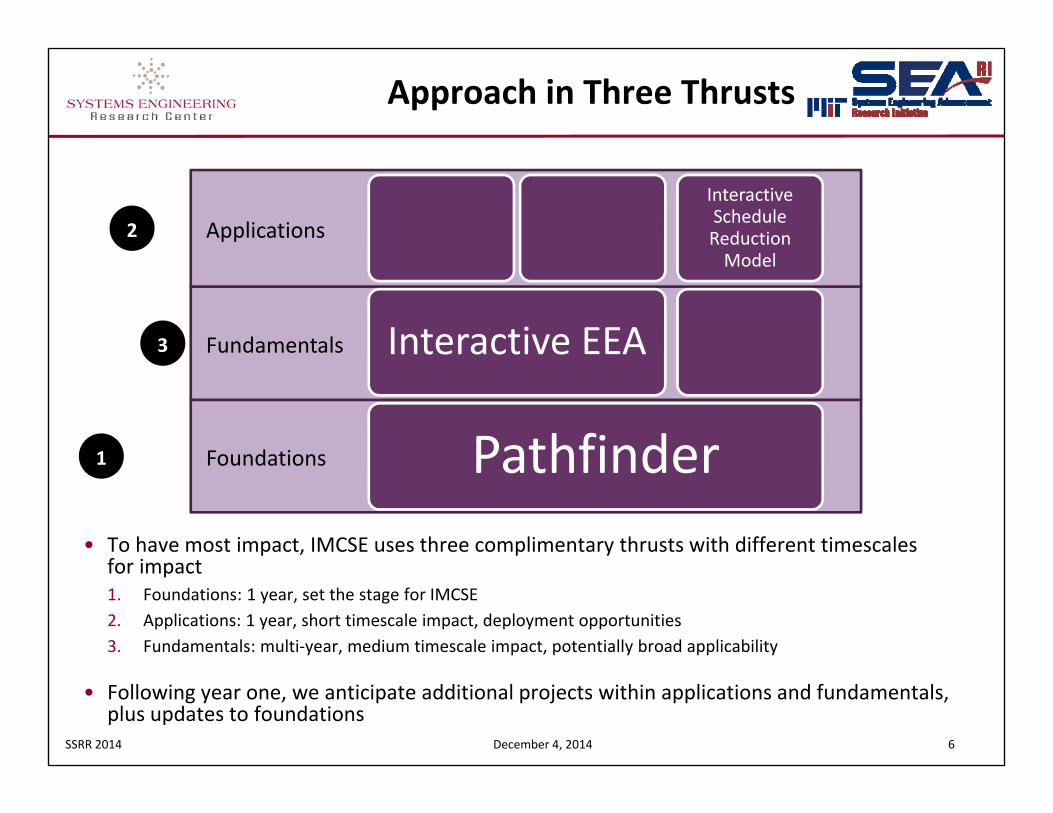
Pathfinder
Interactive EEA
Interactive Schedule Reduction Model
Applications
Fundamentals
Foundations
• To have most impact, IMCSE uses three complimentary thrusts with different timescales for impact1. Foundations: 1 year, set the stage for IMCSE2. Applications: 1 year, short timescale impact, deployment opportunities3. Fundamentals: multi‐year, medium timescale impact, potentially broad applicability
• Following year one, we anticipate additional projects within applications and fundamentals, plus updates to foundations
1
2
3
SSRR 2014 December 4, 2014 7
Updates this Year (June – Dec 2014)
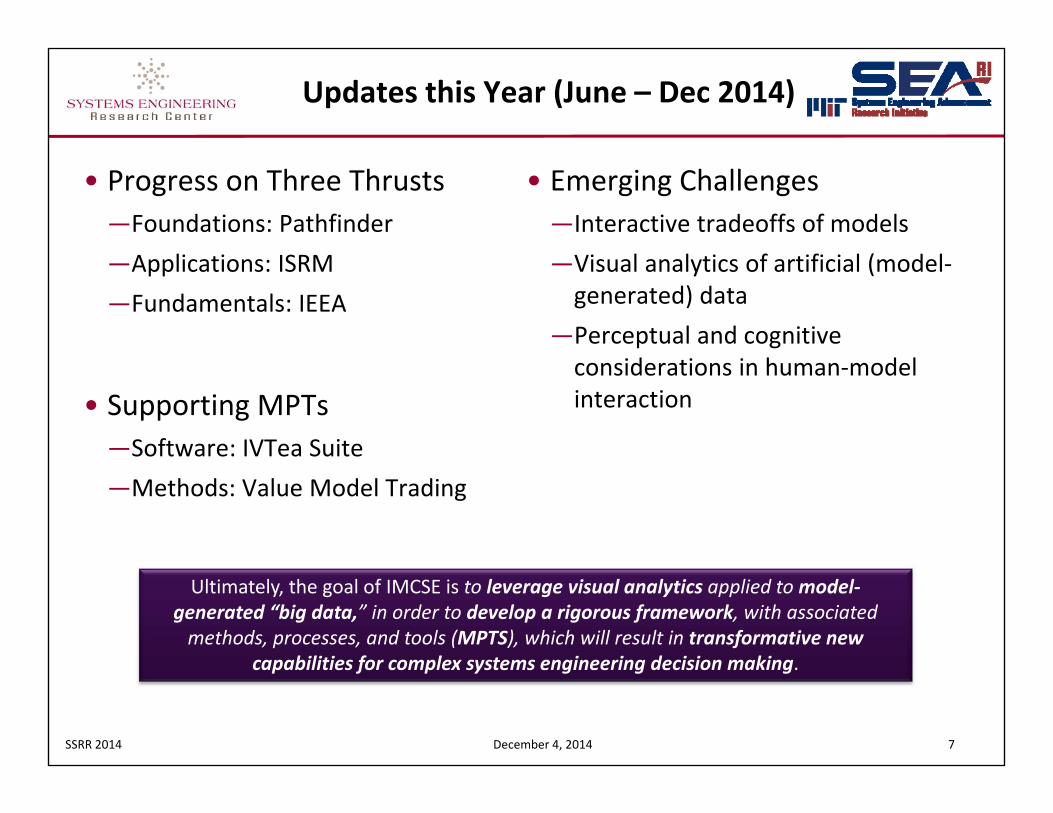
• Progress on Three Thrusts―Foundations: Pathfinder―Applications: ISRM―Fundamentals: IEEA
• Supporting MPTs―Software: IVTea Suite―Methods: Value Model Trading
• Emerging Challenges―Interactive tradeoffs of models―Visual analytics of artificial (model‐generated) data
―Perceptual and cognitive considerations in human‐model interaction
Ultimately, the goal of IMCSE is to leverage visual analytics applied to model‐generated “big data,” in order to develop a rigorous framework, with associated methods, processes, and tools (MPTS), which will result in transformative new
capabilities for complex systems engineering decision making.

SSRR 2014 December 4, 2014 8
Thrust 1: FoundationsIMCSE Research Pathfinder
• Lead: Dr. Donna H. Rhodes, Dr. Adam M. Ross
• Summary: Investigation of state of art and practice, conduct of an invited workshop including SERC and selected outside entities
• Example Anticipated Outcomes: Workshop summary report, literature review, research agenda report
Starlight Visual Information System, www.futurepointsystems.com
SAS Visual Analytics Software, www.sas.com/en_us/software/business-intelligence/visual-analytics.html
GI 1.3, www.graphinsight.comEnabling Software Tools
http://www.lboro.ac.uk/research/avrrc/
http://vacommunity.org/tiki-index.php
The Pathfinder project will focus on identification of past and present related state of art and practice, and will begin to
build a community of interest around IMCSE
http://valt.cs.tufts.edu/
http://www.mbse.gatech.edu/
SSRR 2014 December 4, 2014 9
Pathfinder Project
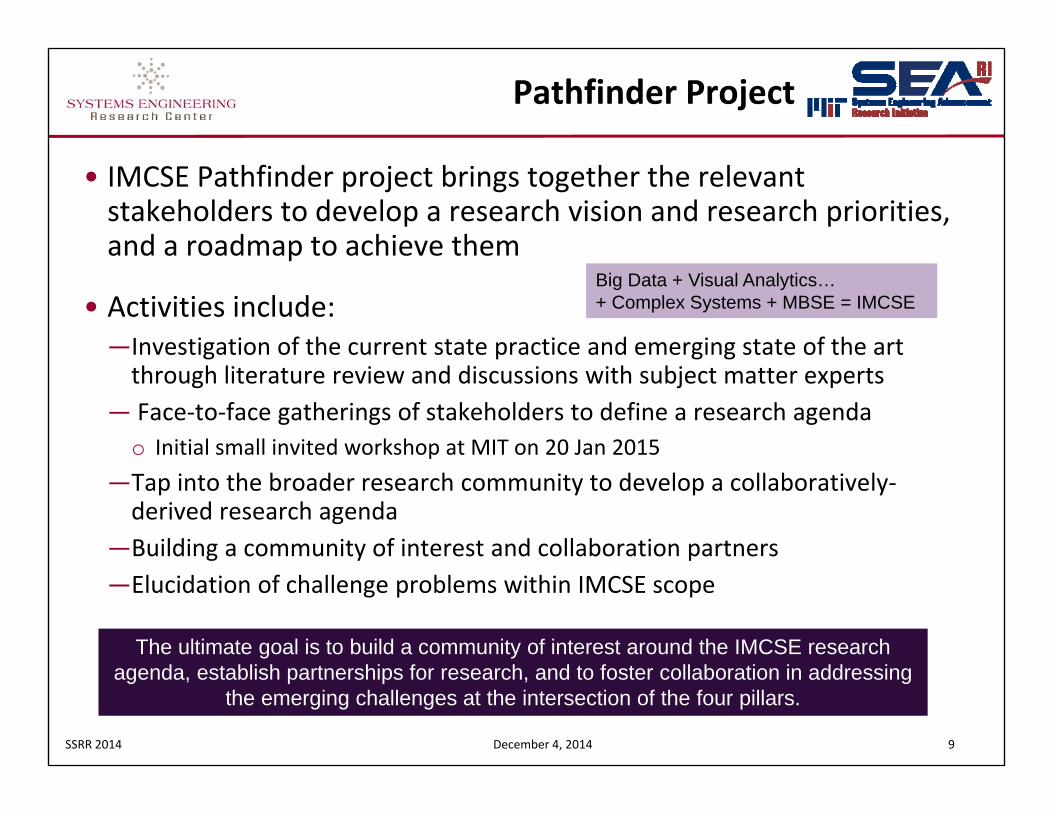
• IMCSE Pathfinder project brings together the relevant stakeholders to develop a research vision and research priorities, and a roadmap to achieve them
• Activities include: ―Investigation of the current state practice and emerging state of the art through literature review and discussions with subject matter experts
― Face‐to‐face gatherings of stakeholders to define a research agendao Initial small invited workshop at MIT on 20 Jan 2015
―Tap into the broader research community to develop a collaboratively‐derived research agenda
―Building a community of interest and collaboration partners―Elucidation of challenge problems within IMCSE scope
The ultimate goal is to build a community of interest around the IMCSE research agenda, establish partnerships for research, and to foster collaboration in addressing
the emerging challenges at the intersection of the four pillars.
Big Data + Visual Analytics…+ Complex Systems + MBSE = IMCSE
SSRR 2014 December 4, 2014 10
Challenge 1: Tradeoff of Models
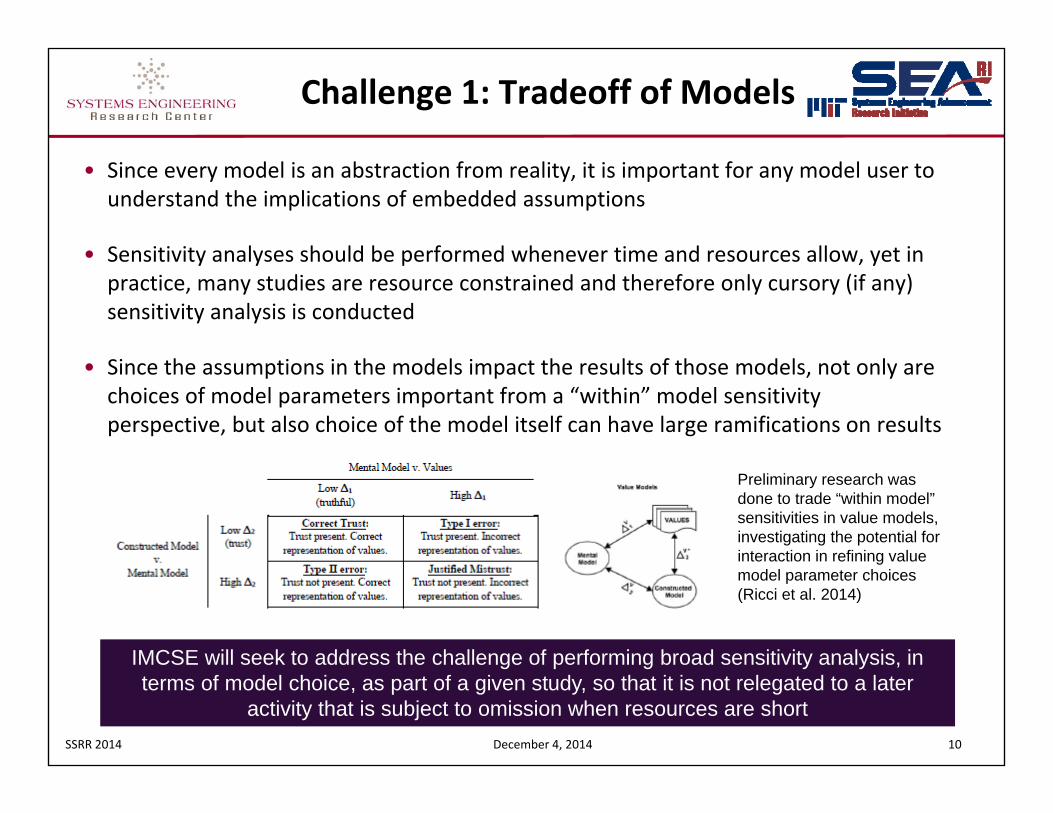
• Since every model is an abstraction from reality, it is important for any model user to understand the implications of embedded assumptions
• Sensitivity analyses should be performed whenever time and resources allow, yet in practice, many studies are resource constrained and therefore only cursory (if any) sensitivity analysis is conducted
• Since the assumptions in the models impact the results of those models, not only are choices of model parameters important from a “within” model sensitivity perspective, but also choice of the model itself can have large ramifications on results
IMCSE will seek to address the challenge of performing broad sensitivity analysis, in terms of model choice, as part of a given study, so that it is not relegated to a later
activity that is subject to omission when resources are short
Preliminary research was done to trade “within model” sensitivities in value models, investigating the potential for interaction in refining value model parameter choices (Ricci et al. 2014)
SSRR 2014 December 4, 2014 11
Challenge 2: Visual Analytics of Artificial (Model‐generated) Data
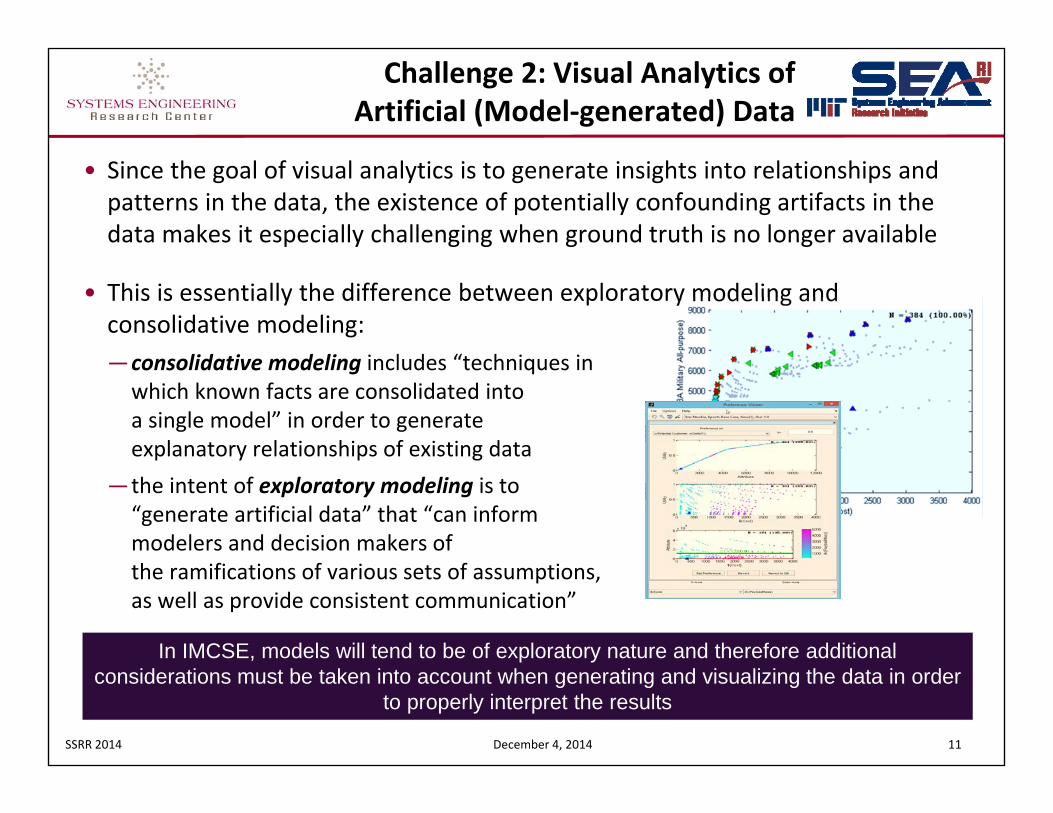
• Since the goal of visual analytics is to generate insights into relationships and patterns in the data, the existence of potentially confounding artifacts in the data makes it especially challenging when ground truth is no longer available
• This is essentially the difference between exploratory modeling and consolidative modeling: ―consolidative modeling includes “techniques in which known facts are consolidated into a single model” in order to generate explanatory relationships of existing data
―the intent of exploratory modeling is to “generate artificial data” that “can inform modelers and decision makers of the ramifications of various sets of assumptions, as well as provide consistent communication”
In IMCSE, models will tend to be of exploratory nature and therefore additional considerations must be taken into account when generating and visualizing the data in order
to properly interpret the results
SSRR 2014 December 4, 2014 12
Challenge 3: Perceptual and Cognitive Considerations in Human‐Model Interaction
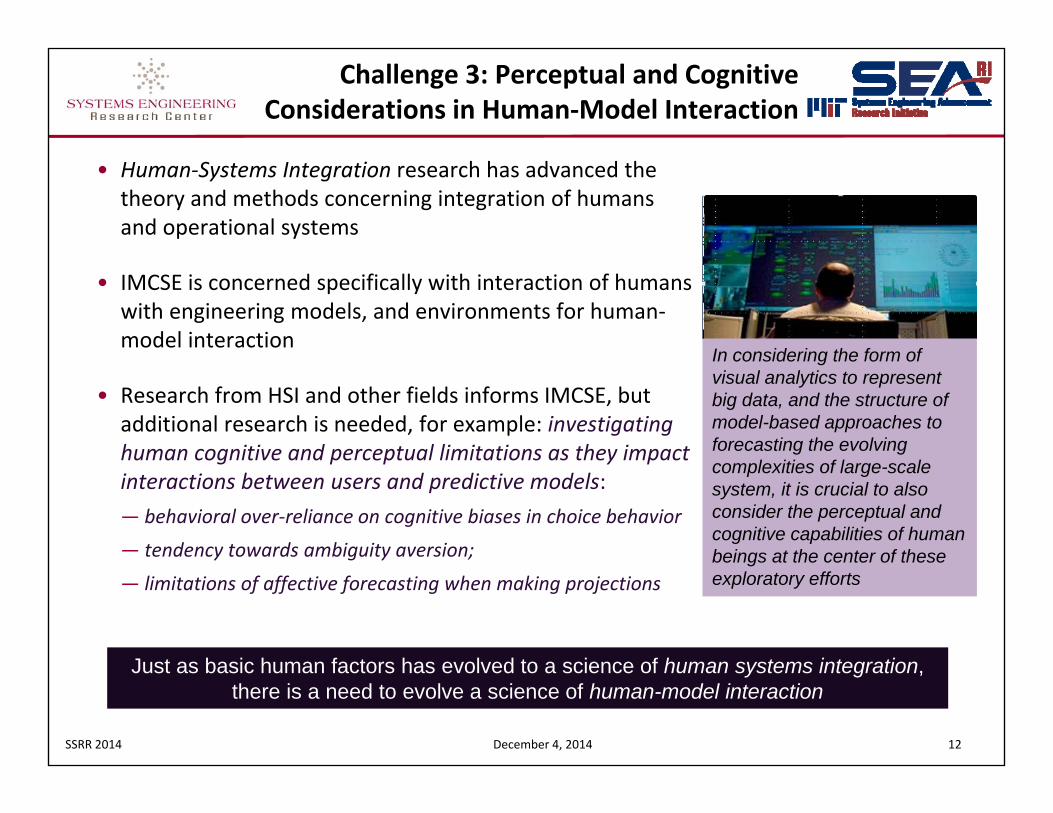
• Human‐Systems Integration research has advanced the theory and methods concerning integration of humans and operational systems
• IMCSE is concerned specifically with interaction of humans with engineering models, and environments for human‐model interaction
• Research from HSI and other fields informs IMCSE, but additional research is needed, for example: investigating human cognitive and perceptual limitations as they impact interactions between users and predictive models: ― behavioral over‐reliance on cognitive biases in choice behavior
― tendency towards ambiguity aversion;
― limitations of affective forecasting when making projections
In considering the form of visual analytics to represent big data, and the structure of model-based approaches to forecasting the evolving complexities of large-scale system, it is crucial to also consider the perceptual and cognitive capabilities of human beings at the center of these exploratory efforts
Just as basic human factors has evolved to a science of human systems integration, there is a need to evolve a science of human-model interaction
SSRR 2014 December 4, 2014 13
Thrust 2: ApplicationsInteractive Schedule Reduction Model
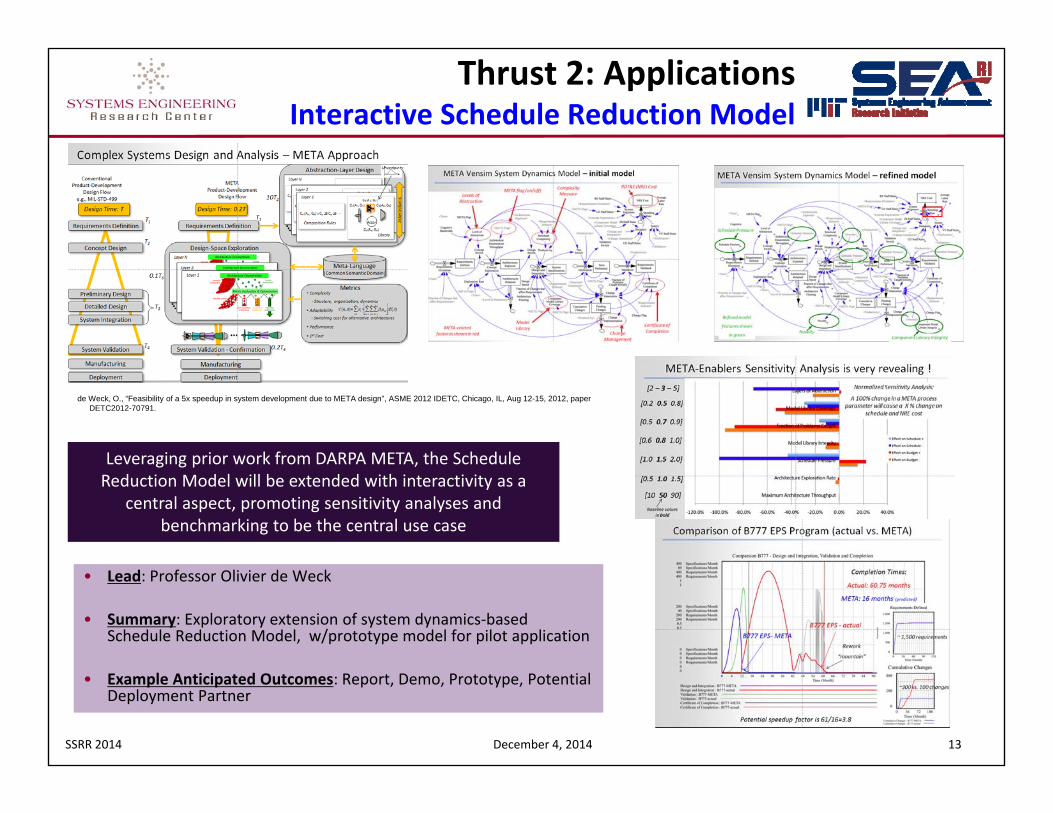
• Lead: Professor Olivier de Weck
• Summary: Exploratory extension of system dynamics‐based Schedule Reduction Model, w/prototype model for pilot application
• Example Anticipated Outcomes: Report, Demo, Prototype, Potential Deployment Partner
de Weck, O., “Feasibility of a 5x speedup in system development due to META design”, ASME 2012 IDETC, Chicago, IL, Aug 12-15, 2012, paper DETC2012-70791.
Leveraging prior work from DARPA META, the Schedule Reduction Model will be extended with interactivity as a
central aspect, promoting sensitivity analyses and benchmarking to be the central use case
SSRR 2014 December 4, 2014 14
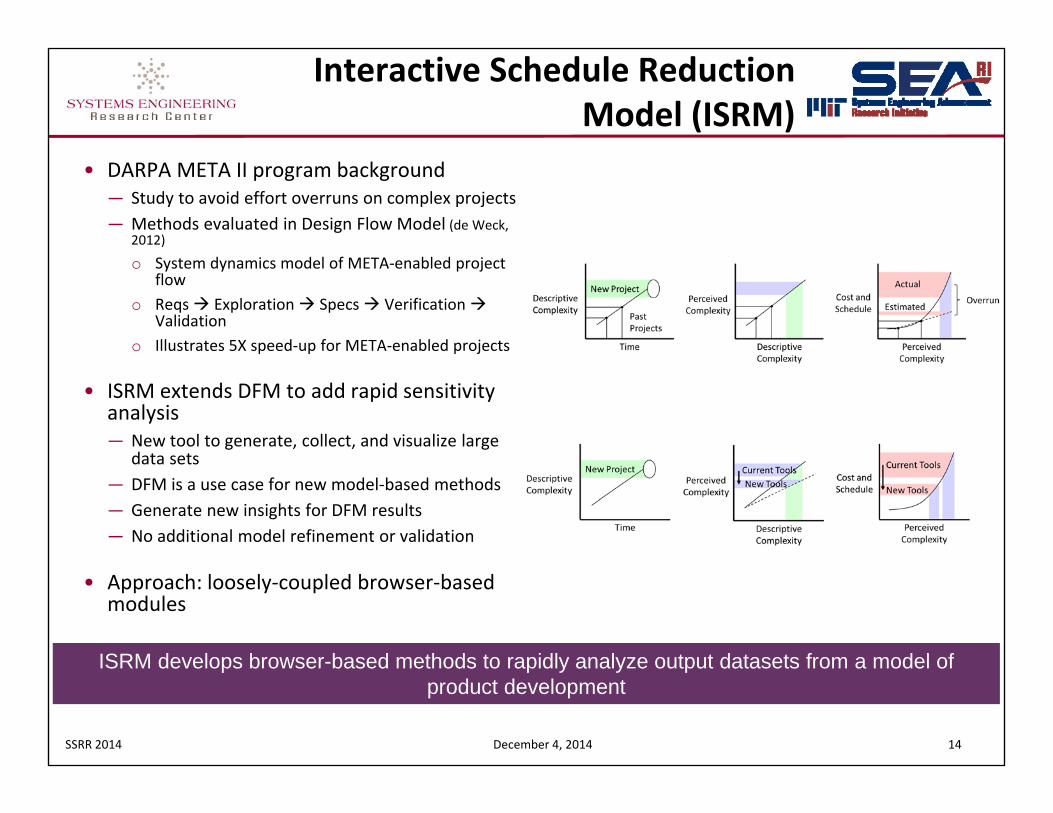
Interactive Schedule Reduction Model (ISRM)
• DARPA META II program background― Study to avoid effort overruns on complex projects― Methods evaluated in Design Flow Model (de Weck,
2012)
o System dynamics model of META‐enabled project flow
o Reqs Exploration Specs Verification Validation
o Illustrates 5X speed‐up for META‐enabled projects
• ISRM extends DFM to add rapid sensitivity analysis― New tool to generate, collect, and visualize large
data sets― DFM is a use case for new model‐based methods― Generate new insights for DFM results― No additional model refinement or validation
• Approach: loosely‐coupled browser‐based modules
ISRM develops browser-based methods to rapidly analyze output datasets from a model of product development
SSRR 2014 December 4, 2014 15
Phase 2
Back‐end
Front‐end
Phase 1
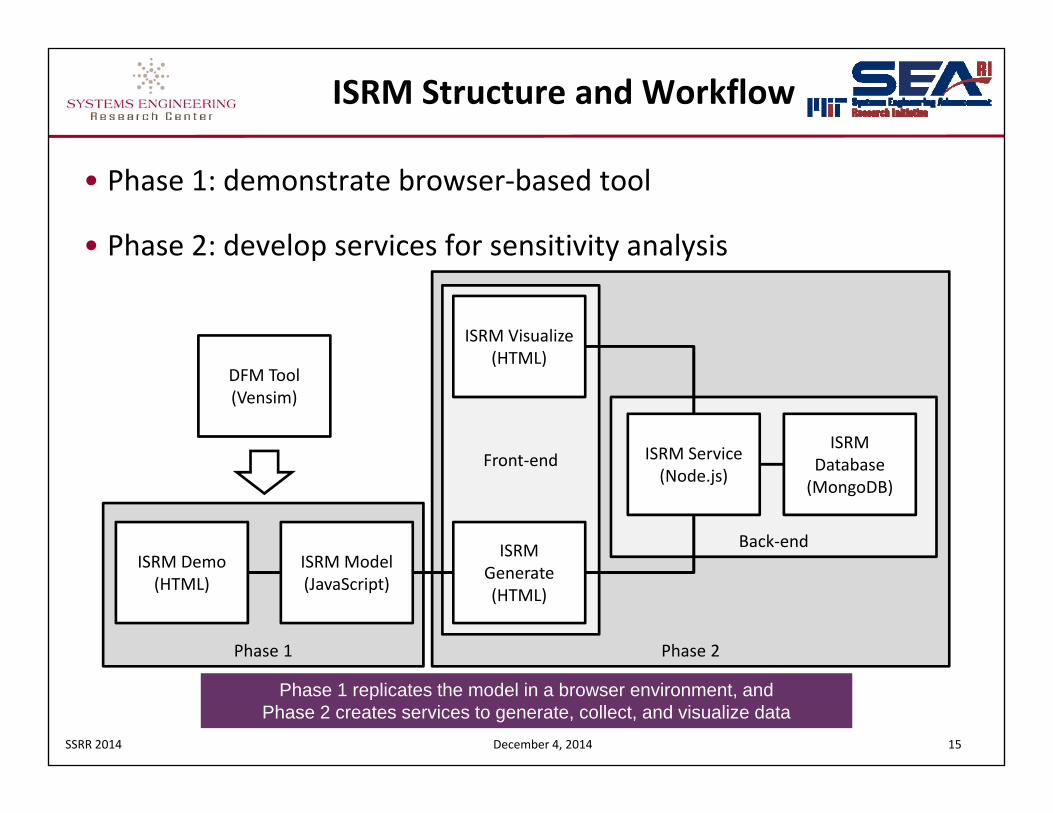
ISRM Structure and Workflow
• Phase 1: demonstrate browser‐based tool
• Phase 2: develop services for sensitivity analysis
ISRM Model (JavaScript)
ISRM Demo (HTML)
DFM Tool (Vensim)
ISRM Service (Node.js)
ISRM Database (MongoDB)
ISRM Generate (HTML)
ISRM Visualize (HTML)
Phase 1 replicates the model in a browser environment, and Phase 2 creates services to generate, collect, and visualize data
SSRR 2014 December 4, 2014 16
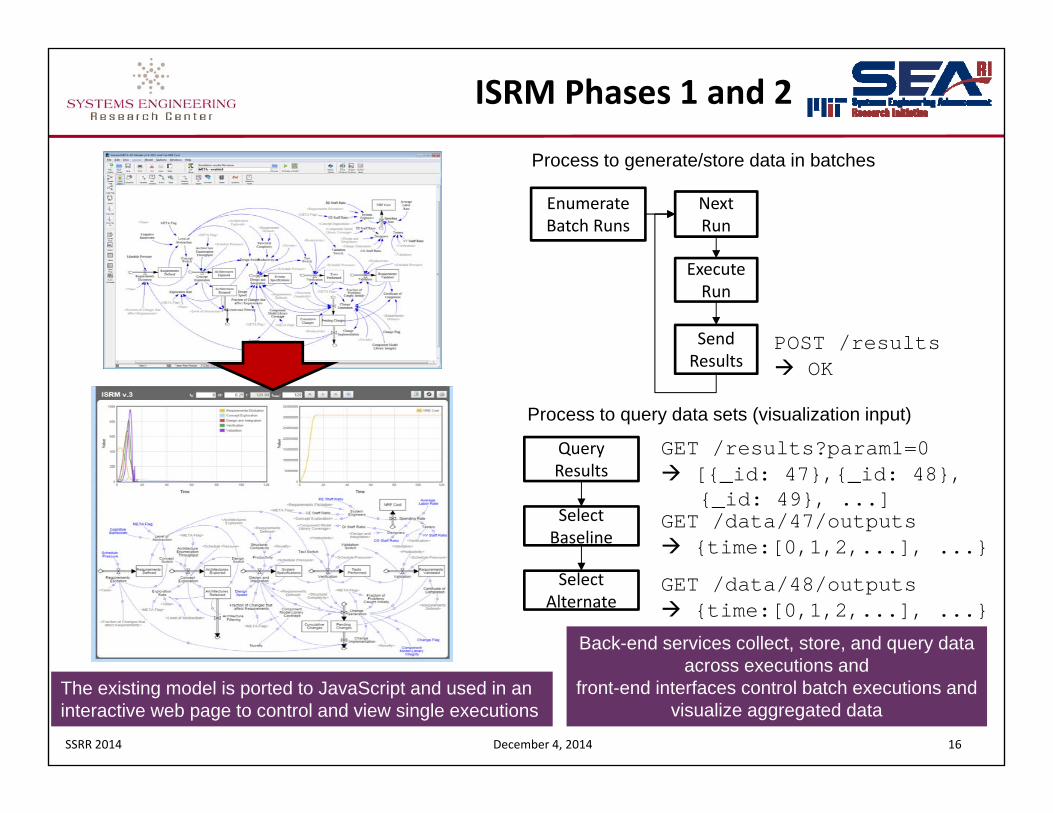
ISRM Phases 1 and 2
The existing model is ported to JavaScript and used in an interactive web page to control and view single executions
Back-end services collect, store, and query data across executions and
front-end interfaces control batch executions and visualize aggregated data
POST /results OK
Enumerate Batch Runs
Next Run
Execute Run
Send Results
Process to generate/store data in batches
GET /results?param1=0 [{_id: 47},{_id: 48},
{_id: 49}, ...]GET /data/47/outputs {time:[0,1,2,...], ...}
GET /data/48/outputs {time:[0,1,2,...], ...}
Query Results
Select Baseline
Select Alternate
Process to query data sets (visualization input)
SSRR 2014 December 4, 2014 17
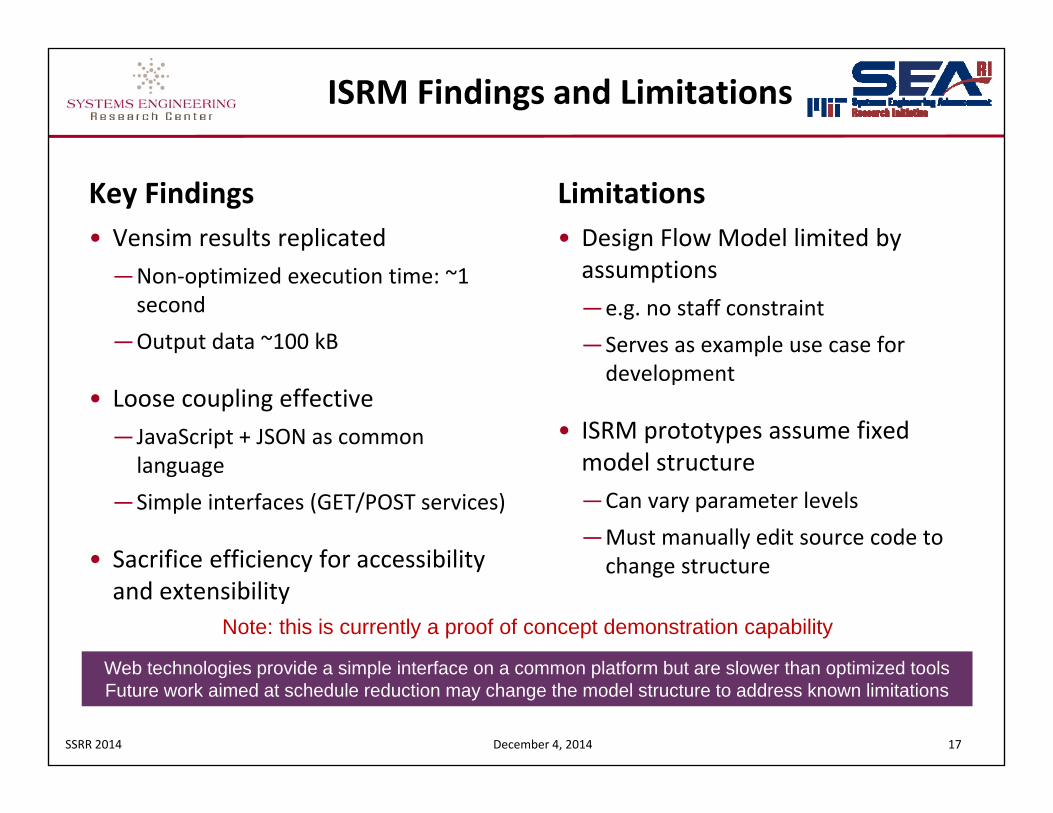
Key Findings• Vensim results replicated
―Non‐optimized execution time: ~1 second
―Output data ~100 kB
• Loose coupling effective―JavaScript + JSON as common language
―Simple interfaces (GET/POST services)
• Sacrifice efficiency for accessibility and extensibility
Limitations• Design Flow Model limited by assumptions―e.g. no staff constraint―Serves as example use case for development
• ISRM prototypes assume fixed model structure―Can vary parameter levels―Must manually edit source code to change structure
ISRM Findings and Limitations
Web technologies provide a simple interface on a common platform but are slower than optimized tools Future work aimed at schedule reduction may change the model structure to address known limitations
Note: this is currently a proof of concept demonstration capability
SSRR 2014 December 4, 2014 18
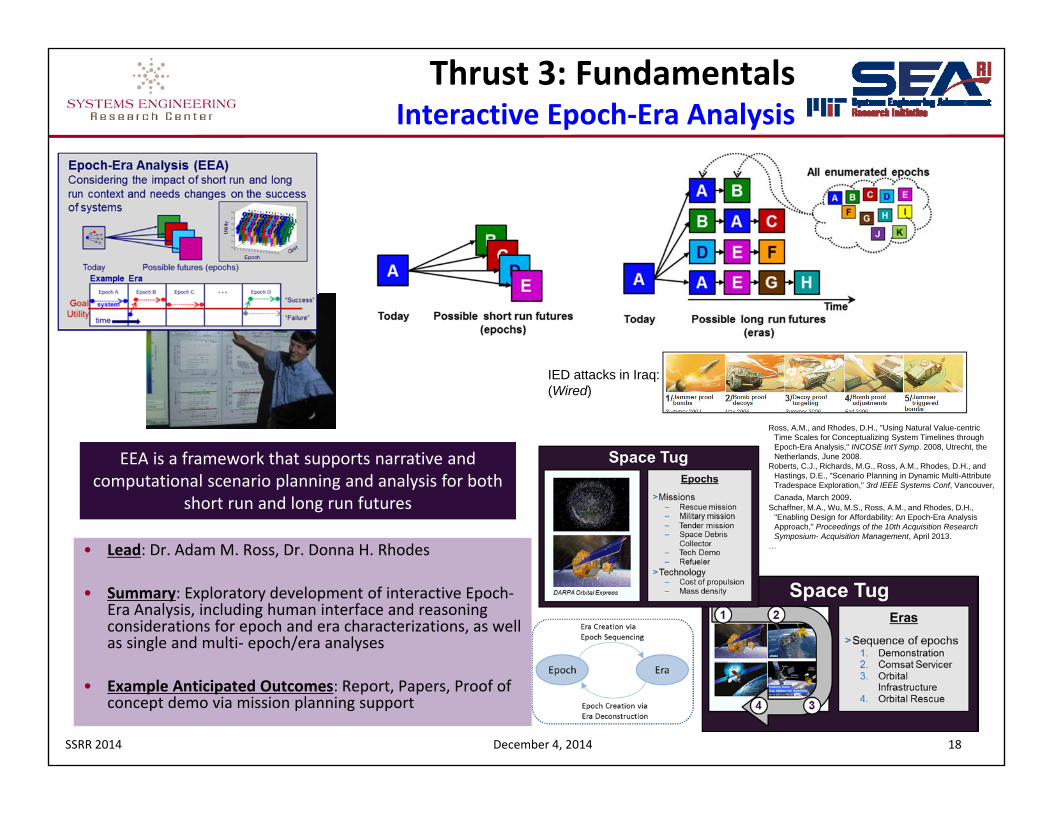
Thrust 3: FundamentalsInteractive Epoch‐Era Analysis
• Lead: Dr. Adam M. Ross, Dr. Donna H. Rhodes
• Summary: Exploratory development of interactive Epoch‐Era Analysis, including human interface and reasoning considerations for epoch and era characterizations, as well as single and multi‐ epoch/era analyses
• Example Anticipated Outcomes: Report, Papers, Proof of concept demo via mission planning support
IED attacks in Iraq: (Wired)
EEA is a framework that supports narrative and computational scenario planning and analysis for both
short run and long run futures
Ross, A.M., and Rhodes, D.H., "Using Natural Value-centric Time Scales for Conceptualizing System Timelines through Epoch-Era Analysis," INCOSE Int’l Symp. 2008, Utrecht, the Netherlands, June 2008.
Roberts, C.J., Richards, M.G., Ross, A.M., Rhodes, D.H., and Hastings, D.E., "Scenario Planning in Dynamic Multi-Attribute Tradespace Exploration," 3rd IEEE Systems Conf, Vancouver, Canada, March 2009.
Schaffner, M.A., Wu, M.S., Ross, A.M., and Rhodes, D.H., "Enabling Design for Affordability: An Epoch-Era Analysis Approach," Proceedings of the 10th Acquisition Research Symposium- Acquisition Management, April 2013.
…
SSRR 2014 December 4, 2014 19
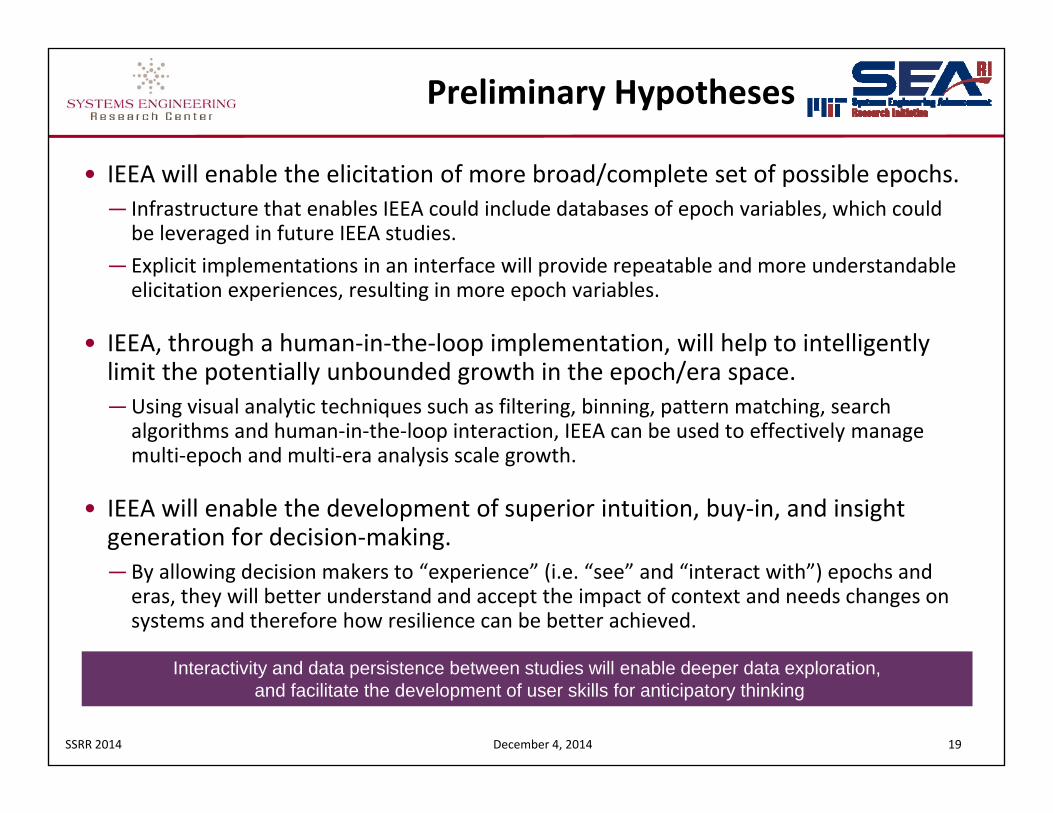
Preliminary Hypotheses
• IEEA will enable the elicitation of more broad/complete set of possible epochs.― Infrastructure that enables IEEA could include databases of epoch variables, which could
be leveraged in future IEEA studies.― Explicit implementations in an interface will provide repeatable and more understandable
elicitation experiences, resulting in more epoch variables.
• IEEA, through a human‐in‐the‐loop implementation, will help to intelligently limit the potentially unbounded growth in the epoch/era space.―Using visual analytic techniques such as filtering, binning, pattern matching, search
algorithms and human‐in‐the‐loop interaction, IEEA can be used to effectively manage multi‐epoch and multi‐era analysis scale growth.
• IEEA will enable the development of superior intuition, buy‐in, and insight generation for decision‐making.―By allowing decision makers to “experience” (i.e. “see” and “interact with”) epochs and
eras, they will better understand and accept the impact of context and needs changes on systems and therefore how resilience can be better achieved.
Interactivity and data persistence between studies will enable deeper data exploration,and facilitate the development of user skills for anticipatory thinking
SSRR 2014 December 4, 2014 20
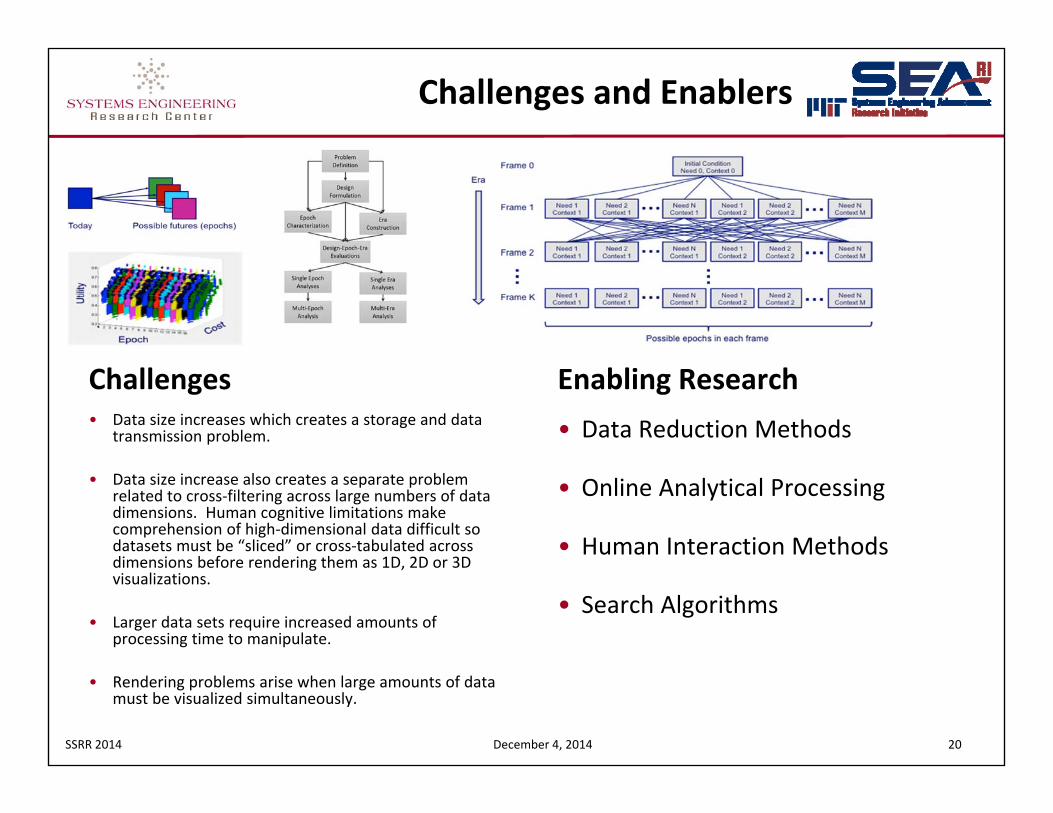
Challenges• Data size increases which creates a storage and data
transmission problem.
• Data size increase also creates a separate problem related to cross‐filtering across large numbers of data dimensions. Human cognitive limitations make comprehension of high‐dimensional data difficult so datasets must be “sliced” or cross‐tabulated across dimensions before rendering them as 1D, 2D or 3D visualizations.
• Larger data sets require increased amounts of processing time to manipulate.
• Rendering problems arise when large amounts of data must be visualized simultaneously.
Enabling Research• Data Reduction Methods
• Online Analytical Processing
• Human Interaction Methods
• Search Algorithms
Challenges and Enablers
SSRR 2014 December 4, 2014 21
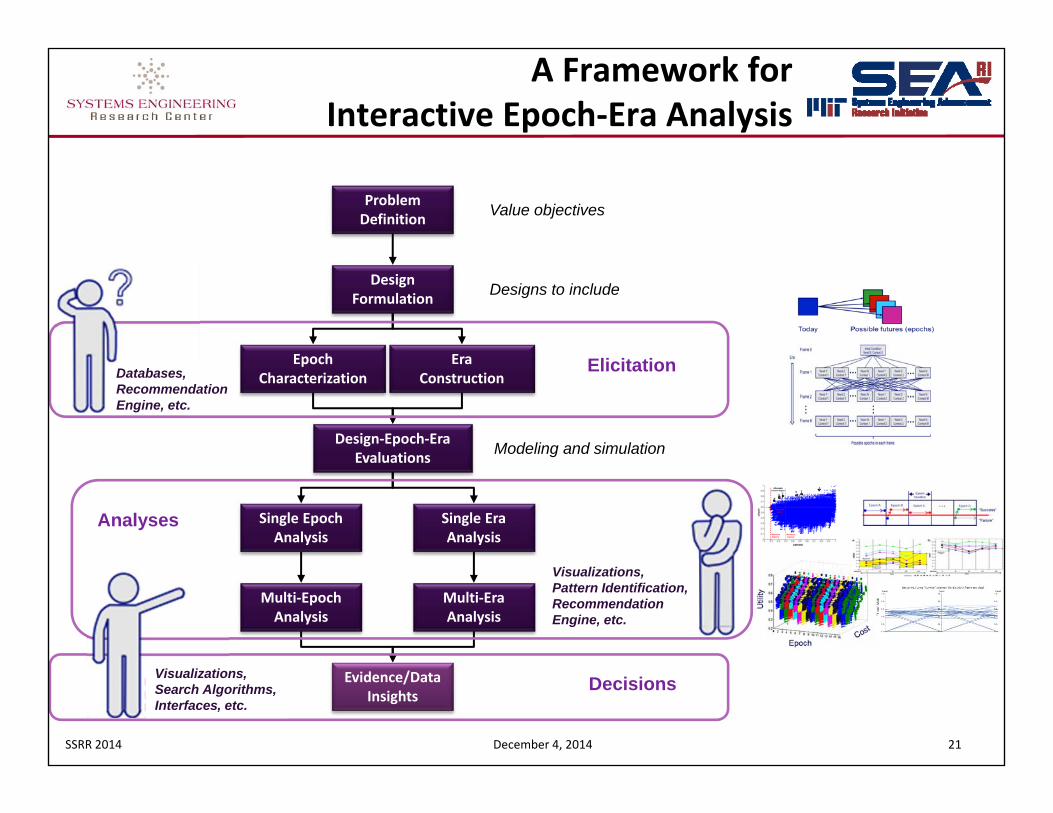
A Framework for Interactive Epoch‐Era Analysis
Visualizations,Pattern Identification,RecommendationEngine, etc.
ProblemDefinition
DesignFormulation
EpochCharacterization
EraConstruction
Design‐Epoch‐EraEvaluations
Single EpochAnalysis
Single EraAnalysis
Multi‐EpochAnalysis
Multi‐EraAnalysis
Evidence/DataInsights
Databases,RecommendationEngine, etc.
Visualizations,Search Algorithms,Interfaces, etc.
Elicitation
Analyses
Decisions
Designs to include
Value objectives
Modeling and simulation
SSRR 2014 December 4, 2014 22
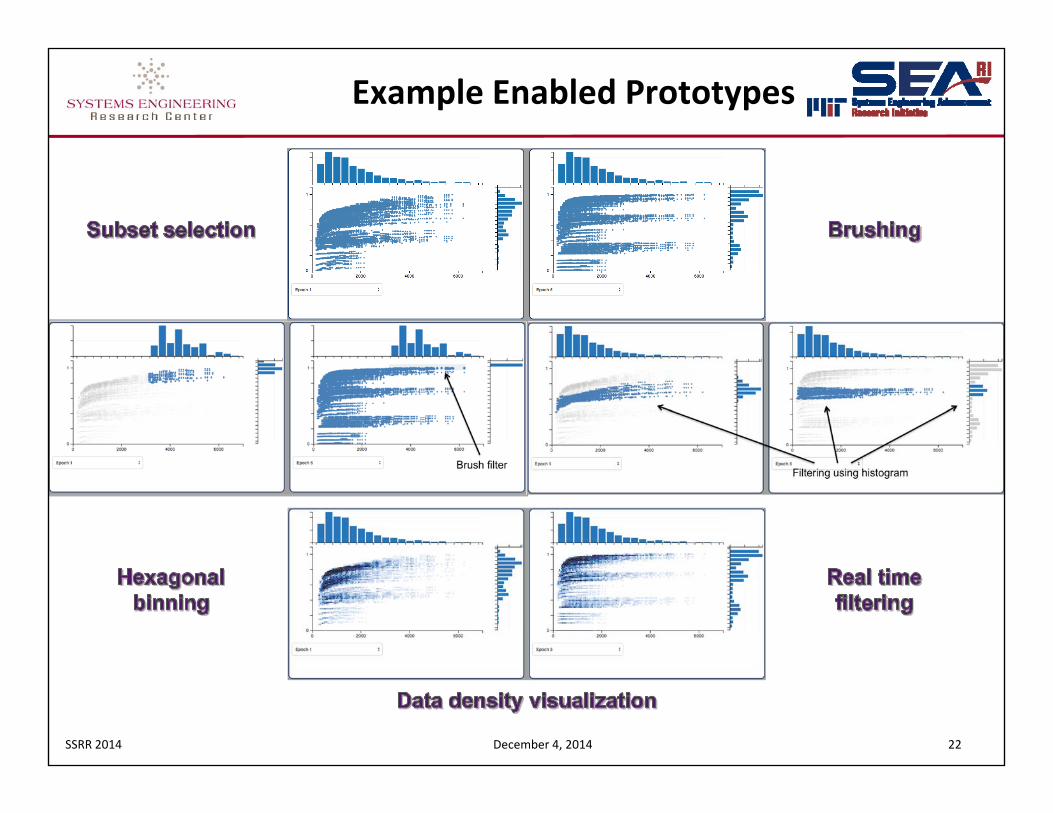
Example Enabled Prototypes
SSRR 2014 December 4, 2014 23
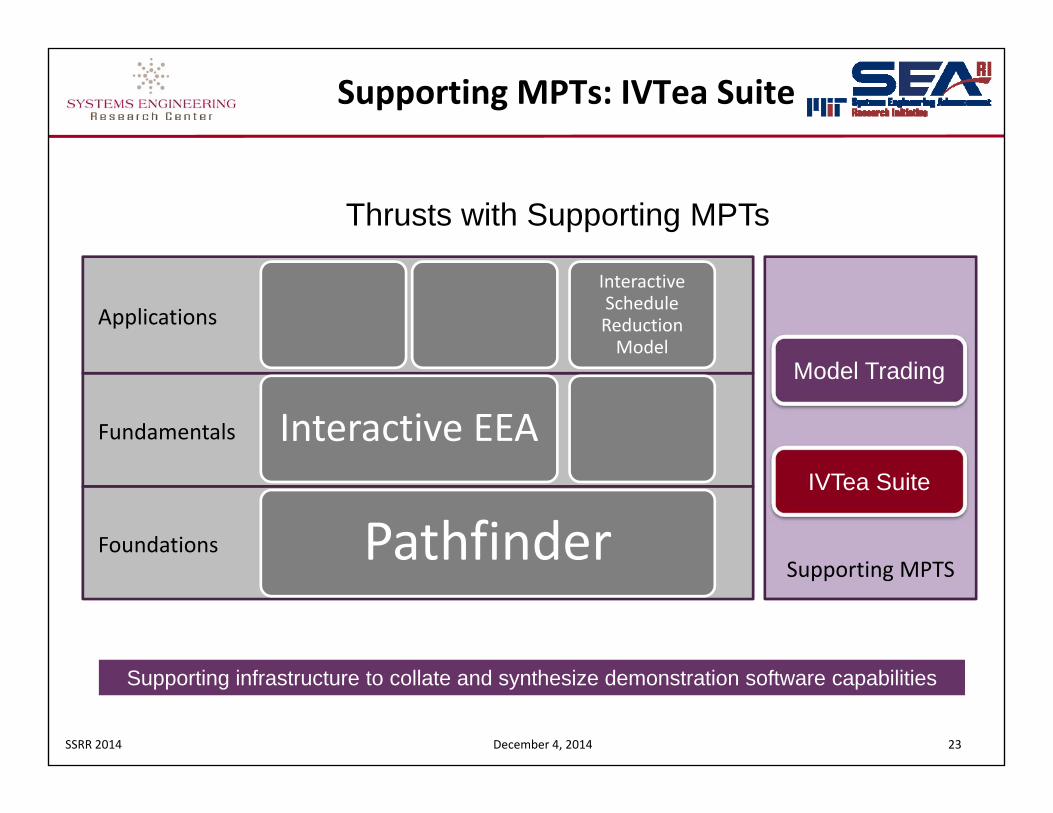
Supporting MPTs: IVTea Suite
Supporting MPTSPathfinder
Interactive EEA
Interactive Schedule Reduction Model
Applications
Fundamentals
Foundations
Model Trading
IVTea Suite
Supporting infrastructure to collate and synthesize demonstration software capabilities
Thrusts with Supporting MPTs
SSRR 2014 December 4, 2014 24
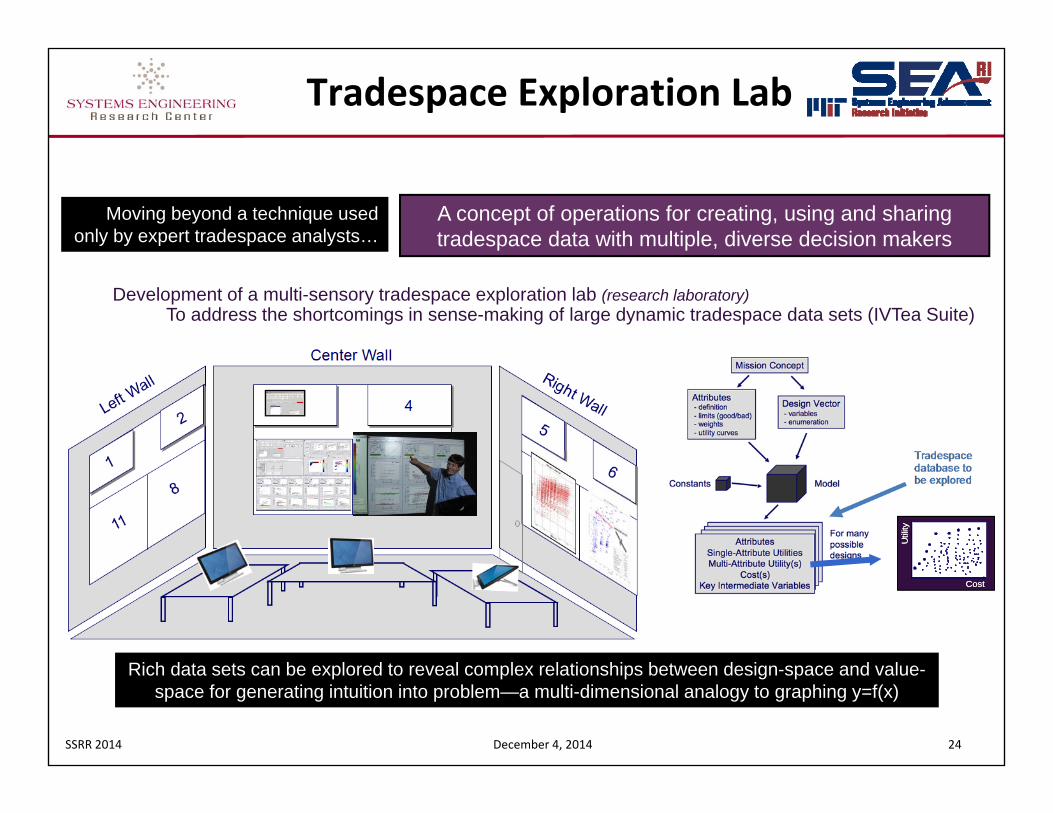
Tradespace Exploration Lab
Development of a multi-sensory tradespace exploration lab (research laboratory)To address the shortcomings in sense-making of large dynamic tradespace data sets (IVTea Suite)
A concept of operations for creating, using and sharing tradespace data with multiple, diverse decision makers
Moving beyond a technique used only by expert tradespace analysts…
Cost
Util
ity
Cost
Util
ity
Rich data sets can be explored to reveal complex relationships between design-space and value-space for generating intuition into problem—a multi-dimensional analogy to graphing y=f(x)
SSRR 2014 December 4, 2014 25
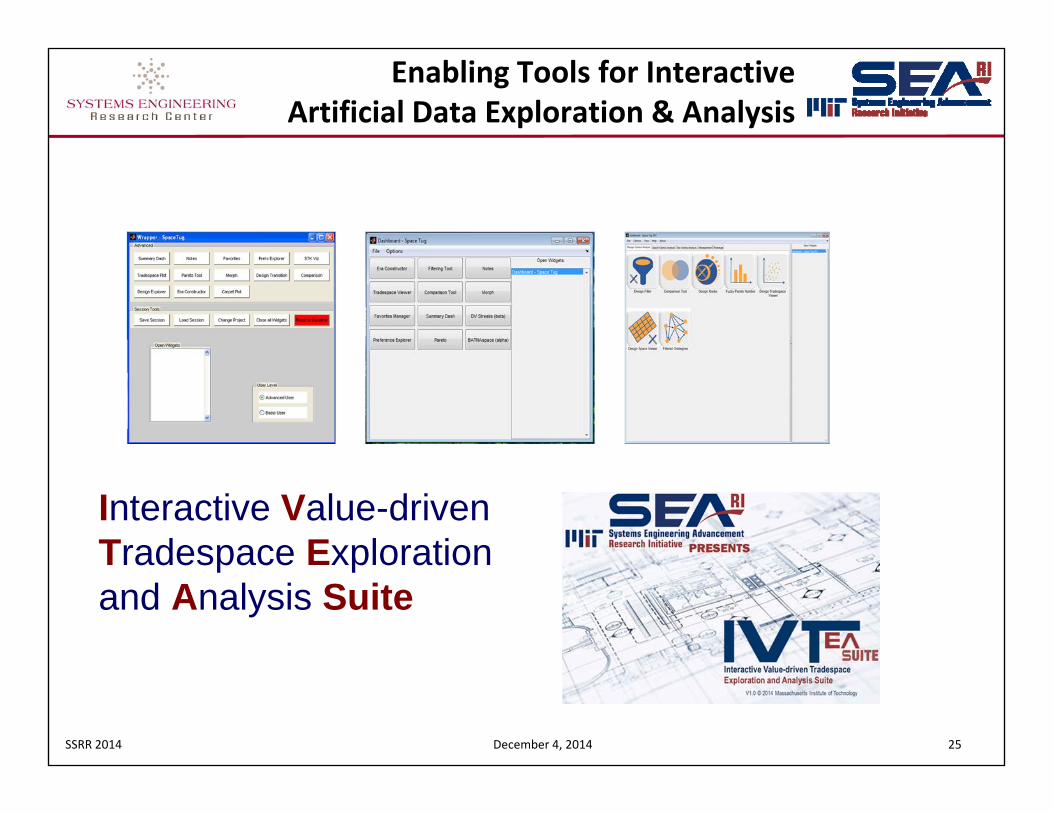
Enabling Tools for Interactive Artificial Data Exploration & Analysis
Interactive Value-driven Tradespace Exploration and Analysis Suite
SSRR 2014 December 4, 2014 26
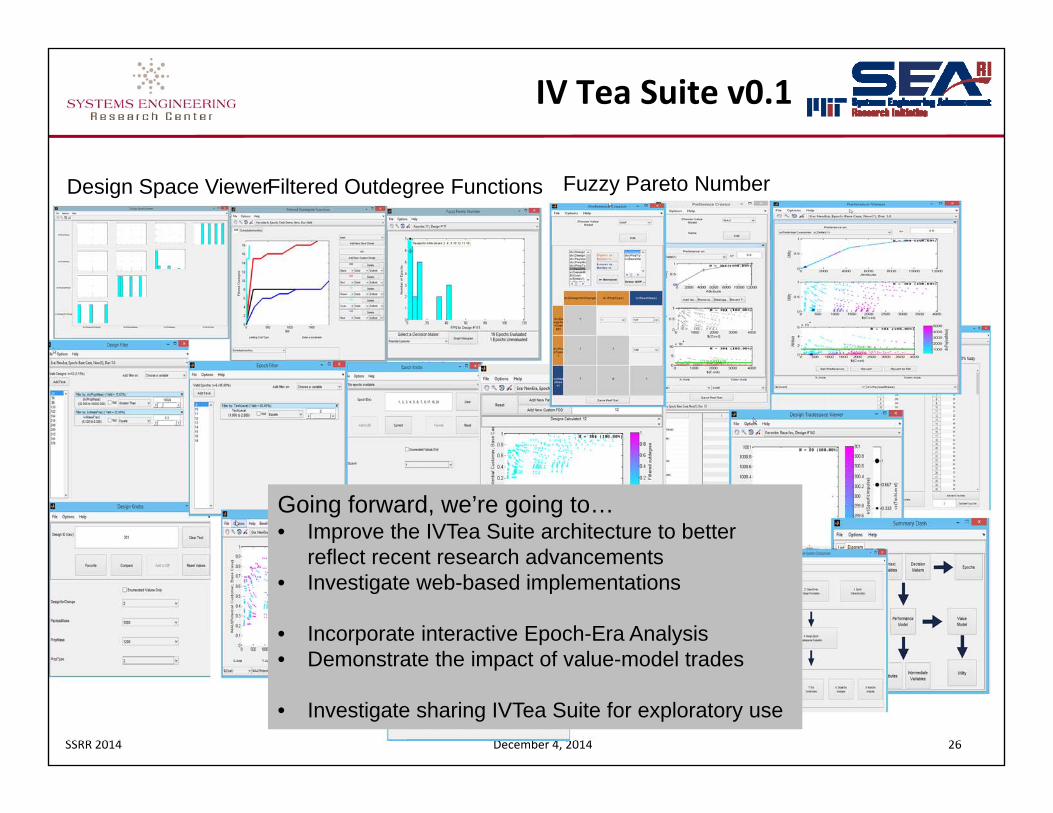
IV Tea Suite v0.1
Design Space ViewerFiltered Outdegree Functions Fuzzy Pareto Number
Going forward, we’re going to…• Improve the IVTea Suite architecture to better
reflect recent research advancements• Investigate web-based implementations
• Incorporate interactive Epoch-Era Analysis• Demonstrate the impact of value-model trades
• Investigate sharing IVTea Suite for exploratory use
SSRR 2014 December 4, 2014 27
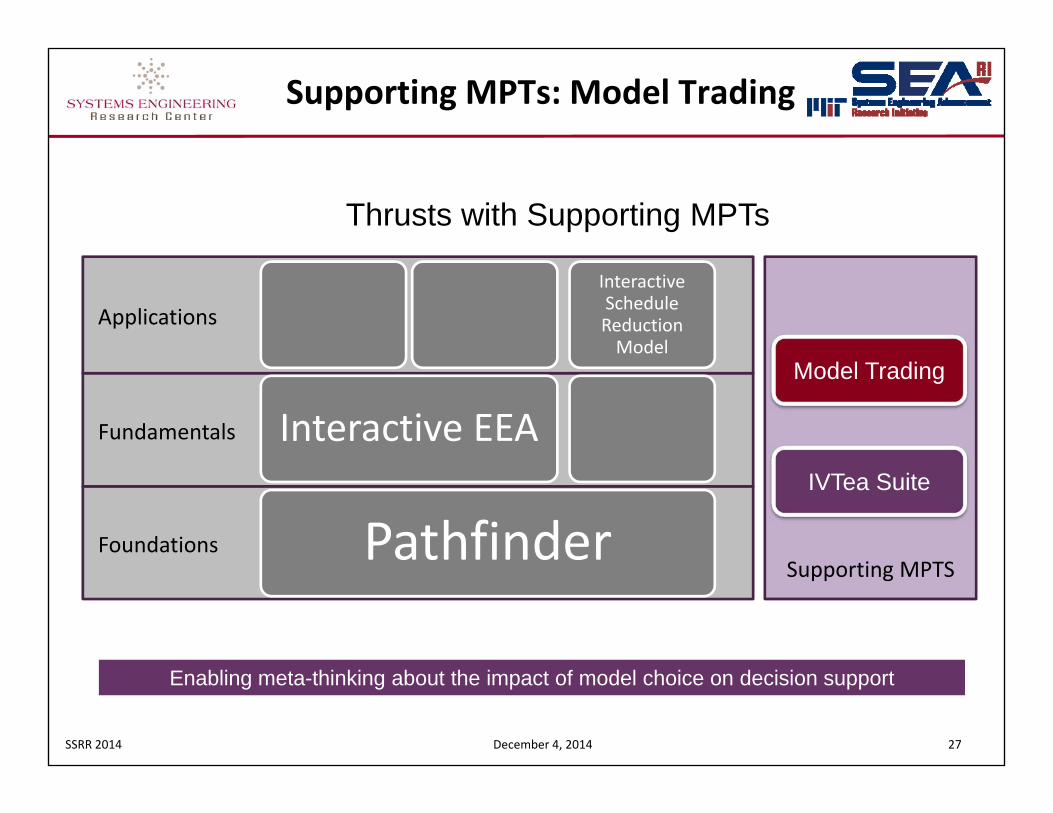
Supporting MPTs: Model Trading
Supporting MPTSPathfinder
Interactive EEA
Interactive Schedule Reduction Model
Applications
Fundamentals
Foundations
Model Trading
IVTea Suite
Enabling meta-thinking about the impact of model choice on decision support
Thrusts with Supporting MPTs
SSRR 2014 December 4, 2014 28
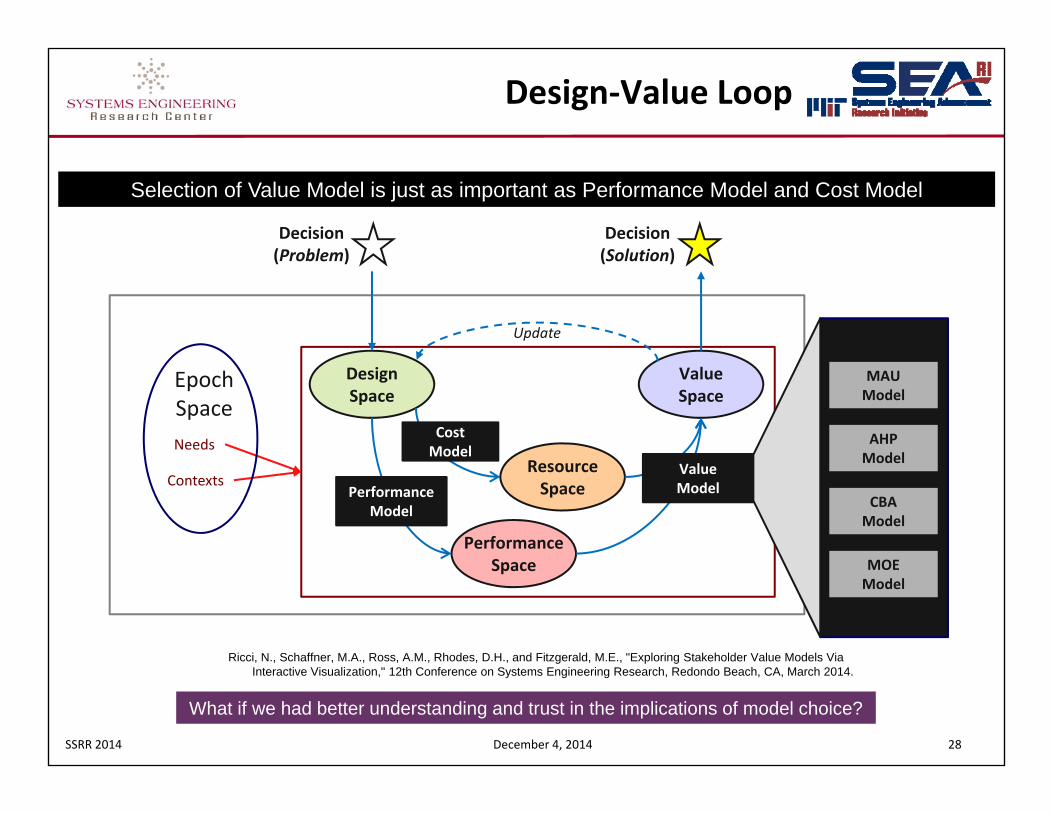
Design‐Value Loop
Ricci, N., Schaffner, M.A., Ross, A.M., Rhodes, D.H., and Fitzgerald, M.E., "Exploring Stakeholder Value Models Via Interactive Visualization," 12th Conference on Systems Engineering Research, Redondo Beach, CA, March 2014.
Selection of Value Model is just as important as Performance Model and Cost Model
What if we had better understanding and trust in the implications of model choice?
DesignSpace
PerformanceSpace
ValueSpace
Decision (Problem)
Decision (Solution)
PerformanceModel
Needs
Contexts
Update
CostModel
ResourceSpace
ValueModel
Epoch Space
MAUModel
CBAModel
AHPModel
MOEModel
SSRR 2014 December 4, 2014 29
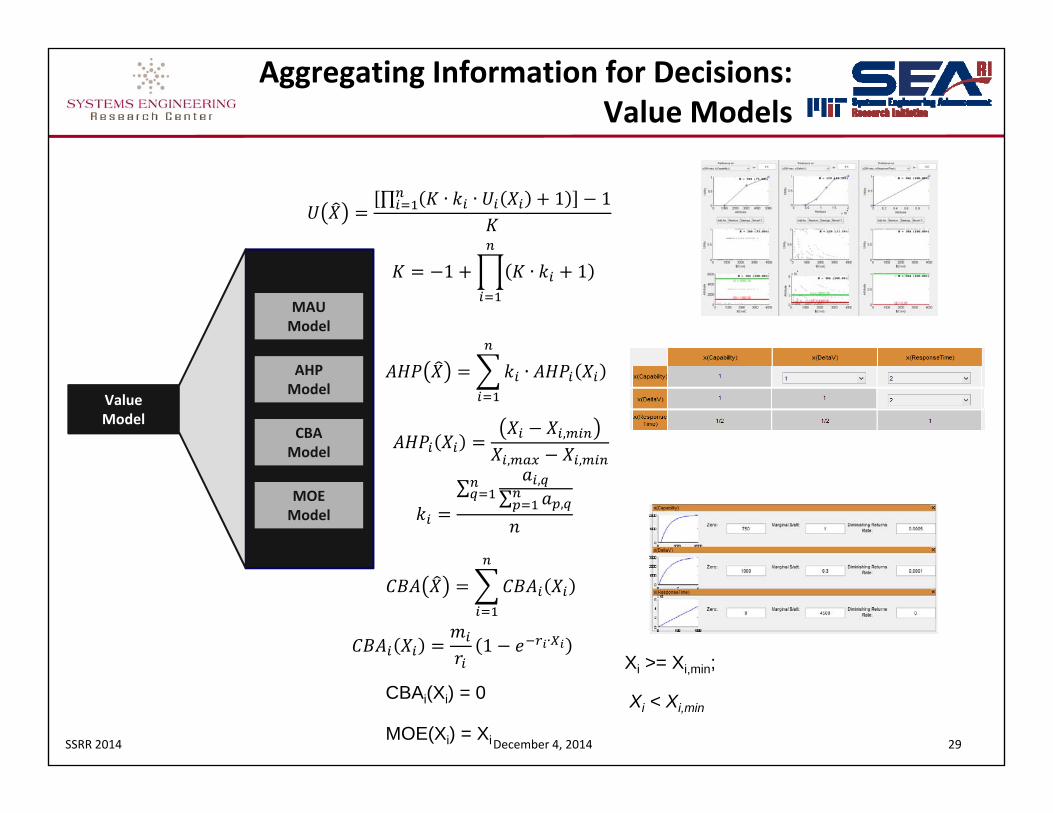
Aggregating Information for Decisions: Value Models
ValueModel
MAUModel
CBAModel
AHPModel
MOEModel
∏ ∙ ∙ 1 1
1 ∙ 1
∙
,
, ,
∑ ,∑ ,
1 ∙
Xi >= Xi,min; CBAi(Xi) = 0 Xi < Xi,min
MOE(Xi) = Xi
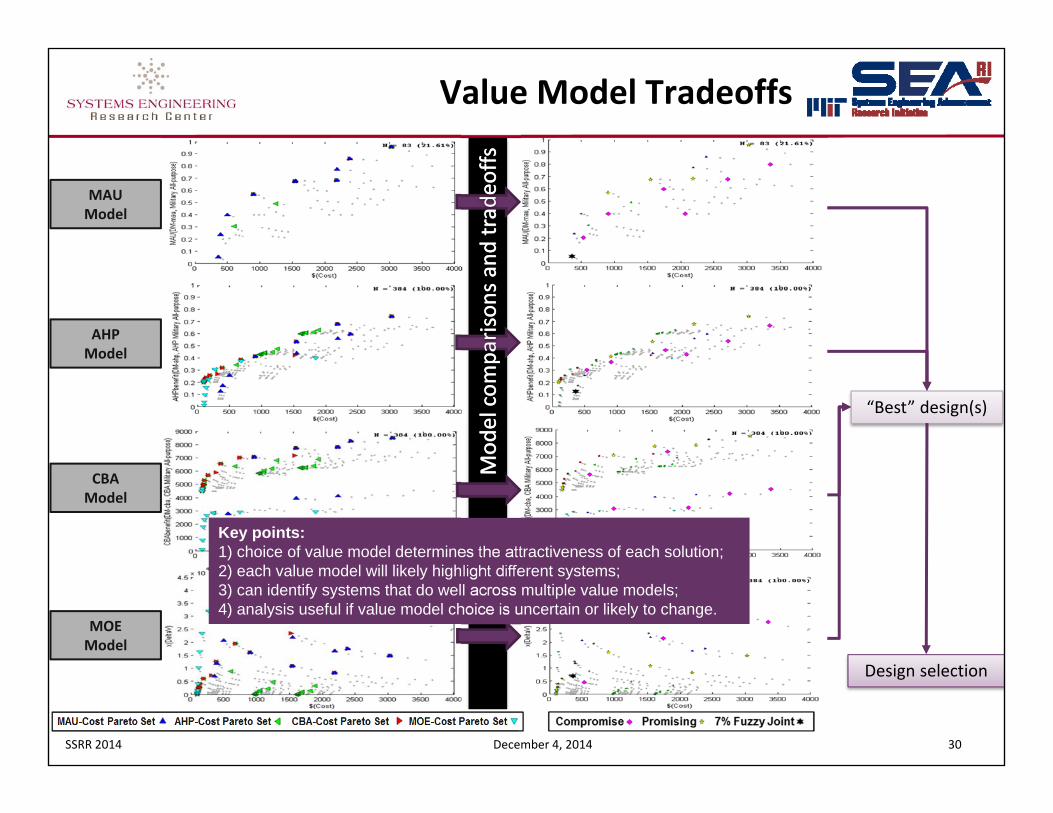
SSRR 2014 December 4, 2014 30
Mod
el com
parison
s and
tradeo
ffs
Value Model Tradeoffs
MAUModel
CBAModel
AHPModel
MOEModel
Design selection
“Best” design(s)
Key points: 1) choice of value model determines the attractiveness of each solution; 2) each value model will likely highlight different systems; 3) can identify systems that do well across multiple value models; 4) analysis useful if value model choice is uncertain or likely to change.
Mod
el com
parison
s and
tradeo
ffs
SSRR 2014 December 4, 2014 31
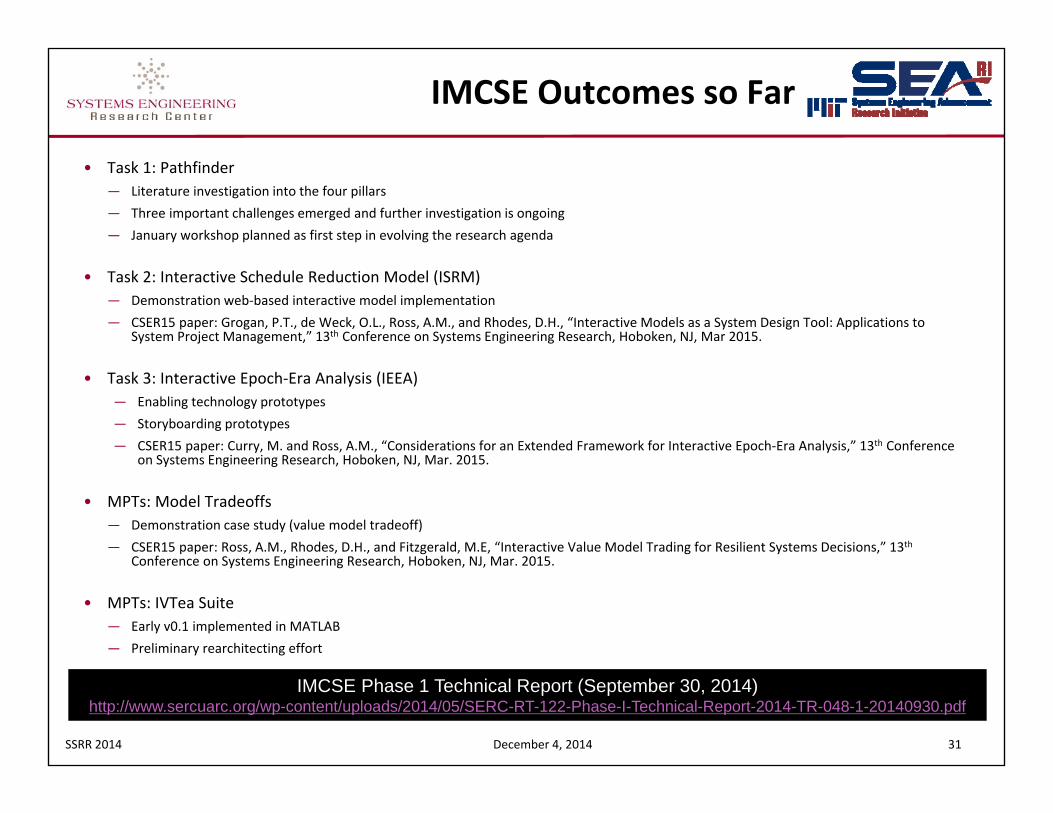
IMCSE Outcomes so Far
• Task 1: Pathfinder― Literature investigation into the four pillars― Three important challenges emerged and further investigation is ongoing― January workshop planned as first step in evolving the research agenda
• Task 2: Interactive Schedule Reduction Model (ISRM)― Demonstration web‐based interactive model implementation― CSER15 paper: Grogan, P.T., de Weck, O.L., Ross, A.M., and Rhodes, D.H., “Interactive Models as a System Design Tool: Applications to
System Project Management,” 13th Conference on Systems Engineering Research, Hoboken, NJ, Mar 2015.
• Task 3: Interactive Epoch‐Era Analysis (IEEA)― Enabling technology prototypes― Storyboarding prototypes― CSER15 paper: Curry, M. and Ross, A.M., “Considerations for an Extended Framework for Interactive Epoch‐Era Analysis,” 13th Conference
on Systems Engineering Research, Hoboken, NJ, Mar. 2015.
• MPTs: Model Tradeoffs― Demonstration case study (value model tradeoff)― CSER15 paper: Ross, A.M., Rhodes, D.H., and Fitzgerald, M.E, “Interactive Value Model Trading for Resilient Systems Decisions,” 13th
Conference on Systems Engineering Research, Hoboken, NJ, Mar. 2015.
• MPTs: IVTea Suite― Early v0.1 implemented in MATLAB― Preliminary rearchitecting effort
IMCSE Phase 1 Technical Report (September 30, 2014)http://www.sercuarc.org/wp-content/uploads/2014/05/SERC-RT-122-Phase-I-Technical-Report-2014-TR-048-1-20140930.pdf
SSRR 2014 December 4, 2014 32
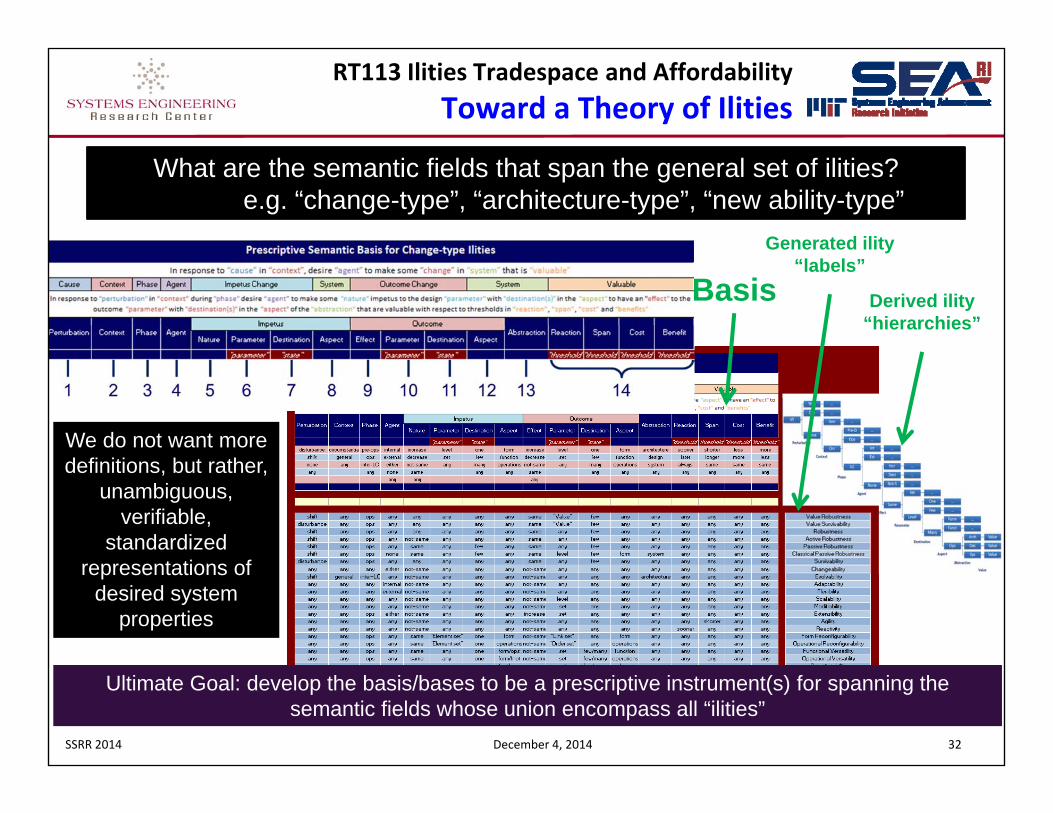
RT113 Ilities Tradespace and AffordabilityToward a Theory of Ilities
What are the semantic fields that span the general set of ilities?e.g. “change-type”, “architecture-type”, “new ability-type”
Ultimate Goal: develop the basis/bases to be a prescriptive instrument(s) for spanning the semantic fields whose union encompass all “ilities”
We do not want more definitions, but rather,
unambiguous, verifiable,
standardized representations of
desired system properties
BasisGenerated ility
“labels”
Derived ility “hierarchies”
SSRR 2014 December 4, 2014 33
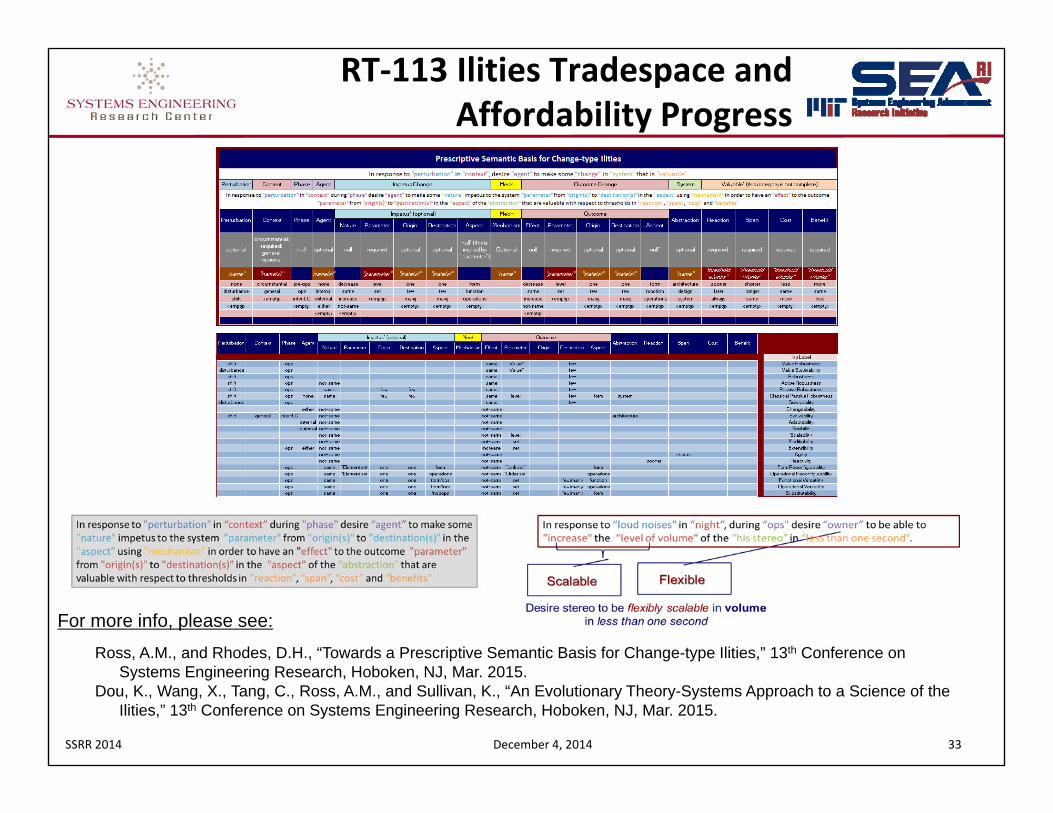
RT‐113 Ilities Tradespace and Affordability Progress
Ross, A.M., and Rhodes, D.H., “Towards a Prescriptive Semantic Basis for Change-type Ilities,” 13th Conference on Systems Engineering Research, Hoboken, NJ, Mar. 2015.
Dou, K., Wang, X., Tang, C., Ross, A.M., and Sullivan, K., “An Evolutionary Theory-Systems Approach to a Science of the Ilities,” 13th Conference on Systems Engineering Research, Hoboken, NJ, Mar. 2015.
For more info, please see: