interactive brokers research package...2015/06/01 · potential breakouts. (breakouts of pullback...
TRANSCRIPT

Interactive Brokers Research Package
About Our Reports:
Waverly Advisors produces two weekly (Monday) reports, The Tactical Playbook and Tactical Portfolio Outlook that are available on IB. The Tactical Playbook also has short daily updates Tuesday-Friday.
While many clients will naturally fit with one report or the other, to provide maximum value to our IB clients, we provide BOTH reports in a single document, the “In-teractive Brokers Research Package”, on the IB platform.
▶ Tactical Playbook: For the active trader on the daily/weekly timeframes. Full report Monday’s, short updates Tuesday – Friday.
▶ Tactical Portfolio Outlook: For the longer-term manager or investor (Monday report only.)
Please contact us for questions and more information on our research and using our work at [email protected] or 607.684.5300.
Contents
Tactical Playbook 2Tactical Portfolio Outlook 27

©2015 Waverly Advisors, LLC. All Rights Reserved. Please review disclosures on the final page of this report.
Market context and trade ideas for the active trader
Waverly Advisors, LLC
Adam GrimesChief Investment [email protected]@waverlyadvisors.com
Contact Sales: (607) [email protected]
Tactical PlaybookWeek of 1 June 2015
Contents
Market Insight 3U.S. Equities 4Equity Indexes: Short-Term 6U.S. Individual Stocks 7Global Stocks 9Rates & FX 10Commodities 11Discretionary Trade Ideas 12Equity Trading Model 13Futures Pullback System 15Futures Channel System 16Relative Strength Rankings 17Screens: Big Movers 18Screens: In Play 19Screens: Consecutive Closes 20Screens: Extension 21Screens: Consolidating 22Screens: RS Strong 23Disclaimers & Contact 25
Market Return Vol-adj Kpos Trend VolatilityUSA (0.88%) (0.6σ) 61 Normal BullEurope (2.22%) (1.2σ) 55 Normal Bull/NeutralAsia (2.03%) (1.2σ) 60 Normal Bull/NeutralDeveloped (2.05%) (1.3σ) 60 Volatile Bull/NeutralEmerging (3.79%) (1.5σ) 42 Normal Bull/Neutral30 Yr Tr 1.79% 1.0σ 34 Volatile Bear/NeutralEuro (0.22%) (0.1σ) 33 Normal Bear/NeutralYen 2.11% 2.4σ 102 Normal BullGold (1.25%) (0.5σ) 42 Quiet Bear/NeutralCrude 0.97% 0.2σ 54 Normal Bear/Neutral
Last Week’s Performance
MarketShort term (< 1 month)
Int. Term (2-12 months)
US stocks Up Up (Lead)Europe Stocks UpAsia Stocks UpUS Rates Flat Flat/downUS Treasuries DownUS Dollar Up UpGold Down DownOil Bottoming?
Major Market Direction and Bias
▶ Stocks consolidate with no clear short-term direction.
– Longer-term bull market is clear and intact. Any concerns over direction are only relevant to shorter timeframes.
– Longer-term investors should focus on holding heavy long exposure to stocks.
▶ For portfolio allocators, we are moving to an underweight in Industrials this week. Tactical traders can look for potential shorts in the sector.
▶ The US Dollar continues to point higher. Watch resolution of daily bull flags for insight into Dollar strength and psychol-ogy.
▶ Expect another selloff in bond futures, but do not assume that this means a change in longer-term trend.
▶ Market conditions could become even more difficult, as volume and volatility traditionally contract over the next few months. Tactical traders must carefully pick entries and focus on trade management.
▶ Crude oil is probably putting in a longer-term bottom, but remember that a bottom is a process—formation of the bottom can take many months and can see much further declines in oil before that bottom is established.
▶ A number of other commodities (grains, sugar, copper) point lower over the coming weeks.

Tactical Playbook, Week of 1 June 2015
3©2015 Waverly Advisors, LLC. All Rights Reserved. Please review disclosures on the final page of this report.
Market Insight
Friday’s trading marked the end of the month. Many traders use ends of periods (months, quarters, years) to evaluate performance, and as a psychological road marker. Let’s take a few moments today to look back at the year in review and to consider the “end of period”(especially quarter and year) effect as it relates to stocks.
Year in reviewIt is no secret that this has been a challenging and difficult market for many traders. We have seen relatively directionless environments in many assets, but it also may be surprising to realize that stocks have held on to some minor, but possibly significant gains. The S&P 500 is up 2.4% to the end of May—not terrible underperformance of the long-term average (which comes in somewhere around 7.5%), and the Russell 2000 is leading with about 3.5% gain for the year. Europe is up nearly 6% (USD-ba-sis). These are small, but solid gains for stocks in a period of conflict, growth con-cerns, and structural consolidation.
The US Dollar index is up about 7.5% from the end of last year, after advancing to a peak gain of about 11%. We see every sign that points to continued Dollar strength through the end of the year. Expect that USD strength could put a weight on many commodities: grains are down roughly 9%, while gold and crude are roughly flat for the year.
Expect contraction in both volatility and volume through the summer months; this is simply typical market behavior and it has been so for most years of the past three decades. However, low liquidity conditions do bring the possibility of a vol-atile spike, and markets do not like surprises. This is why it is important to clarify your timeframe and trading style: longer-term investors will need to ignore summer noise, knowing that the day to day swings may, at times, be very boring or very vol-atile, and more active traders need to be prepared to respond with flexibility. Two factors could lead to a better swing trading environment, and these demand atten-tion over the coming weeks: watch for a breakout in stocks, and for a continuation of the US Dollar’s rally.
End of quarter (or year) effectMany investors and authors talk about an end of the quarter or end of the year effect.
The assumption is that funds generally rebalance on a predictable schedule: perhaps they sell underperforming assets or buy more assets that show strong returns. (Per-haps they also book partial profits, reducing exposures on winners that have grown too large due to price appreciation.) There are many investment plans built around this concept, but there is one problem: there is not a shred of evidence that it works.
It should be relatively easy to tease out the end of the quarter effect, if it exists. It should be visible as an increase in volume (it is not), and probably as an influence of the relative performance of leading and trailing assets and individual stocks (it is not). Despite a lack of statistical support, it is a good story—it is easy to understand why it should be so and why it might work. Furthermore, people (individually and in the aggregate) do think of the year as divided into regular periods, so many peo-ple continue to focus attention on this idea.
There are two points that bear further consideration. Some research suggests that there is an impact in strongly declining markets, that it appears funds and investors “rebalance” by selling more of underperformers into the end of the quarter. This is visible as a small, but persistent edge of further underperformance in declining stocks near the quarters’ end. Perhaps the most valuable lesson is to guard against this tendency ourselves, and perhaps even to trade against it. Second, the January effect is sometimes offered as an example of rebalancing, This may be true, but the January effect is complicated—it is not clear in all slices of the data, appears to be weakening over time, and is largely (or completely) explainable as a result of size effect. At the very least, it is difficult to exploit in any investment program.
Avoid attaching too much significance to end of quarter performance. The message of the market and market structure is more important than artificial time divisions. Focus on the coming opportunities, and on managing the risk in potentially thin summer markets.

Tactical Playbook, Week of 1 June 2015
4©2015 Waverly Advisors, LLC. All Rights Reserved. Please review disclosures on the final page of this report.
U.S. Equities ▶ The market continues to consolidate with no clear short-term direction.
▶ Many market participants are probably seeing technical patterns that are bullish, and this brings the risk of a one-sided trade. A sharp flush, effectively shaking the weak hand longs out of the market, could be constructive.
▶ Do not buy the first breakdown, though there will likely be spots to buy stocks for swing trades on the second decline. This is a market that demands patience and some finesse.
▶ We still look to the US for longer-term leadership; the longer-term bull mar-ket is solid and intact.

Tactical Playbook, Week of 1 June 2015
5©2015 Waverly Advisors, LLC. All Rights Reserved. Please review disclosures on the final page of this report.
U.S. Equities (continued)
Sector Assessment Weight LastChg RelPerfEnergy Market 9/12/14 -Industrials Under 5/29/15 0.0%Technology Lead Over 9/12/14 1.8%Materials Down Under 10/31/14 -0.1%Discret'nary Over 1/2/15 3.9%Financials Turning? Market 10/31/14 -Staples Market 10/10/14 -Hcare Lead Over 7/27/12 40.7%Utilities Lag Market 10/10/14 -
U.S. Large Cap Sector Weighting

Tactical Playbook, Week of 1 June 2015
6©2015 Waverly Advisors, LLC. All Rights Reserved. Please review disclosures on the final page of this report.
Equity Indexes: Short-Term ▶ Overall context is a broad consolidation, with volatility contraction visible
on intraday charts as a triangle.
▶ Within this area (and expect wide, “messy” definitions of the confines of the pattern—not precise levels), expect failures and sharp spikes that are quickly reversed.
▶ Do not fade a breakout from this area, either up or down. Intraday, a break would probably look like a sharp thrust (perhaps on the open) that is able to consolidate without a significant pullback. This action likely sets up addi-tional trend legs in the direction of that break.
▶ Longer-term direction points up, but be prepared to trade against this bias if dictated by the market.
Market ATR 20 Avg Gap% GapsS&P 500 18.65 6.46 11.1%R2K 15.39 3.94 8.3%MiniDow 154 56 13.3%Nasdaq 52.13 14.50 10.0%
Gap & Risk Analysis

Tactical Playbook, Week of 1 June 2015
7©2015 Waverly Advisors, LLC. All Rights Reserved. Please review disclosures on the final page of this report.
U.S. Individual Stocks ▶ Broad market still appears to be setting up an upside break, but a large con-
solidation area introduces uncertainly.
▶ We would approach this week with equal bias to long and short positions, but being prepared to cut losses on one group if the market picks a clear di-rection. Again, the direction appears to be up, but there is the possibility of a sharp, downward break that could offer good profits for nimble traders.
▶ Good setups in individual stocks abound this week. Focus on pullbacks and potential breakouts. (Breakouts of pullback patterns are even more power-ful.)
▶ Be prepared to adjust if the market shows no follow-through, but expect at least a second trend leg to any sharp broad market break.
Key: Near (yellow) and Far (red) stops for daily bars. Colored band beneath the chart indicates trend condition (bright green to bright red = strong bull to strong bear trend.)
Key: ! = overextension, !* = extreme overextension
Sector Leaders & Laggards
EnergyLeaders RIG, COG, MPC, SLB, NFX, WMB
Laggards BTU!*, CNX!*, CHK, DNR, QEP, ESV
IndustrialsLeaders PLL!*, EFX, DE, ALLE, CTAS, SNA
Laggards KSU!*, NSC!*, JOY!, UNP!, LUV!, CHRW!*
TechnologyLeaders BRCM!*, AVGO!*, ALTR!, ADI!, XLNX, JBL
Laggards WIN, FTR!*, FSLR!*, TDC!, ADSK!*, CTL!
MaterialsLeaders AVY!, CF, VMC, NEM, LYB, DOW
Laggards FCX!*, AA!*, FMC, IP, ARG, MOS
Discretionary
Leaders CVC!, NFLX!*, TWC!*, GME!*, GT!, EXPE
LaggardsKORS!*, WYNN!*, FOSL!*, COH!*, HOG!*, URBN!*
FinancialsLeaders AIZ, GS, ETFC, SCHW, BK, ZION
Laggards HCP, NAVI, HCN, KIM, AMP, PLD
StaplesLeaders KRFT, MDLZ!*, ADM, CAG, CPB!*, EL
Laggards KMB, GMCR!*, WFM!*, AVP, WMT!*, PG!
HealthcareLeaders HUM!*, CI!*, MYL, REGN, AET!*, THC
Laggards ALXN, CERN, VAR, BAX, ISRG, LH
UtilitiesLeaders NI, AES, POM, PPL, GAS, PEG
Laggards AEE, CNP, WEC, TEG, SCG, DUK

Tactical Playbook, Week of 1 June 2015
8©2015 Waverly Advisors, LLC. All Rights Reserved. Please review disclosures on the final page of this report.
U.S. Individual Stocks (continued)

Tactical Playbook, Week of 1 June 2015
9©2015 Waverly Advisors, LLC. All Rights Reserved. Please review disclosures on the final page of this report.
Global Stocks ▶ Uncertainty and volatility dominate both Europe and Asia. Though these
actions may be at least somewhat news-driven, there are likely deeper psycho-logical factors.
▶ Europe has had multiple failures over recent months. We view recent action as a minor failure of bullish patterns; it appears the ball now passes to the bears, and we will look to see if these markets can develop any downward momentum.
▶ We are still watching Russia, expecting a spot to buy weakness. This will be the proverbial “buy when there is blood in the streets” trade—wait for a clear tactical entry.
▶ Longer-term factors still point solidly upward, but respect the downside po-tential in the intermediate term.

Tactical Playbook, Week of 1 June 2015
10©2015 Waverly Advisors, LLC. All Rights Reserved. Please review disclosures on the final page of this report.
Rates & FX ▶ US Dollar still points higher. Small pauses (on daily chart) can give tactical
traders short-term entries in the USD or other currencies.
▶ Expect a more directional environment in many currencies over the coming weeks. Also, consider risk of correlated USD-driven exposures.
▶ Bond futures are probably setting up another selloff (both US and Euro-bonds). This does not mean that the longer-term trend is turning, but it does introduce additional volatility and uncertainly.

Tactical Playbook, Week of 1 June 2015
11©2015 Waverly Advisors, LLC. All Rights Reserved. Please review disclosures on the final page of this report.
CommoditiesMetals:
▶ Still floundering with no short-term momentum. Longer-term direction points down, but respect stops on shorts.
Energy:
▶ Late week action potentially erodes much of the short-term bearish bias. Neutral, and probably putting in a longer-term bottom.
Grains & Softs:
▶ Grains continue to point broadly lower.
▶ Hold shorts in sugar, but watch action around previous pivot lows. Do not short into strength.

Tactical Playbook, Week of 1 June 2015
12©2015 Waverly Advisors, LLC. All Rights Reserved. Please review disclosures on the final page of this report.
Discretionary Trade Ideas
Commentary ▶ Good potential in many markets, but last week saw consolidation and no clear short direction in most asset classes.
▶ Our trades are well-positioned and we have been able to significantly tighten stops on all open positions. We hold three open positions with a total, combined net risk only a little over a single trade risk—this is an example of effective trade management at work.
▶ It is very important to think of all positions relative to that initial risk. (For new clients, note that P&L is reported in the table above as a multiple of that initial trade risk. I.e., 0.5x means that the trade has a profit equal to 50% of the initial trade risk.)
▶ Early signs point to the resumption of a more dynamic, directional environment. Swing traders must be prepared to take advantage of this environment, but, regardless, focus on the potential risks in each trade and manage appropriately.
Potential entries ▶ Buy S&P 500 futures at 2,126 (holding only if confirmed by a strong close above), against an initial stop around 2,070. This is a swing trade based on the daily bull flag.
Note: These are a distillation of our quantitative and discretionary work. In a sense, they are specific trade examples of our bigger picture tactical themes. Please contact us for further information on our discretionary and systematic trading approaches.
Date In L/S Size Contract Proxy Type Price In InitStop Last Target Stop StopATR CurrentRisk Open% Open%R Total P&L
4/24/15 S Full Gold (Dec 15) GLD I/PB 1,185.50 1,265.00 1,192.20 1,106.00 1,232.00 2.7 58% (0.6%) -0.1x -0.1x
5/4/15 S Full Sugar (July 15) SGG I/PB 12.78 14.25 12.01 11.31 13.06 2.9 19% 6.0% 0.5x 0.5x
5/19/15 S Full EURUSD FXE I/PB 1.1200 1.1860 1.0990 1.0540 1.1350 2.8 23% 1.9% 0.3x 0.3x
Key: D = Discretionary, I = Intermediate-term (otherwise it is short-term), PB = Pullback, A = Anti, FT = Failure Test, BO = Breakout

Tactical Playbook, Week of 1 June 2015
13©2015 Waverly Advisors, LLC. All Rights Reserved. Please review disclosures on the final page of this report.
Equity Trading Model
Ticker Name Last Near Stop Far Stop Buy Level Sell Level Trend Shocks (+/-) RS(SP500) C%52Wk
SPY SPDR S&P 500 ETF 211.14 207.65 203.56 Bull 8/252 (3/5) 1.65 91.7
QQQ PwrShs QQQ Trust Ser 1 110.05 106.98 104.24 113.45 Bull 6/252 (2/4) 4.11 94.7
IWM iShs Russell 2000 ETF 123.89 120.54 117.25 119.94(C) Bull 5/252 (1/4) 2.71 86.3
Active StocksAA Alcoa Inc 12.50 12.09 12.06 12.38(C) Bear 7/252 (7/0) -12.68 1.1
AAL American Airlines Grp inc 42.37 41.37 41.37 41.52(C) Bear 11/252 (9/2) -5.94 50.8
AAPL Apple Inc 130.28 125.34 120.26 136.86 Bull 4/252 (2/2) 8.26 90.7
ABBV AbbVie Inc 66.59 63.81 61.02 69.61 Bull/Neut 6/252 (3/3) 5.41 78.5
ABX Barrick Gold 11.86 [11.98] 11.17 Bull/Neut 8/252 (5/3) -8.09 19.3
AMAT Applied Materials 20.13 19.06 18.03 18.99(C) Bear 6/252 (3/3) -6.48 21.2
BABA Alibaba Group Holding Ltd 89.32 87.95 83.21 95.49 N/A 0/0 (0/0) -2.86 N/A
BAC Bank of America Corporation 16.50 16.08 15.56 Bear/Neut 10/252 (6/4) 1.63 49.3
BRCM Broadcom Corp'A' 56.85 53.69 51.02 [52.95] Bull 4/252 (2/2) 32.96 96.7
C Citigrp Inc 54.08 52.80 51.08 52.11(C) Bull/Neut 6/252 (5/1) 1.67 72.4
CHK Chesapeake Energy Corp 14.11 13.38 12.05 Bear 11/252 (5/6) -20.74 4.0
CMCSA Comcast Cl'A' 58.46 56.10 54.31 55.22(C) Bull/Neut 7/252 (6/1) 1.99 79.3
CSCO Cisco Systems 29.31 28.37 27.34 Bull 9/252 (3/6) 4.00 87.2
CSX CSX Corp 34.08 32.97 32.55 34.07(S) Bull/Neut 7/252 (3/4) -2.77 56.8
DAL Delta Airlines Inc 42.92 40.93 40.93 Bear 9/252 (5/4) -2.19 61.1
EMC EMC Corp 26.34 25.51 24.52 25.37(C) Bear 11/252 (3/8) -5.13 21.7
F Ford Motor 15.17 14.91 14.72 15.16(S) Bull/Neut 6/252 (3/3) -4.21 39.3
FB Facebook Inc 79.19 76.67 73.49 Bull/Neut 7/252 (3/4) 3.02 71.7
FCX Freeport-McMoRan Inc 19.65 19.62 19.62 19.30(C) Bear/Neut 8/252 (4/4) -18.57 14.1
FOXA Twenty-First Century Fox Inc A 33.60 32.73 31.67 32.35(C) Bear 8/252 (3/5) -4.23 31.4
GE General Electric 27.27 26.25 25.22 Bull/Neut 7/252 (5/2) 1.75 73.2
GG Goldcorp Inc 17.76 16.52 16.48 16.84(C) Bear 7/252 (2/5) -11.23 5.9
GM General Motors Co 35.97 34.75 33.53 34.07(C) Bull/Neut 8/252 (4/4) 2.94 70.3
HAL Halliburton Co 45.40 42.20 41.24 Bear/Neut 10/252 (5/5) -5.32 22.1
INTC Intel Corp 34.46 32.71 31.35 31.55(C) Bear/Neut 9/252 (6/3) 4.08 68.6
ITUB Itau Unibanco Multiplo S A 10.70 [10.91] [10.91] Bear 5/252 (3/2) -18.46 6.9
JPM JPMorgan Chase & Co 65.78 64.12 62.07 68.45 Bull 6/252 (3/3) 5.93 89.1
KO Coca-Cola Co 40.96 40.13 39.26 39.87(C) Bear/Neut 7/252 (3/4) -2.39 32.0
KRFT Kraft Foods Grp Inc 84.45 81.80 78.69 Bull 5/252 (3/2) 21.46 81.9
MGM MGM Resorts Intl 20.05 18.56 18.24 18.52(C) Bull/Neut 9/252 (4/5) -8.60 27.0
MSFT Microsoft Corp 46.86 45.69 43.55 50.16 Bull/Neut 11/252 (6/5) 2.40 68.8

Tactical Playbook, Week of 1 June 2015
14©2015 Waverly Advisors, LLC. All Rights Reserved. Please review disclosures on the final page of this report.
Equity Trading Model (continued)
Ticker Name Last Near Stop Far Stop Buy Level Sell Level Trend Shocks (+/-) RS(SP500) C%52Wk
MU Micron Tech 27.93 26.09 24.41 25.47(C) Bear 5/252 (3/2) -4.96 21.1
MYL Mylan NV 72.63 65.31 60.36 Bull 8/252 (6/2) 19.40 87.3
ORCL Oracle Corp 43.49 42.21 40.87 Bull/Neut 5/252 (2/3) 1.08 70.4
PBR Petroleo Brasileiro S.A. ADS 8.35 [8.86] 7.89 Bull/Neut 5/252 (3/2) -6.67 21.5
PFE Pfizer Inc 34.75 33.50 32.50 Bull 9/252 (6/3) 5.91 90.3
QCOM Qualcomm Inc 69.68 67.47 64.90 66.49(C) Bear/Neut 9/252 (2/7) -2.20 37.7
RF Regions Finl Corporation 10.09 9.81 9.41 9.60(C) 10.68 Bull/Neut 8/252 (5/3) 1.40 63.6
RIG TransOcean Ltd 18.85 18.25 16.65 Bull/Neut 5/252 (2/3) -10.16 17.0
SDRL Seadrill Limited 11.91 11.68 11.44 11.90(S) Bull/Neut 9/252 (2/7) -20.06 10.5
SUNE SunEdison Inc 29.97 28.29 26.29 31.79 Bull 9/252 (6/3) 24.27 92.8
T AT&T Inc 34.54 33.58 32.49 35.94 Bull 8/252 (2/6) -0.49 45.7
TSM Taiwan Semiconductor Mfg ADS 24.28 23.26 22.44 Bull/Neut 8/252 (2/6) 3.10 76.7
TWTR Twitter Inc 36.67 32.40 29.72 34.43(C) Bear 0/0 (0/0) -9.15 N/A
VIPS Vipshop Hldg Ltd 24.97 23.12 22.32 Bull/Neut 4/252 (2/2) 6.41 60.9
VZ Verizon Communications 49.44 48.40 48.02 Bull 6/252 (2/4) -0.50 50.8
WFC Wells Fargo 55.96 54.55 53.12 53.96(C) 57.80 Bull 9/252 (6/3) 2.90 92.8
WLL Whiting Petro 32.99 29.12 27.58 Bear/Neut 11/252 (5/6) -19.43 12.9
XLE S&P Sel Energy Spdr Fd 78.39 76.56 75.12 78.38(S) Bear/Neut 7/252 (4/3) -5.84 22.4
XOM Exxon Mobil 85.20 83.02 80.83 83.18(C) Bear 8/252 (3/5) -5.58 11.4
XRX Xerox Corp 11.42 10.63 10.01 10.78(C) Bear 6/252 (3/3) -8.14 9.3
YHOO Yahoo Inc 42.94 41.24 39.37 40.59(C) Bear/Neut 9/252 (4/5) -1.92 50.8
Key: Potential entry points for managers looking to initiate or add to positions are indicated by entry at or below the Buy Level. Two models generate these entries, Slingshot (S) and Catapult (C). Both models are based on the concept of buying weakness against trend integrity; Catapult is generally requires a stronger selloff to generate an entry. Both models only trigger under certain conditions, leaving some names without potential entries in some cases. The Near and Far Trailing stops give statistically-valid risk points for long positions. Many managers will treat the near level as a warning, and use the far level as a hard stop. The Sell Level is another trading model that sets up under conditions of extreme strength, highlighting potential profit targets for managers looking to reduce exposure or book partial profits on winners

Tactical Playbook, Week of 1 June 2015
15©2015 Waverly Advisors, LLC. All Rights Reserved. Please review disclosures on the final page of this report.
Futures Pullback System
The Waverly Pullback System is a set of algorithmic trading rules that identifies a market that has recently made a strong thrust, and enters in the direction of that initial thrust when mean reversion sets in and the market pulls back. This system has, historically, produced approximately 2.6 trades per year per market, with an average holding period of about 26 days. We encourage our readers to always consider the impact and potential risk of correlated positions.
Market Last Condition Trigger EstStopSize DateIn PriceIn Stop Target P&L
Stock Indexes
E-mini S&P 500 CC [Jun15] 2,107.50 Flat
Nikkei 225 USD CC [Jun15] 20,460.00 Flat
DAX Futures CC [Jun15] 11,413.50 Flat
Rates and Currencies
30 Yr U.S.T Bonds CC [Sep15] 154 31/32 Short full 5/15/15 154 2/32 158 3/32 150 1/32 (0.22)
10 Yr U.S. T Notes CC [Sep15] 127’15.0 Flat
5 Yr U.S.T Notes CC [Sep15] 119’20.2 Flat
Euro Bund CC [Jun15] 155.4300 Short full 5/22/15 154.0000 155.8900 152.1100 (0.76)
Euro Bobl CC [Jun15] 128.8500 Short full 5/19/15 128.5100 128.9610 128.0590 (0.75)
Euro Schatz CC [Jun15] 111.1750 Flat
Euro FX CC [Jun15] 1.0995 Flat
Swiss Franc CC [Jun15] 1.0641 Flat
British Pound CC [Jun15] 1.5289 Flat
Canadian Dollar CC [Jun15] 0.8030 Flat
Mexican Peso CC [Jun15] 0.0649 Flat
Japanese Yen CC [Jun15] 0.8054 Sell setup 0.8179 0.0123
Australian Dollar CC [Jun15] 0.7638 Flat
New Zealand CC [Jun15] 0.7094 Flat
Metals
Gold CC [Aug15] 1,190.50 Flat
Silver CC [Jul15] 16.725 Flat
Copper CC [Jul15] 2.7315 Flat
Energy
Crude Oil CC [Jul15] 60.28 Flat
Heating Oil CC [Jul15] 1.9454 Flat
Gasoline (RBOB) CC [Jul15] 2.0608 Flat
Natural Gas CC [Jul15] 2.6430 Flat
Foods
Soybeans CC [Jul15] 93 4 Flat
Wheat CC [Jul15] 47 7 Long full 5/26/15 493 4/8 463 4/8 523 4/8 (0.55)
Corn CC [Jul15] 351 4/8 Flat
Sugar No. 11 CC [Jul15] 11.98 Flat
Coffee C CC [Jul15] 126.15 Flat
Cocoa CC [Jul15] 3,085.00 Long full* 5/29/15 3,085.00 2,983.00 3,187.00 0.00
Cotton No. 2 CC [Jul15] 64.35 Flat

Tactical Playbook, Week of 1 June 2015
16©2015 Waverly Advisors, LLC. All Rights Reserved. Please review disclosures on the final page of this report.
Futures Channel System
The Waverly Channel System is a longer-term, trend following system that has produced, on average, around 4.4 trades per year per market followed, with an average holding period of around 31 days. This system first “permissions” a trade long or short (indicated by LongOk or ShortOk), and then gives precise entry levels and stop levels. Once entered, the trade is actively managed with a stop-loss methodology. We encourage our readers to always consider the impact and potential risk of correlated positions.
Market Last Condition LEntry EstLStop SEntry EstSStop DateIn PriceIn Stop P&L
Stock Indexes
E-mini S&P 500 CC [Jun15] 2,107.50 Long 5/15/15 2,119.75 2,074.63 (0.28)
Nikkei 225 USD CC [Jun15] 20,460.00 Long 5/20/15 20,295.00 19,730.00 0.29
DAX Futures CC [Jun15] 11,413.50 LongOk ShortOk 12,429.50 11,963.20 10,182.00 10,648.30
Rates and Currencies
30 Yr U.S.T Bonds CC [Sep15] 154 31/32 LongOk ShortOk 166 01/32 162 00/32 149 19/32 153 20/32
10 Yr U.S. T Notes CC [Sep15] 127’15.0 LongOk ShortOk 129’29.5 128’19.0 125’09.5 126’20.5
5 Yr U.S.T Notes CC [Sep15] 119’20.2 LongOk ShortOk 120’12.0 119’19.2 117’23.2 118’16.0
Euro Bund CC [Jun15] 155.4300 LongOk ShortOk 160.69 158.98 151.44 153.15
Euro Bobl CC [Jun15] 128.8500 LongOk ShortOk 129.79 129.36 127.76 128.19
Euro Schatz CC [Jun15] 111.1750 LongOk ShortOk 111.31 111.23 111.01 111.09
Euro FX CC [Jun15] 1.0995 LongOk ShortOk 1.17 1.14 1.05 1.08
Swiss Franc CC [Jun15] 1.0641 LongOk ShortOk 1.1824 1.1545 0.9910 1.0189
British Pound CC [Jun15] 1.5289 ShortOk 1.4560 1.4882
Canadian Dollar CC [Jun15] 0.8030 LongOk ShortOk 0.8386 0.8220 0.7781 0.7947
Mexican Peso CC [Jun15] 0.0649 LongOk ShortOk 0.0681 0.0665 0.0633 0.0649
Japanese Yen CC [Jun15] 0.8054 Short 5/26/15 0.8205 0.8321 1.27
Australian Dollar CC [Jun15] 0.7638 LongOk ShortOk 0.8151 0.7936 0.7504 0.7719
New Zealand CC [Jun15] 0.7094 Short* 5/29/15 0.7085 0.7300 (0.04)
Metals
Gold CC [Aug15] 1,190.50 LongOk ShortOk 1,310.80 1,277.44 1,143.40 1,176.76
Silver CC [Jul15] 16.725 LongOk ShortOk 18.590 17.750 15.305 16.145
Copper CC [Jul15] 2.7315 LongOk ShortOk 2.9560 2.8364 2.4060 2.5256
Energy
Crude Oil CC [Jul15] 60.28 LongOk ShortOk 63.54 59.30 46.38 50.62
Heating Oil CC [Jul15] 1.9454 LongOk ShortOk 2.08 1.9706 1.4285 1.5402
Gasoline (RBOB) CC [Jul15] 2.0608 ShortOk 1.5093 1.6310
Natural Gas CC [Jul15] 2.6430 LongOk ShortOk 3.15 2.9420 2.5120 2.7170
Foods
Soybeans CC [Jul15] 934 0/8 Short 5/19/15 944 4/8 974 5/8 0.35
Wheat CC [Jul15] 477 0/8 LongOk ShortOk 549 0/8 519 1/8 460 6/8 490 5/8
Corn CC [Jul15] 351 4/8 Short 5/26/15 355 6/8 369 7/8 0.30
Sugar No. 11 CC [Jul15] 11.98 Short 5/27/15 11.84 12.55 (0.20)
Coffee C CC [Jul15] 126.15 Short 5/26/15 125.80 136.59 (0.03)
Cocoa CC [Jul15] 3,085.00 Long 5/12/15 3,035.00 3,035.00 0.46
Cotton No. 2 CC [Jul15] 64.35 LongOk ShortOk 68.13 65.55 58.08 60.66

Tactical Playbook, Week of 1 June 2015
17©2015 Waverly Advisors, LLC. All Rights Reserved. Please review disclosures on the final page of this report.
Relative Strength Rankings
International Now Chg VRat US Sectors (SP1500) Now Chg VRat US Industries (Top) Now Chg VRat US Industries (Bottom) Now Chg VRat
India 1 0 0.7 Health Care 1 0 0.9 HCare Prov & Svcs 1 1 0.9 Electrical Equip 35 -7 1.0
Hong Kong 2 0 0.9 Information Tech 2 1 1.3 Internet & Catalog Ret 2 1 0.6 Communications Equip 36 8 1.1
Japan 3 0 1.0 Consumer Discretionary 3 -1 0.8 Construction Materials 3 -2 0.8 Food & Staples Ret 37 -4 0.8
Taiwan 4 3 0.5 Financials 4 0 1.0 Real Estate Mgmt&Dev 4 0 0.3 Internet Soft &Svcs 38 0 1.1
Nthrlands 5 -1 1.4 Consumer Staples 5 2 0.8 Wireless Telcom Svcs 5 2 0.9 Comm Svcs & Supplies 39 3 1.0
Israel 6 0 0.6 Materials 6 0 1.0 Building Products 6 0 0.9 Multi-Utilities 40 6 0.4
Switzerland 7 2 1.5 Utilities 7 2 0.5 Semis & Semi Equip 7 9 1.3 Elec Equip & Cmpnnts 41 -5 0.9
S&P 500 Index 8 0 1.0 Telcom Svcs 8 0 0.6 BioTech 8 -3 1.0 Aerospace & Defence 42 -7 0.8
UK 9 2 1.0 Industrials 9 -4 0.9 Pharmaceuticals 9 12 0.9 Insurance 43 -11 1.0
S Korea 10 -5 1.2 Energy 10 0 0.6 Food Products 10 9 0.5 Construction & Eng 44 13 1.1
Phlippnes 11 -1 1.3 US Industry Groups Now Chg VRat Professional Svcs 11 0 0.9 Leisure Equip & Prds 45 -4 0.6
Sweden 12 4 1.1 Health Care Equip & Svcs 1 0 0.8 Auto Components 12 6 1.0 Beverages 46 6 0.8
Mexico 13 10 0.5 Semis & Semis Equip 2 2 1.3 Comps & Peripherals 13 -5 1.2 Div Telcom Svcs 47 6 0.6
France 14 -2 1.4 Retailing 3 -1 0.9 Specialty Retail 14 0 0.9 Distributors 48 -14 1.2
Singapore 15 0 0.8 Pharma, Biotech & Life Sci 4 -1 0.9 HCare Equip & Supply 15 7 0.9 Electric Utilities 49 7 0.5
Australia 16 8 0.9 Tech Hardware & Equip 5 1 1.3 Capital Markets 16 -3 1.0 REITs 50 5 0.8
Germany 17 -4 1.2 Media 6 2 0.7 IT Svcs 17 -2 1.0 Div Consumer Svcs 51 -4 0.9
Finland 18 1 0.9 Consumer Svcs 7 0 0.8 Software 18 5 1.0 Machinery 52 -9 0.9
Canada 19 1 1.0 Software & Svcs 8 1 1.1 Life Scis Tools & Svcs 19 -9 1.0 Txtils, Apprl & Lux Gds 53 -16 1.4
S Africa 20 -6 1.0 Banks 9 -4 0.9 Thrifts & Mrtg Finace 20 6 0.8 Paper & Forest Products 54 -6 0.9
Indonesia 21 1 0.5 Commercial & Prof Svcs 10 1 1.0 Multiline Retail 21 -1 0.7 Air Freight & Logistics 55 -6 1.1
Thailand 22 -1 1.1 Food Beverage & Tobacco 11 5 0.7 Htls Rests & Leisure 22 2 0.7 Consumer Finance 56 -5 0.8
UAE 23 -5 0.7 Diversified Financials 12 -2 1.0 Media 23 2 0.7 Automobiles 57 2 0.9
Russia 24 -7 0.4 Food & Staples Retailing 13 1 0.8 Containers & Packaging 24 -15 1.1 Ind Pwr Prod & Trdrs 58 0 0.8
Brazil 25 0 1.0 Insurance 14 -2 1.0 Health Care Tech 25 2 0.9 Energy Equip & Svcs 59 2 0.6
Greece 26 0 1.1 Capital Goods 15 0 0.9 Commercial Banks 26 -9 0.9 Household Products 60 0 1.0
US Mkt Cap Indexes Now Chg VRat Materials 16 1 1.0 Industrial Conglomerates 27 3 0.6 Airlines 61 4 0.9
Russell MicroCap Index 1 2 0.9 Automobiles & Compnts 17 1 1.0 Household Durables 28 1 1.0 Oil, Gas&Consmble Fuels 62 1 0.7
US Growth 2 -1 1.1 Utilities 18 2 0.5 Div Financial Svcs 29 2 0.9 Trading Cos & Dists 63 -9 1.5
Russell 2000 Index 3 -1 1.1 Cons Durables & Apparel 19 -6 1.0 Gas Utilities 30 20 0.6 Marine 64 -2 1.2
S&P SmallCap 600 Index 4 0 1.1 Telcom Svcs 20 -1 0.6 Personal Products 31 -19 0.7 Metals & Mining 65 1 0.9
DJ Wilshire 5000 Comp 5 0 1.0 Real Estate 21 0 0.8 Water Utilities 32 8 0.9 Road & Rail 66 -2 0.6
S&P 500 Index 6 -1 1.0 Household & Prsnl Prod 22 0 1.0 Tobacco 33 12 0.6
S&P 100 Index 7 0 1.0 Energy 23 0 0.6 Chemicals 34 5 0.8
US Value 8 0 1.0 Transportation 24 0 0.9

Tactical Playbook, Week of 1 June 2015
18©2015 Waverly Advisors, LLC. All Rights Reserved. Please review disclosures on the final page of this report.
Screens: Big Movers
Ticker Desc Close Change VolSpike KPos RS 52WkH 52WkL C%52Wk ATR ConsCloses AvgVol Extension
HUM Humana Inc 214.32 20.1% 15.0 200 20.1 219.79 115.51 95% 5.09 1 1.5 OB
PRTA Prothena Corporation plc 39.44 14.3% 4.8 115 15.07 45.00 16.71 80% 1.70 2 0.6 -
GME Gamestop Corp 'A' 43.41 6.1% 3.8 112 6.17 46.59 31.69 79% 1.03 2 1.7 OB
LLY Lilly (Eli) 78.90 3.3% 3.5 141 3.92 79.55 58.50 97% 1.09 6 4.3 OB
CI Cigna Corp 140.91 3.7% 3.4 116 4.22 145.33 85.75 93% 2.52 3 1.8 -
MDLZ Mondelez Int'l Inc Cl A 41.59 2.8% 3.3 123 2.86 41.60 31.83 100% 0.54 3 10.8 OB
SXC SunCoke Energy Inc 16.26 4.5% 2.9 52 3.90 24.57 14.38 18% 0.46 2 0.6 -
CNC Centene Corp 75.34 4.1% 2.7 118 4.31 75.50 35.49 100% 1.55 4 1.3 -
MRK Merck & Co 60.90 2.0% 2.7 80 1.86 63.62 52.49 76% 0.80 3 11.5 -
LBIO Lion Biotech Inc 11.19 6.7% 2.6 58 6.27 15.03 4.97 62% 0.58 1 0.6 -
ANF Abercrombie & Fitch Co'A' 20.48 -8.2% -2.5 30 -6.65 45.50 19.34 4% 0.81 -1 2.9 -
POT Potash Corp Saskatchewan 31.49 -2.6% -2.5 9 -3.25 38.58 31.39 1% 0.51 -1 4.2 -
SKM SK Telecom ADS 24.44 -4.7% -2.6 -25 -5.19 31.84 23.51 11% 0.60 -3 0.7 -
SPLK Splunk Inc 67.62 -5.0% -2.6 45 -4.33 74.88 39.35 80% 2.25 -1 2.0 -
PCAR PACCAR Inc 63.56 -2.5% -2.7 10 -2.59 70.27 54.34 58% 0.99 -2 1.6 -
DECK Deckers Outdoor Corp 68.14 -4.3% -2.8 -4 -5.20 99.88 65.65 7% 1.86 -6 0.7 OS
KNX Knight Trasportation Inc 28.59 -4.9% -3.1 11 -5.35 34.73 23.17 47% 0.74 -2 0.9 -
CMI Cummins Inc 135.49 -2.7% -3.1 2 -3.11 161.03 124.30 30% 1.91 -2 1.5 OS
BEAV B/E Aerospace 57.34 -2.8% -3.3 -8 -3.43 N/A N/A N/A 1.01 -5 0.8 -
TD Toronto-Dominion Bk 43.53 -2.2% -3.3 -10 -2.99 53.49 39.56 28% 0.63 -2 1.4 OS
VEEV Veeva Systems Inc 27.12 -6.2% -3.3 39 -5.69 33.66 19.51 54% 0.81 -1 1.2 -
ODFL Old Dominion Freight Line 68.01 -4.8% -3.6 -3 -4.94 81.48 61.17 34% 1.42 -2 0.6 -
SWFT Swift Transportation 23.29 -6.0% -3.6 5 -6.26 29.44 18.53 44% 0.66 -2 2.0 -
NAV Navistar Int'l Corporation 26.48 -3.5% -3.7 -9 -3.94 40.17 26.14 2% 0.71 -1 0.8 OS
BMY Bristol-Myers SQUIBB 64.60 -6.7% -6.3 9 -6.50 69.86 46.30 78% 1.28 -1 6.5 -
GEF Greif Inc 'A' 38.20 -8.5% -9.4 -27 -9.19 56.53 35.85 11% 0.91 -4 0.5 -
Click here for explanation and use of screens
Tactical Playbook, Week of 1 June 2015
19©2015 Waverly Advisors, LLC. All Rights Reserved. Please review disclosures on the final page of this report.
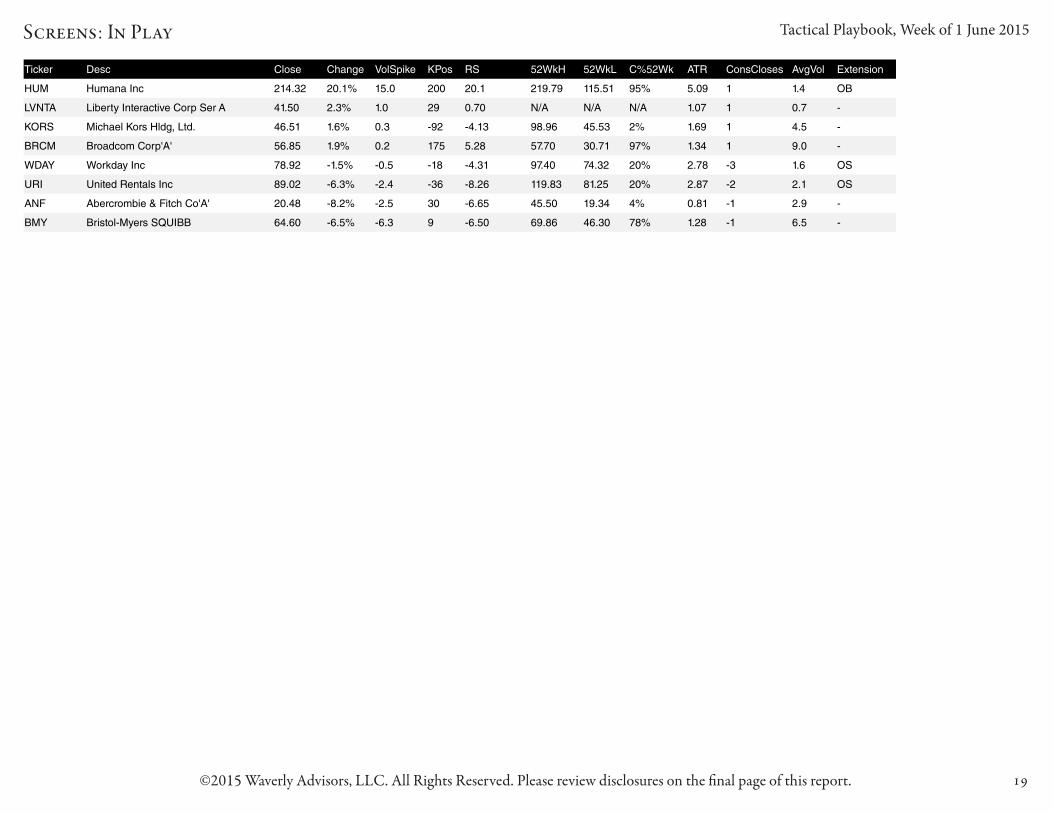
Screens: In Play
Ticker Desc Close Change VolSpike KPos RS 52WkH 52WkL C%52Wk ATR ConsCloses AvgVol Extension
HUM Humana Inc 214.32 20.1% 15.0 200 20.1 219.79 115.51 95% 5.09 1 1.4 OB
LVNTA Liberty Interactive Corp Ser A 41.50 2.3% 1.0 29 0.70 N/A N/A N/A 1.07 1 0.7 -
KORS Michael Kors Hldg, Ltd. 46.51 1.6% 0.3 -92 -4.13 98.96 45.53 2% 1.69 1 4.5 -
BRCM Broadcom Corp'A' 56.85 1.9% 0.2 175 5.28 57.70 30.71 97% 1.34 1 9.0 -
WDAY Workday Inc 78.92 -1.5% -0.5 -18 -4.31 97.40 74.32 20% 2.78 -3 1.6 OS
URI United Rentals Inc 89.02 -6.3% -2.4 -36 -8.26 119.83 81.25 20% 2.87 -2 2.1 OS
ANF Abercrombie & Fitch Co'A' 20.48 -8.2% -2.5 30 -6.65 45.50 19.34 4% 0.81 -1 2.9 -
BMY Bristol-Myers SQUIBB 64.60 -6.5% -6.3 9 -6.50 69.86 46.30 78% 1.28 -1 6.5 -

Tactical Playbook, Week of 1 June 2015
20©2015 Waverly Advisors, LLC. All Rights Reserved. Please review disclosures on the final page of this report.
Screens: Consecutive Closes
Ticker Desc Close Change VolSpike KPos RS 52WkH 52WkL C%52Wk ATR ConsCloses AvgVol Extension
LC LC 19.21 1.1% 0.4 82 2.5 N/A N/A N/A 0.79 10 2.4 -
FSL Freescale Semiconductor Ltd 45.12 1.2% 0.7 111 1.99 45.22 15.29 100% 0.99 7 2.0 -
BLUE BlueBird Bio Inc 194.25 0.9% 0.2 118 3.44 197.35 20.01 98% 10.31 6 0.8 -
LLY Lilly (Eli) 78.90 3.3% 3.5 141 3.92 79.55 58.50 97% 1.09 6 4.3 OB
WMB Williams Companies 51.11 -0.3% -0.2 33 -1.09 59.77 40.07 56% 1.17 -6 6.2 -
SERV ServiceMaster Glbl Hldgs Inc 33.59 -0.2% -0.2 8 -1.93 N/A N/A N/A 0.78 -6 0.8 OS
OKE Oneok Inc 41.93 -0.7% -0.3 -1 -2.07 71.19 39.53 8% 1.32 -6 2.0 -
HAR Harman Intl 120.47 -1.5% -0.6 13 -1.99 149.12 84.48 56% 3.38 -6 1.0 -
DECK Deckers Outdoor Corp 68.14 -4.3% -2.8 -4 -5.20 99.88 65.65 7% 1.86 -6 0.7 OS
CSTM Constellium N.V. 13.63 -1.8% -0.7 -19 -3.71 32.61 13.56 0% 0.69 -6 0.8 OS
NVGN Novogen Ltd ADS 5.61 -1.1% -0.3 31 -3.19 9.50 1.51 51% 0.43 -7 1.0 -
FRAN Francesca's Hldg Corp 15.67 -0.2% -0.1 18 -1.07 18.23 11.02 64% 0.46 -7 0.6 -
SNE Sony Corp ADR 30.92 -0.8% -0.6 34 -1.27 32.95 15.96 88% 0.53 -7 1.7 -
GGAL Grupo Financiero Galicia ADS 20.03 -1.0% -1.4 3 -4.04 26.13 10.33 61% 0.68 -8 0.5 OS
COL Rockwell Collins 95.19 -1.3% -1.6 13 -1.69 99.37 71.89 85% 1.08 -8 0.8 -
SBAC SBA Communications'A' 111.81 -0.4% -0.7 11 -0.85 126.65 96.64 51% 1.75 -8 0.9 -

Tactical Playbook, Week of 1 June 2015
21©2015 Waverly Advisors, LLC. All Rights Reserved. Please review disclosures on the final page of this report.
Screens: Extension
Ticker Desc Close Change VolSpike KPos RS 52WkH 52WkL C%52Wk ATR ConsCloses AvgVol Extension
HUM Humana Inc 214.32 20.1% 15.0 200 20.1 219.79 115.51 95% 5.09 1 1.5 OB
GME Gamestop Corp 'A' 43.41 6.1% 3.8 112 6.17 46.59 31.69 79% 1.03 2 1.7 OB
LLY Lilly (Eli) 78.90 3.3% 3.5 141 3.92 79.55 58.50 97% 1.09 6 4.3 OB
MDLZ Mondelez Int'l Inc Cl A 41.59 2.8% 3.3 123 2.86 41.60 31.83 100% 0.54 3 10.8 OB
NUVA NuVasive Inc 50.55 1.9% 1.5 109 2.53 51.25 32.04 96% 1.15 5 0.7 OB
INTC Intel Corp 34.51 1.5% 1.2 96 1.78 37.90 26.18 71% 0.57 3 31.6 OB
PANW Palo Alto Networks Inc 169.42 1.9% 1.1 115 2.71 169.84 66.77 100% 3.74 2 1.3 OB
SERV ServiceMaster Glbl Hldgs Inc 33.59 -0.2% -0.2 8 -1.93 N/A N/A N/A 0.78 -6 0.8 OS
SN Sanchez Energy Corporation 10.07 -0.8% -0.3 2 -2.84 38.95 6.22 12% 0.75 -2 2.2 OS
ABMD Abiomed, Inc 59.72 -0.7% -0.3 6 -2.92 76.90 20.99 69% 3.22 -2 0.6 OS
WDAY Workday Inc 78.92 -1.5% -0.5 -18 -4.31 97.40 74.32 20% 2.78 -3 1.6 OS
LOCO El Pollo Hldgs Inc 20.74 -2.6% -0.6 -24 -3.98 N/A N/A N/A 1.06 -5 1.4 OS
CSTM Constellium N.V. 13.63 -1.8% -0.7 -19 -3.71 32.61 13.56 0% 0.69 -6 0.8 OS
FSLR First Solar Inc 49.71 -0.9% -1.0 -26 -4.05 73.78 39.18 30% 1.47 -2 1.9 OS
BAX Baxter Intl 66.61 -0.2% -1.0 11 -0.93 77.31 65.94 6% 0.88 -1 3.4 OS
HWAY Healthways Inc 15.16 -1.7% -1.0 -8 -2.89 23.30 13.99 13% 0.51 -4 0.5 OS
ENB Enbridge Inc 47.90 -1.5% -1.0 0 -2.52 57.19 42.14 38% 1.05 -1 0.9 OS
RTI RTI Intl Metals 35.26 -1.5% -1.0 -1 -2.11 40.08 20.92 75% 0.74 -2 0.9 OS
LGCY Legacy Reserves LP Unts 10.04 -2.6% -1.1 7 -4.07 32.61 8.06 8% 0.57 -5 0.5 OS
CP Canadian Pacific Railway 164.70 -1.9% -1.2 -22 -2.97 220.20 164.29 1% 4.40 -2 1.0 OS
SCCO Southern Copper Corp 30.01 -1.6% -1.3 3 -2.31 33.90 23.60 62% 0.64 -2 1.5 OS
RAX Rackspace Hosting Inc 40.08 -4.2% -1.3 -46 -5.07 56.20 28.80 41% 1.49 -5 1.7 OS
GGAL Grupo Financiero Galicia ADS 20.03 -1.0% -1.4 3 -4.04 26.13 10.33 61% 0.68 -8 0.5 OS
OMC Omnicom Grp 74.50 -1.1% -1.4 3 -1.78 80.98 64.03 62% 0.95 -2 1.2 OS
NSC Norfolk Southern 92.00 -1.8% -1.4 -17 -2.59 117.64 91.85 1% 1.72 -2 2.3 OS
OSK Oshkosh Corp (Hldg Co) 50.15 -2.7% -1.7 3 -3.91 57.99 38.64 59% 1.23 -4 0.9 OS
SPWR SunPower Corp 30.39 -2.8% -1.8 10 -3.52 42.07 22.75 40% 0.90 -4 1.5 OS
BMO Bank Of Montreal 61.10 -1.4% -1.8 -4 -2.14 78.56 57.37 18% 0.90 -2 0.7 OS
TRGP Targa Resources Corp 91.97 -2.0% -1.9 -11 -3.06 160.97 82.09 13% 2.43 -5 0.7 OS
TEX Terex Corp 24.72 -4.8% -2.1 -19 -7.04 42.53 22.00 13% 0.86 -4 2.1 OS
URI United Rentals Inc 89.02 -6.3% -2.4 -36 -8.26 119.83 81.25 20% 2.87 -2 2.1 OS
DECK Deckers Outdoor Corp 68.14 -4.3% -2.8 -4 -5.20 99.88 65.65 7% 1.86 -6 0.7 OS
CMI Cummins Inc 135.49 -2.7% -3.1 2 -3.11 161.03 124.30 30% 1.91 -2 1.5 OS
TD Toronto-Dominion Bk 43.53 -2.2% -3.3 -10 -2.99 53.49 39.56 28% 0.63 -2 1.4 OS
NAV Navistar Int'l Corporation 26.48 -3.5% -3.7 -9 -3.94 40.17 26.14 2% 0.71 -1 0.8 OS

Tactical Playbook, Week of 1 June 2015
22©2015 Waverly Advisors, LLC. All Rights Reserved. Please review disclosures on the final page of this report.
Screens: Consolidating
Ticker Desc Close Change VolSpike KPos RS 52WkH 52WkL C%52Wk ATR ConsCloses AvgVol Extension
BLUE BlueBird Bio Inc 194.25 1.0% 0.2 118 3.4 197.35 20.01 98% 10.31 6 0.8 -
STRZA Starz Ser A 41.96 0.1% 0.1 101 0.61 42.25 27.31 98% 0.84 4 0.8 -
IGTE IGATE Corp 47.51 -0.0% -0.2 68 -0.02 47.95 28.62 98% 0.14 -1 1.2 -
OCR Omnicare, Inc 95.29 -0.4% -0.3 91 -0.50 96.54 59.85 97% 1.56 -1 2.1 -
GPN Global Payments 104.36 -0.1% -0.1 67 -0.28 106.06 67.34 96% 1.28 -1 0.6 -
SGMS Scientific Games Cl'A' 15.22 0.3% 0.1 92 0.65 15.66 6.97 95% 0.63 3 1.4 -
AOL AOL Inc 50.01 -0.1% -0.0 106 -0.20 50.81 35.60 95% 1.17 -1 1.9 -
HCA HCA Hldg Inc 81.83 0.0% 0.0 79 0.09 83.88 52.37 93% 1.47 1 3.2 -
CTAS Cintas Corp 86.09 0.2% -0.3 79 -0.21 88.23 60.77 92% 1.07 -1 0.6 -
FOLD Amicus Therapeutics Inc 12.31 1.0% 0.4 89 2.56 13.20 2.15 92% 0.50 4 1.9 -
LGCY Legacy Reserves LP Unts 10.04 -2.6% -1.1 7 -4.07 32.61 8.06 8% 0.57 -5 0.5 OS
EVEP EV Energy Partnrs L.P. Com Unt 14.13 -1.3% -0.7 10 -2.08 41.97 11.95 7% 0.63 -5 0.5 -
NSM Nationstar Mortgage Hldg 19.74 -1.0% -0.2 15 -1.32 37.95 18.86 5% 0.94 -1 1.5 -

Tactical Playbook, Week of 1 June 2015
23©2015 Waverly Advisors, LLC. All Rights Reserved. Please review disclosures on the final page of this report.
Screens: RS Strong
Ticker Desc Close Change VolSpike KPos RS 52WkH 52WkL C%52Wk ATR ConsCloses AvgVol Extension
HUM Humana Inc 214.32 20.2% 15.0 200 20.1 219.79 115.51 95% 5.09 1 1.5 OB
BRCM Broadcom Corp'A' 56.85 1.3% 0.2 175 5.28 57.70 30.71 97% 1.34 1 9.0 -
LLY Lilly (Eli) 78.90 3.3% 3.5 141 3.92 79.55 58.50 97% 1.09 6 4.3 OB
AVGO Avago Technologies Ltd 148.07 3.9% 1.6 136 6.28 149.24 68.71 99% 4.49 3 2.9 -
SRPT Sarepta Therapeutics Inc 25.62 0.3% 0.0 136 1.58 35.43 11.33 59% 1.66 1 1.4 -
TWC Time Warner Cable Inc 181.23 -0.6% -0.3 135 1.62 184.89 128.78 93% 3.61 -3 4.2 -
RTRX Retrophin Inc 31.64 4.7% 1.4 133 8.28 31.73 7.85 100% 1.36 1 0.7 -
TMUS T-Mobile US Inc 38.86 1.5% 0.8 127 2.70 39.07 24.26 99% 0.91 1 4.1 -
MDLZ Mondelez Int'l Inc Cl A 41.59 2.9% 3.3 123 2.86 41.60 31.83 100% 0.54 3 10.8 OB
SIMO Silicon Motion Tech Corp ADS 35.46 3.2% 1.3 121 6.61 35.83 15.99 98% 1.01 1 0.7 -
BLUE BlueBird Bio Inc 194.25 1.0% 0.2 118 3.44 197.35 20.01 98% 10.31 6 0.8 -
CNC Centene Corp 75.34 3.9% 2.7 118 4.31 75.50 35.49 100% 1.55 4 1.3 -
CI Cigna Corp 140.91 3.7% 3.4 116 4.22 145.33 85.75 93% 2.52 3 1.8 -
PANW Palo Alto Networks Inc 169.42 1.9% 1.1 115 2.71 169.84 66.77 100% 3.74 2 1.3 OB
PRTA Prothena Corporation plc 39.44 14.6% 4.8 115 15.07 45.00 16.71 80% 1.70 2 0.6 -
AMBA Ambarella Inc 90.21 1.6% 0.5 115 2.94 91.84 24.12 98% 3.03 1 1.4 -
SYNA Synaptics Inc 99.64 0.4% 0.1 113 1.45 101.14 58.22 97% 2.42 3 0.7 -
GME Gamestop Corp 'A' 43.41 7.0% 3.8 112 6.17 46.59 31.69 79% 1.03 2 1.7 OB
ZTS Zoetis Inc 49.76 1.4% 1.2 112 1.94 49.96 30.43 99% 0.85 1 3.2 -
IDTI Integrated Device Tech 23.66 -0.0% 0.1 111 1.51 24.15 11.94 96% 0.68 3 2.8 -
FSL Freescale Semiconductor Ltd 45.12 1.2% 0.7 111 1.99 45.22 15.29 100% 0.99 7 2.0 -
AET Aetna Inc 117.97 1.4% 1.6 110 1.69 120.15 71.81 95% 1.79 3 2.0 -
NUVA NuVasive Inc 50.55 1.9% 1.5 109 2.53 51.25 32.04 96% 1.15 5 0.7 OB
SWKS Skyworks Solutions 109.36 1.9% 0.6 108 2.41 110.39 41.80 98% 2.83 1 4.5 -
LBTYA Liberty Global plc Cl A 57.53 -0.3% -0.2 107 0.24 58.66 39.95 94% 1.25 -2 2.0 -
NXPI NXP Semiconductors N.V. 112.28 1.4% 0.7 107 2.19 112.81 53.81 99% 2.83 3 3.2 -
TIF Tiffany & Co 93.71 -1.0% -0.4 107 0.99 110.60 82.64 40% 1.88 -1 1.8 -
CIEN Ciena Corp 24.11 0.3% 0.2 107 1.13 24.55 13.77 96% 0.51 3 3.1 -
ANAC Anacor Pharmaceuticals Inc 71.22 2.4% 0.8 107 4.33 72.48 13.19 98% 2.71 5 0.7 -
AOL AOL Inc 50.01 -0.1% -0.0 106 -0.20 50.81 35.60 95% 1.17 -1 1.9 -
HMHC Houghton Mifflin Harcourt Comp 26.38 0.7% 0.4 106 1.57 26.65 17.13 97% 0.70 3 1.0 -
ADXS Advaxis Inc 25.16 8.7% 1.9 104 8.97 25.25 2.50 100% 1.41 2 1.6 -
CPB Campbell Soup 48.32 -0.1% -0.2 103 0.55 48.40 41.15 99% 0.58 -1 1.4 -
RMBS Rambus Inc 15.29 2.5% 1.6 103 3.16 15.48 9.87 97% 0.35 3 0.7 -
AMAG AMAG Pharmaceuticals Inc 69.58 1.3% 0.7 103 2.34 69.74 17.52 100% 2.74 3 0.9 -

Tactical Playbook, Week of 1 June 2015
24©2015 Waverly Advisors, LLC. All Rights Reserved. Please review disclosures on the final page of this report.
Screens: RS Strong (continued)
Ticker Desc Close Change VolSpike KPos RS 52WkH 52WkL C%52Wk ATR ConsCloses AvgVol Extension
MOH Molina Healthcare 72.74 1.4% 0.5 103 1.61 73.98 39.23 96% 1.96 3 0.7 -
CTRP Ctrip.com Intl Ltd 79.87 -0.4% -0.1 102 2.09 87.62 40.74 83% 3.23 -4 3.3 -
ANTM Anthem Inc 167.93 2.2% 1.8 102 2.20 170.98 104.79 95% 2.77 3 1.8 -
SKX Skechers U.S.A. Cl'A' 105.88 -0.6% -0.6 102 -0.67 108.24 42.59 96% 2.65 -1 1.0 -
STRZA Starz Ser A 41.96 0.1% 0.1 101 0.61 42.25 27.31 98% 0.84 4 0.8 -
IMAX Imax Corp 40.35 0.4% 0.7 101 1.49 42.44 24.01 89% 0.81 3 0.7 -
AVY Avery Dennison Corp 61.92 -1.4% -1.5 99 -1.12 63.42 40.58 93% 0.90 -2 0.8 -
ADI Analog Devices 67.96 -0.5% -0.3 99 0.44 68.75 42.57 97% 1.28 -1 2.4 -
NFLX Netflix Inc 624.06 -0.4% -0.3 97 -0.27 631.44 315.54 98% 11.88 -2 2.6 -
AOS A O Smith Corp 71.36 -0.3% -0.4 97 0.25 71.75 44.60 99% 1.03 -1 0.5 -
INTC Intel Corp 34.51 1.4% 1.2 96 1.78 37.90 26.18 71% 0.57 3 31.6 OB
LBTYK Liberty Global plc Cl C 53.75 0.5% 0.3 96 0.47 54.74 39.31 94% 1.08 1 2.8 -
ALTR Altera Corp. 48.85 4.3% 1.4 96 3.97 50.10 30.47 94% 1.50 1 6.7 -
ALNY Alnylam Pharmaceuticals 131.09 2.1% 0.8 95 2.67 133.96 51.93 97% 4.77 1 0.8 -
MSCC Microsemi Corp 36.39 0.9% 0.5 95 1.63 37.41 20.61 94% 0.75 3 0.6 -
GT Goodyear Tire & Rub 31.85 -0.6% -0.5 94 -0.50 32.51 18.87 95% 0.61 -2 3.5 -
CRI Carter's Inc 103.22 0.0% 0.0 94 0.59 103.93 67.57 98% 1.47 3 0.6 -
YOKU Youku Tudou Inc 26.96 -2.3% -0.4 93 -1.84 31.40 11.85 77% 1.85 -1 4.3 -
EXAS Exact Sciences 27.01 -0.1% -0.1 93 1.34 29.97 13.02 83% 1.14 -2 1.6 -
VRX Valeant Pharma Intl Inc 238.55 -1.2% -1.1 93 -0.52 246.01 106.00 95% 5.06 -1 2.1 -
HLF Herbalife Ltd 52.03 0.7% 0.1 93 0.78 69.69 27.60 58% 1.82 3 2.5 -
HOLX Hologic Inc 35.77 1.4% 1.0 93 1.57 35.93 22.70 99% 0.59 1 1.6 -
SGMS Scientific Games Cl'A' 15.22 0.3% 0.1 92 0.65 15.66 6.97 95% 0.63 3 1.4 -

Tactical Playbook, Week of 1 June 2015
25©2015 Waverly Advisors, LLC. All Rights Reserved. Please review disclosures on the final page of this report.
Disclaimers & Contact
Waverly Advisors, LLC
5607 Pittsford-Palmyra Rd. #1034Pittsford, NY 14534
(607) 684-5300 or [email protected]
The Tactical Playbook (“The Report”) is a newsletter published by Waverly Advisors LLC. Receipt of The Report is subject to terms of service: http://waverlyadvisors.com/legal/terms-of-service/
Waverly Advisors uses reasonable care in preparing and publishing The Report, however, Waverly Advisors does not guarantee The Report’s accuracy or completeness. Opinions expressed in The Report are subject to change without notice. The Report, and www.waverlyadvisors.com (“The Website”) and all information provided therein should not be construed as a request to engage in any transaction involving the purchase or sale of securities, futures contracts, commodities, currencies and/or options thereon. The risk of loss in trading securities, futures contracts, commodities, currencies and/or op-tions thereon is substantial, and investors should carefully consider the inherent risks of such an investment in light of their financial condition and discuss with their financial advisor(s). The information provided in The Report is not designed to replace your own decision-making processes.
Hypothetical or simulated performance results have certain inherent limitations. Unlike an actual performance record, simulated results do not represent actual trading. Also, since the trades have not actually been executed, the results may have under- or over-compensated for the impact, if any, of certain market factors, such as lack of liquidity. Simulated trading programs in general are also subject to the fact that they are designed with the benefit of hindsight. No representation is being made that any account will or is likely to achieve profits or losses similar to those shown.
Copyright © Waverly Advisors, LLC 2015. All rights reserved. All material presented in this document, unless specifically indicated otherwise, is under copyright to Waverly Advisors, LLC. None of the material, nor its content, nor any copy of it, may be altered in any way, or transmitted to or distributed to any other party, without the prior express written permission of Waverly Advisors, LLC.
This report is limited for the sole use of clients of Waverly Advisors, LLC. Any redistribution of this report or of its content will violate the terms of service.

This page intentionally left blank.
Tactical Portfolio Outlook begins on the following page.

©2015 Waverly Advisors, LLC. All Rights Reserved. Please review disclosures on the final page of this report.
Market perspectives for the long-term investor and portfolio allocator
Waverly Advisors, LLC
Adam GrimesChief Investment [email protected]@waverlyadvisors.com
Contact Sales: (607) [email protected]
Tactical Portfolio OutlookWeek of 1 June 2015
Contents
Portfolio Perspective 28Market Bias 29U.S. Equities 30U.S. Equity Sectors 31U.S. Individual Stocks 32Global Stocks 34Rates & FX 35Commodities 36Macroeconomics 37Hedging: Context & Strategies 38Market insight 39Equity Trading Model 40Relative Strength Rankings 42Disclaimers & Contact 43
Market Return Vol-adj Kpos Trend VolatilityUSA (0.88%) (0.6σ) 61 Normal BullEurope (2.22%) (1.2σ) 55 Normal Bull/NeutralAsia (2.03%) (1.2σ) 60 Normal Bull/NeutralDeveloped (2.05%) (1.3σ) 60 Volatile Bull/NeutralEmerging (3.79%) (1.5σ) 42 Normal Bull/Neutral30 Yr Tr 1.79% 1.0σ 34 Volatile Bear/NeutralEuro (0.22%) (0.1σ) 33 Normal Bear/NeutralYen 2.11% 2.4σ 102 Normal BullGold (1.25%) (0.5σ) 42 Quiet Bear/NeutralCrude 0.97% 0.2σ 54 Normal Bear/Neutral
Last Week’s Performance
MarketShort term (< 1 month)
Int. Term (2-12 months)
US stocks Up Up (Lead)Europe Stocks UpAsia Stocks UpUS Rates Flat Flat/downUS Treasuries DownUS Dollar Up UpGold Down DownOil Bottoming?
Major Market Direction and Bias
▶ Stocks consolidate with no clear short-term direction.
– Longer-term bull market is clear and intact. Any concerns over direction are only relevant to shorter timeframes.
– Longer-term investors should focus on holding heavy long exposure to stocks.
▶ For portfolio allocators, we are moving to an underweight in Industrials this week. Tactical traders can look for potential shorts in the sector.
▶ The US Dollar continues to point higher. Watch resolution of daily bull flags for insight into Dollar strength and psychol-ogy.
▶ Expect another selloff in bond futures, but do not assume that this means a change in longer-term trend.
▶ Market conditions could become even more difficult, as volume and volatility traditionally contract over the next few months. Tactical traders must carefully pick entries and focus on trade management.
▶ Crude oil is probably putting in a longer-term bottom, but remember that a bottom is a process—formation of the bottom can take many months and can see much further declines in oil before that bottom is established.
▶ A number of other commodities (grains, sugar, copper) point lower over the coming weeks.

Tactical Portfolio Outlook, Week of 1 June 2015
28©2015 Waverly Advisors, LLC. All Rights Reserved. Please review disclosures on the final page of this report.
Portfolio Perspective
Global stocks are stuck in consolidation; there is the possibility of increasing volatil-ity and risk, heading into the summer months, though the first part of the year saw stocks carve out moderate gains into the end of May. We also have a shift in sector allocation this week, moving to an underweight on Industrials for tactically-aware allocators.
Developed Markets StocksStocks continue to languish, responding to concerns over growth, revisions of first quarter growth numbers, speculation on impending US rate changes, and concerns over the ongoing Greek drama. Together, these factors have effectively stopped any rally attempt, and Europe, at least, now appears set to attempt a further selloff.
Longer-term charts of Europe show a pattern of a sharp breakdown in the first half of 2014, followed by a moderate year-long rally that brings stocks near the 2014 highs. One of the characteristics of market behavior, on all timeframes, is that sharp moves tend to create a second move in the same direction. In other words, a sharp decline will usually set up another selloff following a minor bounce. This leads to some of the classic technical trading strategies, such as “pullback trading”, and these strategies do show a consistent statistical edge over a wide range of markets, time-frames, and time periods.
This looming bearish potential in Europe is one of the strongest negative factors we see in stocks. Over the past year, there have been numerous attempted breakdowns that have all failed. However, recent rally attempts have failed, and short-term mo-mentum, particularly in France and Germany (which, obviously, are important drivers for EU stocks) now point down. We do not expect a large-scale selloff, as a number of positive factors counterbalance the bearish potential, but we also do not want to blindly buy weakness in Europe. Perhaps the best way to say it is to expect the best, but be on guard for a sharp flush.
Longer-term, we still think the best chances for global stock leadership lie in the US, and likely with US smaller-caps. The next few weeks will give us better insight into the large-cap/small-cap debate, but structural factors still support smaller-cap leadership, and the moderate upturn in smaller-cap relative performance bolsters this theory.
US Sector WeightingOur sector weighting has been stable and basically unchanged for many quarters. We do not adjust these weightings frequently, for a number of reasons: we do not actively trade sector relative performance, and portfolio managers are not always free to make rebalancing on a whim. We understand that many allocators make ad-justments on a monthly (or less frequent) cycle.
Even more important is the nature of sector performance. Rotation and noise is an ever-present feature of equity markets; it is counterproductive to respond to every jiggle of the market. Our models strike a good balance between ignoring short-term noise and focusing on significant movements.
Industrials appear to be set for continued underperformance. Though this is driven by a few key industries within the sector, we think that the underperformance could be persistent and could spread to a broad swath of Industrials. We advise under-weights on the sector at this time, and also hold underweights on Materials.
It is worth noting that cyclical sectors continue to hold strength well, even in con-solidating, back and fill markets; this is likely strongly supportive of the larger bull market, and we think is information that may not be readily apparent to all market participants.
Emerging and Frontier Market StocksLarger patterns are built from the aggregation of shorter term price movements. On shorter timeframes, we continue to see EM and FM indices absorb selling less well (in other words, be hit harder on declines) than Developed Markets stocks. We think that EM and FM indexes are primarily a source of risk and volatility at this time, and that this additional risk does not bring the compensation of higher proba-bility of strong returns. It is difficult to see a place for heavy EM and FM allocations in portfolios at this time, and smaller allocations are likely to carry larger mental and emotional risks than might be expected. (Psychological and behavioral factors are often underestimated in portfolio management.) For now, leave FM and EM stocks to active traders, and wait for better market conditions to support allocations.

Tactical Portfolio Outlook, Week of 1 June 2015
29©2015 Waverly Advisors, LLC. All Rights Reserved. Please review disclosures on the final page of this report.
Market Bias

Tactical Portfolio Outlook, Week of 1 June 2015
30©2015 Waverly Advisors, LLC. All Rights Reserved. Please review disclosures on the final page of this report.
U.S. Equities

Tactical Portfolio Outlook, Week of 1 June 2015
31©2015 Waverly Advisors, LLC. All Rights Reserved. Please review disclosures on the final page of this report.
U.S. Equity Sectors ▶ We are moving to an underweight in Industrials this week, based on patterns
of relative flows that point to continued underperformance. We will monitor market develops and may look to readjust within the next 4-6 weeks if not confirmed by market action.
▶ Generally, cyclical sectors have held strength well in the market’s consolida-tion and leadership has been intact, even in a directionless market. This is both a bullish factor for the broad market, and also confirmation of leader-ship potential in those sectors.
▶ We hold overweights in Healthcare, Discretionary, and Tech and an under-weight in Industrials and Materials.
▶ We would avoid heavy exposures in defensive sectors at this time.

Tactical Portfolio Outlook, Week of 1 June 2015
32©2015 Waverly Advisors, LLC. All Rights Reserved. Please review disclosures on the final page of this report.
U.S. Individual Stocks ▶ Broad market still appears to be setting up an upside break, but a large con-
solidation area introduces uncertainly.
▶ We would approach this week with equal bias to long and short positions, but being prepared to cut losses on one group if the market picks a clear di-rection. Again, the direction appears to be up, but there is the possibility of a sharp, downward break that could offer good profits for nimble traders.
▶ Good setups in individual stocks abound this week. Focus on pullbacks and potential breakouts. (Breakouts of pullback patterns are even more power-ful.)
▶ Be prepared to adjust if the market shows no follow-through, but expect at least a second trend leg to any sharp broad market break.
Key: Near (yellow) and Far (red) stops for daily bars. Colored band beneath the chart indicates trend condition (bright green to bright red = strong bull to strong bear trend.)
Key: ! = overextension, !* = extreme overextension
Sector Leaders & Laggards
EnergyLeaders RIG, COG, MPC, SLB, NFX, WMB
Laggards BTU!*, CNX!*, CHK, DNR, QEP, ESV
IndustrialsLeaders PLL!*, EFX, DE, ALLE, CTAS, SNA
Laggards KSU!*, NSC!*, JOY!, UNP!, LUV!, CHRW!*
TechnologyLeaders BRCM!*, AVGO!*, ALTR!, ADI!, XLNX, JBL
Laggards WIN, FTR!*, FSLR!*, TDC!, ADSK!*, CTL!
MaterialsLeaders AVY!, CF, VMC, NEM, LYB, DOW
Laggards FCX!*, AA!*, FMC, IP, ARG, MOS
Discretionary
Leaders CVC!, NFLX!*, TWC!*, GME!*, GT!, EXPE
LaggardsKORS!*, WYNN!*, FOSL!*, COH!*, HOG!*, URBN!*
FinancialsLeaders AIZ, GS, ETFC, SCHW, BK, ZION
Laggards HCP, NAVI, HCN, KIM, AMP, PLD
StaplesLeaders KRFT, MDLZ!*, ADM, CAG, CPB!*, EL
Laggards KMB, GMCR!*, WFM!*, AVP, WMT!*, PG!
HealthcareLeaders HUM!*, CI!*, MYL, REGN, AET!*, THC
Laggards ALXN, CERN, VAR, BAX, ISRG, LH
UtilitiesLeaders NI, AES, POM, PPL, GAS, PEG
Laggards AEE, CNP, WEC, TEG, SCG, DUK

Tactical Portfolio Outlook, Week of 1 June 2015
33©2015 Waverly Advisors, LLC. All Rights Reserved. Please review disclosures on the final page of this report.
U.S. Individual Stocks (continued)

Tactical Portfolio Outlook, Week of 1 June 2015
34©2015 Waverly Advisors, LLC. All Rights Reserved. Please review disclosures on the final page of this report.
Global Stocks ▶ Uncertainty and volatility dominate both Europe and Asia. Though these
actions may be at least somewhat news-driven, there are likely deeper psycho-logical factors.
▶ Europe has had multiple failures over recent months. We view recent action as a minor failure of bullish patterns; it appears the ball now passes to the bears, and we will look to see if these markets can develop any downward momentum.
▶ We are still watching Russia, expecting a spot to buy weakness. This will be the proverbial “buy when there is blood in the streets” trade—wait for a clear tactical entry.
▶ Longer-term factors still point solidly upward, but respect the downside po-tential in the intermediate term.

Tactical Portfolio Outlook, Week of 1 June 2015
35©2015 Waverly Advisors, LLC. All Rights Reserved. Please review disclosures on the final page of this report.
Rates & FX ▶ US Dollar still points higher. Small pauses (on daily chart) can give tactical
traders short-term entries in the USD or other currencies.
▶ Expect a more directional environment in many currencies over the coming weeks. Also, consider risk of correlated USD-driven exposures.
▶ Bond futures are probably setting up another selloff (both US and Euro-bonds). This does not mean that the longer-term trend is turning, but it does introduce additional volatility and uncertainly.

Tactical Portfolio Outlook, Week of 1 June 2015
36©2015 Waverly Advisors, LLC. All Rights Reserved. Please review disclosures on the final page of this report.
CommoditiesMetals:
▶ Still floundering with no short-term momentum. Longer-term direction points down, but respect stops on shorts.
Energy:
▶ Late week action potentially erodes much of the short-term bearish bias. Neutral, and probably putting in a longer-term bottom.
Grains & Softs:
▶ Grains continue to point broadly lower.
▶ Hold shorts in sugar, but watch action around previous pivot lows. Do not short into strength.

Tactical Portfolio Outlook, Week of 1 June 2015
37©2015 Waverly Advisors, LLC. All Rights Reserved. Please review disclosures on the final page of this report.
Macroeconomics ▶ Economic numbers continue to be mixed and offer only confusion. This is
true both at home and abroad, as first quarter growth numbers disappoint globally.
▶ Psychologically, Greece continues to weigh heavily on markets. We think that developments here are more important behaviorally than they are in light of any actual, potential economic impact, but market reactions are telling.
▶ Volatility and volume are both entering seasonally weak periods. This is likely to lead to thin, low-liquidity markets (in stocks), that bring risks of sharp spikes.
▶ Home sales and labor market developments are strong points for the US, but concerns over future Fed action seem to dominate any discussion of market dynamics. Though this emphasis is misplaced, it pays to understand the psy-chology of the average investor.

Tactical Portfolio Outlook, Week of 1 June 2015
38©2015 Waverly Advisors, LLC. All Rights Reserved. Please review disclosures on the final page of this report.
Hedging: Context & Strategies
▶ Market direction still points upward, but lack of short-term momentum confuses the picture.
▶ Tactical risks are low to moderate. The main risks in coming weeks are likely to be sharp, but short-lived declines.
▶ We favor hedging partial portfolio exposures against moderate declines (<20%) over the next year.
▶ Our general advice to hedgers is to look to add on market rallies, when im-plieds and emotions are low. Hedging within tight consolidations (e.g., last week) makes sense, especially as implieds contract. These low implieds make outright puts and ratio spreads (but not simple put spreads) ideal structures.
Key: Dotted line = S&P 500, Gray = Options, Orange = Combined Portfolio

Tactical Portfolio Outlook, Week of 1 June 2015
39©2015 Waverly Advisors, LLC. All Rights Reserved. Please review disclosures on the final page of this report.
Market insight
Friday’s trading marked the end of the month. Many traders use ends of periods (months, quarters, years) to evaluate performance, and as a psychological road marker. Let’s take a few moments today to look back at the year in review and to consider the “end of period”(especially quarter and year) effect as it relates to stocks.
Year in reviewIt is no secret that this has been a challenging and difficult market for many traders. We have seen relatively directionless environments in many assets, but it also may be surprising to realize that stocks have held on to some minor, but possibly significant gains. The S&P 500 is up 2.4% to the end of May—not terrible underperformance of the long-term average (which comes in somewhere around 7.5%), and the Russell 2000 is leading with about 3.5% gain for the year. Europe is up nearly 6% (USD-ba-sis). These are small, but solid gains for stocks in a period of conflict, growth con-cerns, and structural consolidation.
The US Dollar index is up about 7.5% from the end of last year, after advancing to a peak gain of about 11%. We see every sign that points to continued Dollar strength through the end of the year. Expect that USD strength could put a weight on many commodities: grains are down roughly 9%, while gold and crude are roughly flat for the year.
Expect contraction in both volatility and volume through the summer months; this is simply typical market behavior and it has been so for most years of the past three decades. However, low liquidity conditions do bring the possibility of a vol-atile spike, and markets do not like surprises. This is why it is important to clarify your timeframe and trading style: longer-term investors will need to ignore summer noise, knowing that the day to day swings may, at times, be very boring or very vol-atile, and more active traders need to be prepared to respond with flexibility. Two factors could lead to a better swing trading environment, and these demand atten-tion over the coming weeks: watch for a breakout in stocks, and for a continuation of the US Dollar’s rally.
End of quarter (or year) effectMany investors and authors talk about an end of the quarter or end of the year effect.
The assumption is that funds generally rebalance on a predictable schedule: perhaps they sell underperforming assets or buy more assets that show strong returns. (Per-haps they also book partial profits, reducing exposures on winners that have grown too large due to price appreciation.) There are many investment plans built around this concept, but there is one problem: there is not a shred of evidence that it works.
It should be relatively easy to tease out the end of the quarter effect, if it exists. It should be visible as an increase in volume (it is not), and probably as an influence of the relative performance of leading and trailing assets and individual stocks (it is not). Despite a lack of statistical support, it is a good story—it is easy to understand why it should be so and why it might work. Furthermore, people (individually and in the aggregate) do think of the year as divided into regular periods, so many peo-ple continue to focus attention on this idea.
There are two points that bear further consideration. Some research suggests that there is an impact in strongly declining markets, that it appears funds and investors “rebalance” by selling more of underperformers into the end of the quarter. This is visible as a small, but persistent edge of further underperformance in declining stocks near the quarters’ end. Perhaps the most valuable lesson is to guard against this tendency ourselves, and perhaps even to trade against it. Second, the January effect is sometimes offered as an example of rebalancing, This may be true, but the January effect is complicated—it is not clear in all slices of the data, appears to be weakening over time, and is largely (or completely) explainable as a result of size effect. At the very least, it is difficult to exploit in any investment program.
Avoid attaching too much significance to end of quarter performance. The message of the market and market structure is more important than artificial time divisions. Focus on the coming opportunities, and on managing the risk in potentially thin summer markets.

Tactical Portfolio Outlook, Week of 1 June 2015
40©2015 Waverly Advisors, LLC. All Rights Reserved. Please review disclosures on the final page of this report.
Equity Trading Model
Ticker Name Last Near Stop Far Stop Buy Level Sell Level Trend Shocks (+/-) RS(SP500) C%52Wk
SPY SPDR S&P 500 ETF 211.14 207.65 203.56 Bull 8/252 (3/5) 1.65 91.7
QQQ PwrShs QQQ Trust Ser 1 110.05 106.98 104.24 113.45 Bull 6/252 (2/4) 4.11 94.7
IWM iShs Russell 2000 ETF 123.89 120.54 117.25 119.94(C) Bull 5/252 (1/4) 2.71 86.3
Active StocksAA Alcoa Inc 12.50 12.09 12.06 12.38(C) Bear 7/252 (7/0) -12.68 1.1
AAL American Airlines Grp inc 42.37 41.37 41.37 41.52(C) Bear 11/252 (9/2) -5.94 50.8
AAPL Apple Inc 130.28 125.34 120.26 136.86 Bull 4/252 (2/2) 8.26 90.7
ABBV AbbVie Inc 66.59 63.81 61.02 69.61 Bull/Neut 6/252 (3/3) 5.41 78.5
ABX Barrick Gold 11.86 [11.98] 11.17 Bull/Neut 8/252 (5/3) -8.09 19.3
AMAT Applied Materials 20.13 19.06 18.03 18.99(C) Bear 6/252 (3/3) -6.48 21.2
BABA Alibaba Group Holding Ltd 89.32 87.95 83.21 95.49 N/A 0/0 (0/0) -2.86 N/A
BAC Bank of America Corporation 16.50 16.08 15.56 Bear/Neut 10/252 (6/4) 1.63 49.3
BRCM Broadcom Corp'A' 56.85 53.69 51.02 [52.95] Bull 4/252 (2/2) 32.96 96.7
C Citigrp Inc 54.08 52.80 51.08 52.11(C) Bull/Neut 6/252 (5/1) 1.67 72.4
CHK Chesapeake Energy Corp 14.11 13.38 12.05 Bear 11/252 (5/6) -20.74 4.0
CMCSA Comcast Cl'A' 58.46 56.10 54.31 55.22(C) Bull/Neut 7/252 (6/1) 1.99 79.3
CSCO Cisco Systems 29.31 28.37 27.34 Bull 9/252 (3/6) 4.00 87.2
CSX CSX Corp 34.08 32.97 32.55 34.07(S) Bull/Neut 7/252 (3/4) -2.77 56.8
DAL Delta Airlines Inc 42.92 40.93 40.93 Bear 9/252 (5/4) -2.19 61.1
EMC EMC Corp 26.34 25.51 24.52 25.37(C) Bear 11/252 (3/8) -5.13 21.7
F Ford Motor 15.17 14.91 14.72 15.16(S) Bull/Neut 6/252 (3/3) -4.21 39.3
FB Facebook Inc 79.19 76.67 73.49 Bull/Neut 7/252 (3/4) 3.02 71.7
FCX Freeport-McMoRan Inc 19.65 19.62 19.62 19.30(C) Bear/Neut 8/252 (4/4) -18.57 14.1
FOXA Twenty-First Century Fox Inc A 33.60 32.73 31.67 32.35(C) Bear 8/252 (3/5) -4.23 31.4
GE General Electric 27.27 26.25 25.22 Bull/Neut 7/252 (5/2) 1.75 73.2
GG Goldcorp Inc 17.76 16.52 16.48 16.84(C) Bear 7/252 (2/5) -11.23 5.9
GM General Motors Co 35.97 34.75 33.53 34.07(C) Bull/Neut 8/252 (4/4) 2.94 70.3
HAL Halliburton Co 45.40 42.20 41.24 Bear/Neut 10/252 (5/5) -5.32 22.1
INTC Intel Corp 34.46 32.71 31.35 31.55(C) Bear/Neut 9/252 (6/3) 4.08 68.6
ITUB Itau Unibanco Multiplo S A 10.70 [10.91] [10.91] Bear 5/252 (3/2) -18.46 6.9
JPM JPMorgan Chase & Co 65.78 64.12 62.07 68.45 Bull 6/252 (3/3) 5.93 89.1
KO Coca-Cola Co 40.96 40.13 39.26 39.87(C) Bear/Neut 7/252 (3/4) -2.39 32.0
KRFT Kraft Foods Grp Inc 84.45 81.80 78.69 Bull 5/252 (3/2) 21.46 81.9
MGM MGM Resorts Intl 20.05 18.56 18.24 18.52(C) Bull/Neut 9/252 (4/5) -8.60 27.0
MSFT Microsoft Corp 46.86 45.69 43.55 50.16 Bull/Neut 11/252 (6/5) 2.40 68.8

Tactical Portfolio Outlook, Week of 1 June 2015
41©2015 Waverly Advisors, LLC. All Rights Reserved. Please review disclosures on the final page of this report.
Equity Trading Model (continued)
Ticker Name Last Near Stop Far Stop Buy Level Sell Level Trend Shocks (+/-) RS(SP500) C%52Wk
MU Micron Tech 27.93 26.09 24.41 25.47(C) Bear 5/252 (3/2) -4.96 21.1
MYL Mylan NV 72.63 65.31 60.36 Bull 8/252 (6/2) 19.40 87.3
ORCL Oracle Corp 43.49 42.21 40.87 Bull/Neut 5/252 (2/3) 1.08 70.4
PBR Petroleo Brasileiro S.A. ADS 8.35 [8.86] 7.89 Bull/Neut 5/252 (3/2) -6.67 21.5
PFE Pfizer Inc 34.75 33.50 32.50 Bull 9/252 (6/3) 5.91 90.3
QCOM Qualcomm Inc 69.68 67.47 64.90 66.49(C) Bear/Neut 9/252 (2/7) -2.20 37.7
RF Regions Finl Corporation 10.09 9.81 9.41 9.60(C) 10.68 Bull/Neut 8/252 (5/3) 1.40 63.6
RIG TransOcean Ltd 18.85 18.25 16.65 Bull/Neut 5/252 (2/3) -10.16 17.0
SDRL Seadrill Limited 11.91 11.68 11.44 11.90(S) Bull/Neut 9/252 (2/7) -20.06 10.5
SUNE SunEdison Inc 29.97 28.29 26.29 31.79 Bull 9/252 (6/3) 24.27 92.8
T AT&T Inc 34.54 33.58 32.49 35.94 Bull 8/252 (2/6) -0.49 45.7
TSM Taiwan Semiconductor Mfg ADS 24.28 23.26 22.44 Bull/Neut 8/252 (2/6) 3.10 76.7
TWTR Twitter Inc 36.67 32.40 29.72 34.43(C) Bear 0/0 (0/0) -9.15 N/A
VIPS Vipshop Hldg Ltd 24.97 23.12 22.32 Bull/Neut 4/252 (2/2) 6.41 60.9
VZ Verizon Communications 49.44 48.40 48.02 Bull 6/252 (2/4) -0.50 50.8
WFC Wells Fargo 55.96 54.55 53.12 53.96(C) 57.80 Bull 9/252 (6/3) 2.90 92.8
WLL Whiting Petro 32.99 29.12 27.58 Bear/Neut 11/252 (5/6) -19.43 12.9
XLE S&P Sel Energy Spdr Fd 78.39 76.56 75.12 78.38(S) Bear/Neut 7/252 (4/3) -5.84 22.4
XOM Exxon Mobil 85.20 83.02 80.83 83.18(C) Bear 8/252 (3/5) -5.58 11.4
XRX Xerox Corp 11.42 10.63 10.01 10.78(C) Bear 6/252 (3/3) -8.14 9.3
YHOO Yahoo Inc 42.94 41.24 39.37 40.59(C) Bear/Neut 9/252 (4/5) -1.92 50.8
Key: Potential entry points for managers looking to initiate or add to positions are indicated by entry at or below the Buy Level. Two models generate these entries, Slingshot (S) and Catapult (C). Both models are based on the concept of buying weakness against trend integrity; Catapult is generally requires a stronger selloff to generate an entry. Both models only trigger under certain conditions, leaving some names without potential entries in some cases. The Near and Far Trailing stops give statistically-valid risk points for long positions. Many managers will treat the near level as a warning, and use the far level as a hard stop. The Sell Level is another trading model that sets up under conditions of extreme strength, highlighting potential profit targets for managers looking to reduce exposure or book partial profits on winners

Tactical Portfolio Outlook, Week of 1 June 2015
42©2015 Waverly Advisors, LLC. All Rights Reserved. Please review disclosures on the final page of this report.
Relative Strength Rankings
International Now Chg VRat US Sectors (SP1500) Now Chg VRat US Industries (Top) Now Chg VRat US Industries (Bottom) Now Chg VRat
India 1 0 0.7 Health Care 1 0 0.9 HCare Prov & Svcs 1 1 0.9 Electrical Equip 35 -7 1.0
Hong Kong 2 0 0.9 Information Tech 2 1 1.3 Internet & Catalog Ret 2 1 0.6 Communications Equip 36 8 1.1
Japan 3 0 1.0 Consumer Discretionary 3 -1 0.8 Construction Materials 3 -2 0.8 Food & Staples Ret 37 -4 0.8
Taiwan 4 3 0.5 Financials 4 0 1.0 Real Estate Mgmt&Dev 4 0 0.3 Internet Soft &Svcs 38 0 1.1
Nthrlands 5 -1 1.4 Consumer Staples 5 2 0.8 Wireless Telcom Svcs 5 2 0.9 Comm Svcs & Supplies 39 3 1.0
Israel 6 0 0.6 Materials 6 0 1.0 Building Products 6 0 0.9 Multi-Utilities 40 6 0.4
Switzerland 7 2 1.5 Utilities 7 2 0.5 Semis & Semi Equip 7 9 1.3 Elec Equip & Cmpnnts 41 -5 0.9
S&P 500 Index 8 0 1.0 Telcom Svcs 8 0 0.6 BioTech 8 -3 1.0 Aerospace & Defence 42 -7 0.8
UK 9 2 1.0 Industrials 9 -4 0.9 Pharmaceuticals 9 12 0.9 Insurance 43 -11 1.0
S Korea 10 -5 1.2 Energy 10 0 0.6 Food Products 10 9 0.5 Construction & Eng 44 13 1.1
Phlippnes 11 -1 1.3 US Industry Groups Now Chg VRat Professional Svcs 11 0 0.9 Leisure Equip & Prds 45 -4 0.6
Sweden 12 4 1.1 Health Care Equip & Svcs 1 0 0.8 Auto Components 12 6 1.0 Beverages 46 6 0.8
Mexico 13 10 0.5 Semis & Semis Equip 2 2 1.3 Comps & Peripherals 13 -5 1.2 Div Telcom Svcs 47 6 0.6
France 14 -2 1.4 Retailing 3 -1 0.9 Specialty Retail 14 0 0.9 Distributors 48 -14 1.2
Singapore 15 0 0.8 Pharma, Biotech & Life Sci 4 -1 0.9 HCare Equip & Supply 15 7 0.9 Electric Utilities 49 7 0.5
Australia 16 8 0.9 Tech Hardware & Equip 5 1 1.3 Capital Markets 16 -3 1.0 REITs 50 5 0.8
Germany 17 -4 1.2 Media 6 2 0.7 IT Svcs 17 -2 1.0 Div Consumer Svcs 51 -4 0.9
Finland 18 1 0.9 Consumer Svcs 7 0 0.8 Software 18 5 1.0 Machinery 52 -9 0.9
Canada 19 1 1.0 Software & Svcs 8 1 1.1 Life Scis Tools & Svcs 19 -9 1.0 Txtils, Apprl & Lux Gds 53 -16 1.4
S Africa 20 -6 1.0 Banks 9 -4 0.9 Thrifts & Mrtg Finace 20 6 0.8 Paper & Forest Products 54 -6 0.9
Indonesia 21 1 0.5 Commercial & Prof Svcs 10 1 1.0 Multiline Retail 21 -1 0.7 Air Freight & Logistics 55 -6 1.1
Thailand 22 -1 1.1 Food Beverage & Tobacco 11 5 0.7 Htls Rests & Leisure 22 2 0.7 Consumer Finance 56 -5 0.8
UAE 23 -5 0.7 Diversified Financials 12 -2 1.0 Media 23 2 0.7 Automobiles 57 2 0.9
Russia 24 -7 0.4 Food & Staples Retailing 13 1 0.8 Containers & Packaging 24 -15 1.1 Ind Pwr Prod & Trdrs 58 0 0.8
Brazil 25 0 1.0 Insurance 14 -2 1.0 Health Care Tech 25 2 0.9 Energy Equip & Svcs 59 2 0.6
Greece 26 0 1.1 Capital Goods 15 0 0.9 Commercial Banks 26 -9 0.9 Household Products 60 0 1.0
US Mkt Cap Indexes Now Chg VRat Materials 16 1 1.0 Industrial Conglomerates 27 3 0.6 Airlines 61 4 0.9
Russell MicroCap Index 1 2 0.9 Automobiles & Compnts 17 1 1.0 Household Durables 28 1 1.0 Oil, Gas&Consmble Fuels 62 1 0.7
US Growth 2 -1 1.1 Utilities 18 2 0.5 Div Financial Svcs 29 2 0.9 Trading Cos & Dists 63 -9 1.5
Russell 2000 Index 3 -1 1.1 Cons Durables & Apparel 19 -6 1.0 Gas Utilities 30 20 0.6 Marine 64 -2 1.2
S&P SmallCap 600 Index 4 0 1.1 Telcom Svcs 20 -1 0.6 Personal Products 31 -19 0.7 Metals & Mining 65 1 0.9
DJ Wilshire 5000 Comp 5 0 1.0 Real Estate 21 0 0.8 Water Utilities 32 8 0.9 Road & Rail 66 -2 0.6
S&P 500 Index 6 -1 1.0 Household & Prsnl Prod 22 0 1.0 Tobacco 33 12 0.6
S&P 100 Index 7 0 1.0 Energy 23 0 0.6 Chemicals 34 5 0.8
US Value 8 0 1.0 Transportation 24 0 0.9

Tactical Portfolio Outlook, Week of 1 June 2015
43©2015 Waverly Advisors, LLC. All Rights Reserved. Please review disclosures on the final page of this report.
Disclaimers & Contact
Waverly Advisors, LLC
5607 Pittsford-Palmyra Rd. #1034Pittsford, NY 14534
(607) 684-5300 or [email protected]
The Tactical Playbook (“The Report”) is a newsletter published by Waverly Advisors LLC. Receipt of The Report is subject to terms of service: http://waverlyadvisors.com/legal/terms-of-service/
Waverly Advisors uses reasonable care in preparing and publishing The Report, however, Waverly Advisors does not guarantee The Report’s accuracy or completeness. Opinions expressed in The Report are subject to change without notice. The Report, and www.waverlyadvisors.com (“The Website”) and all information provided therein should not be construed as a request to engage in any transaction involving the purchase or sale of securities, futures contracts, commodities, currencies and/or options thereon. The risk of loss in trading securities, futures contracts, commodities, currencies and/or op-tions thereon is substantial, and investors should carefully consider the inherent risks of such an investment in light of their financial condition and discuss with their financial advisor(s). The information provided in The Report is not designed to replace your own decision-making processes.
Hypothetical or simulated performance results have certain inherent limitations. Unlike an actual performance record, simulated results do not represent actual trading. Also, since the trades have not actually been executed, the results may have under- or over-compensated for the impact, if any, of certain market factors, such as lack of liquidity. Simulated trading programs in general are also subject to the fact that they are designed with the benefit of hindsight. No representation is being made that any account will or is likely to achieve profits or losses similar to those shown.
Copyright © Waverly Advisors, LLC 2015. All rights reserved. All material presented in this document, unless specifically indicated otherwise, is under copyright to Waverly Advisors, LLC. None of the material, nor its content, nor any copy of it, may be altered in any way, or transmitted to or distributed to any other party, without the prior express written permission of Waverly Advisors, LLC.
This report is limited for the sole use of clients of Waverly Advisors, LLC. Any redistribution of this report or of its content will violate the terms of service.