interactions with threatened, endangered or …...tsolos, a. and boyle, m. (2013). interactions with...
TRANSCRIPT

Interactions with Threatened, Endangered or Protected Species in South Australian Managed
Fisheries – 2009/10, 2010/11 and 2011/12
Angelo Tsolos and Melleessa Boyle
SARDI Publication No. F2009/000544-3 SARDI Research Report Series No. 682
SARDI Aquatic Sciences
PO Box 120 Henley Beach SA 5022
February 2013
Report to PIRSA Fisheries and Aquaculture

Interactions with Threatened, Endangered or Protected Species in South Australian Managed
Fisheries – 2009/10, 2010/11 and 2011/12
Report to PIRSA Fisheries and Aquaculture
Angelo Tsolos and Melleessa Boyle
SARDI Publication No. F2009/000544-3 SARDI Research Report Series No. 682
February 2013

This publication may be cited as: Tsolos, A. and Boyle, M. (2013). Interactions with Threatened, Endangered or Protected Species in South Australian Managed Fisheries – 2009/10, 2010/11, and 2011/12. Report to PIRSA Fisheries and Aquaculture. South Australian Research and Development Institute (Aquatic Sciences), Adelaide. SARDI Publication No. F2009/000544-3. SARDI Research Report Series No. 682. 46pp. Cover Photos: Sea Lion mother and pup and Little Penguin (courtesy of Bradley Page). Leafy Seadragon (courtesy of Shirley Sorokin). Great White Shark (courtesy of Richard Saunders). South Australian Research and Development Institute SARDI Aquatic Sciences 2 Hamra Avenue West Beach SA 5024 Telephone: (08) 8207 5400 Facsimile: (08) 8207 5406 http://www.sardi.sa.gov.au DISCLAIMER The authors warrant that they have taken all reasonable care in producing this report. The report has been through the SARDI internal review process, and has been formally approved for release by the Research Chief, Aquatic Sciences. Although all reasonable efforts have been made to ensure quality, SARDI does not warrant that the information in this report is free from errors or omissions. SARDI does not accept any liability for the contents of this report or for any consequences arising from its use or any reliance placed upon it. The SARDI Report Series is an Administrative Report Series which has not been reviewed outside the department and is not considered peer-reviewed literature. Material presented in these Administrative Reports may later be published in formal peer-reviewed scientific literature. © 2013 SARDI This work is copyright. Apart from any use as permitted under the Copyright Act 1968 (Cth), no part may be reproduced by any process, electronic or otherwise, without the specific written permission of the copyright owner. Neither may information be stored electronically in any form whatsoever without such permission. Printed in Adelaide: February 2013 SARDI Publication No. F2009/000544-3 SARDI Research Report Series No. 682 Author(s): Angelo Tsolos and Melleessa Boyle Reviewer(s): Craig Noell and Andrew Lowther Approved by: Assoc. Prof. T.Ward Science Leader - Fisheries Signed: Date: 8 February 2013 Distribution: PIRSA Fisheries and Aquaculture, SAASC Library, University of Adelaide
Library, Parliamentary Library, State Library and National Library Circulation: Public Domain

South Australian Aquatic Sciences: Fisheries - Information Services
Interactions with Threatened, Endangered or Protected Species in South Australian Managed Fisheries – 2009/10, 2010/11 and 2011/12 i
Acknowledgements
The report is compiled from data supplied by licensed commercial operators. The cooperation of
these licence holders in submitting their data is acknowledged and appreciated.
The authors would like to thank the reviewers Craig Noell, Andrew Lowther and Michelle Besley
(PIRSA) for providing constructive comments on the document.
The report was formally approved for release by Assoc. Prof. Tim Ward and Prof. Gavin Begg
(SARDI Aquatic Sciences).
Reported information collected from South Australian managed fisheries is processed and entered
as described in Vainickis (2010).

South Australian Aquatic Sciences: Fisheries - Information Services
Interactions with Threatened, Endangered or Protected Species in South Australian Managed Fisheries – 2009/10, 2010/11 and 2011/12 ii
Definitions and Explanations
Boat day: Each time a licence holder operates their fishing gear it is considered an individual boat
day. A morning trip and an evening trip on the same day are 2 boat days. Boat days also
accumulate for a change in area, gear and/or target species for that day.
EPBC Act: Environment Protection and Biodiversity Conservation Act 1999.
http://www.environment.gov.au/epbc/index.html
Fisheries Management Act: South Australia Fisheries Management Act 2007.
http://www.legislation.sa.gov.au/LZ/C/A/Fisheries%20Management%20Act%202007.aspx
National Parks and Wildlife Act: South Australian National Parks and Wildlife Act 1972.
http://www.austlii.edu.au/au/legis/sa/consol_act/npawa1972247/
Man days: the number of individuals fishing on the licence, or in a boat operated by the licensee
each day.
MFA: A designated marine fishing area for reporting data. These may vary among fisheries.
PIRSA: Primary Industries and Regions South Australia.
SARDI: South Australian Research and Development Institute.
TEPS: A species classed as threatened, endangered, or protected under the Commonwealth
Environment Protection and Biodiversity Conservation Act 1999 (EPBC), Fisheries Management
Act 2001, or the National Parks and Wildlife Act 1972.
TEPS interaction: any physical contact, collision or capture a fisher, boat or fishing gear has with
any threatened, endangered or protected species.
The “Other” category includes bite offs, animals circling the boat or interacting with fishing gear, and
discovering dead animals whilst in transit.

South Australian Aquatic Sciences: Fisheries - Information Services
Interactions with Threatened, Endangered or Protected Species in South Australian Managed Fisheries – 2009/10, 2010/11 and 2011/12
iii
Table of Contents Executive Summary .......................................................................................................................... 1 Introduction ..................................................................................................................................... 2 Section 1: Wildlife interactions by fishery and method ................................................................... 4 1.1 Abalone Fishery .......................................................................................................... 8 1.2 Blue Crab Fishery........................................................................................................ 8 1.3 Charter Boat Fishery ................................................................................................... 9 1.4 Lakes and Coorong Fishery .......................................................................................10 1.5 Marine Scalefish Fishery ............................................................................................11 1.6 Prawn Fishery ............................................................................................................12 1.7 River Fishery ..............................................................................................................13 1.8 Rock Lobster Fishery .................................................................................................13 1.9 Sardine Fishery ..........................................................................................................14 Section 2: Wildlife interactions by species group ......................................................................... 16 Section 3: Wildlife interactions by month ..................................................................................... 19 Section 4: Wildlife interactions by location................................................................................... 22 Section 5: Wildlife interactions by interaction type ....................................................................... 33 Appendix 1: National Parks and Wildlife Act 1972 - Schedule 7 - Endangered species -
Part 1 - Animals .......................................................................................................... 34 Appendix 2: National Parks and Wildlife Act 1972 - Schedule 8 ..................................................... 35 Appendix 3: National Parks and Wildlife Act 1972 - Schedule 9 ..................................................... 36 Appendix 4: Species Listed Under Part 13 of the EPBC Act as Threatened, Migratory
Marine Species or Cetaceans .................................................................................... 37 Appendix 5: Fisheries Management Act 2007 (SA) Schedule 5 – Protected Species ..................... 38 Appendix 6: The gear types used in commercial fishing operations ............................................... 39 Appendix 7: Additional Reading ..................................................................................................... 40
List of Figures Figure 1: The total number of interactions and total number of animals by month........................ 19 Figure 2: The number of seabirds involved in interactions and the number of
interactions by month. ................................................................................................... 19 Figure 3: The number of reptiles involved in interactions and the number of
interactions by month. ................................................................................................... 20 Figure 4: The number of cetaceans involved in interactions and the number of
interactions by month. ................................................................................................... 20 Figure 5: The number of pinnipeds involved in interactions and the number of
interactions by month. ................................................................................................... 21 Figure 6: The number of fish involved in interactions and the number of interactions by
month. .......................................................................................................................... 21 Figure 7: Seabird interactions in South Australian managed fisheries – 2009/10. ........................ 23 Figure 8: Seabird interactions in South Australian managed fisheries – 2010/11. ........................ 24 Figure 9: Seabird interactions in South Australian managed fisheries – 2011/12. ........................ 24 Figure 10: Reptile interactions in South Australian managed fisheries – 2009/10. ......................... 25 Figure 11: Cetacean interactions in South Australian managed fisheries – 2009/10. ..................... 27 Figure 12: Cetacean interactions in South Australian managed fisheries – 2010/11. ..................... 28 Figure 13: Cetacean interactions in South Australian managed fisheries – 2011/12. ..................... 28 Figure 14: Pinniped interactions in South Australian managed fisheries – 2009/10. ...................... 29 Figure 15: Pinniped interactions in South Australian managed fisheries – 2010/11. ...................... 29 Figure 16: Pinniped interactions in South Australian managed fisheries – 2011/12. ...................... 30 Figure 17: Fish interactions in South Australian managed fisheries – 2009/10. ............................. 31 Figure 18: Fish interactions in South Australian managed fisheries – 2010/11. ............................. 32

South Australian Aquatic Sciences: Fisheries - Information Services
Interactions with Threatened, Endangered or Protected Species in South Australian Managed Fisheries – 2009/10, 2010/11 and 2011/12
iv
Figure 19: Fish interactions in South Australian managed fisheries – 2011/12. ............................. 32 Figure 20: The number of animals encountered by interaction type by financial year. ................... 33 Figure 21: The number of interactions by interaction type by financial year. .................................. 33
List of Tables Table 1: The number of interactions and animals involved by fishery by financial year. ................ 4 Table 2: The number of interactions and animals involved by gear type by financial
year. ............................................................................................................................... 5 Table 3: TEPS interactions by taxonomic group by fishing method in South Australian
commercial fisheries (all fisheries combined) 2009/10. ................................................... 6 Table 4: TEPS interactions by taxonomic group by fishing method in South Australian
commercial fisheries (all fisheries combined) 2010/11. ................................................... 7 Table 5: TEPS interactions by taxonomic group by fishing method in South Australian
commercial fisheries (all fisheries combined) 2011/12. ................................................... 7 Table 6: TEPS interactions in the Abalone Fishery in 2009/10, 2010/11 and 2011/12. ................. 8 Table 7: TEPS interactions in the Blue Crab Fishery in 2009/10, 2010/11 and
2011/12. ......................................................................................................................... 9 Table 8: TEPS interactions in the Charter Boat Fishery in 2009/10, 2010/11 and
2011/12. ....................................................................................................................... 10 Table 9: TEPS interactions in the Lakes and Coorong Fishery in 2009/10, 2010/11
and 2011/12. ................................................................................................................ 11 Table 10: TEPS interactions in the Marine Scalefish Fishery in 2009/10, 2010/11 and
2011/12. ....................................................................................................................... 12 Table 11: TEPS interactions in the Prawn Fishery in 2009/10, 2010/11 and 2011/12. .................. 13 Table 12: TEPS interactions in the Sardine Fishery in 2009/10, 2010/11 and 2011/12. ................ 15 Table 13: TEPS interactions by species group in 2009/10. ........................................................... 16 Table 14: TEPS interactions by species group in 2010/11. ........................................................... 17 Table 15: TEPS interactions by species group in 2011/12. ........................................................... 18 Table 16: TEPS interactions by interaction type by financial year. ................................................ 33 Table 17: National Parks and Wildlife Act 1972 - Schedule 7 – Endangered Species –
Part 1 – Animals. .......................................................................................................... 34 Table 18: Species listed under part 13 of the EPBC Act as Threatened, Migratory
Marine Species or Cetaceans. ...................................................................................... 37 Table 19: Commercial fishing gear descriptions and codes. ......................................................... 39

South Australian Aquatic Sciences: Fisheries - Information Services
Interactions with Threatened, Endangered or Protected Species in South Australian Managed Fisheries – 2009/10, 2010/11 and 2011/12
1
Executive Summary
This report updates the 2011 report and documents interactions with threatened, endangered or
protected species (TEPS) within South Australian commercial fisheries.
The report was compiled using data submitted to South Australian Research and Development
Institute voluntarily by commercial licence holders. The report includes data from three financial
years of operation, 2009/10, 2010/11 and 2011/12.
During the reporting period, SARDI was advised of 582 interaction events during fishing operations
involving 1,921 animals. Of these interactions, 1,802 animals (94%) were released or escaped, and
119 animals died.
In 2009/10, 80 of the 178 interactions occurred in the Lakes and Coorong Fishery, 77 in the Sardine
Fishery, and 12 in the Marine Scalefish Fishery. In 2010/11, 70 of the 172 interactions occurred in
the Prawn Fisheries, 52 in the Lakes and Coorong Fishery, and 44 in the Sardine Fishery. In
2011/12, 116 of the 232 interactions occurred in the Prawn Fisheries and 111 in the Sardine
Fishery.
Dolphins accounted for 179 of the 823 TEPS encountered in 2009/10, 127 of the 597 TEPS in
2010/11, and 303 of the 501 TEPS in 2011/12.
There were 917 individual pinnipeds involved in interactions; 531 in 2009/10; 381 in 2010/11, and
five in 2011/12. The 2009/10 and 2010/11 data are skewed by a large number of seals interacting
with fishing gear in the Lakes and Coorong Fishery.
During 2009/10, 282 (34%) of the animals involved in an interaction were caught or entangled
during fishing operations. In 2010/11, there were 215 (36%) caught or entangled, and 414 (83%) in
2011/12. “Other” interactions were more prevalent in 2009/10 (538 animals) and in 2010/11 (382
animals).
Over the three year period 97% of the encounters involved trawl or net operations.
In 2009/10, nine dead animals were reported during fishing operations. In 2010/11, 25 animals died
during fishing operations, and in 2011/12, 85 animals died during fishing operations.
The accuracy of the data for some fisheries provided in the wildlife interaction logbook is unknown
because it has not been validated by fishery-independent means.

1: Introduction
South Australian Aquatic Sciences: Fisheries - Information Services
Interactions with Threatened, Endangered or Protected Species in South Australian Managed Fisheries – 2009/10, 2010/11 and 2011/12
2
Introduction
The Australian Government and the South Australian Government identified the importance of
tracking interactions with threatened, endangered or protected species (TEPS) to gain insights into
the frequency and severity of interactions that occur with the major South Australian managed
fisheries.
The objectives of the Fisheries Management Act 2007 (SA) are to protect, manage, use and
develop the aquatic resources of the State in a manner that is consistent with ecologically
sustainable development and, to that end, the following principles apply:
(a) proper conservation and management measures are to be implemented to protect the
aquatic resources of the State from over-exploitation and ensure that those resources are
not endangered;
(b) access to the aquatic resources of the State is to be allocated between users of the
resources in a manner that achieves optimum utilisation and equitable distribution of those
resources to the benefit of the community;
(c) aquatic habitats are to be protected and conserved, and aquatic ecosystems and genetic
diversity are to be maintained and enhanced;
(d) recreational fishing and commercial fishing activities are to be fostered for the benefit of
the whole community;
(e) the participation of users of the aquatic resources of the State, and of the community more
generally, in the management of fisheries is to be encouraged.
From 1st July 2007, Primary Industries and Regions South Australia Fisheries and Aquaculture
implemented new arrangements for reporting interactions with TEPS in all commercial fisheries.
These arrangements also form part of the requirements under Section 71 of the Fisheries
Management Act 2007 (SA) to avoid capturing or harming any protected species encountered
during any fishing operations. All licence holders have an obligation under Part 5 Division 2 of the
National Parks and Wildlife Act 1972 (SA) relating to restrictions on the taking of protected animals
within the confines of a national park or sanctuary. The National Parks and Wildlife Act 1972 (SA)
defines “protected animals” as:
(a) any mammal, bird or reptile indigenous to Australia; or
(b) any migratory mammal, bird or reptile that periodically or occasionally migrates to, and
lives in, Australia; or
(c) any animal of a species referred to in Schedule 7, 8 or 9; or

1: Introduction
South Australian Aquatic Sciences: Fisheries - Information Services
Interactions with Threatened, Endangered or Protected Species in South Australian Managed Fisheries – 2009/10, 2010/11 and 2011/12
3
(d) any animal of a species declared by regulation to be a species of protected animals,
but does not include animals of the species referred to in Schedule 10 or any animals declared by
regulation to be unprotected.
In addition to these Acts, the Commonwealth Environment Protection and Biodiversity Conservation
Act 1999 (EPBC) requires commercial operators to report any action that results in the death, injury
or movement of any individuals of a species covered by Part 13 of the EPBC Act to the
Commonwealth Department of Sustainability Water, Population and Communities (SEWPAC).
Schedules 7 through 10 of the National Parks and Wildlife Act 1972 (SA) are listed in Appendices 1
to 3 of this report, while the species protected under the EPBC Act are listed in Appendix 4. These
include all seabirds, marine reptiles, marine mammals, and some protected marine fish species,
including great white sharks and syngnathids (seahorses, sea dragons and pipefish). Additional
species protected under the Fisheries Management Act 2007 (SA) are listed in Appendix 5.
This document is the third report on interactions within South Australia’s managed fisheries
covering the period 1 July 2009 to 30 June 2012 and provides a summary of interaction information
voluntarily submitted to SARDI by the commercial fishing sectors.
The aims of the report are to:
• Gain a better understanding of the nature and extent of wildlife interactions in commercial
fishing activities;
• Assist in the development of effective measures and management policies that reduce or
avoid interactions within the commercial fishing sectors; and
• Assist government and industry in developing the data collection and reporting standards
required to meet legislative obligations through accurate monitoring and reporting of
interactions throughout the commercial fishing industry.
The document is divided into five sections: Section 1 provides interaction information by fishery and
method, Section 2, interactions by TEPS group, Section 3, interactions by date (month and year),
Section 4, interactions by location, and Section 5, interactions by interaction type.

Section 1: Wildlife Interactions by Fishery and Method
South Australian Aquatic Sciences: Fisheries - Information Services
Interactions with Threatened, Endangered or Protected Species in South Australian Managed Fisheries – 2009/10, 2010/11 and 2011/12
4
Section 1: Wildlife interactions by fishery and method
From July 2009 to June 2012, commercial operators reported 582 interactions with 1,921
individuals of listed threatened, endangered or protected species (TEPS). Table 1 shows the
number of interactions and the number of animals involved by fishery by financial year. Table 2
shows the number of interactions and the number of animals involved by gear type by financial
year. Tables 3 through 5 show the interactions by fishing method for each period and Tables 6
through 12 the interactions by fishery and fishing method for each period. Additional information is
provided where a fishery has had interactions involving more than one method. For a full list of
fishing methods used in this section refer to Appendix 6.
In 2009/10, 80 of the 178 interactions occurred in the Lakes and Coorong Fishery, 77 in the Sardine
Fishery, and 12 in the Marine Scalefish Fishery. In 2010/11, 70 of the 172 interactions occurred in
the Prawn Fisheries, 52 in the Lakes and Coorong Fishery, and 44 in the Sardine Fishery. In
2011/12, 116 of the 232 interactions occurred in the Prawn Fisheries, and 111 in the Sardine
Fishery. The information emphasises a large number of seals interacting with fishing gear over an
extended period in the Lakes and Coorong Fishery during 2009/10 and 2010/11 (Table 1).
Table 1: The number of interactions and animals involved by fishery by financial year. Fishery 2009/10 2010/11 2011/12
Interactions Animals Involved Interactions Animals
Involved Interactions Animals Involved
Abalone Fisheries 0 0 1 1 2 2 Blue Crab Fishery 1 1 0 0 0 0 Charter Boat Fishery 1 1 1 1 0 0 Lakes And Coorong Fishery 80 582 52 379 0 0 Marine Scalefish Fishery 12 24 4 4 3 4 Miscellaneous Fisheries 0 0 0 0 0 0 Prawn Fisheries 7 20 70 82 116 184 River Fishery 0 0 0 0 0 0 Rock Lobster Fisheries 0 0 0 0 0 0 Sardine Fishery 77 195 44 130 111 311 Total 178 823 172 597 232 501
In total, 97% of the animals encountered over the three year period were involved in interactions
during trawl or net operations, with 40% of those interactions involving purse seine nets and 33%
involving prawn trawl nets (Table 2).

Section 1: Wildlife Interactions by Fishery and Method
South Australian Aquatic Sciences: Fisheries - Information Services
Interactions with Threatened, Endangered or Protected Species in South Australian Managed Fisheries – 2009/10, 2010/11 and 2011/12
5
Table 2: The number of interactions and animals involved by gear type by financial year. Gear 2009/10 2010/11 2011/12
Type Code Interactions Animals Involved Interactions Animals
Involved Interactions Animals Involved
Nets Drum Net C 1 20 0 0 0 0 Gill Net (Small Mesh) E 0 0 1 6 0 0 Gill Net (Large Mesh) F 3 8 0 0 0 0 Hauling Net (Small Mesh) H 1 1 0 0 0 0 Haul Net (Floating Gar Net) HNF 5 15 1 1 0 0 Haul Net (Sinking Mixed Net) HNS 5 7 0 0 1 2 Hauling Net (Large Net) I 3 40 0 0 0 0 Ring Net K 72 513 51 373 0 0 Purse Seine PS 77 195 44 130 111 311 Prawn Trawl Net PTN 7 20 67 77 116 184 Total 174 819 164 587 228 497
Pots Crab Pot CP 1 1 0 0 1 0 Lobster Pot LP 0 0 0 0 0 0 Total 1 1 0 0 1 0
Lines Handline HL 2 2 1 1 0 0 Inshore Scale Fishing IS 1 1 1 1 0 0 Offshore Scale Fishing OS 0 0 0 0 0 0 Long Line LL 0 0 2 2 1 1 Poles/Rod And Line PO 0 0 0 0 0 0 Total 3 3 4 4 1 1
Other Diving D 0 0 1 1 2 2 Non Applicable N\A 0 0 3 5 0 0 Total 0 0 4 6 2 2
Total 178 823 172 597 232 501
The majority of animals involved in an interaction during the reporting period were cetaceans and
pinnipeds. Of the 823 animals involved in an interaction during 2009/10, 22% were cetaceans (179
dolphins) and 65% pinnipeds (531 seals) (Table 3). During 2010/11, 21% of the total animals
involved in an interaction were cetaceans (127 dolphins) and 64% were pinnipeds (381 seals)
(Table 4), and in 2011/12, 60% of the total animals involved in an interaction were cetaceans (303
dolphins) and 38% were sharks and syngnathids (190 animals) (Table 5).

Section 1: Wildlife Interactions by Fishery and Method
South Australian Aquatic Sciences: Fisheries - Information Services
Interactions with Threatened, Endangered or Protected Species in South Australian Managed Fisheries – 2009/10, 2010/11 and 2011/12
6
Table 3: TEPS interactions by taxonomic group by fishing method in South Australian commercial fisheries (all fisheries combined) 2009/10.
Taxonomic Group TEPS # of
Animals Gear Nature of Interaction Status Fate
Cau
ght
Enta
ngle
men
t
Impa
ct
Oth
er
Aliv
e
Aliv
e / I
njur
ed
Dea
d
Rel
ease
d
Ret
aine
d
Dis
card
ed
Oth
er
Birds
Cormorant 14 HNF 14 13 1 13 1 Cormorant 6 HNS 6 6 6 Pacific Gull 1 HL 1 1 1 Total 21 21 20 1 20 1
Reptiles
Freshwater Turtle 20 C 20 20 20 Freshwater Turtle 8 F 8 8 8 Freshwater Turtle 40 I 40 40 40 Leatherback Turtle 1 CP 1 1 1 Turtle 1 HNS 1 1 1 Total 70 69 1 70 70
Cetaceans Dolphin 136 PS 111 2 23 132 1 3 133 1 2 Common Dolphin 43 PS 43 41 2 41 2 Total 179 154 2 23 173 1 5 174 3 2
Pinnipeds
Common Seal 2 PTN 2 2 2 Common Seal 14 PS 14 14 14 New Zealand Fur Seal 1 HNF 1 1 1 New Zealand Fur Seal 1 H 1 1 1 New Zealand Fur Seal 513 K 513 513 513 Total 531 15 2 514 529 2 15 2 514
Fish
Great White Shark 1 IS 1 1 1 Pipefish 5 PTN 5 4 1 4 1 Sea Dragon 13 PTN 13 13 13 Great White Shark 2 PS 2 2 2 Great White Shark 1 HL 1 1 1 Total 22 20 1 1 21 1 19 1 2
Total 823 279 3 3 538 813 1 9 298 3 6 516

Section 1: Wildlife Interactions by Fishery and Method
South Australian Aquatic Sciences: Fisheries - Information Services
Interactions with Threatened, Endangered or Protected Species in South Australian Managed Fisheries – 2009/10, 2010/11 and 2011/12
7
Table 4: TEPS interactions by taxonomic group by fishing method in South Australian commercial fisheries (all fisheries combined) 2010/11.
Taxonomic Group TEPS # of
Animals Gear Nature of Interaction Status Fate
Cau
ght
Enta
ngle
men
t
Impa
ct
Oth
er
Aliv
e
Aliv
e / I
njur
ed
Dea
d
Rel
ease
d
Ret
aine
d
Dis
card
ed
Oth
er
Birds Australasian Gannet 1 IS 1 1 1 Total 1 1 1 1
Cetaceans
Dolphin 1 HNF 1 1 1 Dolphin 72 PS 69 3 64 1 7 65 7 Common Dolphin 54 PS 54 54 54 Total 127 124 3 119 1 7 120 7
Pinnipeds
Australian Fur Seal 1 PTN 1 1 1 Common Seal 1 PS 1 1 1 New Zealand Fur Seal 6 E 6 6 6 New Zealand Fur Seal 373 K 373 373 373 Total 381 2 379 380 1 2 379
Fish
Great White Shark 1 D 1 1 1 Great White Shark 1 HL 1 1 1 Great White Shark 2 LL 1 1 1 1 1 1 Great White Shark 3 PS 2 1 3 2 1 Common Seadragon 1 PTN 1 1 1 Leafy Seadragon 1 PTN 1 1 1 Pipefish 17 PTN 17 16 1 16 1 Pipehorse 5 PTN 5 5 5 Potbelly Seahorse 1 PTN 1 1 1 Seahorse 56 PTN 56 46 10 46 10 Total 88 84 1 3 70 18 67 18 3
Total 597 210 5 382 570 2 25 190 7 18 382
Table 5: TEPS interactions by taxonomic group by fishing method in South Australian commercial fisheries (all fisheries combined) 2011/12.
Taxonomic Group TEPS # of
Animals Gear Nature of Interaction Status Fate
Cau
ght
Enta
ngle
men
t
Impa
ct
Oth
er
Aliv
e
Aliv
e / I
njur
ed
Dea
d
Rel
ease
d
Ret
aine
d
Dis
card
ed
Oth
er
Birds Albatross 1 LL 1 1 1 Cormorant 2 HNS 2 2 2 Total 1 2 1 2 1 2 1
Cetaceans Dolphin 218 PS 139 8 71 211 2 5 213 4 1 Common Dolphin 85 PS 71 1 13 84 1 85 Total 303 210 9 84 295 3 5 298 4 1
Pinnipeds Common Seal 5 PS 4 1 5 4 1 Total 5 4 1 5 4 1
Fish
Great White Shark 1 CP 1 1 1 Great White Shark 2 D 2 2 2 Great White Shark 3 PS 3 3 3 Great White Shark 1 PTN 1 1 1 Common Seadragon 3 PTN 3 3 3 Pipefish 69 PTN 68 1 18 51 18 51 Pipehorse 24 PTN 24 14 10 14 10 Seahorse 87 PTN 87 69 18 69 18 Total 190 186 2 2 110 1 79 109 79 2
Total 501 402 12 87 412 4 85 413 4 81 3

Section 1: Wildlife Interactions by Fishery and Method
South Australian Aquatic Sciences: Fisheries - Information Services
Interactions with Threatened, Endangered or Protected Species in South Australian Managed Fisheries – 2009/10, 2010/11 and 2011/12
8
1.1 Abalone Fishery
The Abalone Fishery began in 1964. The two primary species of abalone landed from South
Australian waters are blacklip (Haliotis rubra) and greenlip (Haliotis laevigata). The fishery is divided
into three geographic zones (fisheries): Southern, Central, and Western. There are 35 licence
holders in the fishery, six each in the Central and Southern Zones, and 23 in the Western Zone
(Knight et al. 2012).
The combined Abalone Fishery, across all zones, undertook 2,031 dives in 2009/10, 2,037 dives in
2010/11, and 2,026 dives in 2011/12.
The Abalone Fishery reported three interactions with a TEPS during the reporting periods. One
occurred in 2010/11 and two in 2011/12. All three interactions involved sightings of great white
sharks (Table 6).
Table 6: TEPS interactions in the Abalone Fishery in 2009/10, 2010/11 and 2011/12. Year Effort
(Dives) TEPS # of Animals Gear Nature of Interaction Status Fate
Cau
ght
Enta
ngle
men
t
Impa
ct
Oth
er
Aliv
e
Aliv
e / I
njur
ed
Dea
d
Rel
ease
d
Ret
aine
d
Dis
card
ed
Oth
er
2009/10 2,031 No Data Reported 0
2010/11 2,037 Great White Shark 1 D 1 1 1 Total 1 1 1 1
2011/12 2,026 Great White Shark 2 D 2 2 2 Total 2 2 2 2
1.2 Blue Crab Fishery
In 1997, a limited-entry Blue Crab Fishery was created based on historical catches. The Blue Crab
industry in South Australia is a single species (Portunus armatus) fishery, although other species
may also be landed as by-product e.g. spider, velvet and rock crabs. The industry is divided into
three geographic zones; Spencer Gulf, West Coast and Gulf St. Vincent, and comprises two
separate sectors; the Pot Fishery and Marine Scalefish Fishery. The commercial pot fishers licence
conditions only allow them to harvest blue crabs, whereas the Marine Scalefish fishers may also
target other species normally taken in the Marine Scalefish Fishery (Vainickis 2010). Note: Any
interactions involving the Marine Scalefish fishers are included in the Marine Scalefish Fishery
section (1.6).

Section 1: Wildlife Interactions by Fishery and Method
South Australian Aquatic Sciences: Fisheries - Information Services
Interactions with Threatened, Endangered or Protected Species in South Australian Managed Fisheries – 2009/10, 2010/11 and 2011/12
9
The Blue Crab Fishery conducted 1,144 boat days fishing in 2009/10, 1,059 boat days in 2010/11,
and 1,086 boat days in 2011/12.
The Blue Crab Fishery has reported one interaction, a leatherback turtle, during the reporting
periods. The interaction occurred in 2009/10 (Table 7).
Table 7: TEPS interactions in the Blue Crab Fishery in 2009/10, 2010/11 and 2011/12.
Year Effort (Boat Days)
TEPS # of Animals Gear Nature of Interaction Status Fate
Cau
ght
Enta
ngle
men
t
Impa
ct
Oth
er
Aliv
e
Aliv
e / I
njur
ed
Dea
d
Rel
ease
d
Ret
aine
d
Dis
card
ed
Oth
er
2009/10 1,144 Leatherback Turtle 1 CP 1 1 1 Total 1 1 1 1
2010/11 1,059 No Data Reported 0
2011/12 1,086 No Data Reported 0
1.3 Charter Boat Fishery
The Charter Boat Fishery has 109 licence holders. Of these, 77 actively participate in the fishery
operating from 38 ports. The fishery operates from the Western Australian border (129o E longitude)
to the Victorian border (141o E longitude), a total of 3,820 kilometres of coastline (Vainickis 2010).
During 2009/10, the Charter Boat Fishery conducted 3,552 fishing trips, 3,323 trips during 2010/11,
and 3,560 trips during 2011/12.
The Charter Boat Fishery has reported interactions with two TEPS over the three financial year
periods (Table 8). One interaction involved a great white shark in 2009/10 and another involved an
Australian gannet in 2010/11. No animals were harmed during the encounters.
Note: in this fishery the fishing methods are reported by activity code (inshore scale fishing, offshore
scale fishing) but not by any particular method (e.g. hand lines, squid jigging, etc).

Section 1: Wildlife Interactions by Fishery and Method
South Australian Aquatic Sciences: Fisheries - Information Services
Interactions with Threatened, Endangered or Protected Species in South Australian Managed Fisheries – 2009/10, 2010/11 and 2011/12
10
Table 8: TEPS interactions in the Charter Boat Fishery in 2009/10, 2010/11 and 2011/12. Year Effort
(Trips) TEPS # of Animals Gear Nature of Interaction Status Fate
Cau
ght
Enta
ngle
men
t
Impa
ct
Oth
er
Aliv
e
Aliv
e / I
njur
ed
Dea
d
Rel
ease
d
Ret
aine
d
Dis
card
ed
Oth
er
2009/10 3,552 Great White Shark 1 IS 1 1 1 Total 1 1 1 1
2010/11 3,323 Australasian Gannet 1 IS 1 1 1 Total 1 1 1 1
2011/12 3,560 No Data Reported 0
1.4 Lakes and Coorong Fishery
The Lakes and Coorong Fishery is a multispecies, multi-gear fishery, encompassing Lake Albert
and Lake Alexandrina, the Coorong, and the adjacent ocean beach (Goolwa to Kingston in the
South East).
There are 36 licence holders within the fishery (Knight et al. 2012).
During 2009/10, the Lakes and Coorong Fishery spent 6,108 boat days actively fishing using a
number of different gear types. The fishery spent 6,033 boat days fishing during 2009/10, and 6,316
boat days fishing during 2011/12.
In 2009/10, the Lakes and Coorong Fishery reported 80 interactions involving 582 animals (Tables
1 and 9). The majority of interactions (73) involved New Zealand fur seals interacting with fishing
gear. The remaining seven interactions involved freshwater turtles captured at the Narrung
Narrows, a narrow channel joining Lake Albert and Lake Alexandrina. None of the animals died
during the interactions.
During 2010/11, the fishery reported 52 interactions involving 379 animals (Tables 1 and 9). All 52
interactions involved New Zealand fur seals interacting with fishing gear. There were no reported
interactions in 2011/12.
Section 1: Wildlife Interactions by Fishery and Method
South Australian Aquatic Sciences: Fisheries - Information Services
Interactions with Threatened, Endangered or Protected Species in South Australian Managed Fisheries – 2009/10, 2010/11 and 2011/12
11
Table 9: TEPS interactions in the Lakes and Coorong Fishery in 2009/10, 2010/11 and 2011/12.
Year Effort (Boat Days)
TEPS # of Animals Gear Nature of Interaction Status Fate
Cau
ght
Enta
ngle
men
t
Impa
ct
Oth
er
Aliv
e
Aliv
e / I
njur
ed
Dea
d
Rel
ease
d
Ret
aine
d
Dis
card
ed
Oth
er
2009/10 6,108
Freshwater Turtle 20 C 20 20 20 Freshwater Turtle 8 F 8 8 8 Freshwater Turtle 40 I 40 40 40 New Zealand Fur Seal 1 H 1 1 1 New Zealand Fur Seal 513 K 513 513 513 Total 582 68 514 582 68 514
2010/11 6,033 New Zealand Fur Seal 6 E 6 6 6 New Zealand Fur Seal 373 K 373 373 373 Total 379 379 379 379
2011/12 6,316 No Data Reported 0
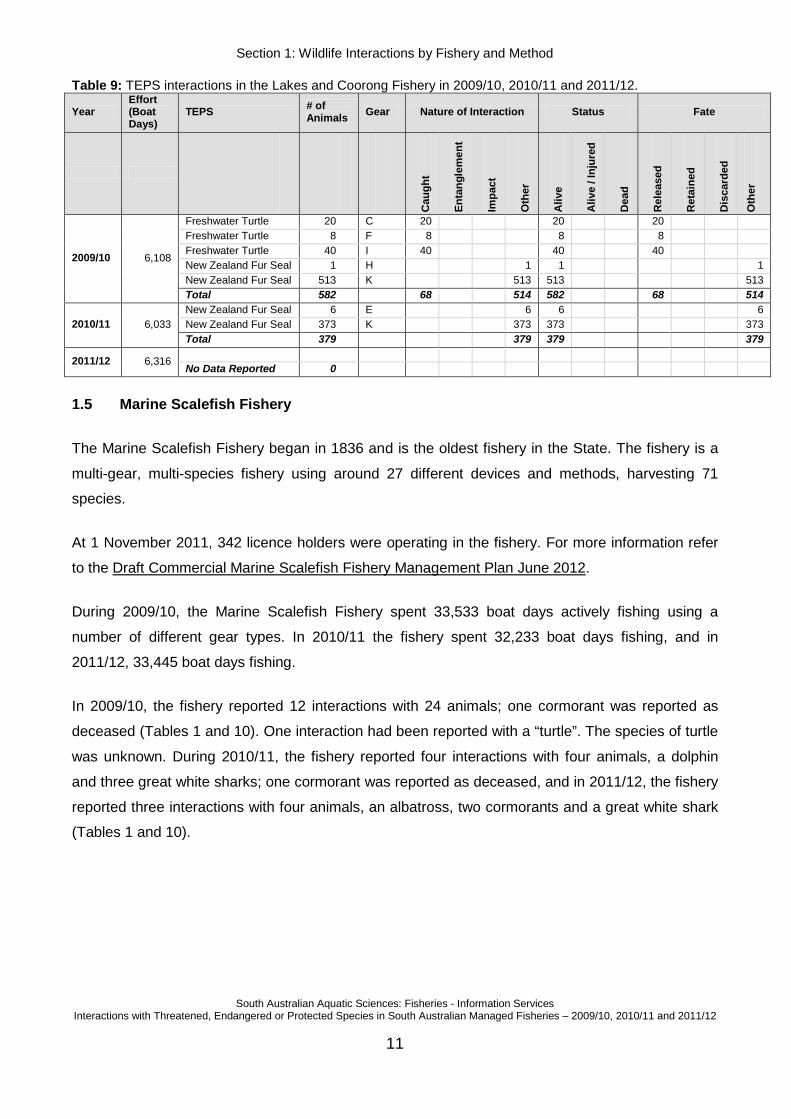
1.5 Marine Scalefish Fishery
The Marine Scalefish Fishery began in 1836 and is the oldest fishery in the State. The fishery is a
multi-gear, multi-species fishery using around 27 different devices and methods, harvesting 71
species.
At 1 November 2011, 342 licence holders were operating in the fishery. For more information refer
to the Draft Commercial Marine Scalefish Fishery Management Plan June 2012.
During 2009/10, the Marine Scalefish Fishery spent 33,533 boat days actively fishing using a
number of different gear types. In 2010/11 the fishery spent 32,233 boat days fishing, and in
2011/12, 33,445 boat days fishing.
In 2009/10, the fishery reported 12 interactions with 24 animals; one cormorant was reported as
deceased (Tables 1 and 10). One interaction had been reported with a “turtle”. The species of turtle
was unknown. During 2010/11, the fishery reported four interactions with four animals, a dolphin
and three great white sharks; one cormorant was reported as deceased, and in 2011/12, the fishery
reported three interactions with four animals, an albatross, two cormorants and a great white shark
(Tables 1 and 10).

Section 1: Wildlife Interactions by Fishery and Method
South Australian Aquatic Sciences: Fisheries - Information Services
Interactions with Threatened, Endangered or Protected Species in South Australian Managed Fisheries – 2009/10, 2010/11 and 2011/12
12
Table 10: TEPS interactions in the Marine Scalefish Fishery in 2009/10, 2010/11 and 2011/12. Year
Effort (Boat Days)
TEPS # of Animals Gear Nature of Interaction Status Fate
Cau
ght
Enta
ngle
men
t
Impa
ct
Oth
er
Aliv
e
Aliv
e / I
njur
ed
Dea
d
Rel
ease
d
Ret
aine
d
Dis
card
ed
Oth
er
2009/10 33,533
Pacific Gull 1 HL 1 1 1 Cormorant 14 HNF 14 13 1 13 1 Cormorant 6 HNS 6 6 6 New Zealand Fur Seal 1 HNF 1 1 1 Turtle 1 HNS 1 1 1 Great White Shark 1 HL 1 1 1 Total 24 23 1 23 1 22 1 1
2010/11 32,233
Dolphin 1 HNF 1 1 1 Great White Shark 1 HL 1 1 1 Great White Shark 2 LL 1 1 1 1 1 1 Total 4 2 1 1 3 1 2 1 1
2011/12 33,445
Albatross 1 LL 1 1 1 Cormorant 2 HNS 2 2 2 Great White Shark 1 CP 1 1 1 Total 4 2 2 3 1 3 1
1.6 Prawn Fishery
The Prawn Fishery are divided into three separate fisheries; the West Coast Fishery, Spencer Gulf
Fishery and Gulf St. Vincent Fishery. These fisheries, established in 1968, harvest western king
prawns (Penaeus (Melicertus) latisulcatus), and are the only single species prawn fisheries in
Australia. In terms of fleet size, the West Coast Fishery is the smallest of the three fisheries, with
only three vessels. The Spencer Gulf Fishery has 39 vessels, and the Gulf St. Vincent Fishery has
10 vessels (Knight et al. 2012).
During 2009/10, the combined Prawn Fishery, across all zones, conducted 20,111 trawl shots, in
2010/11, 20,101 trawl shots, and in 2011/12, 21,324 trawl shots.
The Prawn Fishery reported 193 interactions with 286 animals in the three financial years; seven
interactions with 20 animals in 2009/10, 70 interactions with 82 animals in 2010/11, and 116
interactions with 184 animals in 2011/12 (Tables 1 and 11). Almost all of the interactions have
involved syngnathids (pipefish, seahorses, sea dragons) (Table 11).

Section 1: Wildlife Interactions by Fishery and Method
South Australian Aquatic Sciences: Fisheries - Information Services
Interactions with Threatened, Endangered or Protected Species in South Australian Managed Fisheries – 2009/10, 2010/11 and 2011/12
13
Table 11: TEPS interactions in the Prawn Fishery in 2009/10, 2010/11 and 2011/12.
Year Effort (Trawl Shots)
TEPS # of Animals Gear Nature of Interaction Status Fate
Cau
ght
Enta
ngle
men
t
Impa
ct
Oth
er
Aliv
e
Aliv
e / I
njur
ed
Dea
d
Rel
ease
d
Ret
aine
d
Dis
card
ed
Oth
er
2009/10 20,111
Pipefish 5 PTN 5 4 1 4 1 Sea Dragon 13 PTN 13 13 13 Common Seal 2 PTN 2 2 2 Total 20 18 2 17 3 17 3
2010/11 20,101
Australian Fur Seal 1 PTN 1 1 1 Common Sea Dragon 1 PTN 1 1 1 Leafy Sea Dragon 1 PTN 1 1 1 Pipefish 17 PTN 17 16 1 16 1 Pipehorse 5 PTN 5 5 5 Potbelly Seahorse 1 PTN 1 1 1 Seahorse 56 PTN 56 46 10 46 10 Total 82 82 65 17 65 17
2011/12 21,324
Common Sea Dragon 3 PTN 3 3 3 Great White Shark 1 PTN 1 1 1 Pipefish 69 PTN 68 1 18 51 18 51 Pipehorse 24 PTN 24 14 10 14 10 Seahorse 87 PTN 87 69 18 69 18 Total 184 183 1 104 1 79 105 79
1.7 River Fishery
The River Fishery is a multispecies, multi-gear fishery, encompassing the River Murray and its
backwaters.
There are 6 licence holders within the River Fishery (Knight et al. 2012).
The River Fishery did not report any interactions with a TEPS during the past three financial years.
1.8 Rock Lobster Fishery
The Rock Lobster (Jasus edwardsii) Fishery is a single species fishery divided into two
management zones (fisheries): Northern and Southern. The Northern Zone encompasses a stretch
of coastline in excess of 3,700 km, including all waters adjacent to South Australia west of the River
Murray mouth to the Western Australian border, from the low water mark out to 200 nautical miles.
The Southern Zone encompasses all remaining state waters along a much smaller, yet more
productive stretch of coastline of about 425 km. The Southern Zone has 181 licence holders and
operates from October to May, whilst the Northern Zone has 68 licence holders and operates from
November to May (Knight et al. 2012). The two zones are managed as separate fisheries.

Section 1: Wildlife Interactions by Fishery and Method
South Australian Aquatic Sciences: Fisheries - Information Services
Interactions with Threatened, Endangered or Protected Species in South Australian Managed Fisheries – 2009/10, 2010/11 and 2011/12
14
The Northern Zone licensed operators conducted 350,908 lobster pot lifts during 2009/10, 289,995
pot lifts during 2010/11, and 287,354 pot lifts during 2011/12. The Southern Zone Fishery
conducted 2,049,961 pot lifts during 2009/10, 1,321,654 pot lifts during 2010/11, and 1,284,792 pot
lifts during 2011/12.
The fishery did not report any interactions with a TEPS during the reporting periods.
1.9 Sardine Fishery
The Sardine (Sardinops sagax) Fishery is part of the Marine Scalefish Fishery. It is a single species
fishery that commenced in 1991. The fishery operates from the Western Australian to the Victorian
borders.
There is a range of information collected on TEPS interactions in the fishery. Information is
collected through:
1. The independent observer program undertaken by a PIRSA contractor,
2. The Wildlife Interaction Identification and Logbook, and
3. The SARDI South Australian Sardine Fishery Research Logbook.
The Code of Practice for the Mitigation of Interactions of the South Australian Sardine Fishery with
Threatened, Endangered and Protected Species (The Code) aims to mitigate operational
interactions. The Code is understood, and supported by all licence holders in the fishery. The Code
and observer program have been effective in reducing mortalities and rates of interaction in the
fishery. The operational interactions of the South Australian Sardine Fishery with dolphins are
considered in Ward et al (2012).
There are 14 licences in the Sardine Fishery (Knight et al. 2012).
In 2009/10, the Sardine Fishery conducted 1,067 purse seine shots, 1,011 in 2010/11, and 1,113 in
2011/12.
In 2009/10, the Sardine Fishery reported 77 separate interactions involving 195 animals (Tables 1
and 12). Of these, 190 animals were released or escaped alive and five died. During 2010/11, the
fishery reported 44 interactions with 130 animals, 126 of which were caught within the fishing gear
used (Tables 1 and 12). Seven animals died during the period. During 2011/12, there were 111
reported interactions involving 311 animals, five dolphins died (Tables 1 and 12).

Section 1: Wildlife Interactions by Fishery and Method
South Australian Aquatic Sciences: Fisheries - Information Services
Interactions with Threatened, Endangered or Protected Species in South Australian Managed Fisheries – 2009/10, 2010/11 and 2011/12
15
Table 12: TEPS interactions in the Sardine Fishery in 2009/10, 2010/11 and 2011/12. Year Effort
(Shots) TEPS # of Animals Gear Nature of Interaction Status Fate
Cau
ght
Enta
ngle
men
t
Impa
ct
Oth
er
Aliv
e
Aliv
e / I
njur
ed
Dea
d
Rel
ease
d
Ret
aine
d
Dis
card
ed
Oth
er
2009/10 1,067
Dolphin 136 PS 111 2 23 132 1 3 133 1 2 Common Dolphin 43 PS 43 41 2 41 2 Common Seal 14 PS 14 14 14 Great White Shark 2 PS 2 2 2 Total 195 170 2 23 189 1 5 190 3 2
2010/11 1,011
Dolphin 72 PS 69 3 64 1 7 65 7 Common Dolphin 54 PS 54 54 54 Common Seal 1 PS 1 1 1 Great White Shark 3 PS 2 1 3 2 1 Total 130 126 3 1 121 2 7 122 7 1
2011/12 1,113
Dolphin 218 PS 139 8 71 211 2 5 213 4 1 Common Dolphin 85 PS 71 1 13 84 1 85 Common Seal 5 PS 4 1 5 4 1 Great White Shark 3 PS 3 3 3 Total 311 217 9 85 303 3 5 305 4 1 1

Section 2: Wildlife Interactions by Species Group
South Australian Aquatic Sciences: Fisheries - Information Services
Interactions with Threatened, Endangered or Protected Species in South Australian Managed Fisheries – 2009/10, 2010/11 and 2011/12
16
Section 2: Wildlife interactions by species group
Cetaceans and pinnipeds accounted for 79% of the 1,921 animals involved in the 582 interactions
during the reporting period. Cetaceans (609 animals) featured in 210 of the 582 interactions, and
pinnipeds (917 animals) featured in 143 interactions (Tables 13, 14 and 15). The pinniped data are
skewed due to a large number of animals interacting with fishing gear in the Lakes and Coorong
Fishery over an extended period during 2009/10 and 2010/11 (Tables 13 and 14).
Table 13 shows pinnipeds were involved in 85 interactions and accounted for 65% of the TEPS
involved in the 178 interactions in 2009/10, followed by cetaceans (22%), reptiles (9%), fish (3%)
and seabirds (3%).
During those interactions, 3% of the cetaceans, 5% of the seabirds and 5% of the fish died.
Table 13: TEPS interactions by species group in 2009/10. TEPS # of
Interactions # of Animals Nature of Interaction Status Fate
Cau
ght
Enta
ngle
men
t
Impa
ct
Oth
er
Aliv
e
Aliv
e / I
njur
ed
Dea
d
Rel
ease
d
Ret
aine
d
Dis
card
ed
Oth
er
Seabirds Cormorant 8 20 20 19 1 19 1 Pacific Gull 1 1 1 1 1 Total 9 21 21 20 1 20 1
Reptiles Freshwater Turtle 7 68 68 68 68 Leatherback Turtle 1 1 1 1 1 Turtle 1 1 1 1 1 Total 9 70 69 1 70 70
Cetaceans Common Dolphin 19 43 43 41 2 41 2 Dolphin 46 136 111 2 23 132 1 3 133 1 2 Total 65 179 154 2 23 173 1 5 174 3 2
Pinniped Common Seal 11 16 14 2 14 2 14 2 New Zealand Fur Seal 74 515 1 514 515 1 514 Total 85 531 15 2 514 529 2 15 2 514
Fish Pipefish 4 5 5 4 1 4 1 Common Sea Dragon 2 13 13 13 13 Great White Shark 4 4 2 1 1 4 2 2 Total 10 22 20 1 1 21 1 19 1 2
Total 178 823 279 3 3 538 813 1 9 298 3 6 516

Section 2: Wildlife Interactions by Species Group
South Australian Aquatic Sciences: Fisheries - Information Services
Interactions with Threatened, Endangered or Protected Species in South Australian Managed Fisheries – 2009/10, 2010/11 and 2011/12
17
In 2010/11, pinnipeds were the highest representation with 381 animals involved in 54 interactions
(Table 14). This accounted for 64% of the animals involved in the 172 encounters, followed by
cetaceans (21%), fish (15%) and seabirds (<1%).
During 2010/11, 20% of the fish and 6% of the cetaceans involved in an interaction died.
Table 14: TEPS interactions by species group in 2010/11. TEPS # of
Interactions # of Animals Nature of Interaction Status Fate
Cau
ght
Enta
ngle
men
t
Impa
ct
Oth
er
Aliv
e
Aliv
e / I
njur
ed
Dea
d
Rel
ease
d
Ret
aine
d
Dis
card
ed
Oth
er
Seabirds Australasian Gannet 1 1 1 1 1 Total 1 1 1 1 1
Cetaceans Common Dolphin 13 54 54 54 54 Dolphin 28 73 70 3 65 1 7 66 7 Total 41 127 124 3 119 1 7 120 7
Pinniped Australian Fur Seal 1 1 1 1 1 Common Seal 1 1 1 1 1 New Zealand Fur Seal 52 379 379 379 379 Total 54 381 2 379 380 1 2 379
Fish Pipefish 16 17 17 16 1 16 1 Pipehorse 5 5 5 5 5 Potbelly Seahorse 1 1 1 1 1 Seahorse 45 56 56 46 10 46 10 Common Sea Dragon 1 1 1 1 1 Leafy Sea Dragon 1 1 1 1 1 Great White Shark 7 7 3 1 3 6 1 3 1 3 Total 76 88 84 1 3 70 18 67 18 3
Total 172 597 210 5 382 570 2 25 190 7 18 382
In 2011/12, 303 cetaceans were involved in 104 interactions (Table 15). This accounted for 60% of
the animals involved in the 232 encounters, followed by fish (38%), pinnipeds (1%) and seabirds
(<1%).
During 2011/12, 42% of the fish, 33% of the seabirds and 2% of the cetaceans involved in an
interaction died.

Section 2: Wildlife Interactions by Species Group
South Australian Aquatic Sciences: Fisheries - Information Services
Interactions with Threatened, Endangered or Protected Species in South Australian Managed Fisheries – 2009/10, 2010/11 and 2011/12
18
Table 15: TEPS interactions by species group in 2011/12. TEPS # of
Interactions # of Animals Nature of Interaction Status Fate
Cau
ght
Enta
ngle
men
t
Impa
ct
Oth
er
Aliv
e
Aliv
e / I
njur
ed
Dea
d
Rel
ease
d
Ret
aine
d
Dis
card
ed
Oth
er
Seabirds Albatross 1 1 1 1 1 Cormorant 1 2 2 2 2 Total 2 3 2 1 2 1 2 1
Cetaceans Common Dolphin 32 85 71 1 13 84 1 85 Dolphin 72 218 139 8 71 211 2 5 213 4 1 Total 104 303 210 9 84 295 3 5 298 4 1
Pinniped Common Seal 4 5 4 1 5 4 1 Total 4 5 4 1 5 4 1
Fish Pipefish 26 69 68 1 18 51 18 51 Pipehorse 17 24 24 14 10 14 10 Seahorse 70 87 87 69 18 69 18 Common Sea Dragon 2 3 3 3 3 Great White Shark 7 7 4 1 2 6 1 5 2 Total 122 190 186 2 2 110 1 79 109 79 2
Total 232 501 402 12 87 412 4 85 413 4 81 3
During the three periods, 427 (70%) of the 609 dolphins and 22 (2%) of the 917 pinnipeds involved
in interactions were not reported to a particular species. “Dolphins” and “common seals” accounted
for 449 (~23%) of the 1,921 animals involved in the encounters. These animals could not be further
identified from the information provided.

Section 3: Wildlife Interactions by Month
South Australian Aquatic Sciences: Fisheries - Information Services
Interactions with Threatened, Endangered or Protected Species in South Australian Managed Fisheries – 2009/10, 2010/11 and 2011/12
19
Section 3: Wildlife interactions by month
During the period from July 2009 to June 2012, the number of animals involved in interactions was
highest from January to September of 2010 with 210 interactions involving 1,150 animals (Figure
1). The majority of these interactions (124) were reported by one commercial fisher operating in the
Lakes and Coorong Fishery and involved New Zealand fur seals interacting with fishing gear.
Figures 2 through 6 show the number of animals involved in interactions by species group.
Figure 1: The total number of interactions and animals by month.
Figure 2: The number of seabirds involved in interactions and the number of interactions by month.
0 5 10 15 20 25 30 35 40 45 50 55 60
0
50
100
150
200
250
300
Jul-0
9
Sep-
09
Nov
-09
Jan-
10
Mar
-10
May
-10
Jul-1
0
Sep-
10
Nov
-10
Jan-
11
Mar
-11
May
-11
Jul-1
1
Sep-
11
Nov
-11
Jan-
12
Mar
-12
May
-12
Num
ber o
f Int
erac
tions
Num
ber o
f Ani
mal
s
Animals Interactions
0
1
2
3
4
0
1
2
3
4
5
6
7
8
Jul-0
9
Sep-
09
Nov
-09
Jan-
10
Mar
-10
May
-10
Jul-1
0
Sep-
10
Nov
-10
Jan-
11
Mar
-11
May
-11
Jul-1
1
Sep-
11
Nov
-11
Jan-
12
Mar
-12
May
-12
Num
ber o
f Int
erac
tions
Num
ber o
f Sea
bird
s
Seabirds Interactions

Section 3: Wildlife Interactions by Month
South Australian Aquatic Sciences: Fisheries - Information Services
Interactions with Threatened, Endangered or Protected Species in South Australian Managed Fisheries – 2009/10, 2010/11 and 2011/12
20
Figure 3: The number of reptiles involved in interactions and the number of interactions by month.
Figure 4: The number of cetaceans involved in interactions and the number of interactions by month.
0
1
2
3
4
5
0
5
10
15
20
25
30
35
40
45
Jul-0
9
Sep-
09
Nov
-09
Jan-
10
Mar
-10
May
-10
Jul-1
0
Sep-
10
Nov
-10
Jan-
11
Mar
-11
May
-11
Jul-1
1
Sep-
11
Nov
-11
Jan-
12
Mar
-12
May
-12
Num
ber o
f Int
erac
tions
Num
ber o
f Rep
tiles
Reptiles Interactions
0
5
10
15
20
25
30
35
0
10
20
30
40
50
60
70
80
90
100
110
Jul-0
9
Sep-
09
Nov
-09
Jan-
10
Mar
-10
May
-10
Jul-1
0
Sep-
10
Nov
-10
Jan-
11
Mar
-11
May
-11
Jul-1
1
Sep-
11
Nov
-11
Jan-
12
Mar
-12
May
-12
Num
ber o
f Int
erac
tions
Num
ber o
f Cet
acea
ns
Cetaceans Interactions

Section 3: Wildlife Interactions by Month
South Australian Aquatic Sciences: Fisheries - Information Services
Interactions with Threatened, Endangered or Protected Species in South Australian Managed Fisheries – 2009/10, 2010/11 and 2011/12
21
Figure 5: The number of pinnipeds involved in interactions and the number of interactions by month.
Figure 6: The number of fish involved in interactions and the number of interactions by month.
0
5
10
15
20
25
30
0
50
100
150
200
250
300
Jul-0
9
Sep-
09
Nov
-09
Jan-
10
Mar
-10
May
-10
Jul-1
0
Sep-
10
Nov
-10
Jan-
11
Mar
-11
May
-11
Jul-1
1
Sep-
11
Nov
-11
Jan-
12
Mar
-12
May
-12
Num
ber o
f Int
erac
tions
Num
ber o
f Pin
nipe
ds
Pinnipeds Interactions
0
5
10
15
20
25
0
10
20
30
40
50
60
70
Jul-0
9
Sep-
09
Nov
-09
Jan-
10
Mar
-10
May
-10
Jul-1
0
Sep-
10
Nov
-10
Jan-
11
Mar
-11
May
-11
Jul-1
1
Sep-
11
Nov
-11
Jan-
12
Mar
-12
May
-12
Num
ber o
f Int
erac
tions
Num
ber o
f Fis
h
Fish Interactions

Section 4: Wildlife Interactions by Location
South Australian Aquatic Sciences: Fisheries - Information Services
Interactions with Threatened, Endangered or Protected Species in South Australian Managed Fisheries – 2009/10, 2010/11 and 2011/12
22
Section 4: Wildlife interactions by location
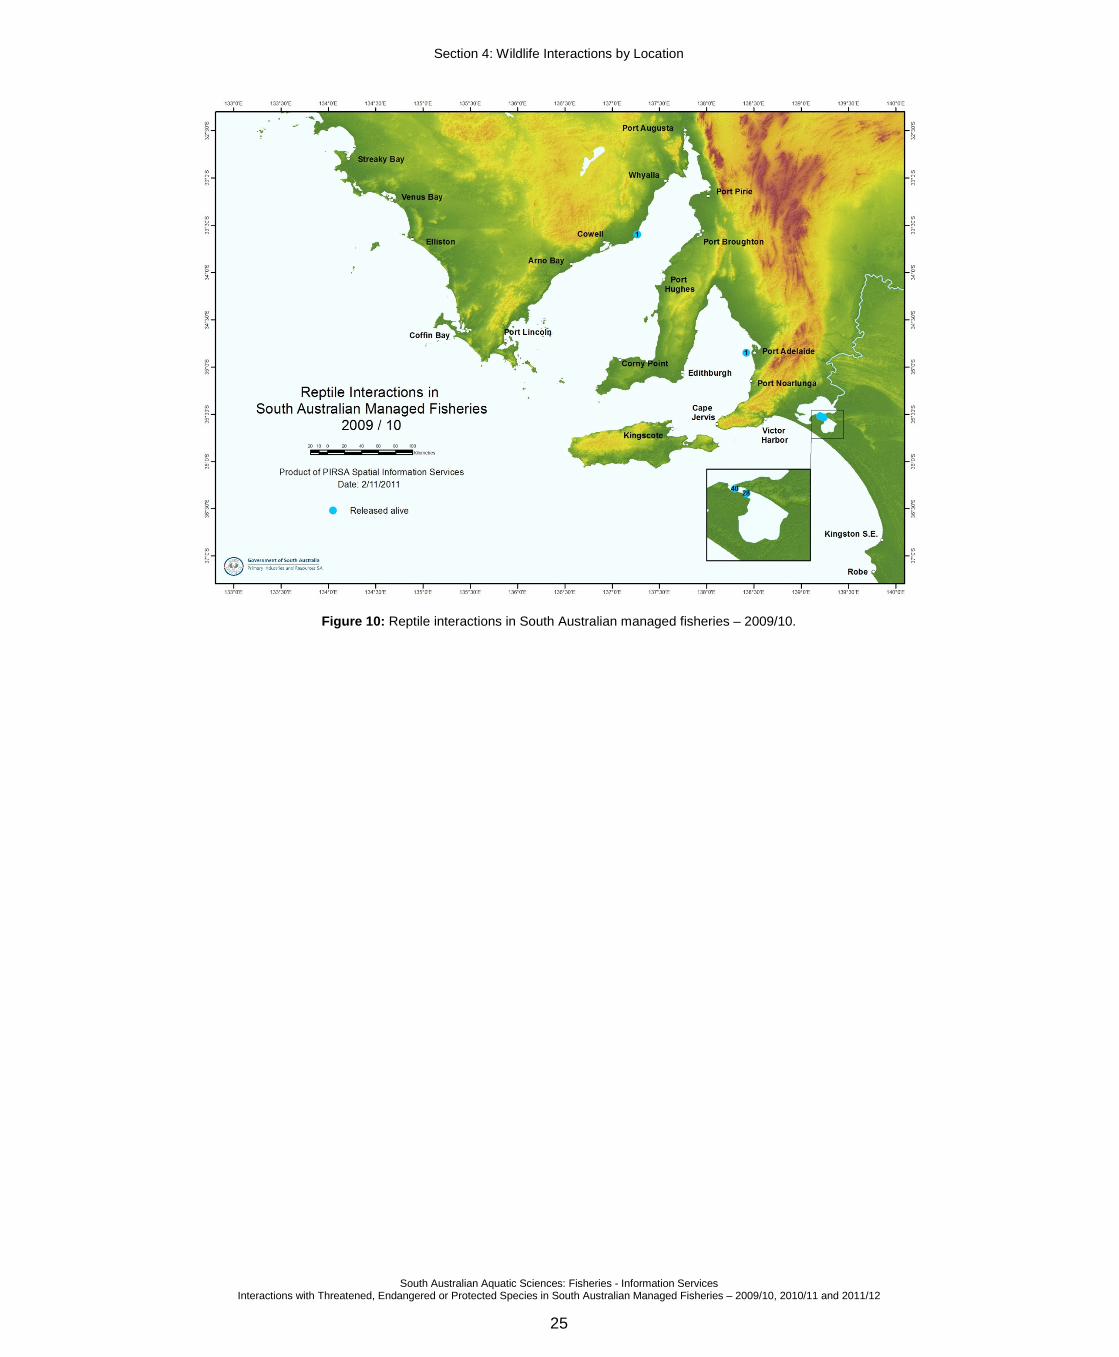
Figures 7 through 19 show the locations of the interactions by species group by financial year. The
numbered blue dots represent the position and the number of animals unharmed and released after
the interaction, and the pink numbered dots represent the number and position of deceased
animals.
Figures 7, 8 and 9 show the locations of the seabird interactions for 2009/10, 2010/11 and 2011/12,
respectively.
Figure 10 shows the locations of the reptile encounters during 2009/10 (there were no encounters
reported in 2010/11 and 2011/12). The increased number of interactions during 2009/10 relate to a
period of intense fishing effort eradicating European carp from the Narrung Narrows between Lake
Albert and Lake Alexandrina. During this activity 68 freshwater turtles were captured and released.
Figures 11, 12 and 13 show the majority of cetacean interactions occurred in Spencer Gulf, 143
(80%) of the 179 animals involved in an interaction in 2009/10, 118 (93%) of the 127 animals in
2010/11, and 273 (90%) of the 303 animals in 2011/12.
Figures 14, 15 and 16 show the concentrations of pinniped interactions throughout SA. In previous
years the majority of interactions were concentrated north of a line from the tip of Yorke Peninsula
between the points of Thistle Island, Wedge Island, and the Sir Joseph Banks Group (Knight and
Vainickis 2011a). During 2009/10 and 2010/11, a number of animals interacted with fishing gear
around the Coorong region over an extended period. In 2011/12, only four interactions were
reported with five animals in Spencer Gulf.
Figures 17, 18 and 19 show the shark and syngnathid interactions for 2009/10, 2010/11 and
2011/12. In 2009/10, 18 of the 22 animals involved in interactions were syngnathids, with a pipefish
dying south of Venus Bay, and four with great white sharks, two in Spencer Gulf and two west of
Corny Point (Figure 17). During 2010/11, 81 syngnathids were involved in 69 interactions and a
further seven interactions involved great white sharks, one on the West Coast, five in Spencer Gulf,
and one in Gulf St. Vincent. During 2011/12, 183 sygnathids were involved in 115 interactions and a
further seven interactions involved seven great white sharks. The majority of the interactions were
reported in Spencer Gulf.

Section 4: Wildlife Interactions by Location
South Australian Aquatic Sciences: Fisheries - Information Services
Interactions with Threatened, Endangered or Protected Species in South Australian Managed Fisheries – 2009/10, 2010/11 and 2011/12
23
Figure 7: Seabird interactions in South Australian managed fisheries – 2009/10.

Section 4: Wildlife Interactions by Location
South Australian Aquatic Sciences: Fisheries - Information Services
Interactions with Threatened, Endangered or Protected Species in South Australian Managed Fisheries – 2009/10, 2010/11 and 2011/12
24
Figure 8: Seabird interactions in South Australian managed fisheries – 2010/11.
Figure 9: Seabird interactions in South Australian managed fisheries – 2011/12.
Section 4: Wildlife Interactions by Location
South Australian Aquatic Sciences: Fisheries - Information Services
Interactions with Threatened, Endangered or Protected Species in South Australian Managed Fisheries – 2009/10, 2010/11 and 2011/12
25
Figure 10: Reptile interactions in South Australian managed fisheries – 2009/10.

Section 4: Wildlife Interactions by Location
South Australian Aquatic Sciences: Fisheries - Information Services
Interactions with Threatened, Endangered or Protected Species in South Australian Managed Fisheries – 2009/10, 2010/11 and 2011/12
26
This page intentionally left blank

Section 4: Wildlife Interactions by Location
South Australian Aquatic Sciences: Fisheries - Information Services
Interactions with Threatened, Endangered or Protected Species in South Australian Managed Fisheries – 2009/10, 2010/11 and 2011/12
27
Figure 11: Cetacean interactions in South Australian managed fisheries – 2009/10.

Section 4: Wildlife Interactions by Location
South Australian Aquatic Sciences: Fisheries - Information Services
Interactions with Threatened, Endangered or Protected Species in South Australian Managed Fisheries – 2009/10, 2010/11 and 2011/12
28
Figure 12: Cetacean interactions in South Australian managed fisheries – 2010/11.
Figure 13: Cetacean interactions in South Australian managed fisheries – 2011/12.

Section 4: Wildlife Interactions by Location
South Australian Aquatic Sciences: Fisheries - Information Services
Interactions with Threatened, Endangered or Protected Species in South Australian Managed Fisheries – 2009/10, 2010/11 and 2011/12
29
Figure 14: Pinniped interactions in South Australian managed fisheries – 2009/10.
Figure 15: Pinniped interactions in South Australian managed fisheries – 2010/11.

Section 4: Wildlife Interactions by Location
South Australian Aquatic Sciences: Fisheries - Information Services
Interactions with Threatened, Endangered or Protected Species in South Australian Managed Fisheries – 2009/10, 2010/11 and 2011/12
30
Figure 16: Pinniped interactions in South Australian managed fisheries – 2011/12.

Section 4: Wildlife Interactions by Location
South Australian Aquatic Sciences: Fisheries - Information Services
Interactions with Threatened, Endangered or Protected Species in South Australian Managed Fisheries – 2009/10, 2010/11 and 2011/12
31
Figure 17: Fish interactions in South Australian managed fisheries – 2009/10.

Section 4: Wildlife Interactions by Location
South Australian Aquatic Sciences: Fisheries - Information Services
Interactions with Threatened, Endangered or Protected Species in South Australian Managed Fisheries – 2009/10, 2010/11 and 2011/12
32
Figure 18: Fish interactions in South Australian managed fisheries – 2010/11.
Figure 19: Fish interactions in South Australian managed fisheries – 2011/12.

Section 5: Wildlife Interactions by Interaction Type
South Australian Aquatic Sciences: Fisheries - Information Services
Interactions with Threatened, Endangered or Protected Species in South Australian Managed Fisheries – 2009/10, 2010/11 and 2011/12
33
Section 5: Wildlife interactions by interaction type
Commercial operators reported 178 interactions with 823 animals in 2009/10, 174 interactions with
597 animals in 2010/11, and 237 interactions with 501 animals in 2011/12 (Table 16). The main
interaction type for the three periods was “Caught” i.e. hooked or netted, followed by “Other” (Table
16 and Figure 21).
During 2009/10 and 2010/11, the interaction type involving the highest numbers of animals was
“Other” due to the increase in interactions in the Lakes and Coorong Fishery.
The “Other” category includes bite offs, animals circling the boat or interacting with fishing gear, and
discovering dead animals whilst in transit.
In some situations operators reported more than one interaction type with a single animal or group
of animals. For example, in 2010/11, on two occasions, additional interaction types were reported
with the same group of animals, with some animals reported as caught and entangled. In 2011/12,
there were five occasions where additional interaction types were reported with the same group of
animals.
Table 16: TEPS interactions by interaction type by financial year. Interaction Type 2009/10 2010/11 2011/12
Number of Interactions
Number of Animals
Number of Interactions
Number of Animals
Number of Interactions
Number of Animals
Caught 95 279 114 210 200 402 Entangled 3 3 5 5 9 12 Impact 2 3 0 0 0 0 Other 78 538 55 382 28 87 Total 178 823 174 597 237 501
Figure 20: The number of animals encountered by interaction type by financial year.
Figure 21: The number of interactions by interaction type by financial year.
0 200 400 600 800 1000 1200
Caught
Entangled
Impact
Other
Number of Animals
2009/10 2010/11 2011/12
0 100 200 300 400 500
Caught
Entangled
Impact
Other
Number of Interactions
2009/10 2010/11 2011/12

Appendix 1: National Parks and Wildlife Act 1972 - Schedule 7
South Australian Aquatic Sciences: Fisheries - Information Services
Interactions with Threatened, Endangered or Protected Species in South Australian Managed Fisheries – 2009/10, 2010/11 and 2011/12
34
Appendix 1: National Parks and Wildlife Act 1972 - Schedule 7 - Endangered species - Part 1 - Animals
Table 17: National Parks and Wildlife Act 1972 - Schedule 7 – Endangered Species – Part 1 – Animals. Common name Species Common name Species Common name Species
Mammals PETAURIDAE LARIDAE ACROBATIDAE Yellow-bellied Glider Petaurus australis Little Tern Sterna albifrons Feathertail Glider Acrobates pygmaeus Squirrel Glider Petaurus norfolcensis Fairy Tern Sterna nereis BALAENOPTERIDAE POTORIDAE MALURIDAE Blue Whale Balaenoptera musculus Burrowing Bettong Bettongia lesueur Southern Emu-wren (Mount Lofty Ranges subspecies) Stipiturus malachurus intermedius DASYURIDAE Brush-tailed Bettong (eastern subspecies) Bettongia penicillata penicillata Southern Emu-wren (Eyre Peninsula subspecies) Stipiturus malachurus parimeda Agile Antechinus Antechinus agilis Desert Rat-kangaroo Caloprymnus campestris Mallee Emu-wren Stipiturus mallee Swamp Antechinus Antechinus minimus Long-nosed Potoroo Potorous tridactylus MELIPHAGIDAE Mulgara Dasycercus cristicauda cristicauda VESPERTILIONIDAE Yellow Chat Epthianura crocea Western Quoll Dasyurus geoffroii Little Pied Bat Chalinolobus picatus Yellow-throated Miner (Black-eared subspecies) Manorina flavigula melanotis Spotted-tailed Quoll Dasyurus maculatus Eastern Falsistrelle Falsistrellus tasmaniensis Regent Honeyeater Xanthomyza phrygia Eastern Quoll Dasyurus viverrinus Large Bent-wing Bat (southern subspecies) Miniopterus schreibersii bassanii PACHYCEPHALIDAE Red-tailed Phascogale Phascogale calura Southern Myotis Myotis macropus Olive Whistler (westernmost subspecies) Pachycephala olivacea hesperus Brush-tailed Phascogale Phascogale tapoatafa Gould's Long-eared Bat Nyctophilus gouldi PEDIONOMIDAE Kangaroo Island Dunnart Sminthopsis aitkeni Plains-wanderer Pedionomus torquatus MACROPODIDAE Birds PHASIANIDAE Rufous Hare-wallaby Lagorchestes hirsutus ACANTHIZIDAE King Quail Coturnix chinensis Eastern Hare-wallaby Lagorchestes leporides Chestnut-rumped Heathwren (Mount Lofty Ranges
subspecies) Calamanthus pyrrhopygius parkeri POMATOSTOMIDAE
Tammar Wallaby (mainland South Australia Subspecies)
Macropus eugenii eugenii Grey-crowned Babbler (south east subspecies) Pomatostomus temporalis temporalis ACCIPITRIDAE PSITTACIDAE
Toolache Wallaby Macropus greyi Grey Goshawk Accipiter novaehollandiae Little Lorikeet Glossopsitta pusilla Crescent Nailtail Wallaby Onychogalea lunata White-bellied Sea-Eagle Haliaeetus leucogaster Swift Parrot Lathamus discolor Black-footed Rock-wallaby (MacDonnell Ranges race) Petrogale lateralis Square-tailed Kite Lophoictinia isura Orange-bellied Parrot Neophema chrysogaster Tasmanian Pademelon Thylogale billardierii Osprey Pandion haliaetus Night Parrot Pezoporus occidentalis MEGADERMATIDAE ALCEDINIDAE Ground Parrot Pezoporus wallicus Ghost Bat Macroderma gigas Azure Kingfisher Alcedo azurea PTILONORHYNCHIDAE MURIDAE ANSERANATIDAE Spotted Bowerbird Chlamydera maculata White-footed Tree-rat Conilurus albipes Magpie Goose Anseranas semipalmata STRIGIDAE Lesser Stick-nest Rat Leporillus apicalis ARDEIDAE Powerful Owl Ninox strenua Short-tailed Hopping-mouse Notomys amplus Little Bittern Ixobrychus minutus SYLVIIDAE Long-tailed Hopping-mouse Notomys longicaudatus ARTAMIDAE Spinifexbird Eremiornis carteri Shark Bay Mouse Pseudomys fieldi Pied Currawong (south east subspecies) Strepera graculina ashbyi TYTONIDAE Gould's Mouse Pseudomys gouldii Grey Currawong (north western subspecies) Strepera versicolor plumbea Masked Owl Tyto novaehollandiae Heath Rat Pseudomys shortridgei CACATUIDAE Reptiles Pale Field-rat Rattus tunneyi Red-tailed Black-Cockatoo (south east subspecies) Calyptorhynchus banksii graptogyne CHELONIIDAE MYRMECOBIIDAE Glossy Black-Cockatoo (Kangaroo Island subspecies) Calyptorhynchus lathami halmaturinus Loggerhead Turtle Caretta caretta Numbat Myrmecobius fasciatus CASUARIIDAE GEKKONIDAE ORNITHORHYNCHIDAE Kangaroo Island Emu Dromaius baudinianus Mallee Worm-lizard Aprasia aurita Platypus Ornithorhynchus anatinus DICRURIDAE Striped Snake-lizard Delma impar OTARIIDAE Satin Flycatcher Myiagra cyanoleuca SCINCIDAE Subantarctic Fur-seal Arctocephalus tropicalis DIOMEDEIDAE Swamp Skink Egernia coventryi PERAMELIDAE Yellow-nosed Albatross (Indian Ocean subspecies) Diomedea chlororhynchos carteri Cunningham's Skink Egernia cunninghami Pig-footed Bandicoot Chaeropus ecaudatus Yellow-nosed Albatross (Atlantic Ocean subspecies) Diomedea chlororhynchos chlororhynchos Tjakura Egernia kintorei Golden Bandicoot Isoodon auratus Royal Albatross (northern subspecies) Diomedea epomophora sanfordi Black-striped Desert Skink Egernia slateri Lesser Bilby Macrotis leucura Sooty Albatross Diomedea fusca Salamander Skink Nannoscincus maccoyi Western Barred Bandicoot Perameles bougainville EUPETIDAE Pygmy Bluetongue Tiliqua adelaidensis Desert Bandicoot Perameles eremiana Spotted Quail-thrush (Mount Lofty Ranges subspecies) Cinclosoma punctatum anachoreta Eastern Barred Bandicoot Perameles gunnii Spotted Quail-thrush (south east subspecies) Cinclosoma punctatum punctatum Western Whipbird (eastern subspecies) Psophodes nigrogularis leucogaster

Appendix 2: National Parks and Wildlife Act 1972 - Schedule 8
South Australian Aquatic Sciences: Fisheries - Information Services
Interactions with Threatened, Endangered or Protected Species in South Australian Managed Fisheries – 2009/10, 2010/11 and 2011/12
35
Appendix 2: National Parks and Wildlife Act 1972 - Schedule 8
NATIONAL PARKS AND WILDLIFE ACT 1972 - SCHEDULE 8 Schedule 8—Vulnerable species Part 1—Animals
Common name Species Common name Species Common name Species Mammals Chestnut-rumped Heathwren (Flinders Ranges
subspecies) Calamanthus pyrrhopygius pedleri PROCELLARIIDAE
BALAENIDAE Southern Giant-Petrel Macronectes giganteus Southern Right Whale Eubalaena australis Chestnut-rumped Heathwren (south east subspecies) Calamanthus pyrrhopygius pyrrhopygius PSITTACIDAE BALAENOPTERIDAE ANATIDAE Blue-winged Parrot Neophema chrysostoma Sei Whale Balaenoptera borealis Freckled Duck Stictonetta naevosa Princess Parrot Polytelis alexandrae Fin Whale Balaenoptera physalus ARDEIDAE Regent Parrot (eastern subspecies) Polytelis anthopeplus monarchoides Humpback Whale Megaptera novaeangliae Australasian Bittern Botaurus poiciloptilus RALLIDAE BURRAMYIDAE CACATUIDAE Lewin's Rail Rallus pectoralis Eastern Pygmy-possum Cercartetus nanus Yellow-tailed Black-Cockatoo Calyptorhynchus funereus RECURVIROSTRIDAE DASYURIDAE CHARADRIIDAE Banded Stilt Cladorhynchus leucocephalus Yellow-footed Antechinus Antechinus flavipes Hooded Plover Thinornis rubricollis ROSTRATULIDAE Kowari Dasycercus byrnei DIOMEDEIDAE Painted Snipe Rostratula benghalensis Sandhill Dunnart Sminthopsis psammophila Buller's Albatross Diomedea bulleri SCOLOPACIDAE MACROPODIDAE Shy Albatross Diomedea cauta cauta Eastern Curlew Numenius madagascariensis Yellow-footed Rock-wallaby Petrogale xanthopus Salvin's Albatross Diomedea cauta salvini Reptiles Swamp Wallaby Wallabia bicolor Grey-headed Albatross Diomedea chrysostoma CHELIDAE MOLOSSIDAE Royal Albatross (southern subspecies) Diomedea epomophora epomophora Broad-shelled Tortoise Chelodina expansa Hairy-rostrum Freetail-bat ("hairy rostrum") Mormopterus species 6 Wandering Albatross Diomedea exulans Macquarie Tortoise Emydura macquarii MURIDAE Black-browed Albatross (Campbell Island subspecies) Diomedea melanophrys impavida CHELONIIDAE Greater Stick-nest Rat Leporillus conditor Light-mantled Sooty Albatross Diomedea palpebrata Green Turtle Chelonia mydas Fawn Hopping-mouse Notomys cervinus ESTRILDIDAE DERMOCHELYIDAE Dusky Hopping-mouse Notomys fuscus Diamond Firetail Stagonopleura guttata Leathery Turtle Dermochelys coriacea Plains Mouse Pseudomys australis GRUIDAE ELAPIDAE NOTORYCTIDAE Brolga Grus rubicunda Desert Death Adder Acanthopis pyrrhus Southern Marsupial Mole (Itjari-itjari) Notoryctes typhlops LARIDAE SCINCIDAE OTARIIDAE Great Skua (Macquarie and Heard Island subspecies) Catharacta skua lonnbergi Yellow-bellied Water Skink Eulamprus heatwolei Australian Sea-lion Neophoca cinerea MEGAPODIIDAE Musgrave Slider Lerista speciosa PERAMELIDAE Malleefowl Leipoa ocellata Glossy Grass Skink Pseudemoia rawlinsoni Southern Brown Bandicoot (Nuyts Isoodon obesulus nauticus MELIPHAGIDAE VARANIDAE Archipelago subspecies) Black-chinned Honeyeater (south eastern subspecies) Melithreptus gularis gularis Heath Goanna Varanus rosenbergi Southern Brown Bandicoot (SA mainland and Kangaroo Island subspecies)
Isoodon obesulus obesulus OTIDIDAE Amphibians Australian Bustard Ardeotis australis HYLIDAE
Greater Bilby Macrotis lagotis PETROICIDAE Golden Bell Frog Litoria raniformis VESPERTILIONIDAE Scarlet Robin (western subspecies) Petroica multicolor campbelli MYOBATRACHIDAE Greater Long-eared Bat (south eastern form) Nyctophilus timoriensis Flame Robin Petroica phoenicea Shoemaker Frog Neobatrachus sutor
Birds PHASIANIDAE Orange-crowned Toadlet Pseudophryne occidentalis ACANTHIZIDAE Brown Quail Coturnix ypsilophora Marbled Toadlet Pseudophryne semimarmorata Slender-billed Thornbill (St Vincent Gulf subspecies) Acanthiza iredalei rosinae

Appendix 3: National Parks and Wildlife Act 1972 - Schedule 9
South Australian Aquatic Sciences: Fisheries - Information Services
Interactions with Threatened, Endangered or Protected Species in South Australian Managed Fisheries – 2009/10, 2010/11 and 2011/12
36
Appendix 3: National Parks and Wildlife Act 1972 - Schedule 9
NATIONAL PARKS AND WILDLIFE ACT 1972 - SCHEDULE 9 Schedule 9—Rare species Part 1—Animals
Common name Species Common name Species Common name Species Common name Species Mammals Rufous Bristlebird (south east SA
subspecies) Dasyornis broadbenti broadbenti Southern Emu-wren (south east SA subspecies) Stipiturus malachurus polionotum
THRESKIORNITHIDAE BALAENOPTERIDAE Glossy Ibis Plegadis falcinellus Minke Whale Balaenoptera acutorostrata Western Gerygone Gerygone fusca Rufous-crowned Emu-wren Stipiturus ruficeps TURNICIDAE Bryde's Whale Balaenoptera edeni White-throated Gerygone Gerygone olivacea MELIPHAGIDAE Red-chested Button-quail Turnix pyrrhothorax DASYURIDAE ACCIPITRIDAE Grey Honeyeater Conopophila whitei Painted Button-quail Turnix varia Lesser Hairy-footed Dunnart Sminthopsis youngsoni Letter-winged Kite Elanus scriptus Blue-faced Honeyeater Entomyzon cyanotis TYTONIDAE DELPHINIDAE Black-breasted Buzzard Hamirostra melanosternon Painted Honeyeater Grantiella picta Grass Owl Tyto capensis Short-finned Pilot Whale Globicephala macrorhynchus ANATIDAE Purple-gaped Honeyeater (mainland
subspecies) Lichenostomus cratitius occidentalis Reptiles
Risso's Dolphin Grampus griseus Australasian Shoveler Anas rhynchotis AGAMIDAE False Killer Whale Pseudorca crassidens Musk Duck Biziura lobata Brown Honeyeater Lichmera indistincta Jacky Lizard Amphibolurus muricatus EMBALLONURIDAE Cape Barren Goose Cereopsis novaehollandiae Black-chinned Honeyeater (northern
subspecies) Melithreptus gularis laetior Spotted Dragon Ctenophorus maculatus
Yellow-bellied Sheathtail Bat Saccolaimus flaviventris Blue-billed Duck Oxyura australis McKenzie's Dragon Ctenophorus mckenziei Hill's Sheathtail Bat Taphozous hilli ANHINGIDAE Little Friarbird Philemon citreogularis Claypan Dragon Ctenophorus salinarum KOGIIDAE Darter Anhinga melanogaster Striped Honeyeater Plectorhyncha lanceolata BOIDAE Pygmy Sperm Whale Kogia breviceps ARDEIDAE Bassian Thrush Zoothera lunulata Woma Aspidites ramsayi Dwarf Sperm Whale Kogia simas Cattle Egret Ardea ibis ORIOLIDAE Carpet Python Morelia spilota MACROPODIDAE Intermediate Egret Ardea intermedia Olive-backed Oriole Oriolus sagittatus ELAPIDAE Eastern Grey Kangaroo Macropus giganteus Little Egret Egretta garzetta PACHYCEPHALIDAE Channel Country Whipsnake Demansia sp. ' Channel Country ' Red-necked Wallaby Macropus rufogriseus Eastern Reef Egret Egretta sacra Crested Shrike-tit Falcunculus frontatus Whipsnake Black-footed Rock Wallaby Petrogale lateralis pearsoni BURHINIDAE Gilbert's Whistler Pachycephala inornata White-lipped Snake Drysdalia coronoides MURIDAE Bush Stone-curlew Burhinus grallarius Red-lored Whistler Pachycephala rufogularis Bardick Echiopsis curta Swamp Rat Rattus lutreolus CACATUIDAE PETROICIDAE Spotted Brown Snake Pseudonaja guttata NEOBALAENIDAE Major Mitchell's Cockatoo Cacatua leadbeateri Hooded Robin (south east subspecies) Melanodryas cucullata cucullata Western Black-naped Snake Simoselaps bimaculatus Pygmy Right Whale Caperea marginata CAMPEPHAGIDAE Jacky Winter (south east subspecies) Microeca fascinans fascinans Common Bandy-Bandy Vermicella annulata OTARIIDAE White-bellied Cuckoo-shrike Coracina papuensis Scarlet Robin (eastern subspecies) Petroica multicolor boodang GEKKONIDAE Australian Fur-seal Arctocephalus pusillus CHARADRIIDAE PODICIPEDIDAE Northern Snake-lizard Delma borea PETAURIDAE Great Sand Plover Charadrius leschenaultii Great Crested Grebe Podiceps cristatus Patchwork Gecko Diplodactylus pulcher Sugar Glider Petaurus breviceps Lesser Sand Plover Charadrius mongolus POMATOSTOMIDAE Map Gecko Diplodactylus steindachneri PHALANGERIDAE Pacific Golden Plover Pluvialis fulva Grey-crowned Babbler (northern
subspecies) Pomatostomus temporalisrubeculus Pernatty Knob-tailed Gecko Nephrurus deleani
Common Brushtail Possum Trichosurus vulpecula CLIMACTERIDAE Marbled Velvet Gecko Oedura marmorata PHOCIDAE White-browed Treecreeper Climacteris affinis PROCELLARIIDAE Bronzeback Legless Lizard Ophidiocephalus taeniatus Leopard Seal Hydrurga leptonyx COLUMBIDAE Fleshy-footed Shearwater Puffinus carneipes SCINCIDAE Southern Elephant Seal Mirounga leonina Spinifex Pigeon Geophaps plumifera PSITTACIDAE Western Three-lined Skink Bassiana trilineata PHYSETERIDAE Flock Bronzewing Phaps histrionica Red-winged Parrot Aprosmictus erythropterus Ashy-downs Ctenotus Ctenotus astarte Sperm Whale Physeter macrocephalus CORCORACIDAE Elegant Parrot Neophema elegans Giant Desert Ctenotus Ctenotus grandis POTORIDAE White-winged Chough Corcorax melanorhamphos Rock Parrot Neophema petrophila Greer's Ctenotus Ctenotus greeri
Brush-tailed Bettong (western subspecies) Bettongia penicillata ogilbyi
DICRURIDAE Scarlet-chested Parrot Neophema splendida Blacksoil Ctenotus Ctenotus joanae Restless Flycatcher Myiagra inquieta Blue Bonnet (western subspecies) Northiella haematogaster narethae Paleface Ctenotus Ctenotus piankai
PTEROPODIDAE ESTRILDIDAE PTILONORHYNCHIDAE Southern Water Skink Eulamprus tympanum Grey-headed Flying-fox Pteropus poliocephalus Painted Finch Emblema pictum Western Bowerbird Chlamydera guttata Beach Slider Lerista arenicola Little Red Flying-fox Pteropus scapulatus Beautiful Firetail Stagonopleura bella RALLIDAE Speckled Slider Lerista baynesi VOMBATIDAE EUPETIDAE Spotless Crake Porzana tabuensis Dwarf four-toed Slider Lerista distinguenda Common Wombat Vombatus ursinus Chestnut Quail-thrush (eastern
subspecies) Cinclosoma castanotus castanotus SCOLOPACIDAE Long-legged Slider Lerista microtis
ZIPHIIDAE Common Sandpiper Actitis hypoleucos Desert Glossy Skink Notoscincus ornatus Arnoux's Beaked Whale Berardius arnouxi Western Whipbird (Kangaroo Island
subspecies) Psophodes nigrogularis lashmari Ruddy Turnstone Arenaria interpres Blacksoil Skink Proablepharus kinghorni
Southern Bottlenose Whale Hyperoodon planifrons Sanderling Calidris alba Bight Coast Skink Pseudemoia baudini Andrew's Beaked Whale Mesoplodon bowdoini FALCONIDAE Pectoral Sandpiper Calidris melanotos Tussock Skink Pseudemoia pagenstecheri Gray's Beaked Whale Mesoplodon grayi Grey Falcon Falco hypoleucos Long-toed Stint Calidris subminuta VARANIDAE Hector's Beaked Whale Mesoplodon hectori Peregrine Falcon Falco peregrinus Great Knot Calidris tenuirostris Short-tailed Pygmy Goanna Varanus brevicauda Shepherd's Beaked Whale Tasmacetus shepherdi HAEMATOPODIDAE Latham's Snipe Gallinago hardwickii Tree Goanna Varanus varius Cuvier's Beaked Whale Ziphius cavirostris Sooty Oystercatcher Haematopus fuliginosus Grey-tailed Tattler Heteroscelus brevipes Amphibians Pied Oystercatcher Haematopus longirostris Bar-tailed Godwit Limosa lapponica HYLIDAE
Birds LARIDAE Black-tailed Godwit Limosa limosa Knife-footed Frog Cyclorana cultripes ACANTHIZIDAE Kelp Gull Larus dominicanus Whimbrel Numenius phaeopus Smooth Frog Geocrinia laevis Slender-billed Thornbill (eastern subspecies) Acanthiza iredalei hedleyi
Common Tern Sterna hirundo Ruff Philomachus pugnax Brown Toadlet Pseudophryne bibroni MALURIDAE Wood Sandpiper Tringa glareola Small-headed Toadlet Uperoleia capitulata
Slender-billed Thornbill (western subspecies) Acanthiza iredalei iredalei
Grey Grasswren Amytornis barbatus Terek Sandpiper Xenus cinereus Striated Grasswren Amytornis striatus STRIGIDAE
Chestnut-breasted Whiteface Aphelocephala pectoralis Southern Emu-wren (Kangaroo Island subspecies) Stipiturus malachurus halmaturinus
Barking Owl Ninox connivens Shy Heathwren (Shy Hylacola) Calamanthus cautus

Appendix 4: Species Listed Under Part 13 of the EPBC Act as Threatened, Migratory Marine Species or Cetaceans
South Australian Aquatic Sciences: Fisheries - Information Services
Interactions with Threatened, Endangered or Protected Species in South Australian Managed Fisheries – 2009/10, 2010/11 and 2011/12
37
Appendix 4: Species Listed Under Part 13 of the EPBC Act as Threatened, Migratory Marine Species or Cetaceans
Table 18: Species listed under part 13 of the EPBC Act as Threatened, Migratory Marine Species or Cetaceans. Species group Individual family or species EPBC Listing Species group Individual family or species EPBC Listing
Fish Reptiles Sharks Grey Nurse Shark (Carcharias runca),
Seasnakes Various Listed Marine Species (Part 13, Division 4)
East Coast Population Critically Endangered West Coast Population Vulnerable Northern Rivers Shark (Glyphis sp. C) Critically Endangered Turtles Olive Ridley Turtle (Lepidochelys olivacea) Endangered Speartooth Shark (Glyphis sp. A) Endangered Loggerhead Turtle (Caretta caretta) Endangered Great White Shark (Carcharadon carcharias) Vulnerable Flatback Turtle (Natator depressus) Vulnerable Freshwater Sawfish (Pristis microdon) Vulnerable Green Turtle (Chelonia mydas) Vulnerable Green sawfish (Pristis zijsron) Vulnerable Hawksbill Turtle (Eretmochelys imbricata) Vulnerable Whale Shark (Rhincodon typus) Vulnerable Leatherback Turtle (Dermochelys coriacea) Vulnerable Syngnathids Pipefish
Listed Marine Species (Part 13, Division 4)
Other Seadragons Crocodiles Freshwater crocodile (Crocodylus johnstoni) Listed Marine Species
(Part 13, Division 4) Seahorses Saltwater crocodile (Crocodylus porosus) Other Spotted handfish (Brachionichthys Hirsutus) Endangered Red handfish (Brachionichthys politus) Vulnerable Mammals Water Fall Bay and Ziebels Handfish(Sympterichthys sp.) Vulnerable Cetaceans Southern Right Whale (Eubalaena australis) Endangered Blue Whale (Balaenoptera musculus) Endangered
Seabirds Humpback Whale (Megaptera novaeangliae) Vulnerable Albatross
Various, all of class Aves (Birds) are Listed Marine Species (Part 13, Division 4)
Sei Whale (Balaenoptera borealis) Vulnerable Boobies Fin Whale (Balaenoptera physalus) Vulnerable Cormorants Sperm Whale (Physeter macrocephalus)
All Cetaceans are listed under Part 13, Division 3
Frigatebirds False Killer Whale (Pseudorca crassidens) Gannets Killer Whale (Orcinus orca)
Gulls Pilot Whale (Globicephala macrorhynchus, G. melas)
Muttonbirds Indo Pacific Humpback Dolphin (Sousa chinensis) Noddies Australian snubnose dolphin (Orcaella heinsohni) Pelicans Spinner dolphins (Stenella sp.) Penguins Bottlenose Dolphin (Tursiops runcates) Petrels Other
Prions Dugong Dugong (Dugong dugon) Listed Marine Species
(Part 13, Division 4) Skuas
Terns Pinnipeds Australian sea lion (Neophoca cinerea) Vulnerable Tropic birds Australian fur seal (Arctocephalus forsteri) Vulnerable Other Southern elephant seal (Mirounga leonina) Vulnerable Sub-Antarctic fur seal (Arctocephalus tropicalis) Vulnerable Other Listed Marine
Species (Division 4 of Part 13)

Appendix 5: Fisheries Management Act 2007 (SA) Schedule 5 – Protected Species
South Australian Aquatic Sciences: Fisheries - Information Services
Interactions with Threatened, Endangered or Protected Species in South Australian Managed Fisheries – 2009/10, 2010/11 and 2011/12
38
Appendix 5: Fisheries Management Act 2007 (SA) Schedule 5 – Protected Species
Fisheries Management (General) Regulations 2007 Schedule 5—Protected species
• Murray River Crayfish (Euastacus armatus)
• South-east Crayfish (Euastacus bispinosa)
• Western Blue Groper (Achoerodus gouldii) in the waters of or near Spencer Gulf and Gulf
St. Vincent contained within and bounded by a line commencing at Mean High Water
Springs closest to 34°56′46.59″ South, 135°37′33.92″ East (Cape Carnot, Eyre Peninsula),
then beginning north-easterly following the line of Mean High Water Springs to the location
closest to 35°38′33.80″ South, 138°31′20.83″ East (Newland Head, Fleurieu Peninsula),
then south-westerly to the location on Mean High Water Springs closest to 35°50′32.70″
South, 138°08′03.59″ East (Cape Willoughby, Kangaroo Island), then beginning
north-easterly following the line of Mean High Water Springs to the location closest to
35°53′11.31″ South, 136°32′03.88″ East (Vennachar Point, Kangaroo Island), then
north-westerly to the point of commencement.
• Scalefish of the Family Syngnathidae
• Scalefish of the Genus Ambassidae
• Scalefish of any species of Mogurnda
• Scalefish of any species of Nannoperca
• Scalefish of the following species:
River Blackfish (Gadopsis marmoratus)
Freshwater Catfish (Tandanus tandanus)
Trout Cod (Maccullochella macquariensis)
Silver Perch (Bidyanus bidyanus)
• White Shark (Carcharodon carcharias)
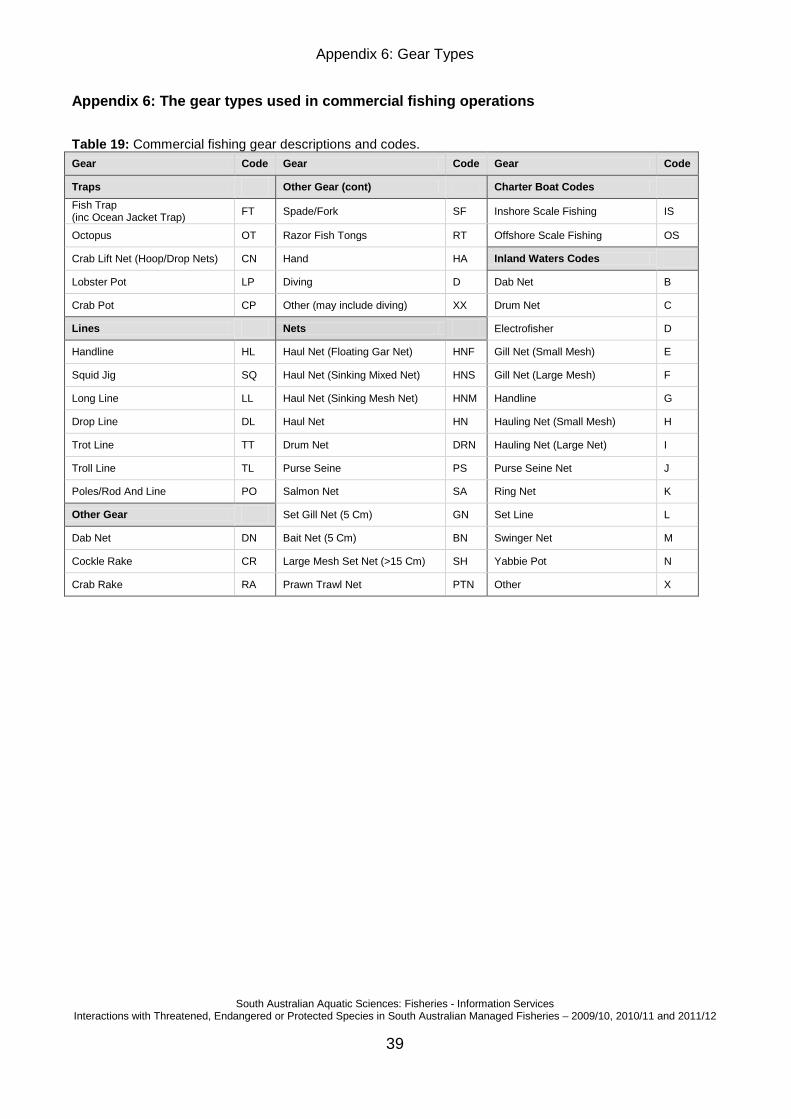
Appendix 6: Gear Types
South Australian Aquatic Sciences: Fisheries - Information Services
Interactions with Threatened, Endangered or Protected Species in South Australian Managed Fisheries – 2009/10, 2010/11 and 2011/12
39
Appendix 6: The gear types used in commercial fishing operations
Table 19: Commercial fishing gear descriptions and codes. Gear Code Gear Code Gear Code
Traps Other Gear (cont) Charter Boat Codes
Fish Trap (inc Ocean Jacket Trap) FT Spade/Fork SF Inshore Scale Fishing IS
Octopus OT Razor Fish Tongs RT Offshore Scale Fishing OS
Crab Lift Net (Hoop/Drop Nets) CN Hand HA Inland Waters Codes
Lobster Pot LP Diving D Dab Net B
Crab Pot CP Other (may include diving) XX Drum Net C
Lines Nets Electrofisher D
Handline HL Haul Net (Floating Gar Net) HNF Gill Net (Small Mesh) E
Squid Jig SQ Haul Net (Sinking Mixed Net) HNS Gill Net (Large Mesh) F
Long Line LL Haul Net (Sinking Mesh Net) HNM Handline G
Drop Line DL Haul Net HN Hauling Net (Small Mesh) H
Trot Line TT Drum Net DRN Hauling Net (Large Net) I
Troll Line TL Purse Seine PS Purse Seine Net J
Poles/Rod And Line PO Salmon Net SA Ring Net K
Other Gear Set Gill Net (5 Cm) GN Set Line L
Dab Net DN Bait Net (5 Cm) BN Swinger Net M
Cockle Rake CR Large Mesh Set Net (>15 Cm) SH Yabbie Pot N
Crab Rake RA Prawn Trawl Net PTN Other X

Appendix 7: Additional Reading
South Australian Aquatic Sciences: Fisheries - Information Services
Interactions with Threatened, Endangered or Protected Species in South Australian Managed Fisheries – 2009/10, 2010/11 and 2011/12
40
Appendix 7: Additional Reading
Chick, R.C. and Mayfield, S (2012). Central Zone Abalone (Haliotis laevigata & H. rubra) Fishery. Fishery Assessment Report to PIRSA Fisheries and Aquaculture. South Australian Research and Development Institute (Aquatic Sciences), Adelaide. SARDI Publication No. F2007/000611-4. SARDI Research Report Series No. 652. 67pp.
Chick, R.C., N. Turich, S. Mayfield & J. Dent (2009) Western Zone Abalone (Haliotis rubra & H. laevigata) Fishery (Region A). Fishery Assessment Report for PIRSA. South Australian Research and Development Institute (Aquatic Sciences), Adelaide, 90pp. SARDI Publication Number F2007/000561-3.
Currie, D.R (2011). South Australian Giant Crab (Pseudocarcinus gigas) Fishery Status Report 2009/10. Fishery Status Report to PIRSA Fisheries & Aquaculture. South Australian Research and Development Institute (Aquatic Sciences), Adelaide. SARDI Publication No. F2011/000332-1. SARDI Research Report Series No. 568. 8pp.
Currie, D.R (2010). South Australian Giant Crab (Pseudocarcinus gigas) Fishery Status Report 2008/09. South Australian Research and Development Institute (Aquatic Sciences), Adelaide. SARDI Publication No. F2007/000698-3. SARDI Research Report Series No. 427.
Currie, D.R., Dixon, C.D., Roberts, S.D., Hooper, G.E., Sorokin, S.J. and Ward, T.M. (2009). Fishery-independent by-catch survey to inform risk assessment of the Spencer Gulf Prawn Trawl Fishery. Report to PIRSA Fisheries. South Australian Research and Development Institute (Aquatic Sciences), Adelaide. SARDI Publication No. F2009/000369-1. SARDI Research Report Series No. 390.
Dixon, C.D. and Hooper, G.E (2010). Blue Crab (Portunus pelagicus) Fishery 2008/09. Stock Assessment Report to PIRSA Fisheries. South Australian Research and Development Institute (Aquatic Sciences), Adelaide. SARDI Publication No. F2007/000729–6. SARDI Research Report Series No. 428.
Dixon, C.D., Rodgers, G.G. and Hooper, G.E (2012). Blue Crab (Portunus armatus) Fishery 2010/11. Fishery Assessment Report to PIRSA Fisheries and Aquaculture. South Australian Research and Development Institute (Aquatic Sciences), Adelaide. SARDI Publication No. F2007/000729–8. SARDI Research Report Series No. 604. 75pp.
Dixon, C.D., Hooper, G.E. and Roberts, S.D (2010). Spencer Gulf Prawn Penaeus (Melicertus) latisulcatus Fishery 2008/09. Fishery Assessment Report to PIRSA Fisheries. South Australian Research and Development Institute (Aquatic Sciences), Adelaide. SARDI Publication No. F2007/000770-4. SARDI Research Report Series No. 511. 114pp.
Dixon, C. D., Hooper, G.E., Burch, P (2012). Spencer Gulf Prawn Penaeus (Melicertus) latisulcatus Fishery 2010/11. Fishery Assessment Report to PIRSA Fisheries and Aquaculture. South Australian Research and Development Institute (Aquatic Sciences), Adelaide. SARDI Publication No. F2007/000770-5. SARDI Research Report Series No. 603. 118pp.
Dixon, C.D., Roberts, S.D and Hooper, G.E (2011). Gulf St Vincent Prawn, Penaeus (Melicertus) latisulcatus, Fishery 2009/10. Fishery Assessment Report to PIRSA Fisheries and Aquaculture. South Australian Research and Development Institute (Aquatic Sciences), Adelaide. SARDI Publication No. F2007/000782-4. SARDI Research Report Series No. 526. 121pp.

Appendix 7: Additional Reading
South Australian Aquatic Sciences: Fisheries - Information Services
Interactions with Threatened, Endangered or Protected Species in South Australian Managed Fisheries – 2009/10, 2010/11 and 2011/12
41
Dixon, C.D., Hooper, G.E and Burch, P (2012). Gulf St Vincent Prawn, Penaeus (Melicertus) latisulcatus, Fishery 2010/11. Fishery Assessment Report to PIRSA Fisheries and Aquaculture. South Australian Research and Development Institute (Aquatic Sciences), Adelaide. SARDI Publication No. F2007/000782-5. SARDI Research Report Series No. 631. 112pp.
Ferguson, G (2011). The South Australian Lakes and Coorong Fishery. Fishery Stock Status Report for PIRSA Fisheries. South Australian Research and Development Institute (Aquatic Sciences), Adelaide. SARDI Publication No. F2009/000669-2. SARDI Research Report Series No. 527. 17pp.
Ferguson, G (2012). The South Australian Lakes and Coorong Fishery. Fishery Stock Status Report for PIRSA Fisheries and Aquaculture. South Australian Research and Development Institute (Aquatic Sciences), Adelaide. SARDI Publication No. F2009/000669-3. SARDI Research Report Series No. 598. 17pp.
Ferguson, G.J. (2012). The South Australian Lakes and Coorong Fishery. Fishery Stock Status Report for PIRSA Fisheries and Aquaculture. South Australian Research and Development Institute (Aquatic Sciences), Adelaide. SARDI Publication No. F2009/000669-4. SARDI Research Report Series No. 675. 17pp.
Ferguson, G. J. and Ye, Q (2012). Stock Assessment of Golden perch (Macquaria ambigua). Stock Assessment Report for PIRSA Fisheries and Aquaculture. South Australian Research and Development Institute (Aquatic Sciences), Adelaide. F2007/01051-1. SARDI Research Report Series No. 656. 55pp.
Fowler AJ, Lloyd M, Schmarr D (2009). A preliminary consideration of by-catch in the Marine Scalefish fishery of South Australia. South Australian Research and Development Institute (Aquatic Sciences), Adelaide, F2009/000097-1. SARDI Research Report Series No. 365. 79pp.
Fowler A.J., Steer, M.A., Huveneers, C., Lloyd, M.T. and Jackson, W.B (2012). Understanding the movement of Snapper (Pagrus auratus) and its contribution to the changing spatial structure of South Australia’s Snapper Fishery. Progress report for 2011-12. South Australian Research and Development Institute (Aquatic Sciences), Adelaide. F2012/000366-1. SARDI Research Report Series No. 650. 69pp.
Fowler, A.J., McGarvey, R., Steer, M.A., Feenstra, J.E (2010). The South Australian Marine Scalefish Fishery – Stock Status Report. Report to PIRSA. South Australian Research and Development Institute (Aquatic Sciences), Adelaide. SARDI Publication No. F2007/000565-5. SARDI Research Report Series No. 507. 29pp.
Fowler, A.J., McGarvey, R., Steer, M.A. and Feenstra, J.E. (2012). South Australian Marine Scalefish Fishery. Stock Status Report 2011/12. Report to PIRSA Fisheries and Aquaculture. South Australian Research and Development Institute (Aquatic Sciences), Adelaide, F2007/000565-7. SARDI Research Report Series No. 681. 44pp.
Goldsworthy SD, Hamer D, Page B (2007) Assessment of the implications of interactions between fur seals and sea lions and the southern rock lobster and gillnet sector of the Southern and Eastern Scalefish and Shark Fishery (SESSF) in South Australia. SARDI Aquatic Sciences Publication Number F2007/000711-1. SARDI Research Report Series Number 225, pp 164.

Appendix 7: Additional Reading
South Australian Aquatic Sciences: Fisheries - Information Services
Interactions with Threatened, Endangered or Protected Species in South Australian Managed Fisheries – 2009/10, 2010/11 and 2011/12
42
Goldsworthy SD., Page BC (2007) A Risk-Assessment Approach to Evaluating the Significance of Seal Bycatch in two Australian Fisheries. Biological Conservation 139: 269-285.
Goldsworthy SD, Page B, Shaughnessy PD, Hamer D, Peters KD, McIntosh RR, Baylis AMM, McKenzie J. (2009). Innovative solutions for aquaculture planning and management: addressing seal interactions in the finfish aquaculture industry. FRDC Project 2009/201 Final Report. SARDI Aquatic Sciences Publication Number F2008/000222-1, SARDI Research Report Series Number 288. 290pp.
Goldsworthy, S.D., Page, B., Rogers, P. and Ward, T. (2010) Establishing ecosystem-based management for the South Australian Sardine Fishery: developing ecological performance indicators and reference points to assess the need for ecological allocations South Australian Research and Development Institute (Aquatic Sciences), Adelaide. SARDI Publication No. F2010/000863-1. SARDI Research Report Series No. 529. 173pp.
Goldsworthy SD, Page B, Shaughnessy PD, Linnane, A. (2010). Mitigating seal interactions in the SRLF and the gillnet sector SESSF in South Australia. FRDC Project 2007/041 Final Report. SARDI Aquatic Sciences Publication Number F2009/000613-1, SARDI Research Report Series Number 405, 213pp.
Gorman, D., Hooper, G.E. and Dixon, C.D (2012). West Coast Prawn, Penaeus (Melicertus) latisulcatus Fishery 2011. Fishery Status Report to PIRSA Fisheries and Aquaculture. South Australian Research and Development Institute (Aquatic Sciences), Adelaide. SARDI Publication No. F2007/000772-5. SARDI Research Report Series No. 638. 22pp.
Hamer, D.J., Ivey, A, and Ward, T.M. (2009) Operational interactions of the South Australian Sardine Fishery with the Common Dolphin: November 2004 to March 2009. Report to PIRSA Fisheries. SARDI Aquatic Sciences Publication Number F2007/001098–2. SARDI Research Report Series No. 354.
Hamer DJ, Ward TM, Goldsworthy SD, Shaughnessy PD (2009) Effectiveness of the Great Australian Bight Marine Park in protecting the Australian sea lion (Neophoca cinerea) from by-catch mortality in shark gill-nets. Report to Great Australian Bight Marine Park Steering Committee. SARDI Aquatic Sciences Publication No. F2009/000227-1, SARDI Research Report Series No. 357. 59pp.
Hooper, G.E., Dixon, C.D. and Roberts, S.D (2011). West Coast Prawn, Penaeus (Melicertus) latisulcatus Fishery, 2010. Fishery Status Report to PIRSA Fisheries and Aquaculture. South Australian Research and Development Institute (Aquatic Sciences), Adelaide. SARDI Publication No. F2007/000772-4. SARDI Research Report Series No. 563. 20pp.
Hooper, G.E., Dixon, C.D. and Roberts, S.D (2010). West Coast Prawn, Penaeus (Melicertus) latisulcatus Fishery, 2009. Fishery Status Report to PIRSA Fisheries. South Australian Research and Development Institute (Aquatic Sciences), Adelaide. SARDI Publication No. F2007/000772-3. SARDI Research Report Series No. 450. 23p.
Hooper, G.E., Dixon, C.D. and Roberts, S.D (2010). Spencer Gulf Prawn Penaeus (Melicertus) latisulcatus Fishery Status Report 2009/10. Fishery Status Report to PIRSA Fisheries. South Australian Research and Development Institute (Aquatic Sciences), Adelaide. SARDI Publication No. F2007/001094-4. SARDI Research Report Series No. 512. 38pp.

Appendix 7: Additional Reading
South Australian Aquatic Sciences: Fisheries - Information Services
Interactions with Threatened, Endangered or Protected Species in South Australian Managed Fisheries – 2009/10, 2010/11 and 2011/12
43
Hooper, G.E. and Roberts, S.D. (2009). Gulf St Vincent Prawn Penaeus (Melicertus) latisulcatus Fishery Status Report 2008/09. South Australian Research and Development Institute (Aquatic Sciences), Adelaide, 40pp. SARDI publication No. F2007/001074-3.
Izzo, C., Gillanders, B.M. and Ward, T.M (2012). Movement patterns and stock structure of Australian sardine (Sardinops sagax) off South Australia and the East Coast: implications for future stock assessment and management. Final Report to the Fisheries Research and Development Corporation. South Australian Research and Development Institute (Aquatic Sciences), Adelaide. SARDI Publication No. F2011/000487-1. SARDI Research Report Series No. 611. 102pp.
Knight. M (2009). The South Australian Recreational Charter Boat Fishery Report 2009. South Australian Research and Development Institute (Aquatic Sciences), Adelaide, 46p. SARDI Publication No. F2007/000847-2.
Knight, M.A. and Tsolos, A (2011). South Australian Wild Fisheries Information and Statistics Report 2009/10. South Australian Research and Development Institute (Aquatic Sciences), Adelaide. SARDI Publication No. F2008/000804-3. SARDI Research Report Series No. 521. 60pp.
Knight, M.A. and Tsolos, A (2012). South Australian Wild Fisheries Information and Statistics Report 2010/11. South Australian Research and Development Institute (Aquatic Sciences), Adelaide. SARDI Publication No. F2008/000804-4. SARDI Research Report Series No. 612. 57pp.
Knight, M.A. and Vainickis, A.A (2011). Interactions with Threatened, Endangered or Protected Species in South Australian Managed Fisheries – 2007/08, 2008/09, and 2009/10. Report to PIRSA Fisheries and Aquaculture. South Australian Research and Development Institute (Aquatic Sciences), Adelaide. SARDI Publication No. F2009/000544-1. SARDI Research Report Series No.534. 44pp.
Linnane, A., McGarvey, R., Feenstra, J. and P. Hawthorne (2011). Southern Zone Rock Lobster (Jasus edwardsii) Fishery 2009/10. Fishery Assessment Report to PIRSA Fisheries and Aquaculture. South Australian Research and Development Institute (Aquatic Sciences), Adelaide. SARDI Publication No. F2007/000276-4. SARDI Research Report Series No. 560. 95pp.
Linnane, A., McGarvey, R, Feenstra, J. and P. Hawthorne (2010). Southern Zone Rock Lobster (Jasus edwardsii) Fishery 2008/09. Fishery assessment report to PIRSA. South Australian Research and Development Institute (Aquatic Sciences), Adelaide, 95pp. SARDI Publication Number F2007/000276-3. SARDI Research Report Series No. 476.
Linnane, A., McGarvey, R., Feenstra, J. and Hawthorne, P (2010). Southern Zone Rock Lobster (Jasus edwardsii) Fishery Status Report 2009/10. Status Report to PIRSA Fisheries. South Australian Research and Development Institute (Aquatic Sciences), Adelaide. SARDI Publication No. F2007/000715-4. SARDI Research Report Series No. 514. 24pp.
Linnane, A., McGarvey, R., Feenstra, J. and P. Hawthorne (2012). Southern Zone Rock Lobster (Jasus edwardsii) Fishery 2010/11. Fishery Assessment Report to PIRSA Fisheries and Aquaculture. South Australian Research and Development Institute (Aquatic Sciences), Adelaide. SARDI Publication No. F2007/000276-5. SARDI Research Report Series No. 645. 89pp.

Appendix 7: Additional Reading
South Australian Aquatic Sciences: Fisheries - Information Services
Interactions with Threatened, Endangered or Protected Species in South Australian Managed Fisheries – 2009/10, 2010/11 and 2011/12
44
Linnane, A., McGarvey, R., Feenstra, J. and Hawthorne, P. (2012). Southern Zone Rock Lobster (Jasus edwardsii) Fishery 2011/12. Status Report to PIRSA Fisheries and Aquaculture. South Australian Research and Development Institute (Aquatic Sciences), Adelaide. SARDI Publication No. F2007/000715-6. SARDI Research Report Series No. 677. 23pp.
Linnane, A., McGarvey, R., Feenstra, J and M. Hoare (2011). Northern Zone Rock Lobster (Jasus edwardsii) Fishery 2009/10. Fishery Assessment Report to PIRSA Fisheries and Aquaculture. South Australian Research and Development Institute (Aquatic Sciences), Adelaide. SARDI Publication No. F2007/000320-4. SARDI Research Report Series No. 561. 82pp.
Linnane, A., McGarvey, R., Feenstra, J and M. Hoare (2010). Northern Zone Rock Lobster (Jasus edwardsii) Fishery 2008/09. Fishery assessment report to PIRSA. South Australian Research and Development Institute (Aquatic Sciences), Adelaide, 83pp. SARDI Publication Number F2007/00320-3. SARDI Research Report Series No. 475.
Linnane, A., McGarvey, R., Feenstra, J. and Hoare, M (2010). Northern Zone Rock Lobster (Jasus edwardsii) Fishery Status Report 2009/10. Status Report to PIRSA Fisheries. South Australian Research and Development Institute (Aquatic Sciences), Adelaide. SARDI Publication No. F2007/000714-4. SARDI Research Report Series No. 513. 21pp.
Linnane, A., McGarvey, R., Feenstra, J and M. Hoare (2012). Northern Zone Rock Lobster (Jasus edwardsii) Fishery 2010/11. Fishery assessment report to PIRSA Fisheries and Aquaculture. South Australian Research and Development Institute (Aquatic Sciences), Adelaide. SARDI Publication No. F2007/000320-5. SARDI Research Report Series No. 644. 78pp.
Linnane, A., McGarvey, R., Feenstra, J. and Hoare, M. (2012). Northern Zone Rock Lobster (Jasus edwardsii) Fishery 2011/12. Status Report to PIRSA Fisheries and Aquaculture. South Australian Research and Development Institute (Aquatic Sciences), Adelaide. SARDI Publication No. F2007/000714-6. SARDI Research Report Series No. 678. 22pp.
Mayfield, S. and Hogg, A (2011). Southern Zone Abalone Fishery (Haliotis rubra & H. laevigata). Fishery Assessment Report for PIRSA Fisheries and Aquaculture. South Australian Research and Development Institute (Aquatic Sciences), Adelaide. SARDI Publication No. F2007/000552-3. SARDI Research Report Series No. 535. 57pp.
Mayfield, S., Carlson, I.J., and Chick, R.C (2010). Central Zone Abalone Fishery (Haliotis laevigata and H. rubra) Stock Assessment Report for PIRSA Fisheries. CONFIDENTIAL. South Australian Research and Development Institute (Aquatic Sciences), Adelaide. SARDI Publication No. F2007/000611-3. SARDI Research Report Series No. 510. 69pp.
Mayfield, S, Hogg, A, Saunders, TM & Burch, P (2009). Southern Zone Abalone (Haliotis rubra & H. laevigata) Fishery: Fishery Assessment Report for PIRSA. SARDI Aquatic Sciences Publication No.F2007/000552-2. SARDI Research Report Series No. 350. April 2009.
Sorokin, S.J., Connolly, R.M. & Currie, D.R. (2009) Syngnathids of the Spencer Gulf – morphometrics and isotopic signatures. South Australian Research and Development Institute (Aquatic Sciences), Adelaide, 30pp. SARDI Publication No. F2009/000655-1.

Appendix 7: Additional Reading
South Australian Aquatic Sciences: Fisheries - Information Services
Interactions with Threatened, Endangered or Protected Species in South Australian Managed Fisheries – 2009/10, 2010/11 and 2011/12
45
Steer, M.A., McGarvey, R., Fowler, A.J., Burch, P., Feenstra, J.E., Jackson, W.B. and Lloyd, M.T (2012). Southern Garfish (Hyporhamphus melanochir) Fishery. Report to PIRSA Fisheries and Aquaculture. South Australian Research and Development Institute (Aquatic Sciences), Adelaide. SARDI Publication No. F2007/000720-3. SARDI Research Report Series No. 658. 76pp.
Stobart, B., Dent, J.J., Matthews, R.C., Chick, R.C. and Mayfield, S (2011). Western Zone Abalone (Haliotis rubra & H. laevigata) Fishery (Region A). Fisheries status report to PIRSA Fisheries and Aquaculture. South Australian Research and Development Institute (Aquatic Sciences), Adelaide. SARDI Publication No. F2011/000290-1. SARDI Research Report Series No. 565. 46pp.
Stobart, B., Mayfield, S., Dent, J., Matthews, D.J. and Chick, R.C (2012). Western Zone Abalone (Haliotis rubra & H. laevigata) Fishery (Region A). Fishery Stock Assessment Report to PIRSA Fisheries and Aquaculture. South Australian Research and Development Institute (Aquatic Sciences), Adelaide. SARDI Publication No. F2007/000561-4. SARDI Research Report Series No. 660. 118pp.
Stobart, B., Dent, J.J., Matthews, D., Chick, R.C and Mayfield, S (2010) Western Zone Abalone (Haliotis laevigata & H. rubra) Fishery (Region B). Fishery Assessment Report to PIRSA Fisheries. South Australian Research and Development Institute (Aquatic Sciences), Adelaide. SARDI Publication No. F2010/000389-1. SARDI Research Report Series No. 485. 23pp.
Stobart, B., Mayfield, S., Dent, J. and Matthews, D.J (2012).Western Zone Abalone (Haliotis laevigata & H. rubra) Fishery (Region B). Fishery Stock Assessment Report to PIRSA Fisheries and Aquaculture. South Australian Research and Development Institute (Aquatic Sciences), Adelaide. SARDI Publication No. F2010/000389-2. SARDI Research Report Series No. 661. 32pp.
Tilzey, R.D.J., Goldsworthy, S., Cawthorn, M., Calvert, N., Hamer, D., Russell, S., Shaughnessy, P.D., Wize, B. and Stewardson, C (2006). Assessment of seal-fishery interactions in the winter blue grenadier fishery off west Tasmania and the development of fishing practices and Seal Exclusion Devices to mitigate seal bycatch by factory trawlers. Final Report to the FRDC. Project no. 2001/008. February 2006. 69pp.
Ward, T.M., Ivey, A., Hamer, D.J. and Burch, P (2010). Effectiveness of an industry Code of Practice in mitigating the operational interactions of the South Australian Sardine Fishery with the short-beaked common dolphin (Delphinus delphis). South Australian Research and Development Institute (Aquatic Sciences), Adelaide. SARDI Publication No. F2010/000726-1. SARDI Research Report Series No. 493. 38pp.
Ward, T.M., Ivey, A. and Burch, P. (2012). Effectiveness of an industry Code of Practice in mitigating the operational interactions of the South Australian Sardine Fishery with the short-beaked common dolphin (Delphinus delphis). Report to PIRSA Fisheries and Aquaculture. South Australian Research and Development Institute (Aquatic Sciences), Adelaide. SARDI Publication No. F2010/000726-3. SARDI Research Report Series No. 666. 27pp.
Ward, T.M., Burch, P. and Ivey, A.R (2010). South Australian Sardine (Sardinops sagax) Fishery: Stock Assessment Report 2010. Report to PIRSA Fisheries. South Australian Research and Development Institute (Aquatic Sciences), Adelaide. SARDI Publication No. F2007/000765-3. SARDI Research Report Series No.496. 105pp.

Appendix 7: Additional Reading
South Australian Aquatic Sciences: Fisheries - Information Services
Interactions with Threatened, Endangered or Protected Species in South Australian Managed Fisheries – 2009/10, 2010/11 and 2011/12
46
Ward T.M., Burch, P. and Ivey, A.R. (2012). South Australian Sardine (Sardinops sagax) Fishery: Stock Assessment Report 2012. Report to PIRSA Fisheries and Aquaculture. South Australian Research and Development Institute (Aquatic Sciences), Adelaide. SARDI Publication No. F2007/000765-4. SARDI Research Report Series No. 667. 101pp.
Ward, T.M., Lyle, J., Keane, J.P., Begg, G.A., Hobsbawn. P., Ivey. A.R., Sakabe. R. Steer, M.A (2012). Commonwealth Small Pelagic Fishery: Fishery Assessment Report 2011. Report to the Australian Fisheries Management Authority. South Australian Research and Development Institute (Aquatic Sciences), Adelaide. SARDI Publication No. F2010/000270-3. SARDI Research Report Series No. 614. 98pp.
Vainickis, A.A (2010). SARDI Aquatic Sciences Information Systems Quality Assurance and Data Integrity Report 2010. South Australian Research and Development Institute (Aquatic Sciences), Adelaide. SARDI Publication No. F2009/000267-2. SARDI Research Report Series No. 497. 213pp.