interactions between ocean biogeochemistry and climate guest presentation for at 762 taka ito how...
TRANSCRIPT

Interactions between ocean biogeochemistry and climate
Guest presentation for AT 762Taka Ito
• How does marine biogeochemistry interact with climate?
• What can we learn from past climate changes?
• What are the implications for future climate change?

Outline• Introductions
- Coupling mechanisms
- Two-way interactions
• Insights from past climate changes
- Climate of the past 60 million years
- Glacial-interglacial climate change
• Present and future climate
- The future of oceanic carbon uptake
- The Southern Ocean

How does marine biology impacts on climate?
Modified from Sarmiento and Gruber (2006)
Air-sea CO2
exchange
SW absorption
DMS emission
Greenhouse effect
Clouds
SST
Ocean carbon cycle
Photosynthesis by phytoplankton

How does climate impact on marine biology?
• Ocean circulation, nutrient transport• Eddy, frontal scale ~ 100km
Cold, nutrient-rich coastal water
Warm open ocean
High biological production
Low biological production Coastal upwellingCoastal upwelling

Ocean currents control marine biology
• Basin, planetary scale ~ 10,000 km
• Large-scale atmospheric wind patterns
Upwelling
Upwelling
Downwelling
Downwelling
Upwelling
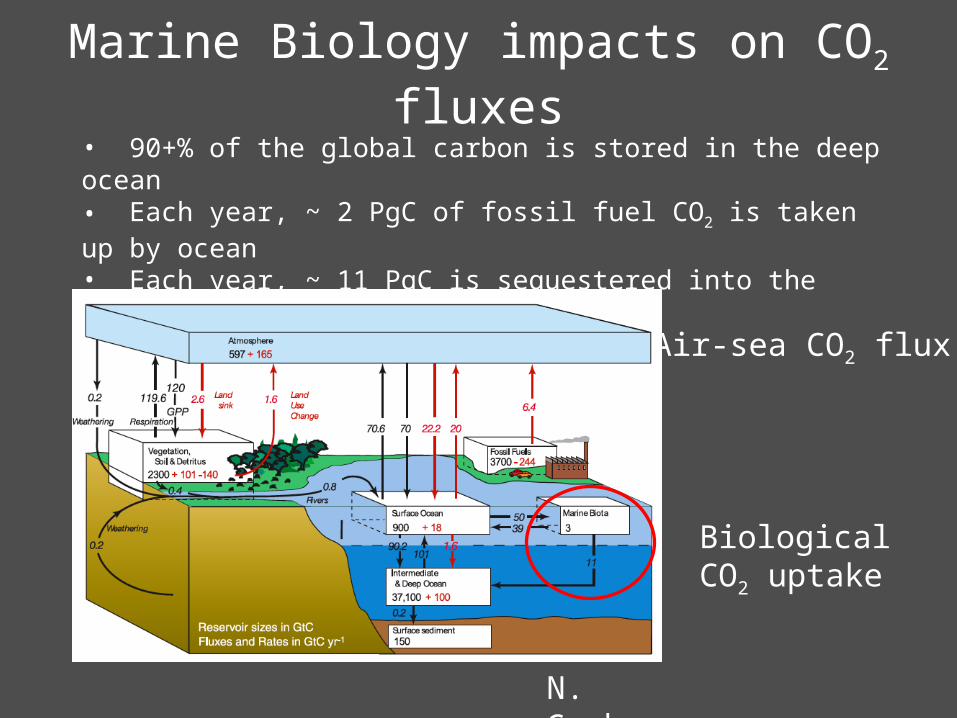
Marine Biology impacts on CO2 fluxes
• 90+% of the global carbon is stored in the deep ocean• Each year, ~ 2 PgC of fossil fuel CO2 is taken up by ocean• Each year, ~ 11 PgC is sequestered into the deep ocean by marine organism
BiologicalCO2 uptake
N. Gruber
Air-sea CO2 flux

Ocean carbon pumps• Vertical gradient of DIC in the ocean (Volk and Hoffert, 1985)• Simple 1D model (single column view)• Vertical temperature gradient (solubility pump)• Sinking organic material (biological pump)
N. Gruber
Current oceanic inventory of biologically sequestered DIC~ 1700 PgC
CaCO3 burial is the ultimate sink of CO2 from weathering, volcanism and human emission (10K+ years)

Evolution of the Earth’s climate for the last 60 million years
Zachos et al. (2001) Science
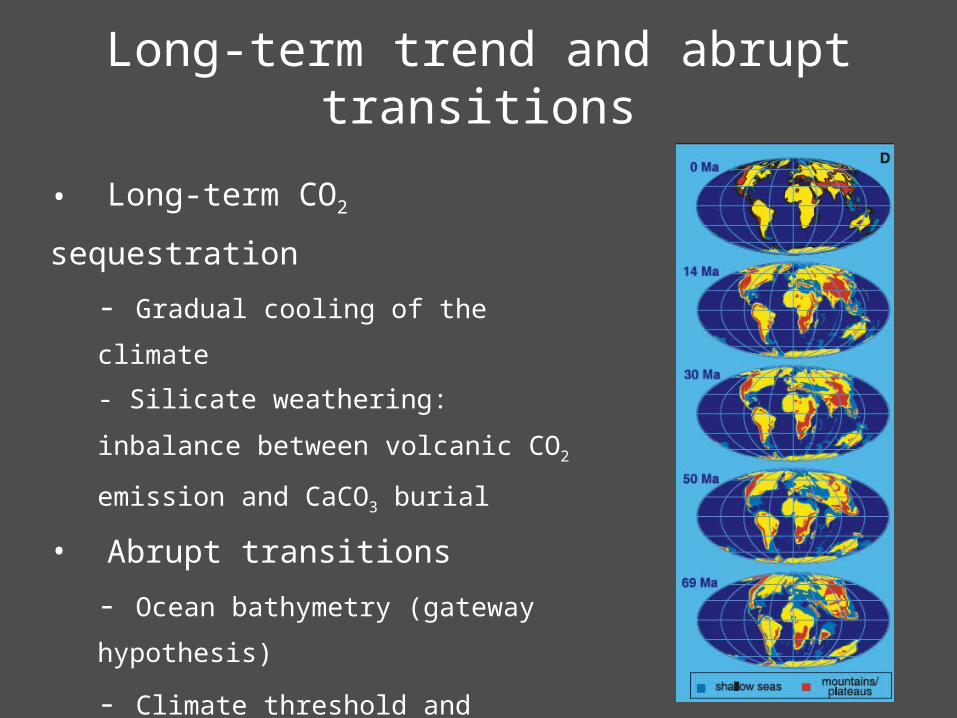
Long-term trend and abrupt transitions
• Long-term CO2 sequestration
- Gradual cooling of the climate
- Silicate weathering: inbalance between
volcanic CO2 emission and CaCO3 burial
• Abrupt transitions
- Ocean bathymetry (gateway hypothesis)
- Climate threshold and feedbacks
ex. ice sheet and ice-albedo
feedback
- Ocean circulation and biogeochemistry
are involved in both hypothesis

Evolution of the Earth’s climate for the last 400,000 years
Vostok ice coreVostok ice core
About 50% of glacial cooling is due to the change in CO2 and the rest comes from planetary albedo
• Orbital pacing of climate

Condition during glacial maximum
pCO2 (ppmv)
Terrestrial carbon loss (500 PgC) +13
Ocean cooling (-3oC) -30
Ocean salinity increase (3%) +7
Subtotal -10
Known perturbations in the global carbon cycle
The net effect is O(10 ppm) and is not enough to account for the 100 ppmv change
Sigman and Boyle (2000) Nature
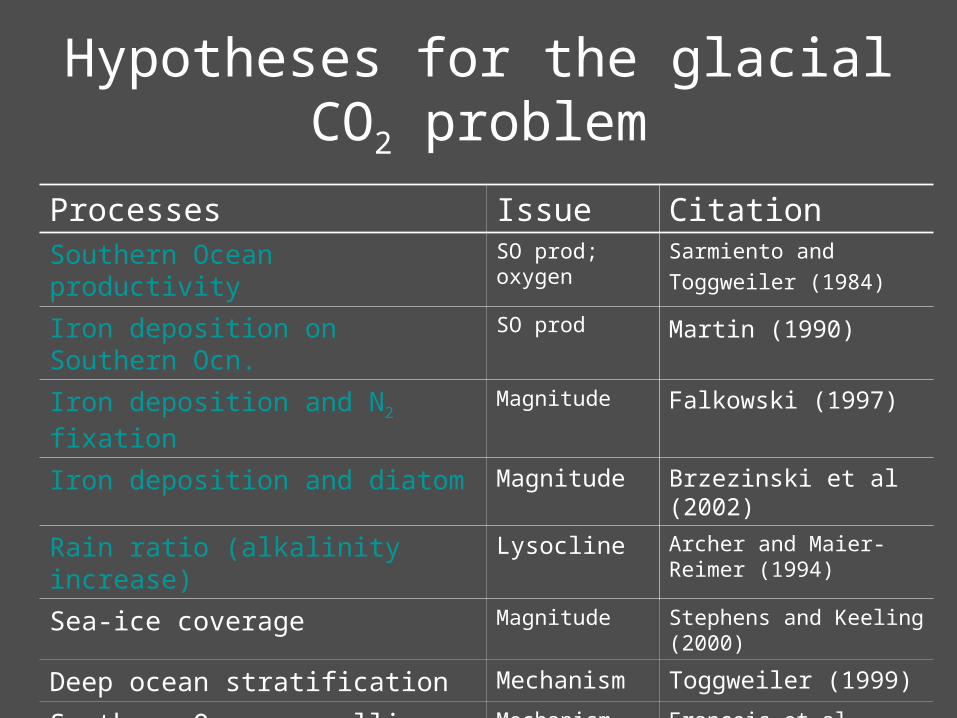
Processes Issue CitationSouthern Ocean productivity SO prod;
oxygenSarmiento and Toggweiler (1984)
Iron deposition on Southern Ocn.
SO prod Martin (1990)
Iron deposition and N2 fixation Magnitude Falkowski (1997)
Iron deposition and diatom Magnitude Brzezinski et al (2002)
Rain ratio (alkalinity increase) Lysocline Archer and Maier-Reimer (1994)
Sea-ice coverage Magnitude Stephens and Keeling (2000)
Deep ocean stratification Mechanism Toggweiler (1999)
Southern Ocean upwelling Mechanism Francois et al (1997); Sigman and Boyle (2000)
Hypotheses for the glacial CO2 problem

Southern Ocean productivity
Idealized box model study (Toggweiler and Sarmiento, 1984)
– Atmospheric pCO2 is proportional to the high lat surface nutrient (PH)
– 50% reduction of surface P can reproduce glacial pCO2
• Large amount of unutilized surface nutrient (P)
- Why phosphorus is not used up in the Southern Ocean?
Surface phosphate climatology (WOA01)

Iron limitation in the Southern Ocean
• Iron is necessary nutrient for marine phytoplankton– Major source is atmospheric dust
deposition– Southern Ocean, far from continental
dust sources, is depleted in Fe
• SOIREE (Boyd et al. 2001)
– Purposeful iron addition experiment– Increased marine productivity after
iron addition– It is not yet clear its long-term impact
on the oceanic carbon uptake

Antarctic ice core data
• Increased dust deposition during cold and arid ice age climates (Vostok ice core data)
• Iron hypothesis (Martin, 1990)

Climate, iron and N2 fixation
• Nitrogen cycle (NO3, NO2, NH4, Organic nitrogen)
• With NO3:PO4 ratio is slightly less than 16, ocean is slightly depleted in N
• Some organisms can utilize N from dissolved N2 gas (N2 fixers)
• Increased Fe input to the ocean can stimulate N2 fixation (Falkowski 1997)

Outstanding issues
• Ocean GCM coupled to marine ecosystem model (with explicit Fe cycle) still cannot reproduce glacial pCO2
- Small response in atmospheric CO2
- Regional compensation
• Other mechanisms?- Ocean circulation / seaice changes- Phytoplankton community structure changes and its impact on
CaCO3 burial
- Total nutrient inventory (N2 fixation) and its response to the increased iron deposition

What controls the air-sea CO2 flux in the present climate?
• Takahashi et al. (2002)

What controls the air-sea CO2 flux?
• Patterns of uptake and outgassing for natural CO2
• CO2 uptake: cooling and net biological carbon sink
• CO2 outgassing: heating and upwelling of regenerated DIC
Thermal flux Biological flux

Simulated anthropogenic CO2 fluxes
• Highlights the importance of the Southern Ocean
Forward model: OCMIP-2Orr et al. (2002)
Inverse model: Mikaloff-Fletcher et al. (2006)
• Difference between two simulations for preindustrial and contemporary conditions

Mean CO2 fluxes
out of oceaninto ocean(mol m-2 yr-1)
• Extratropical SH is a region of net CO2 uptake
• Is the SH carbon flux changing? How?
Natural Anthro
Lovenduski et al. (2007)
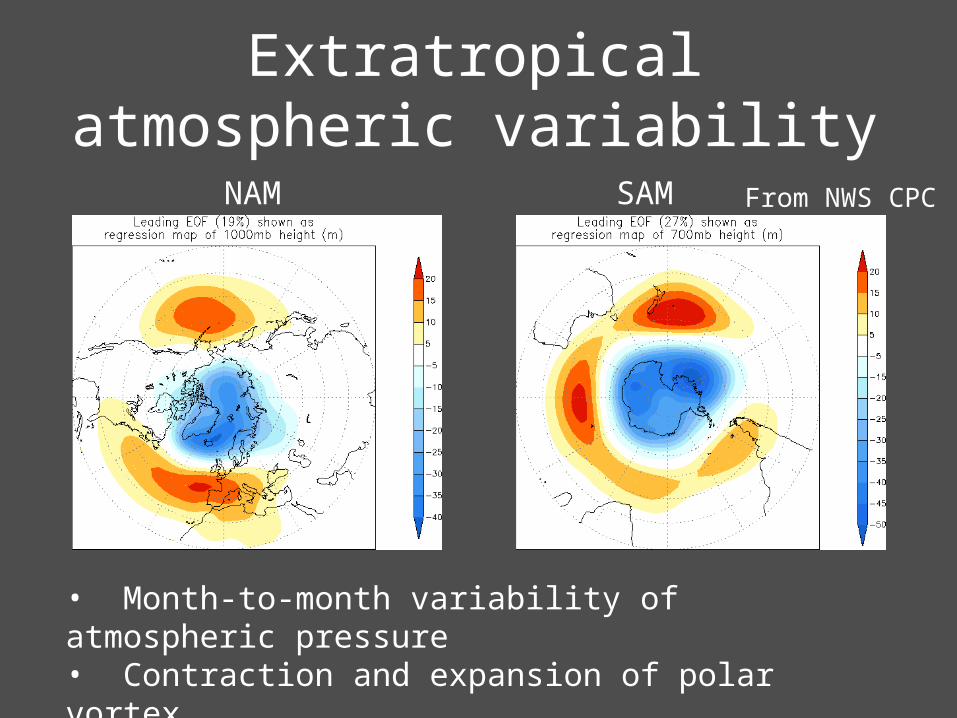
Extratropical atmospheric variability
• Month-to-month variability of atmospheric pressure• Contraction and expansion of polar vortex• Shift of westerly wind belt
From NWS CPC
NAM SAM

SAM impacts on SH circulation
Rintoul et al. (2000)
• During positive phase of SAM, stronger wind over ACC increases zonal transport and upwelling in the Antarctic region
Hall and Visbeck (2002)

Observed biological response
• Chlorophyll responds to SAM (Lovenduski and Gruber 2005)
• Antarctic region- Chl increases with SAM index
• Subantarctic region-Chl decreases with SAM index
Regression of SeaWIFS chlorophyll anomaly onto SAM index (1997-2004)
• Mechanisms?
• Impact on carbon fluxes?

Variability of SH carbon fluxes
• Positive-phase of SAM leads to anomalous outgassing- Atmospheric CO2 budget: Butler et al. (2007)- GCM simulation: Lovenduski et al. (2007)
• Driven by increased wind-driven upwelling of deep waters enriched in DIC
Regression of CO2 flux onto SAM index

Multi-decadal trends
• Linear trend (1979-2005) based on satellite observation• Relatively small temperature change in the SH
- Large heat capacity of the Southern Ocean
Observed temperature trend : IPCC (2007) chap 3

Observed and modeled SAM trends
• Positive trend in SAM• All of the IPCC models predict positive trend• Driven by ozone depletion and global warming• Stronger westerly wind over ACC
G. Marshall (2003) R. Miller (2006)
Observation IPCC models

Carbon flux trends driven by SAM
• Positive trend in SAM leads to increased upwelling of deep waters enriched in DIC– Outgassing of natural CO2
• Atmospheric inversion (1981-2004)(Le Quéré et al. 2007)
• Carbon uptake in the Southern Ocean may decline over time…

The future: the effect of Southern Ocean stratification
• Increased precipitation under global warming
• Potential melting of Antarctic ice sheet
• SST warming
Precipitation change (2095-2005)
NCAR CCSM SRES A1B scenario
Can stratification counteract wind stress changes?

Oceanic variability• Explicitly resolved eddies impact on MOC structure and its sensitivity to the surface winds
Hallberg and Gnanadesikan (2006)

Toward realistic Southern Ocean carbon cycle simulation• Southern Ocean State Estimate (Mazloff, Heimbach and Wunsc)• OCMIP / ecosystem model (Dutkiewicz et al. 2005)

Challenges for future modeling
• Model evaluation and improvements
Process-level improvements
Testing models against observational metric
• Statistical analysis
Determine modes of carbon flux variability
• Attribution experiments
Hierarchical modeling
Repeat calculations taking out one process at a time
Simple models help to interpret complex simulations