interactions between mineral surfaces and dissolved ... · interactions between mineral surfaces...
TRANSCRIPT

INTERACTIONS BETWEEN MINERAL SURFACES AND DISSOLVEDSPECIES: FROM MONOVALENT IONS TO COMPLEX
ORGANIC MOLECULES
UDO BECKER*†, SUBHASHIS BISWAS*, TREAVOR KENDALL**,PETER RISTHAUS***, CHRISTINE V. PUTNIS****, and CARLOS M. PINA*****
ABSTRACT. In order to understand the interactions of inorganic and organicspecies from solution with mineral surfaces, and more specifically, with the growth anddissolution behavior of minerals, we start by reviewing the most basic level ofinteraction. This is the influence of single monovalent ions on the growth anddissolution rate of minerals consisting of divalent ions. Monovalent ions as back-ground electrolyte can change the morphology of growth features such as growthislands and spirals. These morphology changes can be similar to the ones caused byorganic molecules and are, therefore, easily mixed up. Both Na� and Cl- promotegrowth and dissolution of some divalent crystals such as barite and celestite. Inaddition, morphology changes and the stability of polar steps on sulfates are explainedusing atomistic principles.
Subsequently, we will increase the level of complexity by investigating the interac-tion between organic molecules and mineral surfaces. As an example, we describe theinfluence of different organic growth inhibitors on the growth velocity of barite anduse molecular simulations to identify where these organic molecules attack the surfaceto inhibit growth.
Nature provides a number of complex organic molecules, so-called siderophoresthat are secreted by plants to selectively extract Fe ions from the surrounding soil. Themolecular simulations on siderophores are complemented by atomic force-distancemeasurements to mimic the interaction of these molecules with Fe and Al oxidesurfaces. The combination of simulations and force-distance measurements allows usto evaluate initial complexation on metal oxide surfaces (which is different from metalcomplexation in solution), steric hindrances, the possibility to remove metal ions fromoxide surfaces, and selectivity for removal of Fe3� over Al3�.
Finally, we describe first attempts to find polypeptide sequences that may be usedas precursors for biomineralization of calcite surfaces.
selective attachment of monovalent ions to polar steps on sulfatesBarite (BaSO4) scale formation can be a problem by clogging pipes in technical
applications and barite can also occur as a biomineral, mainly for use as a gravitationalreceptor, for example, in Loxedes (Mann, 2001). The scale-forming properties ofbarite are due to its relatively low solubility product (log Ksp � -9.96 at 20°C, Blount,1977) compared to other typical scale minerals such as calcite (log Ksp � -8.48 at 25°C,Busenberg and others, 1984) and celestite (log Ksp � -6.62, Reardon and Armstrong,1987).
Two primary strategies can be pursued to solve the scale problem: (i) Crystalgrowth inhibitors are used to prevent scale precipitation. The attachment of theseorganic molecules to active growth sites disrupts the nucleation process and hindersthe continuation of growth (Bosbach and others, 2002). (ii) Complexing agents are
*Department of Geological Sciences, University of Michigan, 2534 C.C. Little Building, 1100 N.University Avenue, Ann Arbor, Michigan 48109-1063, USA
**Division of Engineering and Applied Sciences, Harvard University, Pierce Hall, 29 Oxford Street,Cambridge, Massachusetts 02138, USA
***Forschungszentrum Karlsruhe, Hermann-von-Helmholtz-Platz 1, 76344 Eggenstein-Leopoldshafen,Germany
****Institut fur Mineralogie, Universitat Munster, Corrensstra�e 24, D-48149, Germany*****Departamento Cristalografıa y Mineralogıa, Universidad Complutense, 28040 Madrid, Spain†Corresponding author: E-mail address: [email protected]
[American Journal of Science, Vol. 305, June, September, October, 2005, P. 791–825]
791

applied to dissolve barite precipitates. The latter has the disadvantage that largeamounts of chelators are necessary because one chelator molecule is consumed foreach dissolved cation (Coveney and others, 2000).
In order to understand barite scale formation and to improve scale treatmenttechnologies, a sound understanding of the complex precipitation and dissolutionprocesses is required. Although much work has been dedicated to study theseprocesses from a macroscopic point of view (Dove and Czank, 1995), microscopicmechanisms such as two-dimensional nucleation, spiral growth, and etch pit formationhave to be studied at a molecular level. Atomic Force Microscopy (AFM) can be used tocharacterize individual growth and dissolution mechanisms in situ. Details on baritegrowth and dissolution have been reported in numerous AFM studies (Archibald andothers, 1997; Pina and others, 1998a, 1998b; Bosbach, 2002). Special attention hasbeen paid to the effect of organic growth inhibitors (van der Leeden and others, 1995;Bosbach and others, 1998), organic chelators (Putnis and others, 1995), pH (Dunnand Yen, 1999), and temperature (Monnin and Galinier, 1988; Higgins and others,1998). However, the influence of the ionic strength, specifically the role of monovalentcations temporarily attaching to surface steps, on the barite scale formation has beenneglected in microscopic studies. However, the role of background electrolytes can beimportant because in offshore exploration, the injected seawater has high ionicstrength (I�0.7). Only one study involving calcite has attempted this: Shiraki andothers (2000) have determined the dissolution kinetics in 0.1 M NaCl solution in AFMexperiments. Macroscopic experiments indicate that barite precipitation (He andothers, 1995) and dissolution kinetics are affected by the presence of backgroundelectrolytes (Christy and Putnis, 1993). Here, we review AFM observations on theinfluence of ionic strength on growth and dissolution of barite with some comparativeexperiments with celestite (Becker and others, 2002). Furthermore, certain microtopo-graphic features such as the morphology of etch pits and molecular islands can beclearly associated with the presence of specific background electrolytes. In highlysaline solutions, we obtain very similar etch pit morphologies to those which havepreviously been attributed to specific interactions between organic molecules andcertain sites on a mineral surface (Wang and others, 1999a, 1999b, 2000). In otherwords, it is crucial to understand possible interactions of single-atom ions with mineralsurfaces, in particular their influence on growth rates and morphologies, before morecomplex organic-mineral interactions such as biomineralization are considered.
In recent years, an increasing number of molecular simulation studies wereperformed on the influence of foreign cations and inhibitor molecules on the growthand dissolution of mineral surfaces, particularly on carbonate (Parker and others,1993; Nygren and others, 1998; de Leeuw and others, 1999; Gerbaud and others, 2000;Cooper and de Leeuw, 2002; de Leeuw and Cooper, 2004) and sulfate surfaces (Allanand others, 1993; Rohl and others, 1996; de Leeuw and Parker, 1997; Redfern andParker, 1998; Risthaus and others, 2001; Becker and others, 2002). It was shown that aprecise description of hydration energies in solution and at the surface is crucial forthe analysis of the subtle but significant differences of the adsorption thermodynamicsof different ions on specific surface sites (Sayle and others, 2000). The net adsorptionenergy to a specific surface site can be described in the following way (eq 1):
E(ads. in water) � E(ads. in vacuo) � X � E(hyd. in bulk water) (1)
where E(ads. in water) is the net adsorption energy in water, E(ads. in vacuo) is theadsorption energy in vacuum, E(hyd. in bulk water) is the hydration energy in bulk water(which tends to prevent adsorption), and X (with 0 � X � 1) accounts for the fact thatthe adsorbed species is still partially hydrated when adsorbed. We calculated the factorX from molecular dynamics simulations by using a setup with the adsorbate on the
792 U. Becker and others—Interactions between mineral surfaces and dissolved species:

surface and four layers of water covering the surface. Each of these relatively largeenergy contributions needs to be evaluated precisely to obtain a sensible value for therelatively small net adsorption energy that remains. It can be a formidable task toderive all these energy contributions for all relevant surface sites. This is because theenergy contributions depend on type of mineral, its face exposed, and whether theadsorption site is on a terrace, a step, or a kink. In addition, adsorption energies invacuo and hydration depend on the adsorbate. However, this knowledge will benecessary to predict thermodynamic equilibria of the adsorption of different cationsand to judge if growth inhibitor molecules will be overgrown or redissolved (Nygrenand others, 1998). We used a combination of AFM results from experiments in a fluidcell and molecular simulations to identify the rate-limiting steps for growth anddissolution of barite under different solution conditions. Subsequently, it is possible todescribe the role of adsorption in a hydrous environment to explain the mechanismsand reaction pathways of crystal growth and dissolution depending on the compositionof a solution in contact with a specific mineral surface.
Experimental and Theoretical Methods to Determine the Adsorption of Monovalent Ions onBarite Steps
The experimental and theoretical methods used here are described in more detailelsewhere (Pina and others, 1998a, 1998b, 2004; Risthaus and others, 2001; Becker andothers, 2002). In brief, crystal growth and dissolution was measured as step advance-ment and retreat velocities in AFM fluid cell experiments on (001) barite and (001)celestite surfaces as a function of different supersaturation values S (with S � IAP/Ksp,IAP is the ion activity product in solution � acation � asulfate) and backgroundelectrolyte concentrations.
Calculations of sulfate surfaces and on the interaction between backgroundelectrolyte ions and specific sulfate surface features were performed using empiricalpotential force field models based on the sulfate potentials developed by Allan andothers (1993). For all computations of step energies and adsorption energies, weapplied two-dimensional periodic boundary conditions parallel to the surface. Forcomputations involving surface relaxation, the uppermost two molecular layers (out offour) were allowed to relax. This thickness is sufficient because relaxation does notprogress far into the bulk of what we tested using thickness-dependent surfacerelaxation calculations.
We define step energies as the energies that a surface step is energetically lessfavorable (per unit length of step; see also Becker and Gasharova, 2001) than the samenumber of atoms on a flat terrace. Step energies are calculated by comparing a relaxedstep structure with a relaxed flat surface (“relaxed” case) or an unrelaxed step with abulk terminated surface (“unrelaxed” case).
Bulk hydration energies of ions dissolved in solution were taken from experimen-tal values from Rashin and Honig (1985) and references therein. Partial hydrationenergies of adsorbed surface species were calculated by performing molecular dynam-ics simulations with four water layers on the surface with and without the adsorbedspecies (see also Becker and others, 1998). Water potentials were tested to be in goodagreement (less than 5% error) with the experimental hydration energies described inRashin and Honig (1985) by applying the droplet method.
AFM Results of Monolayer Step Growth in the Presence of Background ElectrolytesThe most dominant growth mechanism on barite and celestite surfaces is the
attachment of ions from solution onto kink sites leading to the advancement ofmolecular steps. The growth kinetics of such steps was studied at various backgroundelectrolyte concentrations. However, in order to study this effect quantitatively, stepgrowth rates were measured on barite (001) surfaces at constant supersaturation with
793From monovalent ions to complex organic molecules

increasing ionic strength. Due to the decrease of the mean activity coefficients ofaqueous Ba2� and SO4
2-, the concentration of Ba2� and SO42- in solution had to be
increased with increasing salinity in order to obtain constant IAPs for barite andcelestite, respectively. In addition, the formation of NaSO4
- and BaSO4 species insolution further reduces the free SO4
2- activity. Consequently, Ba2� and SO42- concen-
trations have to be increased non-stoichiometrically with increasing NaCl backgroundelectrolyte concentration.
After injecting a moderately supersaturated BaSO4 solution (S � 19.6) with lowbackground electrolyte concentration (ionic strength � 0.003) into the AFM fluid cell,two-dimensional islands with a height of one molecular BaSO4 layer form on a barite(001) surface as shown in figure 1A. Their lateral spreading results in a distinct circularsector-shaped morphology, which reflects the relative growth rates in different crystal-lographic directions. The morphology is controlled by straight step edges parallel to[120] and [12�0] (since both are symmetry equivalent, they are often referred to as �)and a curved step edge between them. The orientation of these islands alternates inconsecutive molecular layers due to the 21 screw axis parallel to [001]. Step edgesparallel to � form relatively stable periodic bond chains with a low kink site density. Incontrast, the curved step edges that advance in the fast growth direction have a highkink site density. Therefore, the curved step edges are the most reactive parts of thebarite (001) surface where step growth preferentially occurs. The growth velocity ofthese islands is highly anisotropic. Growth normal to the curved step edges isapproximately 10 times faster than growth normal to the straight edges.
Figures 1A, B, and figure 2 indicate that the monolayer step velocity increases withincreasing NaCl concentration at constant supersaturation. However, monolayer stepgrowth is not increased by the same factor for all crystallographic directions. There-fore, the island morphology and aspect ratio change depending on the Na� and Cl-
concentration. Molecular islands are more elongated in the [010] direction and theangle between the straight edges (originally [120] and [12�0], fig. 1B) of the sector-shaped islands becomes more obtuse.
The formation of growth spirals is also affected by the relative changes inmonolayer step edge reactivity with increasing concentration of monovalent ions insolution. The contribution of spiral growth on the barite (001) surface to the overallvolume growth is limited by the advancement of the slowest step because spirals arebounded by these steps (Pina and others, 1998a). On barite (001) surfaces, thesebounding steps are parallel to � at low ionic strength (fig. 1C). This leads to spiralgrowth hillocks with relatively little lateral growth compared to two-dimensionalislands. Also in the case of spiral growth, growth rates in different crystallographicdirections change with increasing NaCl concentration resulting in more elongatedgrowth spirals (fig. 1D).
Similar observations have been obtained on the (001) surface of isostructuralcelestite (Risthaus and others, 2001; Becker and others, 2002).
Dissolution: etch pit formation and monolayer step retreat.—Similar solvent effects onmonolayer step reactivity can also be obtained from in situ dissolution experiments.After exposing a freshly cleaved barite (001) surface to deionized water, relatively fewetch pits form (up to 0.1 – 0.2 pits/�m2 in 15 min., fig. 1E). Typically, the etch pitmorphology is defined by monolayer step edges parallel to � and to [010]. Inconsecutive molecular layers, they have opposite orientations, due to the 21 screw axisnormal to the (001) surface. During etch pit formation, dissolution occurs via theretreat of monolayer steps. The lateral spreading rate of etch pits in pure deionizedwater is 0.08 � 0.02 nm/s parallel to [010] and 0.03 � 0.01 nm/s parallel to [100]. Inhigh ionic strength solution (up to 1.0 M NaCl), the step reactivity and the etch pitmorphology changes. The lateral spreading rate increases to 1.27 � 0.03 nm/s parallel
794 U. Becker and others—Interactions between mineral surfaces and dissolved species:

Fig. 1. (A) Two-dimensional nuclei are formed on the (001) surface in a supersaturated pure BaSO4solution. Note the opposite orientation of the sector-shaped islands in consecutive layers. (B) For the samesupersaturation, the islands become more elongated with increasing NaCl content (increasing ionicstrength, 0.75 here). (C) Due to the growth anisotropy in consecutive BaSO4 layers, the shape and the lateralspreading of the growth spiral is controlled by the slowest growing molecular step. (D) The change in stepvelocities in different crystallographic directions is also reflected by a different morphology of growth spirals.(E) AFM image of dissolution of a barite (001) surface in pure water. Triangular etch pits with a depth of halfa unit cell (one monolayer) are formed on the surface. The step edges are parallel to [010], [120], and[12�0]. Due to the 21 screw axis, triangular etch pits in consecutive atomic layers have opposite orientations.(F) In a 1.0 M NaCl solution, the etch pits become elongated with curved step edges more or less parallel to[010] (modified from Becker and others, 2002).
795From monovalent ions to complex organic molecules

to [010] and 0.31 � 0.03 nm/s parallel to [100]. Consequently, the etch pits are moreelongated parallel to [010] and bounded by curved monolayer steps (fig. 1F). Also, theinitial number of etch pits is 1.4 – 2.2 pits/�m2 after 5 min., about an order ofmagnitude higher than in pure water.
Computational Description of Interactions between Monovalent Ions in Solution and DivalentMineral Surfaces
In order to interpret the influence of Na� and Cl- in solution on the morphologiesand rates of growth and dissolution of sulfate surfaces, one has to analyze the changesin the bulk solution, in the near surface region, and direct interactions between thebackground electrolyte ions and the surface. Most insight can be gained frommolecular simulations to resolve the mechanisms of the latter processes.
Dissolution.— When we try to develop a picture of these etch pits from a molecularpoint of view of a pure BaSO4 (001) surface, we obtain an etch pit as shown in figure 3.Figure 3 shows an etch pit that is bounded by step directions as in the experimentalAFM image shown in figure 1E. The � step directions are bounded by periodic bondchains (alternating Ba2� and SO4
2- ions) with no dipole moment perpendicular to thestep, both first indications for a relative stable step (step energy 0.31 eV/Å). Incontrast, the third step direction � �b would be either bounded by SO4
2- or Ba2� ions,resulting in a dipole moment perpendicular to the step and an unfavorable step energy(1.33 eV/Å). In addition to the difference in step energies, a polar step is more likely tobe attacked by water molecules from solution due to its local charge. One way to solvethe problem of a local dipole moment is to “construct” a jagged edge that wouldrepresent an etch pit as in figure 4. Figure 4 can be understood as if half of the ionsalong the previously polar step are removed, which removes the dipole momentperpendicular to the step. Therefore, the step energy (in vacuum) decreases to 0.63eV/Å in the unrelaxed case and 0.50 eV/Å for the case where the step atoms areallowed to relax. If we stay in our framework of an etch pit that would just consist of aBaSO4 surface, such a step has a high density of kink sites (1.8 kink sites/nm) whichmakes it more likely for hydration and, thus, for dissolution to occur (fig. 4).
Fig. 2. Island spreading velocity vs. ionic strength with constant supersaturation ratio.
796 U. Becker and others—Interactions between mineral surfaces and dissolved species:

The next question is how the situation changes once the solution in contact withthe etch pit contains monovalent background electrolyte ions such as Na� and Cl- ions.The case for an idealized and temporary (see below) Na� termination is shown infigure 5. Each Ba2� is replaced by two Na� ions and the result is a dipole-free andkink-free step. Interestingly, this step is less stable in vacuum (by 0.24 eV/Å) due to theNa-Na repulsion and the stronger affinity of Ba2� for SO4
2- than of Na�. However,since the twofold charge causes the hydration energy of Ba2� in solution to be on theorder of three times higher than the one of Na� (13.64 eV vs. 4.27 eV, Rashin andHonig, 1985), the loss in hydration energy is more than compensated and the net gainis 0.17 eV/Å. Thus, the final step energy of 0.33 eV/Å is on the order of the step energyof the � steps (0.31 eV/Å). The energy budget of adsorption of Na� or Cl- to thePBC-like � step is much less favorable, such that we can conclude that adsorption ofmonovalent background ions takes place predominantly on steps that would be polarwithout the background electrolytes (fig. 5). Thus, the increased relative stability ofsteps parallel [010] with respect to � is due to the formation of PBC-like -Na-SO4-Na-SO4- or -Cl-Ba-Cl-Ba- chains along the step, which are less polar (and hence morestable) than terraces bounded by either SO4
2- or Ba2�. It has to be noted that thedescribed adsorption pattern is not a static termination of the step but rather atemporary picture. The decoration of a polar step with Na� will always be incomplete
Fig. 3. Model of an etch pit on the barite (001) surface. While there are alternating Ba2� and SO42- ions
along the � directions, which causes electrostatically neutral and fairly stable steps (step energy 0.31 eV/Å),straight steps along [010] consist of either Ba2� or SO4
2- (shown in the figure) ions. Thus, there is a stronglypositively or negatively charged step (in this case negatively charged). This causes a dipole momentperpendicular to the step, which is an indication for unstable step termination (atoms in the uppermostsurface sublayer are represented by larger balls than in layers underneath). The resulting step energy isrelatively high (1.33 eV/Å) (modified from Becker and others, 2002).
797From monovalent ions to complex organic molecules

such that dissolution progresses for undersaturated BaSO4 solutions concurrent withthe formation of thermodynamic equilibrium conditions between Na� and Ba2� onstep sites or between Cl- and SO4
2-. In addition, even though the adsorption of Na�
(Cl-) to polar steps is more favorable than the adsorption of Ba2� (SO42-), the divalent
ions are energetically downhill on lattice sites of flat terraces or in the bulk.The mechanism of decorating polar steps with background electrolyte ions is an
explanation for the different morphologies of etch pits in solutions with and withoutbackground electrolytes. The next question to be answered is: What is the influence ofbackground ions on the dissolution rate of sulfate surfaces. We start our considerationswith an “etch pit nucleus” that is bounded by steps that are parallel to PBCs (fig. 6A). Indistilled water, the first ion to be dissolved would be most likely a Ba2� ion (fig. 6B)because the binding energies of Ba2� and SO4
2- to the lattice are comparable but thehydration energy of Ba2� in water (13.64 eV) is significantly higher than the one forSO4
2- (9.73 eV, Becker and others, 2002). This process leaves behind a double kink sitewith a local formal charge of –2. This intermediate state is energetically uphill and,therefore, the rate-limiting factor for the initiation of further dissolution. The solva-tion of the cation is followed by the dissolution of a neighboring sulfate ion which is afast step compared to the initial dissolution (fig. 6C). In solutions with high concentra-tions of monovalent ions, the unfavorable state in figure 6B is avoided by substitutingthe Ba2� ion by a Na� ion, leaving no kink and a local formal charge of just –1 (fig.6D). Consecutively, a sulfate ion can be replaced by a chloride ion (fig. 6E) and theresult is a neutral substitution with relatively low activation energies of any of the
Fig. 4. By removing every other SO42- (or Ba2�) ion from such a polar step, the dipole moment
perpendicular to the step vanishes, and the step energy is reduced (from 1.33 eV/Å for the polar case) to0.63 eV/Å in the unrelaxed case and 0.50 eV/Å in the relaxed case. However, this setup creates a largenumber of kink sites along the [010] step direction which makes this step still significantly less favorable thansteps � � (step energy 0.31 eV/Å) in pure water. Therefore, these steps are less stable in solutions with lowionic strength (modified from Becker and others, 2002).
798 U. Becker and others—Interactions between mineral surfaces and dissolved species:

intermediate dissolution steps. This process contributes to the increased dissolutionrates in solutions with a high ionic strength, in addition to the lowered interfacial freeenergy (strictly speaking, this mechanism also contributes to the interfacial freeenergy) in the near surface region and the reduced activity coefficient in the bulksolution. This theoretical consideration of the temporary substitution of a divalent ionfrom the structure by a monovalent ion from solution suggests that growth anddissolution rates are strongly influenced by the valency of the background electrolyteions. Furthermore, the identity of the background electrolyte ions can control the“bottlenecks” of growth and dissolution by lowering the ion exchange energy (forexample, Ba2� 7 Na�, SO4
2- 7 Cl-). Further experimental studies will have to verifythese findings.
Growth.—When describing the important features of crystal growth, the key issueis to find the rate-limiting steps, that is the “bottle necks” through which crystal growthhas to go before more favorable adsorption events can follow. Once this rate-limitingfactor is found the next step is to find the most energetically favorable reaction path.During crystal growth of barite, sector-shaped islands are formed with very anisotropic
Fig. 5. More favorable is a step termination with a row of Na� ions occupying every lattice site along thestep compared to Ba2� occupying every other site. The energy budget of such a theoretical substitution isderived in the text. Similarly, one molecular row further down in the [100] direction, there would be a-Cl-Ba-Cl-Ba-Cl-chain. With this setup, all three steps have comparable step energies, which nicely explainsthe shape of triangular etch pits found in the experimental images (modified from Becker and others,2002).
799From monovalent ions to complex organic molecules

growth velocities (fig. 7A). By combining the findings from AFM experiments andmolecular simulations, it was found that the rate-limiting step was the creation of a newgrowth row (fig. 7B). These rows then continue growing towards point C and result inan average fast growth vector. Since adsorption of ions from solution to positions onthe other side of the PBCs is less favorable, growth in the opposite direction is muchslower.
Now, we have to answer the question if monovalent ions from solution can lowerthe energy to create a new growth row. Apart from changes in the diffusion layer, thetask is to compare the energetics of this first adsorption event. Let us first consider theadsorption of a Ba2� cation to a potential starting island as shown in figure 8A. Thegain in adsorption energy in vacuum to this specific site is 10.81 eV (for bettergraphical representation, fig. 8 shows the unrelaxed positions of the atoms in theisland and the relaxed positions of the adsorbed Ba2� and Na� ions). Because thenewly adsorbed Ba2� ion is still partly hydrated (we have calculated the remaininghydration energy on this particular site to be close to 20 % of the hydration energy inbulk water) the loss in hydration energy is 80 percent of the hydration energy of thedissolved species. Thus, the total adsorption energy in water is -10.81 eV -(0.8�13.64eV)�-0.10 eV. Note that these calculations have an error of at least � 0.1 to 0.2 eV.Therefore, in this case, one cannot be sure if this adsorption step is exothermic orendothermic. The respective calculation for the Na� adsorption energy is –4.94 eV-(0.8�4.27 eV)� –1.52 eV. Thus the weaker adsorption of Na� in vacuum is more thancompensated by the much smaller loss in hydration energy. This is mainly caused bythe fact that adsorption is roughly proportional to the charge of the ion but hydration
A B C
D E
Fig. 6. Schematic of barite (001) surface dissolution in pure water and in the presence of a monovalentbackground electrolyte solution. (A) Structure of a (theoretical) etch pit “nucleus” bound by PBCs ��. (B)The dissolution of a Ba2� and thus the formation of a double kink is unfavorable, because a twofold negativesite is created. This is the rate-limiting step of dissolution. (C) The consecutive step of dissolving aneighboring sulfate ion is exothermic and not rate limiting. (D) The initial dissolution step can be mediatedby the substitution of Ba2� by Na�, which makes dissolution less rate limiting than scenario (B). Even thoughthe following substitution of a sulfate by a chloride ion is less favorable than the sulfate dissolution in (C), it isalso energetically downhill and, thus, not rate limiting (modified from Becker and others, 2002).
800 U. Becker and others—Interactions between mineral surfaces and dissolved species:

approximately proportional to the square of the charge (for equal ionic radii). Thus,we can conclude that Na� ions in solution can create a new row by adsorbing a “trialion” to the preexisting island. Even though the adsorption of the next sulfate ion insuch a row is less favorable in the Na� case than for the Ba2� case, in both cases, thecontinuation of growth is energetically downhill and thus no growth-limiting factor. Itis interesting to note that the continuous growth is in favor of Ba2� incorporationrather than Na� incorporation and also, the substitution of the “trial adsorption site”with Na� by Ba2� is energetically downhill. This can be explained in the following way:adsorption in vacuum is stronger than the first adsorption to the preexisting island forboth cases Na� (-8.39 eV) and Ba2� (-16.83 eV) because an additional bond is formedto the neighboring sulfate ion. The gain in hydration energy during dissolution is alsogreater because at such a corner site, the respective ion is less exposed to the solutionsuch that only about 15 percent of the bulk water hydration is left. Therefore, we cancalculate the energy balance for the substitution of Na� by Ba2� in figure 8C, D to be:
Esubs � �8.39Na_ads � 0.85 � 4.27Na_hyd� eV
� �16.83Ba_ads � 0.85 � 13.64Ba_hyd� eV � 0.48 eV
Therefore, Na� serves the purpose of creating a temporary adsorption site that helpsto form a new step and is later substituted. This process could be described as a healingeffect of the crystal during continuous growth. This finding agrees with the fact that aNa� ion does not fit well into the barite structure, for reasons of both size and chargeneutrality. Bulk crystallographic results indicate that Na� or Cl- ions will finally besubstituted by Ba2� or SO4
2- to complete the barite structure, although Na� or Cl- ionsin growing rows serve to create the initial kink site.
In addition to the atomic-scale description of changes in step energies and theenergies of rate-controlling sites, background electrolytes influence the thermody-namic properties of the bulk solution and of the near-surface region at the mineral-water interface. These changes and their influence on growth and dissolution rates aredescribed in Risthaus and others (2001) and Becker and others (2002).
Fig. 7. (A) Sector-shaped islands during growth on barite (001). (B) Molecular simulation model of therate-limiting steps during formation of a sector-shaped island shown in (A) (modified from Becker andothers, 2002). For an animation of a barite island growth, see http://www.geo.lsa.umich.edu/compmin/Research/Sulfates/purebarite.html.
801From monovalent ions to complex organic molecules
the interaction of organic growth inhibitors with mineral surfacesFor the interaction of organic molecules with sulfate surfaces, we can use a similar
methodology as derived for the adsorption of monovalent inorganic ions. It isimportant to understand the influence of organic molecules on sulfate growth becausecertain organic molecules, such as phosphonic and carboxylic acids, have the ability toretard or totally inhibit crystal growth from solution. In order to understand, predict,and control crystal growth, knowledge of the molecular mechanisms that govern theinhibitor–crystal interaction is necessary. Considerable research has focused on design-ing additive molecules that modify crystal growth in a predictable way (Li and Mann,2000; Qi and others, 2000). It was found that at least two phosphonate groups arerequired to inhibit barite growth (with a three-atom chain between the phosphonategroups, Black and others, 1991). Different phosphonate inhibitors have been designedand shown to be effective (Davey and others, 1991; Rohl and others, 1996; Coveney
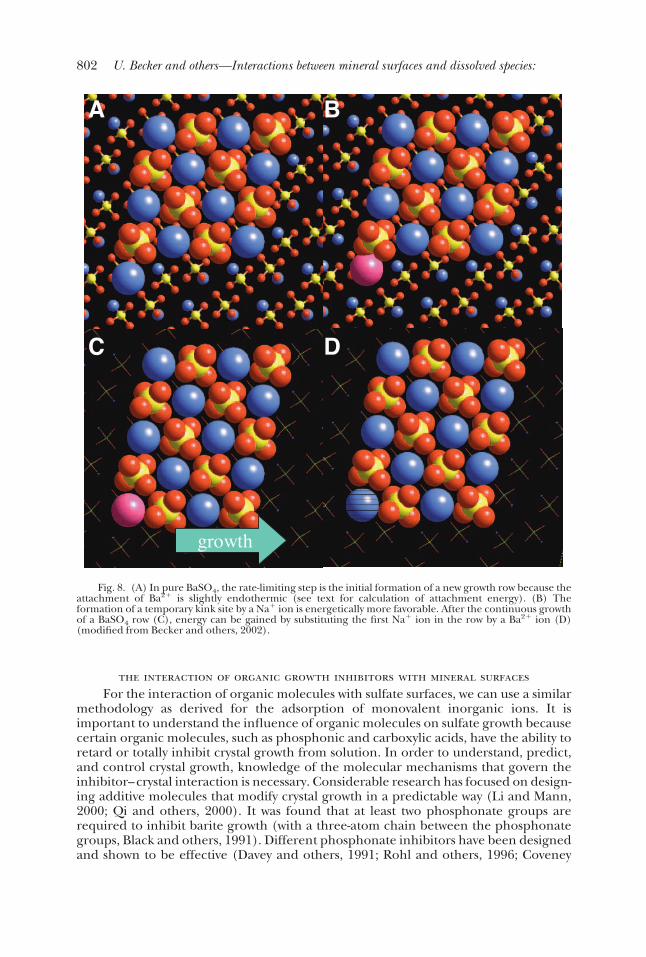
Fig. 8. (A) In pure BaSO4, the rate-limiting step is the initial formation of a new growth row because theattachment of Ba2� is slightly endothermic (see text for calculation of attachment energy). (B) Theformation of a temporary kink site by a Na� ion is energetically more favorable. After the continuous growthof a BaSO4 row (C), energy can be gained by substituting the first Na� ion in the row by a Ba2� ion (D)(modified from Becker and others, 2002).
802 U. Becker and others—Interactions between mineral surfaces and dissolved species:

and others, 1998, 2000; Jones and others, 2001, 2002). Jones and others (2001)substituted carboxylic groups for phosphonate groups in order to minimize structuralchanges in the molecules and compared inhibition efficiency with decreasing numbersof phosphonate groups. In addition to designing more effective inhibitor moleculesfor industrial applications, studying the effect of organic molecules on crystal growth isa first step toward understanding biomineralization.
Traditionally, the adsorption of molecules to mineral surfaces has been indirectlyinvestigated from bulk experiments. Measurements of crystallization rates in thepresence of inhibitors have been attributed to the adsorption of molecules to activegrowth sites on surfaces (Cabrera and Vermilyea, 1958; Sangwal, 1998). Thus, byexperimental determination of adsorption isotherms, it is possible to interpret crystalgrowth behavior in the presence of a wide variety of inorganic and organic additives.The in situ observation of surfaces during growth using AFM in combination withmolecular simulations helps us to understand the effect of inhibitors on the thermody-namics and kinetics of crystal growth at the molecular scale (Bosbach and others, 1996,2002). Here, we describe the inhibiting effect of five polyphosphonic acids, hydroxyeth-ylene diphosphonic acid (HEDP), nitro trimethyl phosphonic acid (NTMP), methyl-ene diphosphonic acid (MDP), amino methylene phosphonic acid (AMP), andsodium phosphonobutane tricarboxylic acid (PBTC, fig. 9).
After the (i) qualitative description of the microtopography of growing surfaces inthe presence of the inhibitors (changes in the shape of both growth steps andtwo-dimensional nuclei, nucleation density, et cetera); (ii) the dependence of growthrates of monomolecular steps on inhibitor concentration and adsorption isothermswas analyzed, which allows us to quantitatively compare the effectiveness of theinhibitors. Next, (iii) the molecular modeling and energy calculations of the interac-
Fig. 9. Schematic representation of the five phosphonates used in this work as inhibitors of the growthof the barite(0 0 1) face (modified from Pina and others, 2004).
803From monovalent ions to complex organic molecules

tion of the five phosphonic acids with the barite (001) face were used to study the roleof different surface sites as potential adsorption sites.
Finally, in order to obtain a general view of the adsorption process and itsinhibiting effectiveness, the microtopographic observations and the quantitative infor-mation provided by both adsorption isotherms and growth rates of monomolecularsteps are discussed, together with molecular modeling of the inhibitor-crystal inter-face.
First we follow the same approach as described for the adsorption of monovalentions to polar steps. For the interaction between HEDP and the barite surface, wederived empirical potentials from quantum mechanical calculations using molecularfragments (fig. 10) and the program Gaussian (Frisch and others, 1998) as describedin Becker and others (2002). One can compare the adsorption of one SO4
2- or two Cl-
ions with the adsorption of H2-HEDP2- to the same steps. A sulfate ion in the “jaggedstep” picture (analogous to fig. 4 but with sulfate bounding) can either be replaced bytwo chloride ions or one H2-HEDP2- ion. Where substitution of SO4
2- is still acompetitive process, the adsorption of H2-HEDP2- to either [100] or [010] steps or theadsorption to kink sites on � steps is much stronger and thus irreversible. This explainswhy sites in the experimental images with H2-HEDP2- bonded to them are pinnedduring step advancement (Sangwal, 1998) and no dynamic exchange can take place
Fig. 10. H2-HEDP-fragments used in quantum mechanical calculations (GAUSSIAN98) to derive forcefield potentials (modified from Becker and others, 2002).
804 U. Becker and others—Interactions between mineral surfaces and dissolved species:

that leads to the formation of straight, crystallographically oriented steps. Even thoughconcentrations that are typically used for growth inhibitors such as HEDP are in the�mol range and, thus, adsorption occurs in form of single diphosphonate ionsadsorbed to steps, the co-adsorption of H2-HEDP2- to neighboring sites stabilizes suchan adsorption site even more due to the formation of hydrogen bonds betweenneighboring diphosphonate ions.
Figure 11 shows the most likely structure of HEDP adsorption. One of thephosphonate groups binds to the Ba2� ions at a kink site and inhibits the continuousgrowth of that particular BaSO4 growth row. Since the binding energy of the H2-HEDP2- to this kink site is much stronger than the binding energy of a sulfate ion to thissite, growth is permanently inhibited. The only possibility to continue growth would bethat the H2-HEDP2- gets overgrown.
Details on the experimental approach to derive adsorption isotherms from AFMexperiments can be found in Pina and others (2004). In brief, barite (001) surfaceswere exposed to aqueous solutions with a concentration of 40 �mol/l BaSO4, whichwere injected into the fluid cell. This concentration is high enough to promotemoderate two-dimensional nucleation (Bosbach and others, 1998). Once the nucleigrew to 100 nm along the [100] direction, solutions with the same BaSO4 concentra-tion but containing a range of concentrations (0.5 – 60 �mol/l) of HEDP, NTMP,MDP, AMP and PBTC were passed over the crystal surfaces and the growth rates ofmonomolecular steps on barite (001) faces in the presence of inhibitor were mea-sured.
Fig. 11. Kink-blocking mechanism by H2-HEDP2- (modified from Becker and others, 2002).
805From monovalent ions to complex organic molecules
Molecular simulations of in-vacuo adsorption energies were performed on a barite(001) cluster containing 2484 atoms, that is, 414 BaSO4 formula units (details can alsobe found in Pina and others, 2004). The cluster was bounded by periodic bond chains(�120� direction and its symmetry equivalents) such that there was no dipole momentperpendicular to the surface and none parallel to the edges of the cluster. This isimportant in order to avoid surface instabilities and to avoid long-range interactionsbetween the cluster and the adsorbate that are caused by the cluster constructionrather than the interaction of the growth inhibitor molecule with a specific surface site.For the calculation of in-vacuo adsorption energies, we used the species AMP-1, AMP2-,MDP2-, HEDP2-, NTMP2-, NTMP4-, PBTC2-, and PBTC4-; the change in hydrationenergies from the dissolved state to the adsorbed one was calculated subsequently.Molecular mechanics and molecular dynamics calculations with subsequent energyoptimizations were used to find absolute absorption minima for each surface site. Allcalculations were performed using empirical force fields, derived by Allan and others(1993) for interactions within the barite crystal, so-called Universal Force Fields byRappe and others (1992) for interactions within the inhibitor molecules, and byBecker and others (2002) for interactions between the phosphonates and the crystalsurface.
The presence of inhibitor in solution reduces the growth rates and, especially inthe case of HEDP and AMP, changes the morphology of the islands. In order toquantify the inhibiting effect of the HEDP, NTMP, MDP, AMP and PBTC molecules,we have measured growth rates along the [100] directions of two-dimensional islandgrowth on the barite (001) face for each inhibitor and for different concentrations. Wederived the normalized vi/v0 step velocities (where vi and v0 are the growth rates along[100] with and without inhibitor, respectively) as a function of inhibitor concentra-tion. A rapid decrease in step advancement rates can be found for inhibitor concentra-tions lower than 10 �mol/l (Pina and others, 2004). After this initial decrease, theinhibiting effect of the phosphonic acids becomes weaker and for further increase ininhibitor concentration, the retardation of the step advancement reaches a plateauwith little dependence between growth rate and inhibitor concentration. The exten-sion and slope of the plateaus are different for each phosphonic acid. Only for PBTC,complete inhibition for molecule concentrations higher than 10 �mol/l is observed.
Derivation of Adsorption Isotherms from AFM Growth ExperimentsIn order to compare the effectiveness of the organic molecules, HEDP, NTMP,
MDP, AMP and PBTC, we have represented the step rates and inhibitor concentrationsusing Langmuir diagrams. In such diagrams, the v0 /(v0-vi) parameter, calculated fromgrowth rates of individual monomolecular steps, is plotted against the inverse of theinhibitor concentration, [Inh]-1. Table 1 shows the approximately linear relationship ofv0 /(v0-vi) as a function of [Inh]-1 for the five inhibitors studied (linearity expressed bythe respective correlation coefficients). This means that the mechanisms of inhibitionwithin the error of experiment can be satisfactorily described by Langmuir adsorptionisotherms:
v0/�v0 � vi� � k0 � k1[Inh]1 (2)
where k0 is 1 for complete inhibition; k1 is the so-called “affinity constant”, indicative ofthe effectiveness of the inhibitor, that is, its ability to retard the step advancement(Amjad, 1995). Therefore, the lower the k1 value, the more effective the inhibitor.Table 1 shows the affinity constants for HEDP, NTMP, MDP, and PBTC inhibitors(column 3) obtained from our AFM experiments.
In order to compare the thermodynamics of adsorption from the experimentalresults with molecular simulations, we calculated adsorption energies of inhibitor
806 U. Becker and others—Interactions between mineral surfaces and dissolved species:

molecules to flat terraces, straight edges, outer and inner corners of islands, and tokink sites of growth islands. We found that when hydration energies are taken intoaccount, inhibitor adsorption to flat terraces is energetically uphill. For straight steps,only for NTMP2-, adsorption to the side of unperturbed steps seems to be likely withinthe error of calculation.
All inhibitor molecules gain energy by adsorbing to corner sites in a hydratedenvironment. It is interesting to note that the phosphonates (AMP, MDP, HEDP, andNTMP) prefer the configuration where Ba2� is located at the obtuse corner whereasPBTC prefers to adsorb to Ba2� at an acute corner.
For each molecule, there is also a kink site configuration for which adsorption isenergetically downhill. Kink sites are likely the most important sites for crystal growthblocking. We found the most energetically favorable kink site/phosphonate bond forNTMP4-. However, it may be more valid to consider all 22 kink-site configurations thatwe evaluated. For PBTC4-, all adsorption energies in a hydrated environment forbinding to any of the kink sites are negative (average is –1.36 eV) whereas this is onlythe case for about half (12 out of 22) of the adsorption events for NTMP4- (with anaverage of –0.86 eV). This ratio may even become worse if we consider that kink siteslose most of the hydration energy during adsorption at the site types that we consider.This indicates that whatever the type of kink site, it can be blocked by PBTC4-, butabout half the kink sites can continue growing if NTMP4- is the chosen inhibitor.
The fact that the initial adsorption follows the behavior predicted by Langmuir’smodel implies that the inhibiting effect of the organic molecules studied in this workon barite is due to the attachment of molecules on active growth sites. Our calculationsindicate that these active sites are kink sites located along steps. Adsorption to cornersis also exothermic, but on most growth islands, there are many more kink than cornersites. In all cases of kink site adsorption, the adsorption energies are higher than 0.4 eV(� 40 kJ/mol). Such high adsorption energies mean that the adsorption has achemical character, that is, the inhibitor-active site bonds are quite strong (typicalenergies for physical adsorption are lower than 40 kJ/mol while for a chemicaladsorption values up to and even over a hundred kJ/mol – 0.4 to � 1eV/adsorbedinhibitor molecule – are expected; Brixner, 1967).
Other possible positions for adsorption, such as flat terraces or steps without kinksor defects provided positive adsorption energies, indicating that they are negligible aspositions for crystal growth blocking. This is in agreement with the observed growthrate-inhibitor concentration plateaus for high concentration of inhibitor. Thus, onceall kink sites along the steps on the barite (001) surface are occupied with inhibitor
Table 1
Adsorption parameters for HEDP, NTMP, MDP, AMP and PBTC on barite (001) face atroom temperature (see equation 1) and AFM observations of the effect of the inhibitor on the
barite (001) surface. k0 and k1 are derived from the growth velocities v0 (growth velocitywithout inhibitor) and vi (velocity with inhibitor) as a function of the inverse of the
inhibitor concentration [Inh]1 using v0/(v0 vi) � k0 � k1[Inh]1.
807From monovalent ions to complex organic molecules

molecules, the effectiveness of the inhibitor reaches a maximum and a further increasein the inhibitor concentration does not lead to a significant decrease in growth ratesbecause no more adsorption positions are available on the crystal surface. Only whenthe concentration of inhibitor in the solution is very high (above 10 �mol/l or 20�mol/l), a layer of inhibitor molecules can be formed on the barite surface. However,since the adsorption energies of the inhibitor on terraces are positive, no adsorptioncan be expected. The observed covering must be, therefore, interpreted as a floccula-tion of inhibitor molecules on the barite (001) surfaces. Nevertheless, such a layer canprevent the barite growth units reaching the surfaces acting as “physical barrier” forthe growth process and completely stop growth.
The strength of the adsorption of inhibitor molecules on kink sites can also bequantified through the affinity constants, k1, in equation (2) (see table 1). Theseconstants are in the same range as those obtained by Amjad (1995) for the adsorptionof phosphonates on calcium phosphate from bulk experiments (Amjad, 1995, re-ported k1 values of 8 � 10-6, 17 � 10-6 and 31.2 � 10-6 for PBTC, HEDP, and AMP,respectively). By considering both the ranking of our measured constants and thebehavior of the inhibitors for high concentrations, our data suggest the followingorder of inhibiting effectiveness for the phosphonates: PBTC � NTMP � MDP �HEDP ��AMP. This ranking is consistent with the ranking obtained by Amjad (1995):PBTC �HEDP �AMP (Amjad, 1995, did not study the behavior of MDP and NTMP).
Another interesting aspect of the inhibiting phenomenon is the change in theshape of the islands (see last column in table 1). Our AFM observations indicate that,while in the presence of HEDP and AMP, barite islands become irregular after a shorttime, the other inhibitors tested do not promote such pronounced changes in islandshape, which essentially remain with their typical circular sector shape. Since HEDPand AMP are less effective inhibitors, the change in island shape can be attributed to aweaker attachment of these molecules to the active site along steps that can result in acontinuous adsorption and desorption of inhibitors on those positions. This wouldimply that growth positions would be no longer blocked, resulting in an isotropicirregular shape with time. In contrast, PBTC, NTMP and MDP are able to block kinksites along monomolecular steps in a more efficient (and permanent) way. As aconsequence, growth is more strongly inhibited but the shape of the islands ispreserved.
azotobactin-goethite/diaspore interactionsAs a next step to increase the complexity in the interaction between organic
molecules and minerals, we chose siderophore-mineral interactions. Siderophores,organic ligands commonly produced by soil bacteria and fungi, are known to dissolveiron-containing minerals (Hersman and others, 1995) in a process that is independentof the presence of the microorganisms that produced them (Hersman and others,1996). The associated influence that siderophores have on iron cycling makes them apotentially significant geochemical force and an important factor in microbial ecology.Computational work on siderophores has focused on the stable aqueous complexthese ligands form with Fe(III) (Hay and Rustad, 1994; Hay and others, 1996, 2001;Lumetta and others, 2002), but only a limited amount of mechanistic information ontheir interaction with mineral surfaces exists. Adsorption, kinetic, and spectroscopicstudies of hydroxamate and catecholate siderophores (Hansen and others, 1995;Holmen and Casey, 1996; Kraemer and others, 1999; Kalinowski and others, 2000;Liermann and others, 2000; McWhirter and others, 2003) suggest the formation of asurface complex between siderophore oxygens and metals on the iron oxide surface, aprocess that Holmen and Casey (1996) speculate to proceed via ligand exchange, atleast for hydroxamate siderophores. A recent bulk solution study suggests goethitedissolution may proceed via a two-ligand, synergistic interplay between the sid-
808 U. Becker and others—Interactions between mineral surfaces and dissolved species:

erophore desferrioxamine (DFO) and smaller chelators such as oxalate (Cheah andothers, 2003). DFO adsorption to the surface is predicted to be less important; instead,the siderophore chelates iron from oxalate in solution, renewing the smaller ligand’sability to dissolve more iron from the mineral (Cheah and others, 2003). We believethis to be a likely scenario, however, using azotobactin as a model siderophore, ourcalculations provide additional evidence of strong siderophore-mineral surface affinityand reactivity.
In our previous work, we demonstrated that force measurements made using anAtomic Force Microscope (AFM) were useful in examining the siderophore-mineralinteractions by providing direct molecular-level quantitative force data (Kendall andHochella, 2003). Specifically, these data showed that the siderophore azotobactinexhibits a degree of mineral specificity that favors iron over aluminum oxides. Ourmolecular simulations of azotobactin-diaspore (�-AlOOH) and azotobactin-goethite(�-FeOOH) interactions are designed to complement and more fully understand, atleast in a qualitative framework, these experimental force measurements, while furtherevaluating the notion of surface reactivity as a component in siderophore-mediatedmineral dissolution. Specific aims include determining which siderophore functionalgroups attach to the surface and characterizing the nature and geometry of thesecoordinations. This includes evaluating the question if there are any steric hindrancesin forming a multi-bonded complex between the surface metal atom and the sid-erophore while the latter is adsorbed to the surface. In addition, these calculationswere used to discriminate between relatively weak and strong linkages using energy-distance profiles and derived forces. Using these simulated forces, we make a qualita-tive comparison with experimental forces to see if the same distinction in goethite anddiaspore force signatures observed using the AFM can be predicted by the model.Additional separate quantum mechanical calculations on azotobactin fragments bondedto a single Fe or Al atom were also completed to assess the source of specificity (forexample, electron affinity) between chelating O atoms and Fe, and to complement theempirical force-field calculations on the whole system by deriving Femineral/Almineral-siderophore specific potentials. The effect of the interaction on the metal in themineral structure was also examined with a specific question in mind: Is “dissolution”observed under any of the simulated, albeit simplified, conditions? For example, doesazotobactin, in contact with the mineral surface in vacuum, or under hydratedconditions simulated with a constant dielectric field or with added water clusters,completely extract a cation from the oxide surface?
Molecular Mechanics Methodology of Siderophore-Oxide InteractionsSimulations were carried out using the Cerius2 computational package (Accelrys,
Inc.). In order to develop a set of empirical potentials (for example, Buckinghampotentials, Gale, 1998) that mimic the physico-chemical properties of goethite and itsisostructural Al-equivalent diaspore, we used the program package GULP (Gale, 1998).The interactions within the siderophore molecule are simulated by using the UniversalForce Field (UFF) (Rappe and others, 1992) in combination with Coulomb potentialsderived by using the Qeq charge equilibration scheme (Rappe and others, 1992). Wederived potentials for the interactions between the chelating functional groups of thesiderophore and the metal ions on the surface (Fe, Al) using a quantum mechanicalapproach. Details on the computational methods can be found in Kendall and others(2005).
Hydrated environments of siderophore-metal fragments were modeled as acontinuum of uniform dielectric constant using Tomasi’s Polarized Continuum Model(PCM) (Miertus and Tomasi, 1982) on quantum mechanically optimized vacuumstructures. It should be noted that the PCM of solvation is somewhat inaccurate,especially for small ions. However, use of the model on larger organic fragments results
809From monovalent ions to complex organic molecules

in comparatively lower errors and, thus, provides a sufficient approximation. Inaddition, fragments of the siderophore with two functional groups and their Fe/Alchelates were calculated as a hydrated complex using a quantum mechanical approach(B3LYP, HF/DFT hybrid, Becke-3-parameter-Lee-Yang-Parr, Lee and others, 1988;Becke, 1993) with a 6-31g Pople-type basis set, by completing the hydration environ-ment of the metal cation with four water molecules.
Methodology of Azotobactin and Azotobactin-Mineral Molecular Mechanics SimulationsMost of the molecular mechanics simulations were performed using vacuum
conditions (dielectric constant � � 1) to reduce computation time; however, solvatedconditions in selected runs were simulated by increasing the dielectric constant (� �80) or adding clusters of individual water molecules to the system. The azotobactinmolecule was constructed based on the structure provided by Palanche and others(1999) (fig. 12). To facilitate discussion of the siderophore structure, each O atom hasbeen numbered according to figure 12. This numbering system is referred to whendescribing the O atoms that coordinate and release from each surface or the free Fe3�
ion. Coordination or bonding to the surface was defined as when the Fe/Al-O(siderophore oxygen) distance is less than 2.2 Å. For larger distances, the combinationof Lennard-Jones and Coulomb potentials, as implemented by the Universal ForceField is in good agreement with our quantum mechanical results.
Similar to the AFM experimental conditions (Kendall and Hochella, 2003), ahydrazide (-NH2) terminated 11 carbon linker molecule was attached to the azotobac-tin via a peptide bond to the Asp carboxyl group (fig. 13). A gold atom was added to the
Fig. 12. Annotated azotobactin structure (Palanche and others, 1999) with oxygens numbered in series;those with shaded boxes coordinated with metals on the mineral surface during the simulation. Ser � serine;Asp � aspartic acid; Orn � ornithine; Hse � homoserine. The hydroxycarboxylic acid (� OH-Asp), thehydroxamate (� N Orn) and catechol moieties are known to chelate aqueous metals including Fe3�(aq)(modified from Kendall and others, 2005. Reprinted from Chemical Geology, Modeling of azotobactin-goethite/diaspore interactions: Applications to molecular force measurements and siderophore-mineralreactivity, p. 17-35, with permission from Elsevier.).
810 U. Becker and others—Interactions between mineral surfaces and dissolved species:

end of the linker molecule to represent the gold coating on the AFM tip. The Au atomposition was fixed and thus, the manual modification of the distance between the Auatom and the mineral cluster by small increments was used to simulate the approachand the retraction of the tip. For each calculation for a given Au (tip)- mineralseparation, all atoms in the azotobactin and linker molecule were allowed to relax to
Fig. 13. Starting point of extension simulation with linearized azotobactin molecule approaching thegoethite cluster. Note that chelating oxygens associated with the hydroxycarboxylic acid, hydroxamate andcatechol groups are modeled in a deprotonated state (modified from Kendall and others, 2005. Reprintedfrom Chemical Geology, Modeling of azotobactin-goethite/diaspore interactions: Applications to molecularforce measurements and siderophore-mineral reactivity, p. 17-35, with permission from Elsevier.).
811From monovalent ions to complex organic molecules

energy-optimized positions or allowed to move in molecular dynamics simulations.While molecular mechanics energy-optimizes a structure (in this case an organicmolecule plus mineral cluster) at 0 K, several cycles of molecular dynamics (MD) withsubsequent energy optimizations ensure that the system does not get trapped in localenergy minima that do not represent the fully optimized structure.
The azotobactin molecule was brought into contact with both a single Fe3� atomand the (010) face of goethite and its isostructural Al-equivalent diaspore. Eachsimulated mineral surface consisted of a stoichiometric 20�11�4 unit cell cluster thatwas charge-neutral. The cluster was terminated in such a way that there was no dipolemoment perpendicular to the surface. However, under aqueous conditions at circum-neutral pH, the surface of goethite is positively charged (Cornell and Schwertmann,1996) and azotobactin is negatively charged (Telford and Raymond, 1996). Oursimulation using a neutral surface, therefore, does not include this possible long-rangeelectrostatic interaction. Structural information for each mineral including cell param-eters and fractional coordinates were obtained from the literature (Busing and Levy,1958; Gualtieri and Venturelli, 1999). In order to separate the influence of compres-sion/stretching force within the azotobactin from azotobactin-mineral surface interac-tions (included) and surface relaxation and bond formation/breaking in the surface(not included), the positions of atoms in the mineral cluster were fixed during theinitial extension of the molecule towards the surface. Prior to the interaction, thesiderophore-linker construct was fully extended by fixing the gold atom at thebeginning of the linker and advancing the methyl carbon associated with the hydrox-amate group towards the C-terminal end of the molecule in 0.5 Å steps and minimizingthe structure after each step. The result was a linearized conformation of the molecule(but not necessarily a global minimum energy state, fig. 13). This was completed toprovide consistency and reproducibility in the interaction simulation, to insure func-tional groups were not hindered or prevented from interacting with the surface and toprovide a starting condition that facilitates comparison between the two mineralsystems.
After the stretching of the molecule, and prior to simulating the movement of themolecule toward the mineral surface, the hydroxamate methyl carbon was released,and allowed to move freely during minimizations. The Au atom remained fixed andAFM extension (approach) or retraction motion was modeled by decreasing orincreasing, respectively, the distance between the gold atom and the mineral surface.The molecule was advanced in 0.3 to 1.5 Å steps during extension and 0.5 to 1.5 Å stepsupon retraction. Note the vertical spatial resolution of the piezoelectric stage used inthe AFM force measurements (Kendall and Hochella, 2003) is 1 Å. An optimizationwas completed after each step and the overall energy of the system plus interatomicdistances between siderophore O atoms and surface bound metals were recorded. Inaddition, molecular dynamics (MD) calculations were performed, where the systemwas ramped to a temperature of 300K followed by anneal dynamics (annealing cyclesbetween 100K and 300K) and a subsequent energy minimization.
Results from the Simulation of Siderophore-Oxide InteractionsUnder the modeling conditions, the simulated force/energy distance curves can
be separated into a number of events during approach/retraction:
• Successive formation/breaking of bonds between the azotobactin molecule andthe surface (specifically Fe or Al on the surface),
• contraction, twisting and stretching of the azotobactin molecule into variousconformations,
• displacement of an Fe or Al atom from its equilibrium position in the lattice,• release of an Fe or Al atom from the surface, and
812 U. Becker and others—Interactions between mineral surfaces and dissolved species:

• additional chelation of extracted metal atoms once other azotobactin groupsare released from or desorbed from the surface.
Simulated Approach Force Trace - Azotobactin and Goethite/DiasporeUpon approach of the azotobactin molecule to both the goethite and diaspore
from a Au-surface separation of 63 Å to 10Å, the siderophore O atoms coordinatewith metals on the surface in a sequence that is consistent with their relative positionon the peptide backbone: the C-terminal groups (for example, the homoserine (Hse)lactone and hydroxamate moieties) coordinate first followed by groups closer to thering structure at the N-terminus. This is expected because each amino acid was alignedin order upon stretching the molecule to a maximum contour length prior to thesurface approach. Although it was not fixed and atomic motion was permitted, thelinker molecule remained extended and rigid throughout the simulation. This is dueto the fairly rigid bond and dihedral angles within the aliphatic linker molecules. As aresult, the linker angles away from the axis of the extension and retraction, serving as aguide to lay the azotobactin molecule along its length onto the surface. The extensiontrace for each mineral is similar, with the diaspore curve essentially shifted down inrelative energy scale due to the lowered lattice energy associated with diaspore anddifferences in the definition of the metal-oxygen interaction potentials associated witheach mineral (fig. 14). All O atoms in both the peptide backbone and amino acid sidechains had the potential to coordinate with metals in the surface. However, stericconstraints imposed by the siderophore structure dictated which ones came closeenough to ultimately interact. These included (in order of coordination to thesurface): O1/O2 (hydroxamate), O4/O5 (Hse lactone), O3/O7 (backbone carbonylO atom and Hse), O11 (Ser hydroxyl), O13/O14 (�-hydroxyacid) (see also fig. 15).The slashes (“/”) in the previous sentence indicate attachment of the two O atoms inthe chelating group was approximately simultaneous.
It is interesting to note that the spacing of siderophore chelating pairs (forexample, O1/O2, O4/O5, O13/O14, and O3/O7), allows roughly equidistant coordi-nation to neighboring Fe atoms in the lattice (see fig. 14 as one example). In contrast,siderophore-sorption models based on bulk solution experiments on goethite specu-late an oxygen pair coordinating with a single Fe (Holmen and Casey, 1996; Holmenand others, 1997) and not with neighboring Fe atoms. Also, two of three groups knownto participate in the stable chelation of Fe(III)(aq) (O1/O2 hydroxamate and O13/O14 hydroxyacid) were sterically allowed to interact with the surface; however, Oatoms associated with other groups such as Hse are important to the surface interac-tion as well. Other functional groups higher up the backbone (for example pastO13/O14 � hydroxyacid and closer to the quinoline group), including the catecholgroup that participates in chelation of the free aqueous iron, do not coordinate withthe surface. This could be due to the steric restrictions imposed by their proximity tothe linker molecule, or, in the case of catechol, a result of modeling the moiety in adeprotonated state. Snapshots of the extension simulation confirm this, where at �35Å Au-surface separation, the linker folds the azotobactin molecule back upon itselfwith the � hydroxyacid (O13/O14) serving as a hinge point. While this behavior maybe unique to the presence of the linker, and not necessarily reflective of a surfaceconformation typical in nature, it is interesting to note that a similar hydroxyacid hingepoint position is observed in the proposed azotobactin-Fe(III) aqueous complexstructure (see fig. 13). A second extension simulation was completed with a lateralcomponent added to the downward motion. This was done to avoid generation of thehinge point and to stretch and lay the upper part of the molecule onto the mineral,thereby giving groups that are above the � hydroxyacid an opportunity to interact withthe surface. Additional coordination of groups closer to the Au atom (where the tip is)was, however, not observed.
813From monovalent ions to complex organic molecules

Aside from the unique structural constraints imposed for the purposes of simulat-ing the AFM conditions, it is not surprising that some of the possible charge transfergroups, including the oxygens that participate in aqueous chelation of iron (that is,catechol), do not interact with the surface. A similar observation has been made whenthe siderophore desferrioxamine (DFO) interacts with goethite at circumneutral pHand ionic strengths similar to our experimental AFM conditions (Kraemer and others,1999; Cocozza and others, 2002). DFO is a smaller ligand relative to azotobactin, andemploys three hydroxamate groups linked by a methyl backbone to form a hexaden-tate aqueous complex with iron. However, when releasing iron from a solid form,multiple kinetic and adsorption experiments show that DFO has a pseudo-first orderrate coefficient and an enthalpy/entropy relationship comparable to the single-hydroxamate ligand acetohydroxamic acid (aHA) (C2H5NO2) (Holmen and Casey,1996; Kraemer and others, 1999; Cocozza and others, 2002). This suggests a similargoethite dissolution mechanism for DFO and aHA, and, thus implies only one or twoof the three DFO hydroxamate groups interact with the surface (Cocozza and others,2002). Holmen and Casey (1996) postulate a reduction in the ligand’s conformationalfreedom when proximal to the surface, the hydrophobicity of the DFO backbone, andthe goethite structure all play a role in limiting the number of groups that canparticipate in surface reactions with the iron centers. As discussed above, our model
Fig. 14. Molecular models of azotobactin interacting with a goethite surface. From top to bottom, eachimage progressively ‘zooms’ in to the area of interest on the same model. Arrows point to hydroxamategroup terminal oxygens coordinating with irons in the lattice in a binuclear fashion. Note the spacing of thesiderophore oxygens allow for “bonds” (that is, Fe-O(siderophore) distances 2 Å) with neighboring irons.With this coordination, the distance between a siderophore oxygen and an iron diagonally across is greaterthan 3Å (modified from Kendall and others, 2005. Reprinted from Chemical Geology, Modeling ofazotobactin-goethite/diaspore interactions: Applications to molecular force measurements and siderophore-mineral reactivity, p. 17-35, with permission from Elsevier.).
814 U. Becker and others—Interactions between mineral surfaces and dissolved species:

also suggests that many of these factors are indeed relevant when considering theinteraction of azotobactin with the surface.
Significant gains in energy are calculated upon the coordination of each azotobac-tin group (fig. 14) with relatively large changes associated with the attachment of thehydroxyacid and the C-terminal Hse (lactone) (O4/O5). Relatively smaller gains inenergy are associated with protonated groups attaching to the surface (for example,O7), suggesting a weaker, hydrogen bond component may be important in theseinteractions. The final energy of the goethite system at a Au-surface separation of 10.8Å is -7547.4 kJ/mol, and the derivative of the energy profile with respect to distanceshowed a maximum force of 923 pN. This force peak, qualitatively equivalent to anexperimental jump to contact force (for example, the force at which the AFM
Fig. 15. (A) Simulated energy profile showing the successive attachment of azotobactin groups uponextension (approach) to the goethite and diaspore. Oxygen numbers (O1,O2,O4, etc.) refer to thenumbering system shown in figure 12. (B) Simulated energy profile of siderophore retraction from goethiteand diaspore (modified from Kendall and others, 2005. Reprinted from Chemical Geology, Modeling ofazotobactin-goethite/diaspore interactions: Applications to molecular force measurements and siderophore-mineral reactivity, p. 17-35, with permission from Elsevier.).
815From monovalent ions to complex organic molecules

cantilever jumps into contact with the surface; see Kendall and Lower, 2004), isassociated with the docking of the Hse lactone group in our model. It may be tenuousto compare these results directly to AFM data collected in solution; however, it is worthnoting that the modeled force magnitude and distance at which this jump occurred( 52 Å) compared favorably with averaged experimental AFM data values (at both pH3.5 and pH 7) collected with relatively high spring constants (ks � 0.123 N/m). Thiswas not the case with other data sets collected with softer (less stiff) cantilevers(ks � 0.06 N/m) that were perhaps less adept at capturing the steep gradientgenerated by the Hse lactone jump in the energy profile (Cappella and Dietler, 1999;Kendall and Lower, 2004). Here the lower spring constant resulted in a longer jump tocontact distance because the onset of the jump was already able to bend the cantilever.
Other factors should be considered when making this semi-quantitative compari-son of modeled forces with AFM data. The simulated value is representative of a singleazotobactin molecule interacting with the surface. Based on dimensional consider-ations and a Johnson-Kendall-Roberts model of adhesion, the capture of a singlemolecule interaction was not predicted for the prior AFM experiments (Kendall andHochella, 2003). Also, the simulation was completed in a vacuum and the jump tocontact energies and distances are expected to be lower in the presence of water due tocharge shielding. An assessment of the additive effect of multiple interactions (or areassessment of the number of interactions captured in the AFM data), together with acharacterization of the influence of a solvated environment may help to simulate theAFM experiments more closely. The difference between such an approach and thecurrent study would provide more information on solvation and hydrogen bondinginteractions.
Simulated Azotobactin - Free Fe3� InteractionThe bonding sequence during extension towards the goethite surface is different
from the bonding order associated with the interaction of the azotobactin-linkerconstruct with a single ferric iron atom. This emphasizes the different roles that eachfunctional group may play depending if the siderophore encounters an Fe atom in asolid or aqueous form. As the free ferric iron is moved into the siderophore structureparallel to its extended peptide backbone axis, the following attachment and releasesequence is revealed (O atoms separated by commas indicate two discrete events): O1attach, O2 attach, O4/O5 attach, O7 attach, O5 release, O8/O9 attach, O4 release.Again, the hydroxamate (O1, O2) is shown to participate in the coordination.However, steric hindrances preclude attachment of the catechol and the �-hydroxy-acid groups (O13/O14), even though the ferric iron was advanced to a separation of 8Å from the gold atom. The expected hexadentate (hydroxamate, catechol, hydroxy-acid) coordination that is suggested for the stable azotobactin (Azb) -Fe(III)aq com-plex is not observed, probably as a result of the direction and geometry of the advanceof the iron into the structure and the reduction in the degrees of conformationalfreedom imposed by the linkage. Note that this protocol was employed to facilitatecomparison with experimental and simulated force experiments. The presence of theavailable uncoordinated chelating groups in the model containing free iron are,however, in agreement with the experimental AFM data on the azotobactin-goethiteinteraction in Fe-rich solutions. During AFM experiments, the azotobactin-goethiteinteraction was probed after successively adding soluble free Fe3� ion (Kendall andHochella, 2003). A sharp decrease in adhesion forces with increasing [Fe(III)aq] wasfollowed by a plateau of residual adhesion that existed in spite of sufficient iron tosatisfy the chelating groups associated with all of the azotobactin molecules attached tothe tip, cantilever and substrate (Kendall and Hochella, 2003). The source of theresidual adhesion was hypothesized to be free chelating groups or other sidechain or
816 U. Becker and others—Interactions between mineral surfaces and dissolved species:

backbone O atoms interacting with the surface; an idea that is now supported by theconformation suggested in the azotobactin-Fe(III) model.
Simulated Retraction Force Trace - Azotobactin and Goethite/DiasporePrior to retracting the azotobactin from the surface, the metals in each mineral
lattice in close association (�2.2 Å away) with siderophore O atoms were identified (8total for goethite and diaspore) and marked with distance monitors (these distancemonitors have no direct influence on the calculations; rather they help to describe themetalmineral-Osiderophore interaction). These metal atoms were allowed to relax and aMorse potential was defined between the metal and the coordinating siderophore Oatom. Because no additional short-range interaction of siderophore groups wasobserved at Au-surface separation distances of less than �36 Å during approach,simulation time was reduced by beginning the retractions at this point. Metals areremoved from both minerals by the siderophore in the simulated retraction.
Goethite.—During retraction from the goethite, one Fe atom is completely re-moved from the structure by the terminal Hse group (O4/O5) and 4 others aredisplaced significantly from their equilibrium position on the surface (for example,Fe-Ogoethite distance exceeds �2.5Å, fig. 16) before snapping back to the lattice. Withthe exception of a sharp increase followed by a sharp decrease in the Fe atomdisplacement associated with � hydroxyacid O14, the displacement magnitudes steadilyincrease as the overall accumulated stress is transferred from one functional group tothe next (data not shown). This trend parallels the energy profile, which is character-ized by a large initial buildup, followed by a steady rise in energy with periodic spikescorrelating to the release of specific functional groups (some with a metal attached, fig.
Fig. 16. Displacement of irons from their equilibrium position in the lattice (Fe-Ogoethite bonddistance � 1.984Å) by the �-hydroxycarboxylic acid (O13 and O14) and the O11 Ser groups. Linesconnecting the siderophore oxygens and the goethite iron represent the Morse potentials used to model thesiderophore-metal interaction. The figure shows an intermediate stage of retraction with distance betweenthe respective O atoms (O11, O13, and O14) and the surface Fe atoms of 2.2 to 2.3 Å. Once this distance is �2.5 Å, the Fe atom snaps back into the surface in vacuum conditions (modified from Kendall and others,2005. Reprinted from Chemical Geology, Modeling of azotobactin-goethite/diaspore interactions: Applica-tions to molecular force measurements and siderophore-mineral reactivity, p. 17-35, with permission fromElsevier.).
817From monovalent ions to complex organic molecules

15B). As expected, the order of release from the surface is close to the reverse of theextension attachment sequence, with differences in the order of release of theC-terminal groups. The release sequence is as follows: O13, O14, O11, O7/O3, O2, O1,O4/O5. Interestingly, the Hse OH (O7) and a component of a backbone carbonyl(O3) are coupled in their release, in spite of a separation of almost a nanometer incontour length (for example, the maximum end-to-end distance of the extended,linearized azotobactin molecule). Conversely, a lack of coupling is observed betweenthe hydroxamate and hydroxyacid oxygen pairs separated by 1 to 2 Å.
Diaspore.—The shape of the diaspore retraction energy profile is similar to that ofgoethite, in that it shows four major energy peaks associated with the eight coordina-tions (fig. 15B). However, closer inspection of the Al displacements and the separationdistances at which siderophore functional groups release from the surface reveals asignificantly different interaction. One Al atom is removed from the structure (againby the terminal Hse group), and only 1 other atom is significantly displaced duringretraction of azotobactin from the diaspore surface. The large metal displacementobserved for the Fe-hydroxyacid coordination is much less pronounced with thediaspore and, overall, a two-fold increase in the average net maximum metal displace-ment is observed for goethite versus diaspore. The sequence is essentially the same asthat of goethite, however, functional groups release from the diaspore surface atsmaller separation distances. This is reflected in the energy profile where shifts indiaspore peak positions (to the left) show lower energy accumulation in theAl-Osiderophore surface bond prior to release compared to the Fe-Osiderophore bond. Inother words, the Fe-O(siderophore) bonds persist into a higher force regime resultingin relative goethite adhesion values that are 1.5 to 1.7 times higher than for diaspore, inspite of the more negative pullout energy predicted for Al over Fe. In the absence ofthe siderophore, the higher forces appear to result from the Fe-Osiderophore linkage andnot the Fe-Ogoethite bond. This relationship is comparable to AFM goethite/diasporeadhesion ratios (2 – 3 times), which also show increased adhesion and affinity forgoethite (Kendall and Hochella, 2003). Note that the more negative overall energyvalues associated with the diaspore are likely due to the differential stress imposed onthe azotobactin molecule by subtle differences in the metal spacing on the diaspore(010) surface and by the higher lattice energy of diaspore with respect to goethite. Thelatter effect lowers the absolute energy due to stronger metal-mineral interactionswithin diaspore.
The combination of quantum mechanical and empirical force-field simulationsshow that even though only two functional groups at a time can chelate a metal atom atthe surface (in contrast to six as in the case of siderophore-metal complexation insolution), it is possible that despite the steric hindrance, Fe3� ions can be removedfrom the goethite surface (Kendall and others, 2005).
Siderophore Affinity for Fe3� over Al3�
The specificity and increased affinity of azotobactin for the Fe atom in goethiteover Al in diaspore that is evident in force measurements and in the molecularmechanics simulations (for example, increased energy changes upon retraction) iscorroborated by the binding energies calculated from first principles. With bothsiderophore analogs, the acetohydroxamic acid and the hydroxycarboxylic acid,binding energies are more negative for Fe3� compared to Al3�. The absolute ab initiovalues show the same relationship as energies calculated from experimentally derivedformation constants (Kf); however, the latter values are higher (less negative). This is,in part, because the ab initio calculations do not include an entropy component, whichwould drive the energies down to a less negative value.
Based on previous observations (Hider, 1984; Albrecht-Gary and Crumbliss, 1998;Kendall and Hochella, 2003), it was hypothesized that part of the observed specificity
818 U. Becker and others—Interactions between mineral surfaces and dissolved species:

and increased affinity of azotobactin for Fe atoms was a result of iron’s increasedelectronegativity over Al. Relative comparison of the optimized Mulliken chargedistributions from the Gaussian98 models of the Fe and Al ligand complexes supportsthis argument. The larger ionic radius of Fe and an electronegativity closer to that ofoxygen results in an Fe atom with lower positive charge associated with less negative Oatoms. In other words, the Fegoethite-Osiderophore bond has a more covalent characterthan the Aldiaspore-Osiderophore bond. Comparison of the hydration energies associatedwith the Fe3� and Al3� ions coupled with observations made during the ab initio runspresent the possibility of surface hydration energies playing a role in the siderophoremineral interaction forces observed with the AFM. While these values have not beenmeasured for goethite and diaspore, it is possible that the increased (more negative)hydration energy associated with the Al3� ion (versus Fe3�) could correlate with anincreased surface hydration energy for diaspore over goethite. Therefore, the loweredsiderophore affinity observed for the diaspore surface could also reflect the extraenergy required to remove water from the diaspore surface.
Adsorption of oligomers to step edges as a precursor of biomineralizationIn the last two sections, we described interactions between organic molecules and
mineral surfaces, where the structural matching or steric considerations are onlyimportant at the scale of 1 to 3 bond distances. In contrast, structural matching atinorganic-organic interfaces along at least nanometers of interface is a key concept inoriented nucleation in biomineralization. As a precursor of biomineralization, we arestudying the interaction of oligomers/polypeptide chains on (101�4) calcite surface.The lowest energy faces of pure calcite are the (101�4) family of faces. Our mainobjective is to find suitable orientation of amino-acid residues in these peptide chains,where these peptide chains align themselves parallel to the calcite surface. Thestereochemical relation between the coordination environment of ions in specificcrystal faces (Ca2�, CO3
2- in this case) and the arrangement of ligands (that is peptideresidues, oligomers) around ions bound to the surface is a potential factor for organicnucleation and selectivity of biominerals. If the distance between the repeating residueunits in the adsorbent matches the distance between the repeating units in theadsorbate surface, the adsorbent long chain polymer or oligomeric organic compoundcan lie parallel to the surface step. To start with, we have performed calculations ofvarious sequences of small chain peptide residues along non-polar (periodic bondchains of alternating Ca2� and CO3
2- ions with no dipole moment perpendicular to thestep) and on polar surface steps (steps bounded by either Ca2� or CO3
2- ions). Eachpeptide residue was composed of 3 amino acids. The maximum adsorption energy thatwe found was for (phe-leu-lys)4-, where the total adsorption energy to a non-polarcalcite surface step is -1.071 eV [average of –0.357 eV/(amino acid unit), negativevalues � adsorption; positive � repulsion]. Adsorption energy values for other peptidechains vary between –0.1879 eV/(amino acid) to –0.2890 eV/(amino acid).
Almost parallel alignment of these 3-amino acid peptide residues is observedwhen aligned with polar Ca2�-bounded surface steps where the dominant interactionbetween the negatively charged peptide backbone and Ca2� along the surface step is ofelectrostatic nature. Adsorption energy values in this case range between –0.1733eV/(amino acid) to –0.2602 eV/(amino acid). The most energetically favorableadsorption is obtained for the sequence (phe-leu-lys)4- with -0.2978 eV/amino acid.
Using the same concept, we have used longer peptide chains having 12 aminoacids. Sequencing of amino acids has been obtained from encoded GPA, a calciumbinding protein in the coccolithophorid Emiliania Huxleyi (Corstjens and others,1998). Interaction of this 12-amino acid long peptide chain in both acidic (proton-ated) and alkaline (deprotonated) conditions with polar calcite steps for both cases(Ca2� and CO3
- bounding) has been studied. At alkaline conditions, the adsorption
819From monovalent ions to complex organic molecules

energy of the negatively charged peptide with the Ca2�-bounded step edge is –0.09824eV/amino acid. When the peptide residue is neutral (acidic condition), the adsorptionenergy is -0.1978 eV/ amino acid residue (CO3
2- at step edge). In this long chainpeptide, amino acid residues at the middle part of the chain are closer to the surfacethan the end-members giving a U shape to the peptide chain (fig. 17A). Better parallelalignment of the peptide chain to the calcite surface is observed in the neutral peptidethan for the –13 charged peptide residue. This can be owed to the fact that in thenegatively charged long chain peptide, electrostatic interactions between charged sidechains of the amino acids and the peptide backbone coupled with steric hindrance oflarge side chain prevents parallel alignment. It is also known that proteins can inhibitcalcite growth and that ability is attributed to backbone flexibility of peptide chain(Gerbaud and others, 2000), which may be another reason why we see flexible, notparallel, peptide chains on these polar steps.
Our simulations show that the presence of large side chains in the amino acidresidues can cause steric hindrance and prevent the peptide chain from aligningparallel to the calcite surface. In the 12-amino acid peptide residue, the presence of a5-member heterocyclic ring in proline, CH(CH3)-CH2-CH3 in isoleucine, and CH2-CH2-COOH in glutamic acid are responsible for the steric hindrance causing the U shape ofthe peptide chain (fig. 17A). To minimize this steric hindrance, the large side chains inamino acid residues have been replaced by H- and CH3
- groups, thus constructing a12-residue peptide chain with alternating glycine and alanine amino acids. At low pH,this 12–amino acid long glycine-alanine peptide residue aligns itself more or lessparallel to the calcite step edge, verifying that large side chains in amino acids aremajor obstacles in parallel alignment (fig. 17B). The adsorption energy for this gly-ala
Fig. 17. (A) 12 amino-acid residue long peptide chain along a polar step on a calcite (101�4) surface:Ca2� at step edge, total charge of the peptide chain is –13 (alkaline environment). (B) 12 amino-acid(alternating glycine and alanine) residue long peptide chain on polar, CO3
- -bounded step edge, peptide isneutral (acidic environment).
820 U. Becker and others—Interactions between mineral surfaces and dissolved species:
peptide residue is –0.0428 eV/amino acid residue along the polar CO32- step. The
average distance between the amino acid residues in this peptide chain is 3.185 Å.
summary and conclusions
The Influence of Monovalent Ions on the Growth/Dissolution Kinetics and Morphology ofDivalent Crystals
Before the interaction of more complex organic molecules with mineral surfacescan be understood, the interaction of monovalent ions in solution on the kinetics andmorphology of growth and dissolution of divalent crystals has been evaluated. This isimportant in order to avoid to attribute changes in surface morphologies, and growthand dissolution kinetics, to the potential influence of organic molecules in solution.
Monovalent ions tend to stabilize previously polar steps on the surfaces of divalentcrystals. Consequently, the morphologies of microscopic surface features such asgrowth islands and spirals, and etch pits are changed, ultimately influencing crystalhabits.
Monovalent ions can increase both growth and dissolution rates by modifying therate-controlling steps of growth and dissolution. For growth, this is the initialization ofa new growth row. For dissolution, this is the formation of a kink site along the edge ofan etch pit.
The latter point is another example that growth and dissolution are not necessarilyreverse processes of each other.
Growth-Inhibitor-Sulfate InteractionsDirect AFM measurements of growth rates of barite steps in the presence of
different concentrations of inhibitors allowed us to construct adsorption isothermsindicating a Langmuir-type of behavior for all inhibitors used. A linear relationshipexists between v0 /(v0-vi) and [Inh]-1 for inhibitor concentrations lower than 10 �mol/l.Since such isotherms have been constructed from growth rates measured in situ onmonomolecular barite steps, they represent a direct demonstration of the molecularbasis of the Langmuir model for adsorption processes. Slopes of the adsorptionisotherms were calculated from AFM experiments. Their values are similar to valuesobtained conducting classical bulk experiments. This demonstrates that AFM can beused to obtain quantitative adsorption data.
Calculations conducted using molecular modeling methods showed that the fivestudied phosphonates are only effective as growth inhibitors by blocking kink sitesalong monomolecular steps. Adsorption positions on terraces cannot be considered aspossible inhibition sites due to their positive adsorption energies. This is in agreementwith AFM observations and measurements. Calculated adsorption energies of the fivephosphonates on kink sites are in the order of hundreds of kJ/mol, indicatingchemisorption.
From both the growth rate versus inhibitor concentration data and the calculatedslope of the adsorption isotherms (that is, affinity constant), we can give the followingranking of inhibitor effectiveness: PBTC � NTMP � MDP � HEDP ��AMP. Thisranking of inhibiting effectiveness is consistent with previous experimental works.
Siderophore-Oxide InteractionsMolecular and quantum mechanical calculations are effective in providing quali-
tative and quantitative information on the azotobactin-metal oxide interaction that iscaptured during force measurements on the same system. Computer simulations ofthe AFM extension force traces show that both backbone and sidechain azotobactinoxygens have the opportunity to interact with the diaspore and goethite mineralsurfaces; however, steric considerations and constraints imposed by the presence of the
821From monovalent ions to complex organic molecules

mineral lattice dictate which ones ultimately coordinate. Similar functional groups areassociated with each mineral surface after extension; however, upon retraction of themolecule from these surfaces, the energy profiles of these pull-off events for diasporeand goethite are distinct. Quantum mechanical calculations of Fe3�/Al3� chelatesincluding hydration energies provide evidence that the ligand-surface interactionenergetically favors the iron oxide. Metal removal is predicted in the models com-pleted in vacuum; and additional simulations, ones that employ a bidentate, mono-nuclear coordination (as opposed to a bidentate, binuclear coordination) or includewater to act as a helper ligand confirm that siderophore metal removal via directsurface contact is possible in a natural system. In spite of the observed surface affinity,the ability of azotobactin to compete with smaller organic ligands (for example,oxalate) for sorption sites on the mineral remains to be determined. Future workcould include sorption experiments coupled with force measurements to determinethe effect of smaller ligands on azotobactin surface affinity and adhesion.
Steric hindrances limit the number of oxygens that coordinate with the surface toeight; however, for siderophore-oxide interactions in a natural system without thelinkage to the AFM tip imposing limitations on molecular conformation, this numberis expected to be higher. Azotobactin adsorption geometry is initially binuclear, butincreased surface coordination (for example, a higher Osiderophore:Fe ratio associatedwith the surface complex) is likely upon displacement of the metal by the ligand orwith changes in surface microtopography. One example of the latter is an increasedcoordination that results from siderophore oxygens accessing undercoordinatedmetals in surface sites associated with step edges. In both cases, increases in coordina-tion result in a more stable configuration and stronger Fe-Osiderophore bond.
Upon release from the surface (that is, due to thermal motion), the Fe-Osiderophorebond(s) persist, allowing metal removal from the lattice. The energetics of the system isthen minimized as the ligand reconfigures to enclose the iron in a multidentatecoordination, and the defect site in the mineral lattice relaxes and becomes hydrated.A similar dissolution pathway is predicted for the diaspore; however, azotobactinspecificity for the iron oxide surface over the aluminum oxide surface is observed inthis study and in the AFM measurements (Kendall and Hochella, 2003). With bothminerals present, this suggests the pathway will favor the iron oxide surface and willallow efficient azotobactin-mediated Fe(III) acquisition directly from the solid ironform.
Polypeptide-Calcite InteractionsEven though we are still beginning to evaluate the plethora of possibilities to let
polypeptide chains interact with specific steps on calcite surfaces, we are starting tounderstand certain principles, for example steric hindrances caused by “bulky”sidechains. Future work will be directed to use adsorption energy calculations in agenetics-like way to find optimized polypeptide sequences for specific calcite (or otherbiomineral) faces and step directions.
acknowledgmentsThe authors would like to thank two anonymous reviewers for their helpful and
constructive comments and the National Science Foundation (EAR-0403732) forfinancial support.
References
Albrecht-Gary, A. M., and Crumbliss, A. L., 1998, Coordination chemistry of siderophores: Thermodynamicsand kinetics of iron chelation and release, in Siegel, A., and Sigel, H., editors, Metal Ions in BiologicalSystems: Iron Transport and Storage in Microorganisms, Plants and Animals, v. 35: New York, MarcelDekker, p. 239–327.
822 U. Becker and others—Interactions between mineral surfaces and dissolved species:

Allan, N. L., Rohl, A. L., Gay, D. H., Catlow, C. R. A., Davey, R. J., and Mackrodt, W. C., 1993, Calculated bulkand surface properties of sulfates: Faraday Discussions, v. 95, p. 273–280.
Amjad, Z., editor, 1995, Mineral Scale Formation and Inhibition: New York, Plenum Press, 354 p.Archibald, D. D., Gaber, B. P., Hopwood, J. D., Mann, S., and Boland, T., 1997, Atomic force microscopy of
synthetic barite microcrystals: Journal of Crystal Growth, v. 172, p. 231–248.Becke, A. D., 1993, Density-functional thermochemistry. III. The role of exact exchange: Journal of
Chemical Physics, v. 98, p. 5648–5652.Becker, U., and Gasharova, B., 2001, AFM observations and simulations of jarosite growth at the molecular
scale: probing the basis for the incorporation of foreign ions into jarosite as a storage mineral: Physicsand Chemistry of Minerals, v. 28, p. 545–556.
Becker, U., Bosbach, D., and Pina, C., 1998, Dynamic simulation of crystal growth at the molecular scale:Toronto, Canada, International Mineralogical Association, 17th General Meeting, p. A92.
Becker, U., Risthaus, P., Bosbach, D., and Putnis, A., 2002, Selective attachment of monovalent backgroundelectrolyte ions and growth inhibitors to polar steps on sulfates as studied by molecular simulations andAFM observations: Molecular Simulation, v. 28, p. 607–632.
Black, S. N., Bromley, L. A., Cottier, D., Davey, R. J., Dobbs, B., and Rout, J. E., 1991, Interactions at theorganic inorganic interface - Binding motifs for phosphonates at the surface of barite crystals: Journal ofthe Chemical Society-Faraday Transactions, v. 87, p. 3409–3414.
Blount, C. W., 1977, Barite solubilities and thermodynamic quantities up to 300°C and 1400 bars: AmericanMineralogist, v. 62, p. 942–957.
Bosbach, D., 2002, Linking molecular scale barite precipitation mechanisms with macroscopic reactionrates, in Hellmann, R., and Wood, S. A., editors, Water-Rock Interactions, Ore Deposits, and Environ-mental Geochemistry: A Tribute to David A. Crerar: St. Louis, The Geochemical Society, SpecialPublication No. 7, p. 97–110.
Bosbach, D., and Hochella, M. F., Jr., 1996, Gypsum growth in the presence of growth inhibitors: A scanningforce microscopy study: Chemical Geology, v. 132, p. 227–236.
Bosbach, D., Hall, C., and Putnis, A., 1998, Mineral precipitation and dissolution in aqueous solution: in situmicroscopic observations on barite (001) with atomic force microscopy: Chemical Geology, v. 151,p. 143–160.
Bosbach, D., Coveney, P. V., Griffin, J. L. W., Putnis, A., Risthaus, P., Stackhouse, S., and Whiting, A., 2002,The rational design, synthesis and demonstration of the recognition and binding of a diaza-dioxa-12-crown-4 diphosphonate macrocycle to all crystal growth faces of barium sulfate: Journal of the ChemicalSociety, Perkin Transactions 2, p. 1238–1245.
Brixner, L. H., 1967, Segregation coefficients of rare earth niobates in CaMoO4: Journal of the Electrochemi-cal Society, v. 114, p. 108–109.
Busenberg, E., Plummer, L. N., and Parker, V. B., 1984, The solubility of strontianite (SrCO3) in CO2-H2Osolutions between 2 and 91°C, the association constants of SrHCO3
� (aq) and SrCO3O (aq) between 5
and 80°C, and an evaluation of the thermodynamic properties of Sr2� (aq) and SrCO3(cr) at 25°C and 1atm total pressure: Geochimica et Cosmochimica Acta, v. 48, p. 2021–2035.
Busing, W. R., and Levy, H. A., 1958, A single crystal neutron diffraction study of diaspore, AlO(OH): ActaCrystallographica, v. 11, p. 798–803.
Cabrera, N., 1953, Macroscopic spirals and the dislocation theory of crystal growth: Journal of ChemicalPhysics, v. 21, p. 1111–1112.
Cabrera, N., and Vermilyea, D. A., 1958, The growth of crystals from solution, in Doremus, R. H., Roberts,B. W., and Turnbull, D., editors, Growth and Perfection of Crystals: London, Chapman and Hall,p. 393–410.
Cappella, B., and Dietler, G., 1999, Force-distance curves by atomic force microscopy: Surface ScienceReports, v. 34, p. 1–2.
Cheah, S. F., Kraemer, S. M., Cervini-Silva, J., and Sposito, G., 2003, Steady-state dissolution kinetics ofgoethite in the presence of desferrioxamine B and oxalate ligands: implications for the microbialacquisition of iron: Chemical Geology, v. 198, p. 63–75.
Christy, A. G., and Putnis, A., 1993, The kinetics of barite dissolution and precipitation in water andsodium-chloride brines at 44-85°C: Geochimica et Cosmochimica Acta, v. 57, p. 2161–2168.
Cocozza, C., Tsao, C. C. G., Cheah, S. F., Kraemer, S. M., Raymond, K. N., Miano, T. M., and Sposito, G.,2002, Temperature dependence of goethite dissolution promoted by trihydroxamate siderophores:Geochimica et Cosmochimica Acta, v. 66, p. 431–438.
Cooper, T. G., and De Leeuw, N. H., 2002, Adsorption of methanoic acid onto the low-index surfaces ofcalcite and aragonite: Molecular Simulation, v. 28, p. 539–556.
Cornell, R. M., and Schwertmann, U., 1996, The Iron Oxides: Structure, Properties, Reactions, Occurrenceand Uses: Zurich, VCH Verlagsgesellschaft, 573 p.
Corstjens, P., van der Kooij, A., Linschooten, C., Brouwers, G. J., Westbroek, P., and de Vrind-de Jong, E. W.,1998, GPA, a calcium-binding protein in the coccolithophorid Emiliania Huxleyi (Prymnesiophyceae):Journal of Phycology, v. 34, p. 622–630.
Coveney, P. V., Davey, R. J., Griffin, J. L. W., and Whiting, A., 1998, Molecular design and testing oforganophosphonates for inhibition of crystallisation of ettringite and cement hydration: ChemicalCommunications, v. 14, p. 1467–1468.
Coveney, P. V., Davey, R., Griffin, J. L. W., He, Y., Hamlin, J. D., Stackhouse, S., and Whiting, A., 2000, A newdesign strategy for molecular recognition in heterogeneous systems: A universal crystal-face growthinhibitor for barium sulfate: Journal of the American Chemical Society, v. 122, p. 11557–11558.
Davey, R. J., Black, S. N., Bromley, L. A., Cottier, D., Dobbs, B., and Rout, J. E., 1991, Molecular design basedon recognition at inorganic surfaces: Nature, v. 353, p. 549–550.
823From monovalent ions to complex organic molecules

De Leeuw, N. H., and Cooper, T. G., 2004, A computer modeling study of the inhibiting effect of organicadsorbates on calcite crystal growth: Crystal Growth and Design, v. 4, p. 123–133.
De Leeuw, N. H., and Parker, S. C., 1997, Atomistic simulation of the effect of molecular adsorption of wateron the surface structure and energies of calcite surfaces: Journal of the Chemical Society-FaradayTransactions, v. 93, p. 467–475.
De Leeuw, N. H., Parker, S. C., and Harding, J. H., 1999, Molecular dynamics simulation of crystal dissolutionfrom calcite steps: Physical Review B, v. 60, p. 13792–13799.
Dove, P. M., and Czank, C. A., 1995, Crystal-chemical controls on the dissolution kinetics of the isostructuralsulfates - celestite, anglesite, and barite: Geochimica et Cosmochimica Acta, v. 59, p. 1907–1915.
Dunn, K., and Yen, T. F., 1999, Dissolution of barium sulfate scale deposits by chelating agents: Environmen-tal Science and Technology, v. 33, p. 2821–2824.
Frisch, M. J., Tomasi, J., Pople, J., and Gaussian, I., 1998, Gaussian98: Pittsburgh, Pennsylvania.Gale, J., 1998, GULP (General Utility Lattice Program): London, The Royal Institution.Gerbaud, V., Pignol, D., Loret, E., Bertrand, J. A., Berland, Y., Fontecilla-Camps, J. C., Canselier, J. P., Gabas,
N., and Verdier, J. M., 2000, Mechanism of calcite crystal growth inhibition by the N-terminalundecapeptide of lithostathine: Journal of Biological Chemistry, v. 275, p. 1057–1064.
Gualtieri, A. F., and Venturelli, P., 1999, In situ study of the goethite-hematite phase transformation by realtime synchrotron powder diffraction: American Mineralogist, v. 84, p. 895–904.
Hansen, D. C., McCafferty, E., Lins, C. W., and Fitzpatrick, J. J., 1995, An FT-IR investigation of parabactinadsorbed onto aluminum: Applied Surface Science, v. 84, p. 85–90.
Hay, B. P., and Rustad, J. R., 1994, Structural criteria for the rational design of Selective Ligands - Extensionof the MM3 force-field to aliphatic ether Complexes of the alkali and alkaline-Earth cations: Journal ofthe American Chemical Society, v. 116, p. 6316–6326.
Hay, B. P., Zhang, D. L., and Rustad, J. R., 1996, Structural criteria for the rational design of selective ligands.2. Effect of alkyl substitution on metal ion complex stability with ligands bearing ethylene-bridged etherdonors: Inorganic Chemistry, v. 35, p. 2650–2658.
Hay, B. P., Dixon, D. A., Vargas, R., Garza, J., and Raymond, K. N., 2001, Structural criteria for the rationaldesign of selective ligands. 3. Quantitative structure-stability relationship for iron(III) complexation bytris-catecholamide siderophores: Inorganic Chemistry, v. 40, p. 3922–3935.
He, S. L., Oddo, J. E., and Tomson, M. B., 1995, The nucleation kinetics of barium-sulfate in NaCl solutionsup to 6 M and 90°C: Journal of Colloid and Interface Science, v. 174, p. 319–326.
Hersman, L., Lloyd, T., and Sposito, G., 1995, Siderophore-promoted dissolution of hematite: Geochimica etCosmochimica Acta, v. 59, p. 3327–3330.
Hersman, L., Maurice, P., and Sposito, G., 1996, Iron acquisition from hydrous Fe(III)-oxides by an aerobicPseudomonas sp: Chemical Geology, v. 132, p. 25–31.
Hider, R. C., 1984, Siderophore mediated adsorption of iron, in Clarke, M. J., Ibers, J. A., Mingos, D. M. P.,Palmer, G. A., Sadler, P. J., and Williams, R. J. P., editors, Structure and Bonding: Siderophores fromMicroorganisms and Plants, v. 58: Heidelberg, Springer-Verlag, p. 25–87.
Higgins, S. R., Jordan, G., Eggleston, C. M., and Knauss, K. G., 1998, Dissolution kinetics of the bariumsulfate (001) surface by hydrothermal atomic force microscopy: Langmuir, v. 14, p. 4967–4971.
Holmen, B. A., and Casey, W. H., 1996, Hydroxamate ligands, surface chemistry, and the mechanism ofligand-promoted dissolution of goethite �-FeOOH(s): Geochimica et Cosmochimica Acta, v. 60,p. 4403–4416.
Holmen, B. A., Tejedor-Tejedor, M. I., and Casey, W. H., 1997, Hydroxamate complexes in solution and atthe goethite-water interface: A cylindrical internal reflection Fourier transform infrared spectroscopystudy: Langmuir, v. 13, p. 2197–2206.
Jones, F., Clegg, J., Oliveira, A., Rohl, A. L., Ogden, M. I., Parkinson, G. M., Fogg, A. M., and Reyhani, M. M.,2001, Anomalous behaviour within a systematic series of barium sulfate growth modifiers: CrystEng-Comm, v. 3(40), p. 165–167, DOI: 10.1039/b106729j.
Jones, F., Oliveira, A., Rohl, A. L., Parkinson, G. M., Ogden, M. I., and Reyhani, M. M., 2002, Investigationinto the effect of phosphonate inhibitors on barium sulfate precipitation: Journal of Crystal Growth,v. 237, p. 424–429.
Kalinowski, B. E., Liermann, L. J., Brantley, S. L., Barnes, A., and Pantano, C. G., 2000, X-ray photoelectronevidence for bacteria-enhanced dissolution of hornblende: Geochimica et Cosmochimica Acta, v. 64,p. 1331–1343.
Kendall, T. A., and Hochella, M. F., Jr., 2003, Measurement and interpretation of molecular-level forces ofinteraction between the siderophore azotobactin and mineral surfaces: Geochimica et CosmochimicaActa, v. 67, p. 3537–3546.
Kendall, T. A., and Lower, S. K., 2004, Forces between minerals and biological surfaces in aqueous solution:Advances in Agronomy, v. 82, p. 1–54.
Kendall, T. A., Hochella, M. F., Jr., and Becker, U., 2005, Computational modeling of azotobactin-goethite/diaspore interactions: Applications to molecular force measurements and siderophore-mineral reactiv-ity: Chemical Geology, v. 216, p. 17–35.
Kraemer, S. M., Cheah, S. F., Zapf, R., Xu, J. D., Raymond, K. N., and Sposito, G., 1999, Effect of hydroxamatesiderophores on Fe release and Pb(II) adsorption by goethite: Geochimica et Cosmochimica Acta, v. 63,p. 3003–3008.
Lee, C. T., Yang, W. T., and Parr, R. G., 1988, Development of the Colle-Salvetti correlation-energy formulainto a functional of the electron-density: Physical Review B, v. 37, p. 785–789.
Li, M., and Mann, S., 2000, Emergence of morphological complexity in BaSO4 fibers synthesized in AOTmicroemulsions: Langmuir, v. 16, p. 7088–7094.
Liermann, L. J., Kalinowski, B. E., Brantley, S. L., and Ferry, J. G., 2000, Role of bacterial siderophores indissolution of hornblende: Geochimica et Cosmochimica Acta, v. 64, p. 587–602.
824 U. Becker and others—Interactions between mineral surfaces and dissolved species:

Lumetta, G. J., Rapko, B. M., Garza, P. A., Hay, B. P., Gilbertson, R. D., Weakley, T. J. R., and Hutchison, J. E.,2002, Deliberate design of ligand architecture yields dramatic enhancement of metal ion affinity:Journal of the American Chemical Society, v. 124, p. 5644–5645.
Mann S., 2001, Biomineralization: Oxford, United Kingdom, Oxford University Press, 198 p.McWhirter, M. J., Bremer, P. J., Lamont, I. L., and McQuillan, A. J., 2003, Siderophore-mediated covalent
bonding to metal (oxide) surfaces during biofilm initiation by Pseudomonas aeruginosa bacteria:Langmuir, v. 19, p. 3575–3577.
Miertus, S., and Tomasi, J., 1982, Approximate evaluations of the electrostatic free-energy and internalenergy changes in solution processes: Chemical Physics, v. 65, p. 239–245.
Monnin, C., and Galinier, C., 1988, The solubility of celestite and barite in electrolyte-solutions and naturalwaters at 25°C - a thermodynamic study: Chemical Geology, v. 71, p. 283–296.
Nielsen, A. E., and Sohnel, O., 1971, Interfacial tensions electrolyte crystal-aqueous solution, from nucle-ation data: Journal of Crystal Growth, v. 11, p. 233–234.
Nygren, M. A., Gay, D. H., Catlow, C. R. A., Wilson, M. P., and Rohl, A. L., 1998, Incorporation ofgrowth-inhibiting diphosphates into steps on the calcite cleavage plane surface: Journal of the ChemicalSociety-Faraday Transactions, v. 94, p. 3685–3693.
Palanche, T., Marmolle, F., Abdallah, M. A., Shanzer, A., and Albrecht-Gary, A. M., 1999, Fluorescentsiderophore-based chemosensors: iron(III) quantitative determinations: Journal of Biological Inor-ganic Chemistry, v. 4, p. 188–198.
Parker, S. C., Titiloye, J. O., and Watson, G. W., 1993, Molecular modeling of carbonate minerals - studies ofgrowth and morphology: Philosophical Transactions of the Royal Society of London Series A-Mathematical Physical and Engineering Sciences, v. 344, p. 37–48.
Pina, C. M., Becker, U., Risthaus, P., Bosbach, D., and Putnis, A., 1998a, Molecular-scale mechanisms ofcrystal growth in barite: Nature, v. 395, p. 483–486.
Pina, C. M., Bosbach, D., Prieto, M., and Putnis, A., 1998b, Microtopography of the barite (0 0 1) face duringgrowth, AFM observations and PBC theory: Journal of Crystal Growth, v. 187, p. 119–125.
Pina, C. M., Putnis, C. V., Becker, U., Biswas, S., Carroll, E. C., Bosbach, D., and Putnis, A., 2004, An atomicforce microscopy and molecular simulations study of the inhibition of barite growth by phosphonates:Surface Science, v. 553, p. 61–74.
Putnis, A., Putnis, C. V., and Paul, J. M., 1995, The efficiency of a DTPA-based solvent in the dissolution ofbarium sulfate scale deposits: San Antonio, Texas, Paper SPE 029094 Proceedings of the 1995 SPEInternational Symposium on Oilfield Chemistry, p. 773–785.
Qi, L. M., Colfen, H., and Antonietti, M., 2000, Control of barite morphology by double-hydrophilic blockcopolymers: Chemistry of Materials, v. 12, p. 2392–2403.
Rappe, A. K., Casewit, C. J., Colwell, K. S., Goddard, W. A., and Skiff, W. M., 1992, UFF, a full periodic-tableforce-field for molecular mechanics and molecular-dynamics simulations: Journal of the AmericanChemical Society, v. 114, p. 10024–10035.
Rashin, A. A., and Honig, B., 1985, Reevaluation of the Born model of ion hydration: Journal of PhysicalChemistry, v. 89, p. 5588–5593.
Reardon, E. J., and Armstrong, D. K., 1987, Celestite (SrSO4(s)) solubility in water, seawater and NaClsolution: Geochimica et Cosmochimica Acta, v. 51, p. 63–72.
Redfern, S. E., and Parker, S. C., 1998, Atomistic simulation of the effects of calcium and strontium defectson the surface structure and stability of BaSO4: Journal of the Chemical Society-Faraday Transactions,v. 94, p. 1947–1952.
Risthaus, P., Bosbach, D., Becker, U., and Putnis, A., 2001, Barite scale formation and dissolution at highionic strength studied with atomic force microscopy: Colloids and Surfaces A-Physicochemical andEngineering Aspects, v. 191, p. 201–214.
Rohl, A. L., Gay, D. H., Davey, R. J., and Catlow, C. R. A., 1996, Interactions at the organic/inorganicinterface: Molecular modeling of the interaction between diphosphonates and the surfaces of baritecrystals: Journal of the American Chemical Society, v. 118, p. 642–648.
Sangwal, K., 1998, Growth kinetics and surface morphology of crystals grown from solutions: Recentobservations and their interpretations: Progress in Crystal Growth and Characterization of Materials,v. 36, p. 163–248.
Sayle, D. C., Catlow, C. R. A., Harding, J. H., Healy, M. J. F., Maicaneanu, S. A., Parker, S. C., Slater, B., andWatson, G. W., 2000, Atomistic simulation methodologies for modelling the nucleation, growth andstructure of interfaces: Journal of Materials Chemistry, v. 10, p. 1315–1324.
Shiraki, R., Rock, P. A., and Casey, W. H., 2000, Dissolution kinetics of calcite in 0.1 m NaCl solution at roomtemperature: An atomic force microscopic (AFM) study: Aquatic Geochemistry, v. 6, p. 87–108.
Telford, J. R., and Raymond, K. N., 1996, Siderophores: Comprehensive Supramolecular Chemistry, v. 1,p. 245–266.
Van der Leeden, M. C., and van Rosmalen, G. M., 1995, Adsorption behavior of polyelectrolytes onbarium-sulfate crystals: Journal of Colloid and Interface Science, v. 171, p. 142–149.
Wang, K. S., Resch, R., Dunn, K., Shuler, P., Tang, Y. C., Koel, B. E., and Yen, T. F., 1999a, Dissolution of thebarite (001) surface by the chelating agent DTPA as studied with non-contact atomic force microscopy:Colloids and Surfaces A-Physicochemical and Engineering Aspects, v. 160, p. 217–227.
Wang, K. S., Resch, R., Koel, B. E., Shuler, P. J., Tang, Y. C., Chen, H. J., and Yen, T. F., 1999b, Study of thedissolution of the barium sulfate (001) surface with hydrochloric acid by atomic force microscopy:Journal of Colloid and Interface Science, v. 219, p. 212–215.
Wang, K. S., Resch, R., Dunn, K., Shuler, P., Tang, Y. C., Koel, B. E., and Yen, T. F., 2000, Scanning forcemicroscopy study of etch pits formed during dissolution of a barite (001) surface in CDTA and EDTAsolutions: Langmuir, v. 16, p. 649–655.
825From monovalent ions to complex organic molecules