interactions between laponite and microbial biofilms in porous media: implications for colloid...
TRANSCRIPT

Water Research 38 (2004) 3614–3626
ARTICLE IN PRESS
*Correspond
+49-0-203-379
E-mail addr
(M. Strathman
0043-1354/$ - se
doi:10.1016/j.w
Interactions between laponite and microbial biofilms in porousmedia: implications for colloid transport and biofilm stability
C. Felipe Leon-Morales, Andrew P. Leis, Martin Strathmann*,Hans-Curt Flemming
Institute for Interface Biotechnology, University of Duisburg-Essen, Geibelstrasse 41, 47057 Duisburg, Germany
Received 14 November 2003; received in revised form 20 April 2004; accepted 12 May 2004
Abstract
Quartz sand columns and sand-filled microscope flow cells were used to investigate the transport characteristics of the
clay colloid laponite, and a biofilm-forming bacterium, Pseudomonas aeruginosa SG81. Separate experiments were
performed with each particle to determine their individual transport characteristics in clean sand columns. In a second
set of experiments, bacterial biofilms were formed prior to introduction of the clay colloids. In the independent
transport experiments, bacteria and laponite each conformed to known physicochemical principles. A sodium chloride
concentration of 7� 10�2 M caused complete retention of the laponite within the sand columns. P. aeruginosa SG81
was generally less influenced by ionic strength effects; it showed relatively low mobility at all ionic strengths tested and
some (albeit reduced) mobility when introduced to the columns in 1 M NaCl, the highest concentration tested, but
nevertheless showed reproducible trends. Under conditions favourable to laponite retention and biofilm stability
(7� 10�2 M NaCl), laponite suspensions were able to remobilise a portion of the attached bacterial biomass. At low
ionic strength, the profile of laponite elution was also altered in the presence of a P. aeruginosa biofilm. These
observations suggest that while a reduction in ionic strength has a dominant influence on the mobilisation of biological
and inorganic colloids, the presence of laponite and biomass can have a distinct influence on the mobility of both types
of colloids. Since these events are likely to occur in subsurface environments, our results suggest that colloid–biofilm
interactions will have implications for colloid–bound contaminant transport and the remobilisation of pathogens.
r 2004 Elsevier Ltd. All rights reserved.
Keywords: Biofilms; Clay; Colloid; Contaminant transport; Laponite; Porous media; Subsurface
1. Introduction
The movement of particulates through the subsurface
has been studied and modelled in detail, and extensive
reviews are available (Ryan and Elimelech, 1996).
Movement of particulates which fall in the colloidal
size range, i.e. approximately between 10�9 and 10�6 m,
ing author. Tel.: +49-0-203-379-3827; fax:
-1941.
ess: [email protected]
n).
e front matter r 2004 Elsevier Ltd. All rights reserve
atres.2004.05.009
have proven implications for contaminant transport
(McCarthy and Zachara, 1989), either when such
colloids represent contaminants (e.g. heavy metals, some
organics, and microbial pathogens) (Kersting et al.,
1999), or when relatively innocuous colloids such as clay
minerals enhance the transport of pollutants (Groli-
mund et al., 1996; Roy and Dzomak, 1997). Under
conditions which stimulate the retention and aggrega-
tion of colloids, e.g. high ionic strength, the colloids
form an integral part of the subsurface structural matrix.
The importance of colloid-facilitated transport is em-
phasised by the fact that changes in environmental
d.
ARTICLE IN PRESSC.F. Leon-Morales et al. / Water Research 38 (2004) 3614–3626 3615
conditions (e.g. sudden reductions in ionic strength) can
cause remobilisation in a process known as colloid
generation. Colloids ‘‘generated’’ in this way can be an
important mechanism for the transport of strongly
sorbing pollutants (Grolimund et al., 1996), and other
colloids.
Little is known about the in situ mobility of
microorganisms under extreme conditions such as
pronounced changes in ionic strength resulting from
rainfall events or de-icing of streets with salt, although
laboratory simulations would suggest that these condi-
tions will have an impact on the mobility of biocolloids
(Deshpande and Shonnard, 1999). Microbial deposition
in the subsurface raises an important aspect of microbial
transport through porous materials: the ability of
microorganisms to colonise a porous medium, produce
extracellular polymeric substances (EPS) and grow as
biofilms (Cunningham et al., 1991). Biofilm formation
and release can be considered analogous to the process
of colloid generation or release described earlier. As a
consequence, these microbial formations are expected to
influence colloid transport in several different ways.
These influences can be direct as is the case of particle
retention within biofilm compartments (Okabe et al.,
1997) or indirect as is the case for changes in
hydrodynamic conditions caused by extensive biofilm
growth. Changes in hydrodynamic conditions within the
porous media caused by thick biofilm formation have
been recognised (Sharp et al., 1999). Thick, confluent
biofilms are common in engineered systems or in
nutrient rich environments (i.e. heavily contaminated
environments) whereas thin and patchy biofilms are
commonly found in pristine subsurface environments.
The transport of microorganisms through porous
media has received considerable attention (Camesano
et al., 1999; Deshpande and Shonnard, 1999; Jewett
et al., 1999; Smets et al., 1999), although the focus of
these studies has been varied. These include studies on
preventing bacterial migration through aquifer systems
(e.g. filtration of pathogens) (El-Masry et al., 1995;
Tufenkji et al., 2002) and studies centred on enhancing
microbial transport to a contaminated site for bioreme-
diation (Li and Logan, 1999). Sand columns are
commonly used to obtain colloid transport parameters,
such as collision efficiencies. As will be expanded upon
in the theoretical background section, deposition para-
meters in sand columns rely on the quantification of
influent/effluent concentrations. The quantification of
retained colloids or biocolloids typically involves
destructive methods such as extrusion of the porous
medium and slicing to determine cell numbers by
labelling methods like microbe and radiolabel kinesis
(MARK) (Gross et al., 1995; Li and Logan, 1999). The
confocal microscopy approach reported in the present
study takes advantage of the ability to acquire informa-
tion on the retention of fluorescently-labelled bacteria
using online, non-destructive technology which can be
independent of influent/effluent bacterial concentrations
and which at the present state of development can serve
as a semi-quantitative tool for the determination of
colloidal particle deposition. The main aim of the
present report is to highlight the differences between
the transport of the synthetic clay mineral laponite, and
a microorganism, Pseudomonas aeruginosa SG81, within
sand-packed laboratory columns. Both particles were
studied separately, and the transport of laponite and its
effects on biofilm stability were studied subsequent to
the establishment of microbial biofilms within the
porous medium.
2. Theoretical background
According to classical groundwater hydrology, the
transport of solutes through porous materials can be
described by accounting for advection (or mechanical
movement) and hydrodynamic dispersion (as a sum of
molecular diffusion and mechanical dispersion). The
equation describing these relationships is known as the
advection–dispersion equation (ADE). In the case of the
transport of colloidal particles, several researchers
(Kretzschmar et al., 1997; Grolimund et al., 1998,
2001) have commonly used a modified version of the
ADE that includes a term accounting for particle
deposition (filtration). The concentration of suspended
particles at a determined column depth and time, cðx; tÞcan then be written as
@C
@t¼
@2C
D@x2� v
@C
@x� kc; ð1Þ
where v is interstitial colloid particle velocity, D is the
hydrodynamic dispersion coefficient and k is the particle
deposition rate coefficient. For this equation to be valid,
the column should be initially free of colloidal particles
(clean bed), colloidal release should be minimal com-
pared with deposition, and colloid concentration should
be small (no ripening or blocking effects). Additionally,
the model assumes a Fickian type of movement (rate of
solute spread grows linearly with time). As will be seen
later, these conditions are met in our experimental
setting.
Column parameters such as pore volumes, tracer
dispersivities and average travel times can be obtained
from experimental tracer breakthrough curves (BTC).
One can either fit experimental data to an analytical
solution of the transport equation (1) using a standard
nonlinear least-squares procedure or they can be
obtained by moment analysis of the BTC (Dyson,
1990). In sand columns with high Peclet numbers both
procedures yield similar results (Grolimund et al., 1998).
For either method it is necessary to obtain a normal-
isation constant, n0; which represents the total amount

ARTICLE IN PRESSC.F. Leon-Morales et al. / Water Research 38 (2004) 3614–36263616
of particles injected divided by the total volumetric flux.
This constant can be obtained experimentally from a
bypass experiment in which the column is replaced by
standard tubing. We used the method of moments to
obtain column parameters and the other colloidal
transport characteristics. All integration routines were
made either in Microsoft Excel or using open source
plotting programs.
Deposition rate constant kd for colloid transport
experiments can then be obtained by comparing the
integrated amount of particles in the effluent C with the
total injected amount C0 (Grolimund et al., 2001):
kd ¼1
tpln
C
C0
� �; ð2Þ
where tp is the average travel time of particles through
the sand column. At sufficiently low salt concentrations
the deposition rate constant is proportional to the salt
concentration but at high salt levels this constant
becomes independent of the salt concentration. Condi-
tions at high salt levels are known as fast (favourable)
deposition conditions. The collision efficiency, a; can
then be written as
a ¼kd
kdf; ð3Þ
where kdf is the deposition rate constant for fast
deposition conditions.
3. Materials and methods
3.1. Inorganic colloids
Laponite RD, a synthetic hectorite clay was chosen as
a model colloid due to its high purity, monodispersity,
and homogeneous dispersion properties in deionised
water. Laponite consists of 30 nm diameter plate-like
particles with a thickness of 1–2 nm when hydrated
(Nicolai and Cocard, 2001). Laponite suspensions were
used at the following concentrations: 2000 mg L�1
suspended in 0 M and 7� 10�2 M NaCl; 200 mg L�1
suspended in 6.25� 10�4, 1.25� 10�3, 2.5� 10�3,
5� 10�3, 1� 10�2 and 3.5� 10�2 M NaCl. Other
laponite concentrations and ionic strengths of the
suspending media were assessed (data not shown),
which resulted in different laponite aggregation states.
Aggregation was generally favoured by high ionic
strengths but was dependent on laponite concentration.
For instance, 2000 mg L�1 laponite at 7� 10�2 M NaCl
was highly aggregated with aggregate sizes of several
micrometres, but 20 mg L�1 laponite at 7� 10�2 M was
less aggregated and contained smaller-sized aggregates
(as evidenced by epifluorescence microscopy of rhoda-
mine-stained laponite preparations). Additionally, the
laponite dispersions were stained with a cationic dye,
rhodamine 6G (Fluka, Switzerland) at concentrations
ranging from 5� 10�7 M to 5� 10�6 M depending on
laponite concentration, according to the protocol
described in Tapia Estevez et al. (1993). The adsorption
of the rhodamine 6G monomer onto laponite was
confirmed by a shift in the absorption maximum of the
dye from 526 nm to 535 nm when adsorbed to laponite,
as reported in detailed spectroscopic studies of rhoda-
mine 6G adsorption onto other clay minerals (Lopez
Arbeloa et al., 1996). When dispersed in deionised water,
laponite dispersions were clear and apparently non-
aggregated after approximately 40 min of stirring. The
pH of the dispersions was dependent on the laponite
concentrations and ranged from pH 10 for the highest
laponite concentration used in this study (2000 mg L�1)
to pH 6.6 for less concentrated dispersions (20 mg L�1).
The pH of the working laponite suspensions was
adjusted when necessary to 6–7 where indicated by
using 0.2 M HCl or 0.2 M NaOH. Absorbance measure-
ments to detect laponite were done at 535 nm in all sand
column experiments and fluorescence detection of the
laponite–rhodamine complex was used for the same
purpose in the sand-packed flow cell experiments.
3.2. Biocolloid suspensions
A well characterised biofilm-forming, EPS-producing
microorganism, P. aeruginosa SG81, was chosen as a
model biocolloid. P. aeruginosa SG81 is a mucoid,
Gram-negative, motile bacterium which was originally
isolated from a technical water distribution system
(Grobe et al., 1995). The organism was grown in batch
culture on 15
strength tryptic soy broth (TSB) (Merck,
Darmstadt). According to conventional growth curves
(data not shown) the organism was harvested during or
at the end of the logarithmic phase for use in the biofilm
formation or transport experiments, respectively. The
harvesting at the end of the logarithmic phase was done
to minimise the potential for increase in cell numbers
during the transport experiments. For the transport
experiments, the organisms were concentrated in reac-
tion tubes by centrifugation and then washed with
6� 10�4 M NaCl to remove traces of nutrient medium
by centrifuging at least 2 times at 3000� g for 5 min at
5�C. The cells were washed with low NaCl concentra-
tions i.e. 6� 10�4 M NaCl, in order to facilitate cell re-
suspension by vortexing. Salt concentration in the cell
suspensions was finally adjusted to 1� 10�3, 1� 10�2,
1.4� 10�1 and 1 M NaCl. Cell suspensions prepared in
this way typically had cell concentrations of
1.7� 109 cells mL�1 , as determined by total cell counts
(TCC) using a standard Thoma cell counting chamber in
combination with phase contrast microscopy. Calibra-
tion curves were constructed to determine numbers of
bacteria in suspension at a given absorbance by plotting
TCC against absorbance. On some occasions, colony

ARTICLE IN PRESSC.F. Leon-Morales et al. / Water Research 38 (2004) 3614–3626 3617
forming units (CFU) were determined to evaluate the
effectiveness of the acid/base treatment for the sand
columns.
For flow cell experiments, cells were stained with the
nucleic acid-specific fluorochrome SYTO 9 (Molecular
Probes). The staining procedure for bacterial suspen-
sions varied depending on the type of experiment. In one
case, 1.5 mL of the SYTO 9 staining solution was added
per millilitre of bacterial suspension. In the other case in
which bacteria were growing inside the sand-packed
flow cells, two to three pore volumes of the 1.5 mL mL�1
SYTO 9 solution were pumped through the biofilm-
growing flow cell using a peristaltic pump.
Detection of bacteria was done either by measuring
absorbance of unstained suspensions (sand column
experiments) at 240 nm, or by measuring the fluores-
cence emitted by the SYTO 9 stain when combined with
bacterial DNA using confocal scanning laser micro-
scopy (CLSM, as described in Section 3.4). Absorbance
was measured with a UV/Visible spectrophotometer
(Cary 50, Varian Inc.). Other measurements i.e. total cell
counts were performed off-line by collecting samples
using a fraction collector.
3.3. Column experiments
Glass chromatography columns (Amersham Bios-
ciences, Freiburg, Germany) with a diameter of 1 cm
and a length of 10 cm were used. Tygon LFL tubing
(Novodirect, Kehl, Germany) was used to connect the
columns to a peristaltic pump (Ismatec SA, Switzer-
land). The columns were packed with quartz sand type
F34 with an average size of 0.2 mm. The sand was first
washed by means of an acid/base treatment which
consisted of the introduction of 10 pore volumes of
0.2 M NaOH and 10 pore volumes of 0.2 M HCl, each
followed by the introduction of sterile deionised water.
This treatment served to standardise the chemical
homogeneity of the columns, remove mineral and
organic colloidal residues, and minimise contamination
by microorganisms. Columns were not autoclaved
because this treatment alters the water saturation
conditions under which the columns were packed.
Regular bacteriological plate counts and microscopic
inspections of column effluent did not show any
evidence for microbial contamination.
Each column was packed with 11 g of sand (dry
weight), minimising air introduction as described in
Deshpande and Shonnard (1999). General column
characteristics were extracted from the BTC of nigrosine
tracers as illustrated in the theoretical background
section. Peclet numbers (Pe) were calculated from the
formula, Pe ¼ VxL=D; where Vx represents interstitial
particle velocity, L; length of the column and D,
dispersion. Flow speed was confirmed by measuring
precise effluent volumes over time. The column influent
was always introduced in an up-stream mode in an effort
to minimise non-fickian types of fluid movement. UV/
Visible spectrophotometry was performed online using
quartz flow-through cuvettes (Starna, Germany).
In one type of experiment, pulses of rhodamine-
stained laponite (600mL, 200 mg L�1 at ionic strength as
described above) or P. aeruginosa SG81 (concentrations
described above) were introduced to clean columns.
Prior to pulse injection, the pH of the column effluent
was stable and the appropriate NaCl solution was used
to pre-condition the column. After pulse injection, the
same NaCl solution was re-introduced. In the cases
where the injected colloids were retained inside the
columns, their re-mobilisation after depletion of ionic
strength was also recorded using spectrophotometry.
BTCs were baseline corrected and the first three
moments (i.e. peak area, peak centre of gravity and
peak variance) were used to obtain transport parameters
using equations as given above.
In biofilm formation experiments, sterile columns
were pre-conditioned with 15
strength TSB before the
introduction of approximately one pore volume of
bacterial inoculum. The cells were not washed for these
experiments and were introduced suspended in the
original growth medium (15
TSB). The inoculation was
performed when the cells were in the logarithmic phase
(typically 5 h). The inoculated columns were left
stagnant for 2–3 days, after which 15
TSB was introduced
at a flow rate of 17 mL h�1. The flow was introduced for
up to 10 h a day for 1–2 weeks. Under these conditions,
the biofilm-containing columns were subjected to
sudden changes in ionic strength (depletion) or to the
introduction of aggregated or un-aggregated (low/high
ionic strength) laponite suspensions. Prior to the
application of these disturbances, the column influent
was changed from 15
TSB to a higher ionic strength NaCl
solution, i.e. 7� 10�2 M NaCl. After several pore
volumes, when absorbance of the column effluent and
bacterial cell numbers were constant (i.e. at
1� 107 cells mL�1), the disturbances were introduced.
In the first case, the NaCl solution was changed to
deionised water. In the second case, the NaCl solution
was substituted with laponite dispersed in 6.2� 10�4 M
NaCl (low ionic strength) or laponite dispersed in
7� 10�2 M NaCl (high ionic strength). After elution of
laponite was complete, the influent continued with the
same ionic strength as that of the laponite suspension
injected previously. In the same way, absorbance and
total cell counts were monitored ca. every 8 min, and pH
was monitored at regular intervals.
3.4. Flow cell experiments
Stainless steel flow cells normally used for growing
biofilms on the surfaces of glass slides were adapted for
porous medium experiments by packing with quartz

ARTICLE IN PRESSC.F. Leon-Morales et al. / Water Research 38 (2004) 3614–36263618
sand F34. The flow cells consisted of two independent
parallel chambers with individual channel dimensions
of 8 mm� 3 mm� 54 mm corresponding to a volume
of 1.32 mL. Microscope glass cover slips (dimensions
60 mm� 24 mm� 0.17 mm) were fixed onto both sides
of the flow cell, using additive-free silicone rubber
(Fig. 1). The basic parameters determined as for the
chromatography columns were also determined for the
flow cells (see Table 1). The same tubing, used for the
sand columns, was used to connect the flow cells to the
peristaltic pump, to influent solutions, and to a waste
reservoir. Packed flow cells received the same cleaning
treatment as the chromatography columns (commensu-
rate with size). The inoculation of the flow cells was
performed with sterile syringes through ports located
close to the flow cell inlet.
For transport experiments in flow cells, 100 mL of
bacterial suspensions stained with SYTO 9 (lex;max:
480 nm, lem;max 500 nm) or 100 mL of rhodamine-stained
UV/VIS
purge
fractioncollector
pH
Off-line:total cell counts(TCC) using phase contrast microscopy
influent
peristalticpump
effluent
Fig. 1. General exper
Table 1
Sand column and sand-packed flow cell characteristics. Results were
Basic parameters From mo
Sand columns Flow cells
Flow rate (mL min�1) 0.8 0.3 Velocity (
Flow rate (cm min�1) 2.17 2.66 Travel tim
Bulk density (g cm�3) 1.41 1.41 Pe
Porosity (%) 47 47
Pore volume (mL) 3.69 0.62
laponite suspensions (lex;max: 500 nm, lem;max 551 nm)
were introduced at a constant flow of 0.3 mL min�1
into flow cells which were pre-conditioned with the
appropriate NaCl solution. NaCl concentrations for
bacteria or laponite were as indicated above. Flow cells
were placed horizontally on the microscope stage.
Observation sites were located at inlet, middle and
outlet positions. Breakthrough data were recorded
at outlet positions (still within the porous medium).
BTCs were obtained by image analysis of CLSM cross-
sectional images recorded at 10 s intervals. Stained
areas were equated to the entire observation area
(230.30 mm� 230.30 mm) minus grain areas as measured
from a rhodamine-stained laponite suspension run
previously through the same observational spot at
extremely low ionic strength (0 M NaCl). Rhodamine–
laponite suspensions at very low ionic strength were
shown to be transported very efficiently (almost no
retention at inlet, middle and outlet positions) through
inoculation port
CLSM
sand-packedflow cell
imental setting.
obtained from triplicate tracer experiments
ment analysis of tracer BTCs
Sand columns Flow cells
m s�1) 5.7� 10�4 (74.2� 10�5) 3.2� 10�4 (72� 10�5)
e (s) 175 (78.6) 171.8 (711.6)
1040 (734) 1612 (7177)

ARTICLE IN PRESS
-3 -2 -1 0
-2
-1
0
Log
colli
sion
effi
cien
cy
Log ionic strength [M]
Laponite
Bacteria
-3 -2 -1 0
-2
-1
0Lo
g co
llisi
on e
ffici
ency
Log ionic strength [M]
Bacteria
Laponite
(A)
(B)
Fig. 2. (A) Collision efficiencies for P. aeruginosa SG81 and
laponite RD obtained from sand column experiments as a
function of ionic strength (sodium and chloride ions), (B)
Collision efficiencies obtained from sand-packed flow cell
experiments. All data shown represent at least duplicate
experiments.
C.F. Leon-Morales et al. / Water Research 38 (2004) 3614–3626 3619
the sand-packed flow cells. Prior to the experiments the
intensities of both the low ionic strength ‘‘tracer’’
rhodamine–laponite suspension and the colloidal sus-
pension to be assessed were calibrated to match very
closely. This was achieved by using microscope settings
(excitation wavelength of 488 nm and a 505 nm long
pass-filter) that allowed for the simultaneous detection
of both types of dyes at a single detection channel and
by modifying the microscope detector gain.
Both in the case of laponite and bacterial transport
experiments the maximum covered area achieved by the
rhodamine–laponite suspension was taken as 100%
coverage (C0) and the elution of subsequent colloidal
dispersions was taken as a fraction of this measure (C).
The method also allowed for the quantification of
retained cells at the different observation sites in a non-
destructive manner. Transport parameters were ob-
tained by moment analysis of the BTCs generated in
this way.
For biofilm growth experiments, approximately one
pore volume of P. aeruginosa SG81 suspension as
described earlier was introduced to each chamber. The
inoculated flow cell was left stagnant for one day. A flow
of 0.1 mL min�1 was introduced initially and increased
incrementally with several hours or days in between, up
to 0.5 mL min�1; this allowed the biofilms to adapt
gradually to the increased flow without considerable loss
of biomass. For the execution of the experiments, except
where an increase of flow was monitored as a
disturbance, the flow rate was kept constant. Before,
during and after the SYTO 9 staining procedure, a field
of view near the flow cell outlet was monitored
constantly by CLSM. An increase of cell detachment
due to this treatment could not be detected. This
indicated that biofilm instability was not caused by the
SYTO 9 staining operation at least for the duration of
the experiments. Following this period, the disturbance
(changes in ionic strength, flow, or laponite introduc-
tion) was applied and the event was recorded in real time
using CLSM.
4. Results
4.1. Mobility of P. aeruginosa SG81 and laponite in sand
columns and flow cells
Collision efficiencies for bacteria and laponite were
calculated using deposition rate constants extracted
from the BTCs obtained from both the CLSM method
and the sand columns method (Fig. 2). Relevant column
characteristics are summarised in Table 1. In the absence
of electrolyte or at low concentrations i.e. 6� 10�4 M
NaCl, laponite was highly mobile (collision efficiencies
of 0.0370.01). As electrolyte concentration increased,
the transport of laponite through sand columns
and sand-packed flow cells was greatly affected
(Figs. 2 and 3A). At high laponite (2000 mg L�1) and
electrolyte concentrations (7� 10�2 M NaCl) the clay
was highly aggregated and gelation occurred on the
surfaces of sand grains (Fig. 3C). At low laponite
(20 mg L�1) concentrations but high electrolyte concen-
trations laponite was still retained inside the porous
material.
Bacteria were in general less mobile with lowest
collision efficiency of 0.07 (70.03) at 1� 10�3 M NaCl
but still showed mobility in sand columns at concentra-
tions up to 1 M NaCl (Fig. 3B). In flow cells (Fig. 2B),
despite a similar trend, bacteria were less mobile. Most
of the retained bacteria could be found in the portion of
the sand-packed flow cell closest to the inlet for all three
ARTICLE IN PRESS
0 21 3 40
0.2
0.4
0.6
0.8
1.0 Laponite + 6.2 x 10⁻⁴ M NaCl Laponite + 2.5 x 10⁻³ M NaCl Laponite + 1.0 x 10⁻² M NaCl
C/C
0
Pore volumes
Pore volumes
0 21 3
0.1
0.2
0.3
Bacteria + 1M NaCl
Bacteria + 1.4 x 10⁻¹ M NaCl
0
C/C
0
(A)
(B)
(C)
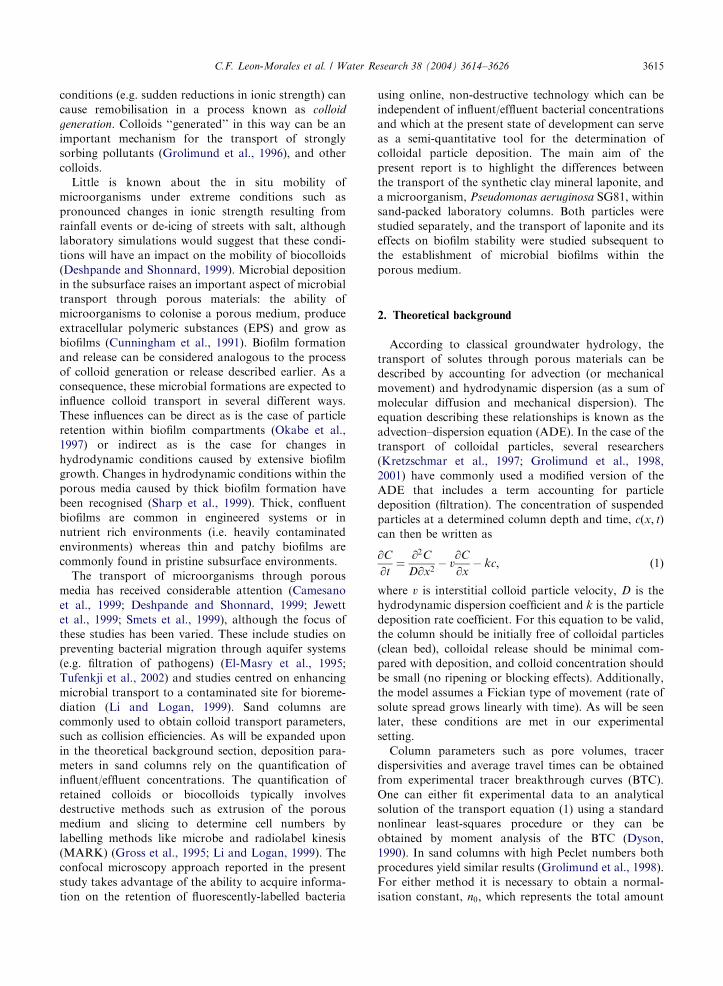
Fig. 3. (A) Laponite and (B) bacterial transport profiles through non-inoculated sand columns as a function of salt concentration, (C)
clean F34 quartz sand (left) and sand coated with laponite (2000 mg L�1). The laponite was retained as a gel-like substance at elevated
ionic strength (7� 10�2 M).
C.F. Leon-Morales et al. / Water Research 38 (2004) 3614–36263620
ionic strengths, again shown by confocal microscopy;
this was especially apparent in the case of the 1 M NaCl
solution (data not shown).
Following deposition within the porous medium, both
the bacterium and the clay colloid could be partially re-
mobilised by depleting the ionic strength (Figs. 4A, 4B
and 5) or by sudden increases in flow rate. After
attachment to the substratum, the cells grew to form
patchy, localised biofilms (Fig. 6). The response of the P.
aeruginosa SG81 biofilms to physicochemical alterations
such as an incremental increase in flow rate or a
lowering of ionic strength was characterised by increased
cell detachment which could be visualised using confocal
microscopy (Fig. 5).
4.2. Interactions between laponite and P. aeruginosa
SG81: enhanced colloidal mobility
A pulse of laponite through biofilm-colonised sand
columns at low ionic strength (6.2� 10�4 M) followed
by a corresponding ionic strength reduction of the
influent resulted in an altered pattern of elution (Fig. 7B)
as compared with the elution through sterile columns
(Fig. 3A). Elution of laponite through biofilm-colonised
sand columns at an ionic strength which caused its
retention in sterile columns resulted in the enhanced
detachment of bacterial cells (Fig. 8). This detachment
event was proportional to laponite concentration and
therefore to laponite aggregation state. This effect was

ARTICLE IN PRESS
0 2 3 40
1x10⁷
2x10⁷
3x10⁷
4x10⁷
5x10⁷
6x10⁷
7x10⁷
8x10⁷
9x10⁷
1x10⁸
cells
mL-1
Pore volumes
TCC
0.1
0.2
0.3
0.4
0.5
0.6
0.7
0
A24
0
Absorbance units
0 4 8 10 12
0
0.02
0.04
0.06
0.08
0.10
0.12
0.14
A24
0
Pore volumes
1
2 6
(A)
(B)
Fig. 4. (A) Release of biofilm cells after a sudden change in ionic strength from 7� 10�2 M NaCl to deionised water, (B) re-
mobilisation of the laponite trapped in the sand columns after a change in ionic strength similar to ‘‘A’’. The arrow indicates the time
point at which the ionic strength was reduced.
C.F. Leon-Morales et al. / Water Research 38 (2004) 3614–3626 3621
similar to effects observed with other types of dis-
turbances, such as a depletion in ionic strength or a
sudden increase in flow rate.
5. Discussion
5.1. Transport characteristics of P. aeruginosa SG81 and
laponite RD through quartz sand
The study of the movement of colloids in isolation
shows that regardless of the nature of the colloidal
particle (bacteria, laponite) transport parameters follow
predictable patterns in terms of aggregation and
deposition at different ionic strengths. Even though
bacterial collision efficiencies were generally higher than
those of laponite, the bacterium was mobile over a wider
range of ionic strengths as compared to laponite, the
latter of which was more drastically affected by
relatively small changes in ionic strength. Highly
aggregated laponite suspensions (2000 mg L�1) were
retained in the porous medium with the influence of
clogging effects as observed by CLSM. Smaller aggre-
gates (20 mg L�1) were also retained inside clean bed
sand columns at high ionic strengths. These facts and the
mobility patterns observed indicate that the transport of
laponite is determined almost exclusively by electrostatic
interactions. In contrast, the transport of the bacterium

ARTICLE IN PRESS
Fig. 5. Confocal laser micrographs showing direct evidence for the detachment event observed indirectly in Fig. 4. The cells were
labelled with the DNA-binding stain SYTO 9. The micrographs belong to a 30 s interval time-series begun when a high ionic strength
flow cell influent (7� 10�2 M NaCl) was changed to deionised water. Light areas correspond to fluorescent SYTO 9 –labelled bacteria;
dark regions include the non-fluorescent regions of the sand grains and the surrounding interstitial solution.
Fig. 6. (A) Scanning electron micrograph showing the surface
of a sand grain (200 mm approx. diameter) with generally sparse
bacterial colonisation as suggested by EDX analysis, (B)
Region of bacterial colonisation on quartz sand. A bacterial
microcolony (enlargement from (A)) composed of several cells
and their extracellular polymer matrix is evident.
C.F. Leon-Morales et al. / Water Research 38 (2004) 3614–36263622
probably depends on other factors as well including
surface heterogeneities and the production of extracel-
lular polymeric substances.
Transport parameters obtained using the CLSM
method were equivalent to those obtained using sand
columns. This demonstrates that the method, even
though still under active development in our laboratory,
can be adequate for colloid transport studies. Although
the information provided by 2D image stacks was
sufficient to semi-quantitatively determine transport
parameters under carefully controlled conditions, the
method is expected to provide more detailed informa-
tion when more complete 3D image stacks are available.
The impediments to obtaining these types of images at
the moment are the impossibility to penetrate through
an opaque substratum such as sand grains and the
higher processing speed needed. This limits observations
to the first layer of sand grains and 100–200 mm from the
interface between sand grains and the flow cell wall to
the centre of the packed flow cell. One way of addressing
these limitations is the use of transparent materials in
ARTICLE IN PRESS
0 1 2 3 4 5 6 7 8
0.05
0.10
0.15
0.20
0.25
0.30
Abs
orba
nce
units
Pore volumes
0 1 2 3 4 5 6 7 8
Pore volumes
A535
5x10⁸
4x10⁸
3x10⁸
2x10⁸
1x10⁸
0
5x10⁸
4x10⁸
3x10⁸
2x10⁸
1x10⁸
0
cells
A535
cells
cel
ls.m
L-1 c
ells
.mL-1
0.05
0.10
0.15
0.20
0.25
0.30
Abs
orba
nce
units
(A)
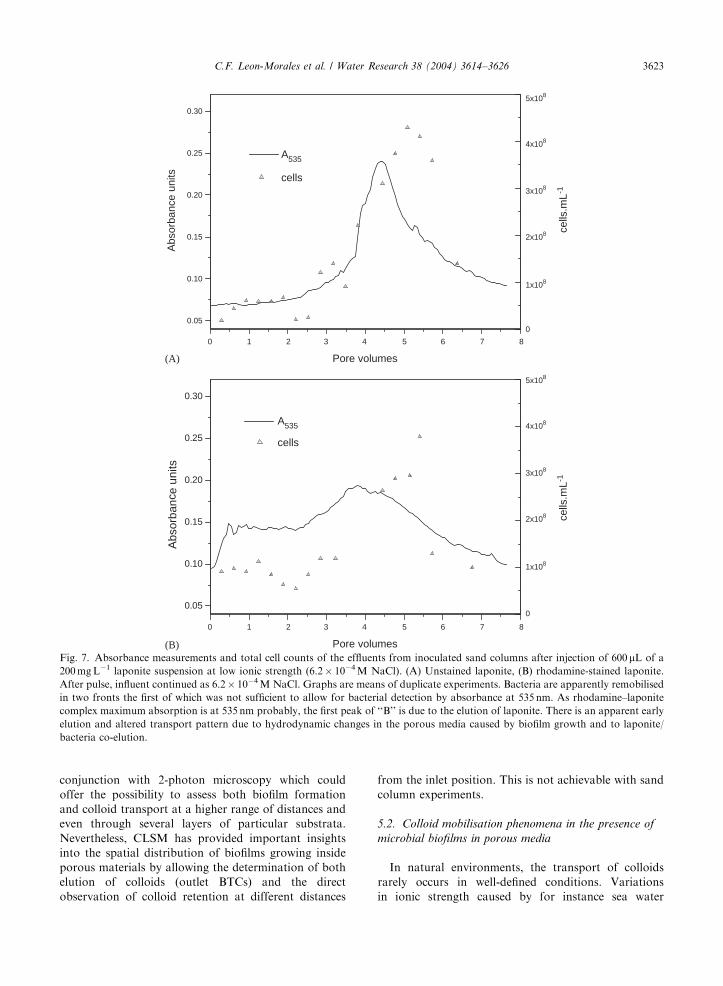
(B)Fig. 7. Absorbance measurements and total cell counts of the effluents from inoculated sand columns after injection of 600 mL of a
200 mg L�1 laponite suspension at low ionic strength (6.2� 10�4 M NaCl). (A) Unstained laponite, (B) rhodamine-stained laponite.
After pulse, influent continued as 6.2� 10�4 M NaCl. Graphs are means of duplicate experiments. Bacteria are apparently remobilised
in two fronts the first of which was not sufficient to allow for bacterial detection by absorbance at 535 nm. As rhodamine–laponite
complex maximum absorption is at 535 nm probably, the first peak of ‘‘B’’ is due to the elution of laponite. There is an apparent early
elution and altered transport pattern due to hydrodynamic changes in the porous media caused by biofilm growth and to laponite/
bacteria co-elution.
C.F. Leon-Morales et al. / Water Research 38 (2004) 3614–3626 3623
conjunction with 2-photon microscopy which could
offer the possibility to assess both biofilm formation
and colloid transport at a higher range of distances and
even through several layers of particular substrata.
Nevertheless, CLSM has provided important insights
into the spatial distribution of biofilms growing inside
porous materials by allowing the determination of both
elution of colloids (outlet BTCs) and the direct
observation of colloid retention at different distances
from the inlet position. This is not achievable with sand
column experiments.
5.2. Colloid mobilisation phenomena in the presence of
microbial biofilms in porous media
In natural environments, the transport of colloids
rarely occurs in well-defined conditions. Variations
in ionic strength caused by for instance sea water

ARTICLE IN PRESS
1 3 50
0.05
0.10
0.15
0.20
0.25
0.30
A24
0
0
8.0x10⁷
7.0x10⁷
6.0x10⁷
5.0x10⁷
4.0x10⁷
3.0x10⁷
2.0x10⁷
1.0x10⁷
TCC
cel
ls m
L-1
sterile column (A240)
Pore volumes
biofilm growing column (A240)
0
1
2
3
4
5
6
7
8
pH
pH
2 4 6 7
Fig. 8. Column effluent after the introduction of 2000 mg L�1 laponite dispersed in 7� 10�2 M NaCl. Note the retention of a similar
laponite suspension in control (biofilm-free) columns (empty triangles). Results were obtained from duplicate experiments.
C.F. Leon-Morales et al. / Water Research 38 (2004) 3614–36263624
infiltration, torrential rain or de-icing will cause the
mobilisation or retention of a great variety of colloidal
particles. Clean bed transport studies are useful for
determining fundamental transport parameters in con-
trolled laboratory conditions. They fail, however to fully
describe transport in more complex environments. As
observed, bacteria have the ability to attach to surfaces,
stimulated by physicochemical factors which will also
stimulate the attachment of other colloidal particles
including inorganic colloids (Deshpande and Shonnard,
1999). They also are remobilised by similar physicho-
chemical factors causing detachment or release of other
colloids. As a consequence, bacterial biofilms growing in
porous materials are extremely dynamic (Figs. 4A, 5 and
8). Their influence on colloid and therefore contaminant
transport is expected to be composed of several additive
effects including changes in porous medium hydrody-
namics, sorption to biofilm components and co-elution
with re-mobilised biofilm elements. In this study, the
main challenge in studying colloid–colloid and biofilm–
colloid influences on their mutual transport through
sand columns under stimulated mobility conditions (i.e.
low ionic strength) was to setup an appropriate
detection system. One would expect that all species will
contribute to the absorption measurements; however, as
observed in Fig. 7 and as evidenced in other experiments
(data not shown), bacterial absorbance at 535 nm would
be negligible until their concentration reaches more than
1.5� 108 cells mL�1. As conditions changed, i.e. laponite
pulse and reduction in subsequent influent ionic
strength, bacteria were remobilised mainly after the
elution of laponite (Fig. 7A, B) was complete. The first
front of bacterial detachment in this case was not
sufficient to produce a measurable alteration in absor-
bance at 535 nm. In fact, the spectrometric monitoring
of bacteria is usually done at 240–280 nm. According to
Fig. 7B there is an alteration of laponite elution profile
(early breakthrough and tailing) due probably to a
reduction in the porous medium permeability (increased
particle velocity), bacterial co-elution and NaCl hydro-
dynamic dispersion. Laponite/bacteria co-elution could
be the result of direct interactions between laponite and
cells or cellular products such as polysaccharides. Clays
are known to interact strongly with polysaccharides as
reviewed by Chenu and Stotzky (2002), and polysac-
charides are quantitatively important components of the
extracellular biofilm matrix.
The introduction of laponite at an ionic strength and
concentration which would stimulate its aggregation and
retention in sand columns (Fig. 8) was able to stimulate
remobilisation of P. aeruginosa SG81 under conditions
in which retention would generally be favourable. The
influence of laponite on cellular detachment could be
due to indirect interactions caused by changes of the
hydrodynamic conditions inside the porous medium,
leading to increased shear forces—and therefore to cell
detachment. Even though pH variations were apparent
as the laponite was being eluted (Fig. 8), it is very
unlikely that changes of this magnitude (less than 2 pH
units) could have influenced the detachment of cells
(Jewett et al., 1995).
6. Conclusions
* Confocal microscopy was shown to be suitable
for online monitoring of fluorescently labelled
microorganisms and inorganic colloidal particles in

ARTICLE IN PRESSC.F. Leon-Morales et al. / Water Research 38 (2004) 3614–3626 3625
a sand-packed flow cell. This allowed the determina-
tion of deposition and transport characteristics of P.
aeruginosa SG81 and laponite RD as a function of
ionic strength and the qualitative determination of
colloidal retention inside the porous medium in a
non-destructive manner.* In clean bed columns, the mobility of laponite was
strongly influenced by ionic strength. Mobility was
inversely correlated to NaCl concentration; NaCl
concentrations of 1� 10�2 M resulted in almost
complete laponite retention within the sand columns.* Mobility of P. aeruginosa SG81 was reduced
predictably by NaCl concentrations up to 1 M. This
effect was not as pronounced as for laponite, and
some bacteria were still eluted under these condi-
tions.* At high relative ionic strength conditions
(7� 10�2 M), introduction of laponite to a sand
column containing a primary biofilm of P. aeruginosa
SG81 resulted in remobilisation of a portion of the
attached cells, as indicated by effluent cell numbers.
Low ionic strength (6.2� 10�4 M NaCl) caused
detachment of biofilm cells, but also an altered
laponite elution profile due to co-elution or hydro-
dynamic effects.* Environmental events leading to significant changes
in ionic strength of the subsurface matrix will cause
significant changes to the mobility of microorgan-
isms, inorganic colloids, and colloid-borne contami-
nants. These events include rainfall, melting snow or
ice containing dispersing salt, seawater infiltration,
and tidal processes at estuaries.
Acknowledgements
This work forms part of the cooperative research
project ‘‘KORESI’’-Kolloide Stofftransport bei der
Regenwassersickerung-financed by the German Re-
search Society (DFG). We thank Professors U. For-
stner, F.H. Frimmel and P.A. Wilderer, and their staff,
for constructive input and criticisms. The assistance of
Mariel Grooters is gratefully acknowledged.
References
Camesano, T., Unice, K., Logan, B., 1999. Blocking and
ripening of colloids in porous media and their implications
for bacterial transport. Coll. Surf. A: Physicochem. Eng.
Aspects 160, 291–308.
Chenu, C., Stotzky, G., 2002. Interactions between micro-
organisms and soil particles: an overview. In: Huang, P.M.,
Bollag, J.M., Senesi, N. (Eds.), Interactions Between Soil
Particles and Microorganisms. Wiley, New York, pp. 3–40.
Cunningham, A., Characklis, W., Abedeen, F., Crawford, D.,
1991. Influence of biofilm accumulation on porous media
hydrodynamics. Environ. Sci. Technol. 25, 1305–1311.
Deshpande, P., Shonnard, D., 1999. Modeling the effects of
systematic variation in ionic strength on the attachment
kinetics of Pseudomonas fluorescens UPER-1 in saturated
sand columns. Water Resour. Res. 35, 1619–1627.
Dyson, N., 1990. Statistical moments of a chromatographic
peak. In: Smith, R. (Ed.), Chromatographic Integration
Methods. The Royal Society of Chemistry, Cambridge,
pp. 20–25.
El-Masry, M., Hassouna, M., El-Rakshy, N., Mousa, I., 1995.
Bacterial populations in the biofilm and non-biofilm
components of a sand filter used in water treatment. FEMS
Microbiol. Lett. 131, 263–269.
Grobe, S., Wingender, J., Truper, H., 1995. Characterization of
mucoid Pseudomonas aeruginosa strains isolated from
technical water systems. J. Appl. Bacteriol. 79, 94–102.
Grolimund, D., Borkovec, M., Bartmettler, K., Sticher, H.,
1996. Colloid-facilitated transport of strongly sorbing
contaminants in natural porous media: a laboratory column
study. Environ. Sci. Technol. 30, 3118–3123.
Grolimund, D., Elimelech, M., Borkovec, M., Barmettler, K.,
Kretzschmar, R., Sticher, H., 1998. Transport of in situ
mobilized colloidal particles in packed soil columns.
Environ. Sci. Technol. 32, 3562–3569.
Grolimund, D., Elimelech, M., Borkovec, M., 2001. Aggrega-
tion and deposition kinetics of mobile colloidal particles in
natural porous media. Coll. Surf. A: Physicochem. Eng.
Aspects 191, 179–188.
Gross, M., Albinger, O., Jewett, D., Logan, B., Bales, R.,
Arnold, R., 1995. Measurement of bacterial collision
efficiencies in porous media. Water Res. 29, 1151–1158.
Jewett, D., Hilbert, T., Logan, B., Arnold, R., Bales, R., 1995.
Bacterial transport in laboratory columns and filters:
influence of ionic strength and pH on collision efficiency.
Water Res. 29, 1673–1680.
Jewett, D., Logan, B., Arnold, R., Bales, R., 1999. Transport of
Pseudomonas fluorescens strain P 17 through quartz sand
columns as a function of water content. J. Contam. Hydrol.
36, 73–89.
Kersting, A., Efurd, D., Finnegan, D., Rokop, D., Smith, D.,
Thompson, J.L., 1999. Migration of plutonium in ground
water at the Nevada test site. Nature 397, 56–59.
Kretzschmar, R., Barmettler, K., Grolimund, D., Yan, Y.,
Borkovec, M., Sticher, H., 1997. Experimental deter-
mination of colloid deposition rates and collision efficien-
cies in natural porous media. Water Resour. Res. 33,
1129–1137.
Li, Q., Logan, B., 1999. Enhancing bacterial transport for
bioaugmentation of aquifers using low ionic strength
solutions and surfactants. Water Res. 33, 1090–1100.
Lopez Arbeloa, F., Tapia Estevez, M., Lopez Arbeloa, T.,
Lopez Arbeloa, I., 1996. Spectroscopic study of the
adsorption of rhodamine 6G on clay minerals in aqueous
suspensions. Clay Miner. 32, 97–106.
McCarthy, J., Zachara, J., 1989. Subsurface transport of
contaminants. Environ. Sci. Technol. 23, 496–502.
Nicolai, T., Cocard, S., 2001. Dynamic light-scattering study of
aggregating and gelling colloidal disks. J. Coll. Int. Sci. 244,
51–57.

ARTICLE IN PRESSC.F. Leon-Morales et al. / Water Research 38 (2004) 3614–36263626
Okabe, S., Yasuda, T., Watanabe, Y., 1997. Uptake and release
of inert fluorescent particles by mixed populations biofilms.
Biotechnol. Bioeng. 53, 459–469.
Roy, S., Dzomak, D., 1997. Chemical factors influencing
colloid-facilitated transport of contaminants in porous
media. Environ. Sci. Technol. 31, 656–664.
Ryan, J., Elimelech, M., 1996. Colloid mobilization and
transport in groundwater. Coll. Surf. A: Physicochem.
Eng. Aspects 107, 1–56.
Sharp, R., Cunningham, A., Komlos, J., Billmayer, J., 1999.
Observation of thick biofilm accumulation and struc-
ture in porous media and corresponding hydrodynamic
and mass transfer effects. Water Sci. Technol. 39,
195–201.
Smets, B., Grasso, D., Engwall, M., Machinist, B.J., 1999.
Surface physicochemical properties of Pseudomonas fluor-
escens and impact on adhesion and transport through
porous media. Coll. Surf. B: Biointerfaces 14, 121–139.
Tapia Estevez, M., Lopez Arbeloa, F., Lopez Arbeloa, T.,
Lopez Arbeloa, I., Schoonheydt, R., 1993. Spectroscopic
study of the adsorption of rhodamine 6G on laponite B for
low loadings. Clay Miner. 29, 105–113.
Tufenkji, N., Ryan, J., Elimelech, M., 2002. Bank filtration.
Environ. Sci. Technol. 1, 423A–428A.