interaction of a planar shock wave with a dense particle curtain: modeling and experiments
TRANSCRIPT

Interaction of a planar shock wave with a dense particle curtain: Modeling andexperimentsY. Ling, J. L. Wagner, S. J. Beresh, S. P. Kearney, and S. Balachandar
Citation: Physics of Fluids (1994-present) 24, 113301 (2012); doi: 10.1063/1.4768815 View online: http://dx.doi.org/10.1063/1.4768815 View Table of Contents: http://scitation.aip.org/content/aip/journal/pof2/24/11?ver=pdfcov Published by the AIP Publishing Articles you may be interested in Hydrodynamic particle focusing design using fluid-particle interactiona) Biomicrofluidics 7, 054104 (2013); 10.1063/1.4821170 Propagation of hydrodynamic interactions between particles in a compressible fluid Phys. Fluids 25, 046101 (2013); 10.1063/1.4802038 Dense shearing flows of inelastic disks Phys. Fluids 18, 103307 (2006); 10.1063/1.2364168 Interaction of small perturbations with shock waves Phys. Fluids 16, 4489 (2004); 10.1063/1.1810181 First principles calculations of the interaction of blast waves with aqueous foams AIP Conf. Proc. 505, 779 (2000); 10.1063/1.1303588
This article is copyrighted as indicated in the article. Reuse of AIP content is subject to the terms at: http://scitation.aip.org/termsconditions. Downloaded to IP:
67.79.216.66 On: Tue, 08 Apr 2014 06:28:25

PHYSICS OF FLUIDS 24, 113301 (2012)
Interaction of a planar shock wave with a dense particlecurtain: Modeling and experiments
Y. Ling,1,a) J. L. Wagner,2 S. J. Beresh,2 S. P. Kearney,2 and S. Balachandar1
1Department of Mechanical and Aerospace Engineering, University of Florida, Gainesville,Florida 32611, USA2Sandia National Laboratories, Albuquerque, New Mexico 87185, USA
(Received 4 April 2012; accepted 29 October 2012; published online 30 November 2012)
The interaction of a planar shock wave with a dense particle curtain is investigatedthrough modeling and experiments. The physics in the interaction between a shockwave with a dense gas-particle mixture is markedly differently from that with a dilutemixture. Following the passage of the shock wave, the dense particle curtain expandsrapidly as it propagates downstream and pressures equilibrate throughout the flowfield. In the simulations, the particles are viewed as point-particles and are tracedin a Lagrangian framework. A physics-based model is then developed to accountfor interphase coupling. Compared to the standard drag law, four major improve-ments are made in the present interphase coupling model to take into account: (1)unsteady force contributions to particle force; (2) effect of compressibility on hy-drodynamic forces; (3) effect of particle volume fraction on hydrodynamic forces;(4) effect of inter-particle collision. The complex behavior of the dense particlecurtain is due to the interplay between two-way coupling, finite particle inertia, andunsteady forces. Incorporation of these effects through significant modeling improve-ments is essential for the simulation results to agree well with the experimental data.As a result of the large pressure gradient inside the particle curtain, the unsteadyforces remain significant for a long time compared to the quasi-steady force andgreatly influence the particle curtain motion. C© 2012 American Institute of Physics.[http://dx.doi.org/10.1063/1.4768815]
I. INTRODUCTION
Shock interaction with a single isolated particle has been extensively studied previously.1–6
In many typical applications, shock waves interact with a cloud or dispersion of particles. Theknowledge and modeling techniques developed for an isolated particle are suitable for dilute particle-laden flows (i.e., with negligible particle volume fraction), but cannot be applied directly in denseparticle-laden flows (i.e., with finite particle volume fraction). With increasing particle volumefraction, the existence of neighboring particles further complicates the interaction between shockwaves and particles. In these situations, the inter-particle interactions, the interactions betweenparticles and the wakes of neighboring particles, and the interactions between particles and thereflected or diffracted waves from neighboring particles become important.7, 8
The scales of primary interest in practical applications of shock-particle interaction are typicallyof the order of the size of the physical system, and as a result are much larger than the size of anindividual particle. Therefore, instead of resolving flows at the particle scale, the point-particleapproach (PPA), where particles are treated as point masses, is often used in multiphase flowmodeling.9 Since flow at the particle scale is not resolved in PPA, coupling between gas andparticles is represented by the hydrodynamic force and heat transfer models.
a)Author to whom correspondence should be addressed. Electronic mail: [email protected].
1070-6631/2012/24(11)/113301/30/$30.00 C©2012 American Institute of Physics24, 113301-1
This article is copyrighted as indicated in the article. Reuse of AIP content is subject to the terms at: http://scitation.aip.org/termsconditions. Downloaded to IP:
67.79.216.66 On: Tue, 08 Apr 2014 06:28:25

113301-2 Ling et al. Phys. Fluids 24, 113301 (2012)
Although the focus of the present paper is on the dense particle-laden flow regime, it is helpfulto first briefly review the state of the art of the modeling of force and heat transfer for an isolatedparticle. In the case of an isolated particle in incompressible flows, the overall hydrodynamic forcecan be divided into physically meaningful contributions: the quasi-steady force Fqs , the pressure-gradient force Fpg , the added-mass force Fam , and the viscous-unsteady force Fvu , often calledBasset history force (see Maxey and Riley10 and Gatignol11). The Maxey-Riley-Gatignol (MRG)equation of motion was recently extended to compressible flows by Parmar et al.12, 13 The resultingequation of motion is asymptotically valid in the limit of small Reynolds and Mach numbers.Nevertheless, it provides a theoretical basis for empirical extensions to finite Reynolds and Machnumbers. Such empirical extensions have been proposed for both incompressible and compressibleflows by Magnaudet and Eames14 and Ling et al.6 For example, in compressible flows, the quasi-steady drag depends on both the Reynolds and Mach numbers (defined based on particle size andrelative velocity). Accurate empirical relations for the quasi-steady drag have been proposed byHenderson,15 Loth,16 and Parmar et al.,17 which have been tested against the detailed experimentalmeasurements of Jourdan et al.18
In compressible flows, interaction of particles with compressible flow features, such as shockwaves and expansion fans take particular importance. Ling et al.6, 19 has recently emphasized theimportance of unsteady forces in accurately predicting the peak forces and sustained motion ofparticles subjected to shock waves for varied particle diameter, density, and shock Mach number.The overall effects of the unsteady forces on the particle motion are most significant when the particle-to-gas density ratio is small. The particle Mach number dependence of the inviscid-unsteady forcehas been addressed by Parmar et al.20 The viscous-unsteady force will depend on both particleReynolds and Mach numbers. However, this dependence can be expected to be quite complex, basedon our understanding of the Basset history force in the incompressible flow regime. A compositefinite Reynolds and Mach numbers extension to the force model has been proposed by Parmar et al.5
and validated by comparing with experiments on shock-particle interaction by Sun et al.2 and Britanet al.21
The above interphase coupling modeling efforts are at the level of an isolated particle andtherefore are appropriate in the limit of small volume fraction. When the particle volume fractionin a particle-laden flow increases, the neighboring particles will influence the flow around eachparticle. A particle can interact with neighboring particles’ wakes, and with reflected and diffractedshock and expansion waves. As a result, the particle volume fraction will influence the momentumexchange between a particle and its surrounding gas and must therefore be accounted for in theforce and heat transfer modeling. In incompressible flows, the effect of particle volume fractionon the quasi-steady force has been studied by Sangani et al.,22 Wen and Yu,23 Di Felice,24 andTenneti et al.25 among others. A review of the quasi-steady drag law for dense particle-laden flowcan be found in Li and Kuipers.26 The effect of particle volume fraction on the added-mass andviscous-unsteady forces has been studied by Sangani et al.22 The corresponding effect of volumefraction on the quasi-steady heat transfer has been studied by Gunn.27 Comprehensive force andheat transfer models for compressible particle-laden flows with finite particle volume fraction aregenerally absent in the literature.28 Following the approach pursued in the context of an isolatedparticle, it seems natural to investigate and incorporate the volume fraction effect on each of theforce contributions independently. In this paper, we will extend the compressible force model ofLing et al.6 to finite particle volume fraction regime.
The models of hydrodynamic forces and heat transfer only take into account gas-particleinteraction. When particle volume fraction is sufficiently large, inter-particle interactions, such asparticle collisions, must be considered as well. In incompressible flows, particle collision can bemodeled by an isotropic inter-particle stress.29–32 The particle stress model of Harris and Crighton29
will be applied to the present problem and its ability on capturing inter-particle interaction incompressible flows will be examined by comparing with experimental data.
Recent experiments by Wagner et al.33 examined the interaction of a planar shock wave with adense particle curtain. A multiphase shock tube was used to drive a planar shock wave into a particlecurtain, i.e., a dense particle field that was generated with a gravity-fed contoured seeding method.The initial volume fraction of particles in the mixture was about 20%. High-speed imaging and
This article is copyrighted as indicated in the article. Reuse of AIP content is subject to the terms at: http://scitation.aip.org/termsconditions. Downloaded to IP:
67.79.216.66 On: Tue, 08 Apr 2014 06:28:25

113301-3 Ling et al. Phys. Fluids 24, 113301 (2012)
pressure measurements showed that the interaction between the incident shock and the particle curtainresulted in an upstream-propagating reflected shock and a downstream-propagating transmittedshock. After the passage of the shock wave, the particle curtain was observed to spread rapidly asit propagated downstream. The data suggested the expansion of the particle curtain to be associatedwith a difference in gas properties across the streamwise thickness of the particle curtain, althoughthe exact physical mechanisms remained unclear.
In this study, new experimental data from the multiphase shock tube are presented to quantifythe compressible particle-laden flow arising from the interaction of a planar shock wave with adense particle curtain. The experimental conditions are then simulated to investigate the underlyingphysics of shock-particle-curtain interaction and to validate the present compressible particle-ladenflow model. For the 20% particle volume fraction, we expect the effect of particle volume fractionon the hydrodynamic forces to be significant. The quasi-steady force models for finite particlevolume fraction in incompressible flow regime, such as those by Wen and Yu,23 Sangani et al.,22 andDi Felice,24 will be extended to compressible flow regime and their accuracy will be evaluated. Wewill also evaluate the importance of unsteady forces and use the analytical result of Sangani et al.22
to account for the effect of volume fraction on the inviscid-unsteady forces. Since the initial particlevolume fraction is sufficiently lower than the close packing limit and the particle volume fraction ingeneral decreases over time as the particle curtain spreads, the inter-particle interaction force may beexpected to be of secondary importance compared to the hydrodynamic forces. Nevertheless, as willbe shown in Sec. VI, the inter-particle interaction force plays an important role and must be takeninto account in order to obtain accurate prediction of the expansion of the particle curtain. Comparedto the previous modeling efforts for the interphase coupling in shock interaction with particles, suchas those by Boiko et al.34 and Rogue et al.,35 the present particle hydrodynamic force model is basedupon rigorous theoretical formulation in the zero Reynolds and Mach numbers limit, which separatesthe overall force into various physically meaningful contributions. In this model, the effects of finiteparticle Reynolds and Mach numbers and particle volume fraction on each of these contributions canbe taken into account individually. Since shock-particle interaction is inherently highly unsteady, itwill be shown in later results that unsteady forces play an important role and have to be included inorder to capture the interaction between the shock wave and the dense particle curtain. However, theunsteady forces have been traditionally ignored in the modeling of shock-particle interaction.34, 35
The overarching goal of this paper is to investigate the interaction of a planar shock wave witha dense particle curtain through modeling and experiments. The compressible point-particle forcemodel of Ling et al.6 is extended to the dense particle-laden flow regime and applied to simulate thepresent problem. In Sec. II, we will first describe the problem setup in experiments and simulations.The physical model and governing equations will be shown in Sec. III. The numerical methodsadopted to solve the governing equations will be presented in Sec. IV. The simulation results anddetailed comparison with experimental data will be shown in Sec. V. Discussions on the importantcomponents of the present model will be presented in Sec. VI. Finally, we will draw conclusions inSec. VII.
II. PROBLEM SETUP
A. Experimental setup
Experiments were conducted in the recently constructed multiphase shock tube (MST) at SandiaNational Laboratories. A brief description of the facility is presented here and further details can befound in Wagner et al.33
The shock tube consists of a circular driver section and a square driven section that has internaldimensions of about 79 × 79 mm2. Burst disks act as the diaphragms that separate the driver gas,which is unheated nitrogen, from the driven gas, which is unheated air. Measurements have shownthat the incident shock is well planar upon arriving at the test section.
The MST uses gravity and a contoured slit geometry to introduce a dense field of particles intoits test section, which is shown in Fig. 1. As shown in Fig. 1, a cartesian coordinate system is definedfor convenience of description, i.e., the streamwise, spanwise, and vertical directions are denoted
This article is copyrighted as indicated in the article. Reuse of AIP content is subject to the terms at: http://scitation.aip.org/termsconditions. Downloaded to IP:
67.79.216.66 On: Tue, 08 Apr 2014 06:28:25

113301-4 Ling et al. Phys. Fluids 24, 113301 (2012)
Particlereservoir
XY
Z
Particle curtain
us
Incident shock
Air (p1,T1)
Air (p2,T2)
L
o
Gap
Gate valve
Ceiling slitinsert
Particlecurtainx
z
y
FIG. 1. Schematic of the MST test section. The incident shock is moving from left to right. The curtain occupies about 87%of the test section span (y direction).
as x, y, and z directions, respectively. The origin of the coordinate is located at the center of theupstream bottom edge of the initial particle curtain, as shown in Fig. 1. The particles are soda limeglass spheres with a diameter distribution of 106-125 μm. Prior to the rupture of the diaphragm, agate valve opens and the particles flow through a ceiling slit insert that shapes into what is denoteda “particle curtain.” The particle curtain occupies the entire vertical (z direction) height of the shocktube. The particles exit through a slit in the floor of the shock tube, and are essentially stationarywith respect to the shock-induced timescales. The streamwise thickness of the particle curtain Lnarrows from about 3 mm to 2 mm over the top 25% of the test section height. For the bottom 75%of its height, the particle curtain thickness is nearly constant with L remaining equal to about 2 mm.At the center of the constant L portion, the initial particle volume fraction is about 21%. Owing togravity, the volume fraction varies from about 26% at the top of constant L portion to about 15% atthe bottom of the particle curtain. Due to restrictions in the design of the test section, the particlecurtain occupies about 87% of the test section span (y direction). This results in three-dimensionaleffects, which will be discussed further in the results.
By driving a planar shock into the particle curtain, interactions are produced at three incidentshock Mach numbers Ms = 1.66, 1.92, and 2.02 by using diaphragms with different burst pressures.The initial driven pressures and temperature are about 82.7 kPa and 296.4 K, respectively. As shownin Fig. 2, the lengths of the driver and driven sections are 2.1 m and 4.17 m, respectively. Thetest section with the particle curtain is located 4.17 m downstream of the diaphragm. The time andlocation of experimental measurement and simulation are shown in the x-t diagram for Ms = 1.66. Itcan be seen that the data to be discussed here pertain only to the shock interaction with the particlecurtain, prior to the arrival of the reflected shock or the driver/driven gas contact surface.
B. Experimental diagnostics
To evaluate the present modeling effort, experimental data from high-speed schlieren images andfast-response pressure measurements are compared to the simulations. Details on both measurementsystems are given in the previous study.33
This article is copyrighted as indicated in the article. Reuse of AIP content is subject to the terms at: http://scitation.aip.org/termsconditions. Downloaded to IP:
67.79.216.66 On: Tue, 08 Apr 2014 06:28:25

113301-5 Ling et al. Phys. Fluids 24, 113301 (2012)
2.1 m 4.17 m
ParticlecurtainDriven sectionDriver section
5.7 m
t*
x*
Contact
ShockExpansionfan - head
12 ms
8.8 ms
6 ms7.3 ms
Experiment& simulationdiagnostic
domain
FIG. 2. Time and location of experimental measurement and simulation for Ms = 1.66. It is taken that t* = 0 at the burst ofthe diaphragm.
Fast-response pressure measurements were acquired upstream of the initial particle curtain atx = −68.6 mm (x/L = −34.3) and x = −99.5 mm (x/L = −49.8), where L = 2 mm, along theceiling of the shock tube at the spanwise center of the test section. Pressures were also measureddownstream of the initial particle curtain at x = 64.1 mm (x/L = 32.1). The downstream pressureswere measured both along the ceiling and the floor of the shock tube at a spanwise location ofy = 20 mm. Since the particle curtain geometry is more uniform for the bottom portion of theparticle curtain, the numerical results are compared to the pressure data achieved from the sensoron the floor of the shock tube. The pressure sensors are also used to determine shock crossing timesin order to generate experimental x-t data points.
The two high-speed schlieren imaging fields of view used in experiments are shown inFig. 3. The smaller image field (50 × 25 mm2) is acquired with an inter frame time of about7.7 μs, which is adequate to capture the wave structure associated with the interaction both upstreamand downstream of the initial curtain. The smaller field is used to determine shock positions as afunction of time to generate experimental x-t diagrams. The larger image field (100 × 64 mm2) isacquired with an inter frame time of about 24.4 μs and is used to measure the trajectories of theupstream and downstream fronts of the particle field over a streamwise distance of about 30L. Forboth image fields, the spatial resolution is about 0.2 mm/pixel.
The following method is used to determine the particle curtain edge trajectories from theschlieren images. As shown in the results, the particles appear in shadow resulting in zero intensitywithin the particle field. The upstream front position is defined to occur where the intensity decreases
Flow
x
z
FIG. 3. High-speed schlieren fields of view (dashed lines). The solid rectangle denotes the particle curtain. The smallerfield-of-view is used to measure the wave propagation during an interaction and the larger field-of-view is used to determinethe particle field edge trajectories.
This article is copyrighted as indicated in the article. Reuse of AIP content is subject to the terms at: http://scitation.aip.org/termsconditions. Downloaded to IP:
67.79.216.66 On: Tue, 08 Apr 2014 06:28:25
113301-6 Ling et al. Phys. Fluids 24, 113301 (2012)
to 5% of that in the particle-free background. Similarly, the downstream front position is defined tocoincide with the location where the intensity increases to 5% of the background. As the particleedges are not perfectly vertical, for each test, the edge positions are then averaged over the middle5 mm of the particle curtain in the vertical direction. The edge positions reported herein correspondto the mean of four tests each at all three incident shock Mach numbers. The dominant source ofuncertainty was shot-to-shot variations and the position uncertainty ranges presented correspond to95% confidence intervals.
C. Simulation setup
As the contact surface or the expansion fan (or its reflection) will not reach the test sectionduring the time of measurement (see Fig. 2), the expansion fan, the contact surface, and the drivergas are ignored in the simulations. The computational domain will only include a portion of theshock tube and thereby focus on the shock interaction with the particle curtain. Nevertheless, thecomputation domain is set to be long enough, so that the reflected and transmitted shock waves fromthe particle curtain will not reach the ends of the shock tube. In this case, the gas flow in the presentproblem can be characterized by the incident shock Mach number Ms, which is defined as
Ms = us/ag1 , (1)
and the pre-shock state in the driven section of the shock tube, i.e., pg1 , ρ
g1 . The incident shock
propagation speed is represented by us, where the subscript s denotes properties of the incidentshock. The initial (pre-shock) gas pressure, density, and speed of sound are denoted by pg
1 , ρg1 , and
ag1 , respectively. Since the driver gas is irrelevant to the interaction, the gas is taken to be air over
the entire computational domain at all time, with gas specific heat ratio γ = 1.4 and gas constantR = 287 J/(Kg K). The pre-shock conditions of the air are taken to be the same as experiments:pg
1 = 82.7 kPa, and T g1 = 296.4 K. Three incident shock Mach numbers Ms = 1.66, 1.92, and 2.02
are considered in simulations to compare with the experimental results.The key parameters of the particle phase are the particle diameter dp, density ρp, initial particle
volume fraction φp1 , and initial thickness of the particle curtain L. If the thermal evolution of the
particle phase is of interest, then the heat capacity of particle material Cp also needs to be considered.For soda lime particles, ρp = 2520 Kg/m3 and Cp = 840 J/(Kg K). Since in the experiments, L,φ
p1 , and dp vary slightly, the average values of which are used in the simulations to compare with
experiments (Sec. V B), i.e., dp = 115 μm, φp1 = 0.21, and L = 2.0 mm. Different values of dp, φ
p1 ,
and L will also be considered in Sec. V D to evaluate their effects. Among the parameters, L and us
are chosen as the typical length and velocity scales.
III. PHYSICAL MODELING AND GOVERNING EQUATIONS
A. Governing equations
To model the interaction between a planar shock and a dense particle curtain, we make thefollowing assumptions and approximations:
� The gas is taken to follow the ideal-gas law.� The gas motion can be regarded as inviscid, so that the fluid viscosity and conductivity are
neglected except in the interaction with the particles.� The particles are taken to be inert, rigid, and spherical. For the present shock strength and
particle material, particle deformation can be ignored.� The particles have constant heat capacity and uniform temperature distribution.� Particle collision is the dominant mechanism of inter-particle interaction. At the modest particle
volume fraction to be considered here, particle compaction can be ignored.� Inter-particle heat transfer due to particle collision is neglected.� The gas-particle flow is taken to be one-dimensional. Although three-dimensional effects exist
in the the experimental data, due to restrictions in the design of the multiphase shock tube, the
This article is copyrighted as indicated in the article. Reuse of AIP content is subject to the terms at: http://scitation.aip.org/termsconditions. Downloaded to IP:
67.79.216.66 On: Tue, 08 Apr 2014 06:28:25
113301-7 Ling et al. Phys. Fluids 24, 113301 (2012)
gas and particle motions remain nearly one-dimensional at the center of the shock tube. Wewill estimate the influence of edge effects on the experimental measurement.
The gas is treated as continuum and the governing equations are written in the Eulerian frame-work, while the particles are viewed as discrete point masses and tracked in the Lagrangian frame-work. The physical models and governing equations are expressed here in one-dimension, but theycan be readily extended to multi-dimensions. The governing equations for gas and particles are givenas
∂(ρgφg)
∂t+ ∂(ρgφgug)
∂x= 0 , (2)
∂(ρgφgug)
∂t+ ∂(ρgφgugug)
∂x− ∂pg
∂x= − 1
Vcell
∑i
Ncp F gpi , (3)
∂(ρgφg Eg)
∂t+ ∂(ρgφgug Eg)
∂x− ∂(pgug)
∂x= − 1
Vcell
∑i
Ncp(Ggpi + Qgp
i ) , (4)
and
dx pi
dt= u p
i , (5)
m pi
du pi
dt= F gp
i + F ppi , (6)
m pi C p
i
dT pi
dt= Qgp
i . (7)
The superscripts g and p denote properties associated with the gas and particles, respectively.The gas variables, ρg, φg, ug, pg, and Eg represent the density, volume fraction, velocity, pressure,total energy, and total enthalpy of gas. The ideal-gas law is assumed to apply, i.e.,
pg = (γ − 1)ρg
[Eg − 1
2(ug)2
]. (8)
The position, velocity, temperature, mass, and heat capacity of the ith particle are denoted byx p
i , u pi , T p
i , m pi , and C p
i . It should be noted that the term “particle” used in the simulations denotesa computational particle. A computational particle represents multiple physical particles that arelocated in a thin layer around the cross section x p
i at t = 0. The number of physical particlesrepresented by a computational particle is denoted by Ncp. In the present study, Ncp is the same forevery computational particle and it is taken to be a constant during the entire duration of simulation.Therefore, Ncp can be computed by dividing the total number physical particles in the curtain by thenumber of computational particles used. Since the particles in the curtain are initially uniform inx-direction, the computational particles are initially uniformly distributed along the x-direction.
The overall hydrodynamic force and heat transfer exerted on the ith particle through interactionwith the surrounding gas are represented by F gp
i and Qgpi . Due to Newton’s third law, F gp
i andQgp
i need to be subtracted from gas Eqs. (3) and (4), and account for the two-way coupling effect.In Eq. (4), Ggp
i corresponds to the kinetic and internal energies transferred to the fluid due to thehydrodynamic force F gp
i . In Eqs. (3) and (4),∑
i represents sum over all the particles around thecenter of a cell and Vcell denotes the cell volume. Details about the calculation of
∑i will be presented
in Sec. IV. The force exerted on the ith particle due to inter-particle (particle-particle) interaction isdenoted as F pp
i .
This article is copyrighted as indicated in the article. Reuse of AIP content is subject to the terms at: http://scitation.aip.org/termsconditions. Downloaded to IP:
67.79.216.66 On: Tue, 08 Apr 2014 06:28:25

113301-8 Ling et al. Phys. Fluids 24, 113301 (2012)
B. Modeling of inter-phase coupling
The models of the forces due to gas-particle and inter-particle interactions are given below. Moredetails about the gas-particle interaction force model can be found in Appendix A. The modeling ofheat transfer due to gas-particle interaction is presented in Appendix B.
1. Modeling of force due to gas-particle interaction
Following the previous works by Parmar et al.12, 13 and Ling et al.,6, 19 the overall hydrodynamicforce F gp
i is expressed as the sum of individual contributions,
F gpi = Fqs,i + Fpg,i + Fam,i + Fvu,i , (9)
where Fqs, i, Fpg, i, Fam, i, and Fvu,i are the quasi-steady, pressure-gradient, added-mass, and viscous-unsteady forces, respectively. This separation into individual contributions can be precisely definedfor an isolated particle in the zero particle Reynolds and Mach numbers limit, where explicit expres-sions for each contribution have been rigorously obtained.12, 13 This physics-based separation alsoprovides natural framework for systematically incorporating the effects of finite particle Reynoldsand Mach numbers and particle volume fraction. Parmar et al.5 and Ling et al.6 have presentedan extension of the force models to finite Reynolds and Mach numbers and applied the models toinvestigate shock interaction with an isolated particle,5 and evaluated the importance of unsteadyforces in the context of planar and spherical shocks.6, 19 The validation of the force models againstexperimental measurement can be found in Parmar et al.5 In the present work we are interested inextending the force models6, 12, 13 to a more practical problem of shock interaction with a particlecurtain. The biggest challenge is to extend the models from an isolated particle to finite volumefraction.
The expressions of the quasi-steady, pressure-gradient, added-mass, and viscous-unsteady forcesare given as9, 14
Fqs,i = 3πμgi d p
i (ugi − u p
i )Rep
i
24CD(Rep
i , Mpi , φ
pi ) , (10)
Fpg,i = −V pi
(∂pg
∂x
)i
, (11)
Fam,i = V pi CM (Mp
i , φpi )
[−
(∂pg
∂x
)i
− d(ρgi u p
i )
dt
], (12)
Fvu,i = 3πνgi d p
i θ (φ pi )
∫ t
−∞Kvu(t − χ, Rep
i , Mpi , φ
pi )
[−
(∂pg
∂x
)i
− d(ρgi u p
i )
dt
]t=χ
dχ, (13)
where Repi and Mp
i represent particle Reynolds and Mach numbers, definitions of which are givenin Appendix A. The particle volume is denoted as V p
i . The dynamic and kinematic viscosities aredenoted by μ
gi and ν
gi . Sutherland’s law is applied to compute μ
gi . The viscous-unsteady force kernel
is represented by Kvu and the expression of Mei and Adrian36 is employed here.Sangani et al.22 rigorously obtained the finite volume fraction corrections to the quasi-steady,
added-mass, and viscous-unsteady forces in the form of multiplicative factors that depend only onlocal particle volume fraction. Similarly, Parmar et al.20 expressed the finite Mach number effect onthe added-mass coefficient as a multiplicative correction. Following these results, here the effects offinite Mach number and finite particle volume fraction are taken into account through multiplicativecorrection factors that modify (a) the standard drag correlation CD, std by Clift and Gauvin,37 (b)the added-mass coefficient CM, std = 1/2, and (c) the viscous-unsteady kernel Kvu for an isolatedparticle in an incompressible flow. The resulting quasi-steady drag coefficient CD and added-masscoefficient CM are expressed as
CD(Repi , Mp
i , φpi ) = CD,std (Rep
i )ξ1(Mpi , Rep
i )ξ2(φ pi ) , (14)
CM (Mpi , φ
pi ) = CM,stdη1(Mp
i )η2(φ pi ) , (15)
This article is copyrighted as indicated in the article. Reuse of AIP content is subject to the terms at: http://scitation.aip.org/termsconditions. Downloaded to IP:
67.79.216.66 On: Tue, 08 Apr 2014 06:28:25

113301-9 Ling et al. Phys. Fluids 24, 113301 (2012)
where ξ1(Mpi , Rep
i ), ξ2(φ pi ), η1(Mp
i ), η2(φ pi ), and θ (φ p
i ) are the Mach number and volume fractiondependent correction functions and their expressions are given in Appendix A.
In Eqs. (10)–(15), gas variables with subscript i denote their values at the ith particle location. Theabove homogeneous formulations will result in error if the scale of the ambient flow approaches theparticle size, as it does during the passage of the shock over the particle curtain. The Faxen correctionis a powerful tool that generalizes the coupling models to inhomogeneous ambient flows that varyover the particle size.38 The recent work of Parmar et al.13 presents a rigorous generalization of theFaxFen correction to compressible flows. According to this inhomogeneous formulation, the local gasquantities at the particle center must be replaced by appropriate averages over the surface or volumeof the particle. The applicability of this inhomogeneous generalization to shock-particle interactionhas been tested5, 13 and it has been shown that the effect of inhomogeneity is important only duringthe brief period when the shock passes over the particle. However, the effect on long term motion ofthe particle is negligible for large particle-to-fluid density ratio. As discussed in Sec. V, the unsteadyforces arising from the initial passage of the shock over the particle curtain is not the major contri-bution to the curtain dynamics. Shock-particle-curtain interaction results in a sustained gas property(velocity, pressure, density) variation across the curtain, which persists even long after the passage ofthe shock wave. The unsteady forces arising from this sustained variation is significant in accuratelypredicting the curtain dynamics. Fortunately, the length scale of this variation is of the order ofcurtain thickness and thus a homogeneous formulation as presented in Eqs. (10)–(15) is adequate.
2. Modeling of force due to inter-particle interaction
For inter-particle interaction we use the classic model of Harris and Crighton,29 which has beenextensively tested and used in dense particulate flows.30–32 In this model, the force exerted on theith particle due to inter-particle interaction is represented by
F ppi = − V p
i
φpi
∇τpp,i , (16)
where τ pp is the isotropic inter-particle stress. An expression of τ pp that approximately accounts forinter-particle collisions is given by Harris and Crighton29 as
τpp,i = Ps(φ pi )β
φpc − φ
pi
, (17)
where φpc is particle volume fraction at close packing. For mono-size spherical particles φ
pc ≈ 0.6.
Here Ps and β are the model parameters. In the present study, we fix β to be 3 as suggested bySnider et al.31 and evaluate Ps based on a simple scaling argument (see Sec. VI D). Sensitivity ofthe simulation results to model parameters will be presented in Sec. VI D.
IV. NUMERICAL SCHEME
The partial differential equation system Eqs. (2)–(4) are solved by the cell-centered finite-volume method. The inviscid flux is computed by AUSM scheme.39 The face-states are obtained bya simplified second-order accurate weighted essentially non-oscillatory scheme, which modifies thegradients computed using the least-squares reconstruction method.40 The fourth-order Runge-Kuttamethod is used for time integration for both the gas equations (Eqs. (2)–(4)) and particle equations(Eqs. (5)–(7)). More details about the numerical schemes and verifications can be found in previousworks.41–44
The gas variables at the particle locations are computed by linear interpolation from the neigh-boring cell-center values. In 1D, the gas velocity at the location of particle i that is located betweenthe centers of the cells j and j + 1 is computed by
ugi = ug
j
x j+1 − x pi
x j+1 − x j+ ug
j+1
x pi − x j+1
x j+1 − x j, (18)
where xj and xj + 1 represent the locations of the centers of the cells j and j + 1.
This article is copyrighted as indicated in the article. Reuse of AIP content is subject to the terms at: http://scitation.aip.org/termsconditions. Downloaded to IP:
67.79.216.66 On: Tue, 08 Apr 2014 06:28:25

113301-10 Ling et al. Phys. Fluids 24, 113301 (2012)
TABLE I. Summary of simulation cases.
Case Ms dp (μm) φp1 (%) L (mm)
0 1.66 115 0 21 1.66 115 21 22 1.92 115 21 23 2.02 115 21 24 1.66 100 21 25 1.66 130 21 26 1.66 115 15 27 1.66 115 26 28 1.66 115 26 1.69 1.66 115 19 2.4
Similarly, linear projection is used to compute the particle volume fraction and the particle-to-fluid coupling terms, such as
∑i Ncp F gp
i and∑
i Ncp(Ggpi + Qgp
i ) in Eqs. (3) and (4). For example,the ith particle that is located between the centers of the cells j and j + 1 is considered to contributeto the particle volume fractions of the cells j and j + 1 by weights (x j+1 − x p
i )/(x j+1 − x j ) and(x p
i − x j )/(x j+1 − x j ). As a result, the particle volume fraction at cell j can be computed by summingover the particles located inside a region between the centers of the cells j − 1 and j + 1:
φpj = 1
Vcell
(NL∑i
NcpV pi
x pi − x j−1
x j − x j−1+
NR∑i
NcpV pi
x j+1 − x pi
x j+1 − x j
), (19)
where NL and NR denote the numbers of particles distributed in regions [xj − 1, xj] and [xj, xj + 1],respectively.
V. RESULTS
In the present study, a series of simulations are performed to investigate the interaction betweena planar shock wave and a dense particle curtain. A summary of simulation cases is presented inTable I. The cases are chosen to span the parameters of the experiments.
A. General behavior
Figure 4 is the x-t diagram for case 1, which is generated by plotting the contours of the computedgas density gradient on the x-t plane. General observations of the gas and particle motions are notedhere and a detailed description will be discussed in Sec. V C.
The short term behavior of the interaction between the incident shock wave and the particlecurtain can be seen in from Fig. 4(a). When the incident shock wave (S) reaches the upstream frontof the particle curtain (UFP) at t = 0, a reflected shock wave (RS), a transmitted shock (TS1), and acontact surface (C1) are generated. While RS propagates upstream, TS1 and C1 propagate throughthe particle curtain. Due to the interphase coupling, the transmitted shock slows down when it travelsinside the particle curtain. When the transmitted shock reaches the downstream front of the particlecurtain (DFP), a reflected expansion fan (RE), another transmitted shock (TS2) and contact surface(C2) are generated. Similarly, RE travels upstream through the particles while TS2 and C2 propagatedownstream. Here, TS1 and TS2 are used to distinguished the two transmitted shock generated atthe upstream and downstream fronts of the particle curtain. As TS1 exists only for a short time, wein general use the term “transmitted shock” for TS2. The reflected expansion fan will interact withC1 and later with UFP. The subsequent interactions of expansion and shock waves with the upstreamand downstream fronts of particle curtain continue to generate similar wave patterns as describedabove. Since the subsequent waves decay fast, they are almost invisible in Fig. 4(a).
The long term behavior of the particle curtain and the gas flow is shown in Fig. 4(b). The widthof the particle curtain is observed to increase rapidly as it propagates downstream. This phenomenon
This article is copyrighted as indicated in the article. Reuse of AIP content is subject to the terms at: http://scitation.aip.org/termsconditions. Downloaded to IP:
67.79.216.66 On: Tue, 08 Apr 2014 06:28:25

113301-11 Ling et al. Phys. Fluids 24, 113301 (2012)
FIG. 4. Numerically generated x-t diagram for case 1. (a) t/(L/us) < 5, (b) t/(L/us) < 200.
of the particle curtain expansion is very interesting, as it will not occur in a dilute particle-ladenflow. When the particle volume fraction (mass fraction) is small, the gas flow will not be influencedby the particles, i.e., gas-particle interaction is one-way coupled. As a result, the post-shock gasproperties remain constant and the acceleration process of each particle is identical except for a timeshift. Since the upstream front of a dilute particle curtain is reached first by the incident shock, itstarts to accelerate earlier than the downstream front. As a result, the distance between the upstreamand downstream fronts of the particle curtain will decrease in time, i.e., the shock interaction witha dilute particle curtain will result in a slight compression of the particle curtain. Expansion of theparticle curtain happens only when the particle volume fraction is large.
It should also be noted that the expansion of the particle curtain occurs only for finite inertiaparticles. It is shown in Fig. 4(b) that the distance between C1 and C2 does not change much in time.From Fig. 4(a), it can be observed that C1 and C2 adjust to the same velocity soon after they leave theparticle curtain. When the particle inertia is negligibly small, i.e., particle Stokes number Stp → 0,the two particle edges will follow the two contact surfaces closely. As a result, the particle curtainthickness will be very similar to the distance between the two contacts. From a close inspection ofFig. 4(a), it can be observed that the distance between C1 and C2 is indeed smaller than the initialparticle curtain thickness. Therefore, the particle curtain expands due to the combined action ofparticle inertia and the two-way coupling between gas and particles.
As the gas and particles are two-way coupled, the particle curtain also influences the gasflows. When the particle curtain moves downstream, the upstream front acts like a piston movingdownstream and pulls the upstream gas. Expansion waves that emanate from UFP propagate towardRS and cause RS to slow down.35 Similarly, the downstream front of the particle curtain behaveslike a piston that pushes the downstream gas. The compression waves generated by DFP propagatedownstream and cause C1, C2, and TS2 to accelerate. These upstream-propagating expansion wavesand downstream-propagating compression waves are generally weak and almost invisible in Fig. 4(b).These expansion and compression waves will continue to be generated until all particles reachequilibrium with the post-shock gas. At that equilibrium limit, the particle curtain will reach itsmaximum thickness and the pressure across the particle curtain becomes constant. Since it takesa very long time, i.e., on the order of particle response time, for particles to reach the asymptoticequilibrium state, the asymptotic state is not captured in both the simulations and experiments.
B. Comparison with experimental results
1. High-speed schlieren images
High-speed schlieren images taken from the experiments at six different time instances areshown along with the synthetic schlieren images of the present simulation results of case 2 in Fig. 5.
This article is copyrighted as indicated in the article. Reuse of AIP content is subject to the terms at: http://scitation.aip.org/termsconditions. Downloaded to IP:
67.79.216.66 On: Tue, 08 Apr 2014 06:28:25

113301-12 Ling et al. Phys. Fluids 24, 113301 (2012)
FIG. 5. Numerical generated Schlieren image (contours of gas density gradient in region without particles) of case 2 at(a) t/(L/us) = −4.7 (t = −18 μs), (b) t/(L/us) = 1.3 (t = 5 μs), (c) t/(L/us) = 5.2 (t = 20 μs), (d) t/(L/us) = 9.1 (t = 35 μs),(e) t/(L/us) = 37.2 (t = 112 μs), (f) t/(L/us) = 70.7 (t = 213 μs), compared with experimental results.33
This article is copyrighted as indicated in the article. Reuse of AIP content is subject to the terms at: http://scitation.aip.org/termsconditions. Downloaded to IP:
67.79.216.66 On: Tue, 08 Apr 2014 06:28:25

113301-13 Ling et al. Phys. Fluids 24, 113301 (2012)
y
φp0 0.21
us
Incidentshock
Transmittedshock
Exact
Measured
EDFPParticle curtain
Particleedge
Spanwise wall Spanwise wall
shock
ETSERS
CameraCamera
(a) Before interaction (b) After interaction
Gap
FIG. 6. Schematic of high-speed schileren image measurement in the multiphase shock tube experiment for (a) before and(b) after the shock interaction with the particle curtain. The errors in the measured thickness of the downstream front of theparticle curtain, the reflected and transmitted shocks are represented by EDFP, ERS, and ETS, respectively.
The time evolutions of the incident shock (S), the upstream and downstream fronts of the particlecurtain (UFP and DFP), RS, the transmitted shock (TS2), and the two gas contacts (C1 and C2) canbe seen. The broadened dark region that follows C1 in the experimental schlieren image of Fig. 5(d)is possibly the result of the downstream-propagating compression waves. In general, the simulationresults are observed to match the experimental images fairly well.
In the experimental schlieren images, the transmitted shock does not appear to be as sharp as inthe simulation results, which is due to the curvature of the transmitted shock in the y direction. Anexplanation for the transmitted shock curvature is suggested by the geometry of the initial curtain.In the experiment, the spanwise (y direction) width of particle curtain is only about 87% of the testsection. A schematic showing the plan-view (top-view) of the experimental setup is shown in Fig. 6.Gaps exist between the spanwise ends of the particle curtain and the side walls. When the incidentshock interacts with the particle curtain, the shock travels more slowly inside the particle curtainthan around it through the gaps, where particles are absent. As a consequence, the transmitted shockwill exhibit a curvature similar to that shown in Fig. 6. Since the high-speed schlieren images wereacquired in a view normal to the test section in the y direction, the transmitted shock is observedto be thicker and appears with two edges. This explanation is consistent with Figs. 5(c) and 5(d),where the computed transmitted shock location is observed to match well with the upstream frontof the transmitted shock. This observation suggests that the upstream front of the transmitted shockin the experimental schlieren images is the shock that has traveled through the center of the particlecurtain. The downstream front of the transmitted shock in the experimental images is the shocklocation near the two spanwise boundaries.
A similar curvature exists for the reflected shock as well. The reflected shock is generated onlyat the upstream front of the particle curtain. When it propagates upstream, it expands toward thelateral direction and later on occupies the whole spanwise width of the shock tube, resulting in acurvature similar to the transmitted shock. In Fig. 5(d), it is observed that the upstream front of thereflected shock in the schlieren image matches well with the simulation results.
The expanding behavior of the particle curtain can be seen in Figs. 5(e) and 5(f). The simulationsand experiments agree reasonably well on the locations of the upstream and downstream fronts ofthe particle curtain. The two edges of the particle curtain in the experimental images are notperfectly vertical, which is probably related to the variation of the initial particle volume fractionin the vertical direction. More details of the expansion of the particle curtain will be discussed inSecs. V C and V D.
The gaps between the spanwise edges of the particle curtain and the side walls will introducecurvature in the particle curtain as well, which can contribute to error in the measurement of thecurtain thickness by schilieren imaging. A quasi-one-dimensional analysis is conducted to estimate
This article is copyrighted as indicated in the article. Reuse of AIP content is subject to the terms at: http://scitation.aip.org/termsconditions. Downloaded to IP:
67.79.216.66 On: Tue, 08 Apr 2014 06:28:25

113301-14 Ling et al. Phys. Fluids 24, 113301 (2012)
x/L
φp 1
0 5 10 15 20 25 30
0
0.05
0.1
0.15
0.2
Downstreamfront
Upstreamfront
t/(L/us)=86.3 t/(L/us)=176.9t=0
Maximumvalue inspanwisedirection
FIG. 7. Results of a quasi-one-dimensional analysis for case 1 on estimating the effect of spanwise gaps to the shape of theparticle curtain and to particle curtain thickness measurement.
this error. In this analysis, we consider the particle volume fraction to decrease smoothly from 21%to 0% at the spanwise edge of the particle curtain, see Fig. 6. Then by running one-dimensionalsimulations with initial particle volume fraction varying from 21% to 0%, we can investigate thesensitivity of the downstream and upstream fronts of the particle curtain to the variation in the initialparticle volume fraction. This provides an estimate of the edge effect on the streamwise spreadingof the particle curtain.
The simulation results of the locations of the upstream and downstream fronts of the particlecurtain are shown in Fig. 7, as a function of initial particle volume fraction. It is seen that the locationsof the upstream and downstream fronts vary significantly with particle volume fraction. When theinitial particle volume fraction approaches zero, the particle curtain just propagates downstream andthe thickness remains similar to the initial value. As φ
pt=0 increases, it is observed that the velocity
of the upstream front slows down. Therefore, we expect the upstream front of the particle curtain tobend forward toward the downstream direction near the spanwise edges (see Fig. 6). The dependenceof the downstream front on φ
pt=0 is more complicated. From Fig. 7, it can be seen that at t/(L/us)
= 176.9 the downstream front of the particle curtain is the farthest located at φpt=0 = 18.5%. With
further increase in particle volume fraction, the speed of the downstream front slows down. Theresulting shape of the particle curtain, near the spanwise edges, is shown schematically in Fig. 6.This shape is quite similar to that observed by Boiko et al.34 in their numerical investigation of shockinteraction with a cloud of particles. It can be seen that the edge effect will result in a over-predictionof the particle curtain thickness. However, the level of over-prediction is limited. The error (EDFP,see Fig. 6) can be estimated to be less than 16% of particle curtain thickness in the present case.
2. Comparison of experimental and numerical x-t diagrams
A comparison of experimental and numerical x-t diagrams for cases 1-3 is shown in Fig. 8. Theexperimental points for the reflected and transmitted shocks are generated by measuring the shockcrossing times for the sensors (x/L = −49.8, x/L = −34.3, and x/L = 32.1) and by schlieren imagesfrom the smaller field-of-view (see Fig. 3). Data were not acquired in the smaller field for case 3, soexperimental data for the reflected shock near the initial curtain are not available. Images from thelarger field-of-view (see Fig. 3) are used to determine the experimental trajectory of the transmittedshock shown in Fig. 8. The experimental trajectories for upstream and downstream fronts of theparticle curtain are measured through the larger field-of-view schlieren images.
In Fig. 8, the experimental and numerical results are in general in good agreement for all threecases. The computed locations of the reflected shock farther upstream from the initial curtain location
This article is copyrighted as indicated in the article. Reuse of AIP content is subject to the terms at: http://scitation.aip.org/termsconditions. Downloaded to IP:
67.79.216.66 On: Tue, 08 Apr 2014 06:28:25

113301-15 Ling et al. Phys. Fluids 24, 113301 (2012)
x/L
t/(L/
u s)
-50 0 500
50
(a) (b)
(c)
100
150
200
DFP, NumUFP, NumRS, NumTS, NumDFP, ExpUFP, ExpRS, ExpTS, Exp
x/L
t/(L/
u s)
-50 0 500
50
100
150
200
DFP, NumUFP, NumRS, NumTS, NumDFP, ExpUFP, ExpRS, ExpTS, Exp
x/L
t/(L/
u s)
-50 0 500
50
100
150
200
DFP, NumUFP, NumRS, NumTS, NumDFP, ExpUFP, Exp
FIG. 8. Comparison of experimental and numerical x-t diagrams for (a) case 1 (Ms = 1.66), (b) case 2 (Ms = 1.92), and (c)case 3 (Ms = 2.02). Numerical and experimental results are denoted by “Num” and “Exp”, respectively. Symbols withoutuncertainty bars indicate that the size of the uncertainty bar is smaller than the symbol size.
(x/L = −49.8, x/L = −34.3) are observed to deviate from the experimental values. The deviationseems to increase with Ms. As the reflected shock propagates upstream, it interacts with the boundarylayers that have developed on the side walls due to the earlier passage of the incident shock. It islikely that viscous effects, possibly including shock-induced separation, influence the reflected shocktrajectories and contribute to the difference between experimental and numerical results. Since thetransmitted shock travels toward a quiescent area, the influence of shock-boundary-layer interactiondoes not exist, and thus the experimental and numerical results match better. It is also observed thatthe agreement between experimental and numerical results for the upstream front of the particlecurtain is not as good as the downstream, which may also be related to the change of the reflectedshock speed due to shock-boundary-layer interaction.
3. Pressure measurement at upstream and downstream locations
A comparison of the numerical and experimental pressure evolutions for cases 1-3 is shown inFig. 9. For each case, the pressures upstream at x1 = −34.3L, and downstream at x2 = 32.1L of theinitial curtain are presented.
In the numerical results of pressure at the upstream location x1, the passage of the RS resultsin a sharp pressure increase that is followed by a gradual decrease. The decrease is associated withupstream-propagating expansion waves emanating from the particle curtain as discussed previously.
This article is copyrighted as indicated in the article. Reuse of AIP content is subject to the terms at: http://scitation.aip.org/termsconditions. Downloaded to IP:
67.79.216.66 On: Tue, 08 Apr 2014 06:28:25

113301-16 Ling et al. Phys. Fluids 24, 113301 (2012)
t/(L/us)
(pg-p
g 1)/(
pg 2-
pg 1)
0 50 100 150 200 250 300 3500
0.5
(a)
(c)
(b)
1
1.5
2
2.5
x1, Ms=1.66, Numx2, Ms=1.66, Numx1, Ms=1.66, Expx2, Ms=1.66, ExpTransmitted
shock
Reflectedshock
Downstreamfront of particles
t/(L/us)
(pg-p
g 1)/(
pg 2-
pg 1)
0 50 100 150 200 250 300 3500
0.5
1
1.5
2
2.5
x1, Ms=1.92, Numx2, Ms=1.92, Numx1, Ms=1.92, Expx2, Ms=1.92, Exp
Reflectedshock
Downstream front of particles
Upstream front of particles
Transmittedshock
t/(L/us)
(pg-p
g 1)/(
pg 2-
pg 1)
0 50 100 150 200 250 300 3500
0.5
1
1.5
2
2.5
x1, Ms=2.02, Numx2, Ms=2.02, Numx1, Ms=2.02, Expx2, Ms=2.02, Exp
Downstream front of particles
Transmittedshock
Reflectedshock
Upstream frontof particles
FIG. 9. Time evolution of gas pressure at x1 = −34.3L and x2 = 32.1L for (a) case 1 (Ms = 1.66), (b) case 2 (Ms = 1.92),and (c) case 3 (Ms = 2.02). Numerical and experimental results are denoted by “Num” and “Exp”, respectively.
The experimental pressure shows a similar overall trend. The pressure increase at the arrival of thereflected shock is smaller and more dissipated in the experimental results, which is probably againrelated to the boundary layer on the side walls. In the experimental results, the pressure evolution afterthe reflected shock passage for different Ms is quite different, indicating the shock configurationsnear the x1 sensor are quite complicated and may be time-dependent as well. The experimentalpressure exhibits some low-frequency oscillations that are not observed in the numerical results,which may be related shock-boundary-layer interaction and resulting instability of the flow. Theinteraction between a shock wave and a boundary layer in a shock tube is a complicated problem.45, 46
Nevertheless, the experimental pressure at location x1 is observed to merge back to the numericalresults at later time, for example t/(L/us) > 150 in Fig. 9(a). It should be mentioned that the initialgeometry of the particle curtain and the vertical variation in particle volume fraction near the ceilingof the shock tube may also contribute to the discrepancy in pressure.
For the downstream sensor located at x2, the pressure increases with the arrival of the transmittedshock (TS2). As the transmitted shock is moving to a quiescent area, the boundary-layer effectdiscussed above is absent. As a result, it can be observed that the pressure has a sharp increase atthe arrival of the transmitted shock in both numerical and experimental results. The pressure jumppredicted by the simulation is observed to be lower than the experiments for all the three cases. Thisdeviation is likely due to the vertical variation of the particle volume fraction inside the curtain. Theexperimental data at x2 is measured on the floor of the shock tube, and the initial particle volumefraction at the bottom of the curtain (φp = 15%) is lower than that at the center (φp = 21%). As
This article is copyrighted as indicated in the article. Reuse of AIP content is subject to the terms at: http://scitation.aip.org/termsconditions. Downloaded to IP:
67.79.216.66 On: Tue, 08 Apr 2014 06:28:25
113301-17 Ling et al. Phys. Fluids 24, 113301 (2012)
will be shown later in Sec. V D, the pressure jump across the transmitted shock decreases when theinitial particle volume fraction of the curtain increases.
After the passage of the transmitted shock, the pressure at x2 continues to grow slowly, whichis due to the compression waves generated from the downstream front of the particle curtain. Theexperimental traces again exhibit low frequency fluctuations, which are possibly caused by theboundary layer induced by the transmitted shock. The presence of a small amount of particles onthe floor of the shock tube downstream of the initial particle curtain location may also perturb theflow behind the transmitted shock.33 When the downstream front of the particle curtain reachesx2, the pressure increase becomes more rapid, as shown in both the experiments and simulations.The pressure continues to increase as the particle curtain convects over the x2 location, indicating anegative spatial gradient in the gas pressure across the particle curtain. This observation is importantin explaining the expansion of the particle curtain in Sec. V C. Following the passage of the upstreamfront of the particle curtain, the pressure slowly decreases. Therefore, the slope changes in pressureevolution can be used as markers to identify the edges of the particle curtain as highlighted in Fig. 9.Since φp is lower at the bottom of the particle curtain in the experiments, the edges of particlecurtain move faster along the floor of the shock tube, which contributes to the difference betweennumerical and experimental results after the passage of the particle curtain. Rogue et al.35 notedsimilar pressure evolutions during the passage of a particle curtain.
C. Structure of the particle-laden flow generated by the interaction
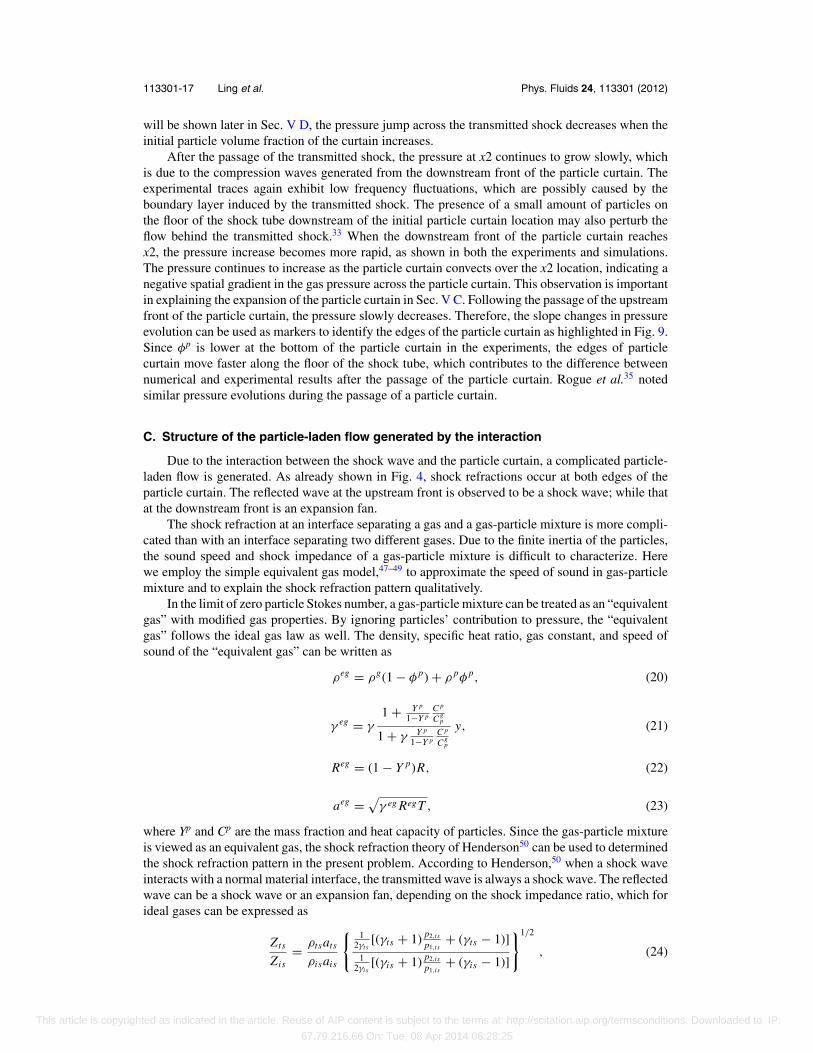
Due to the interaction between the shock wave and the particle curtain, a complicated particle-laden flow is generated. As already shown in Fig. 4, shock refractions occur at both edges of theparticle curtain. The reflected wave at the upstream front is observed to be a shock wave; while thatat the downstream front is an expansion fan.
The shock refraction at an interface separating a gas and a gas-particle mixture is more compli-cated than with an interface separating two different gases. Due to the finite inertia of the particles,the sound speed and shock impedance of a gas-particle mixture is difficult to characterize. Herewe employ the simple equivalent gas model,47–49 to approximate the speed of sound in gas-particlemixture and to explain the shock refraction pattern qualitatively.
In the limit of zero particle Stokes number, a gas-particle mixture can be treated as an “equivalentgas” with modified gas properties. By ignoring particles’ contribution to pressure, the “equivalentgas” follows the ideal gas law as well. The density, specific heat ratio, gas constant, and speed ofsound of the “equivalent gas” can be written as
ρeg = ρg(1 − φ p) + ρ pφ p, (20)
γ eg = γ1 + Y p
1−Y pC p
Cgp
1 + γ Y p
1−Y pC p
Cgp
y, (21)
Reg = (1 − Y p)R, (22)
aeg =√
γ eg RegT , (23)
where Yp and Cp are the mass fraction and heat capacity of particles. Since the gas-particle mixtureis viewed as an equivalent gas, the shock refraction theory of Henderson50 can be used to determinedthe shock refraction pattern in the present problem. According to Henderson,50 when a shock waveinteracts with a normal material interface, the transmitted wave is always a shock wave. The reflectedwave can be a shock wave or an expansion fan, depending on the shock impedance ratio, which forideal gases can be expressed as
Zts
Zis= ρtsats
ρisais
{ 12γts
[(γts + 1) p2,ts
p1,ts+ (γts − 1)]
12γis
[(γis + 1) p2,is
p1,is+ (γis − 1)]
}1/2
, (24)
This article is copyrighted as indicated in the article. Reuse of AIP content is subject to the terms at: http://scitation.aip.org/termsconditions. Downloaded to IP:
67.79.216.66 On: Tue, 08 Apr 2014 06:28:25

113301-18 Ling et al. Phys. Fluids 24, 113301 (2012)
x/L
ρg/ρ
g 1
-20 -10 0 10 20 301
2
3
4(a)
(c) (d)
(b)ρg, φp=0.21ρg, φp=0
DFP
UFP
C1
TS2
C2
RS
x/L
ug/u
s
-20 -10 0 10 20 300
0.1
0.2
0.3
0.4
0.5
0.6
ug, φp=0.21ug, φp=0
UFP
DFP
RS
TS2
x/L
pg/p
g 1
-20 -10 0 10 20 301
2
3
4
5
6
pg, φp=0.21pg, φp=0UFP
DFPTS2
RS
x/L
Tg/T
g 1
-20 -10 0 10 20 30
1
1.2
1.4
1.6
1.8
Tg, φp=0.21Tg, φp=0
UFP
DFP
RS
TS2
C1
C2
FIG. 10. Profiles of the computed gas (a) density, (b) velocity, (c) pressure, and (d) temperature at t/(L/us) = 24 for case 1(φp = 0.21), comparing with pure gas solution (case 0, φp = 0).
where the subscripts is and ts denote the properties of the medium through which the incident andtransmitted shocks travel. When Zts/Zis > 1, the reflected wave is a shock wave; when Zts/Zis < 1,the reflected wave is an expansion fan. For the present problem, it is then easily proved that theshock impedance of the particle-laden curtain is much larger than the pure gas, and thus the shockimpedance ratios at the upstream and downstream fronts of the particle curtain are greater and lessthan unity. Therefore, the reflected waves at the upstream and downstream fronts are a shock waveand an expansion fan, respectively. Strictly speaking, since the particle inertia is finite, the equivalentgas model is not valid and thus can only serve as an approximation. Nevertheless, it is noted that theshock refraction pattern for the present problem is quite similar to that for shock interaction with aone-dimensional heavy gas bubble,51 which confirms the ability of the simple model to describe theflow structure qualitatively.
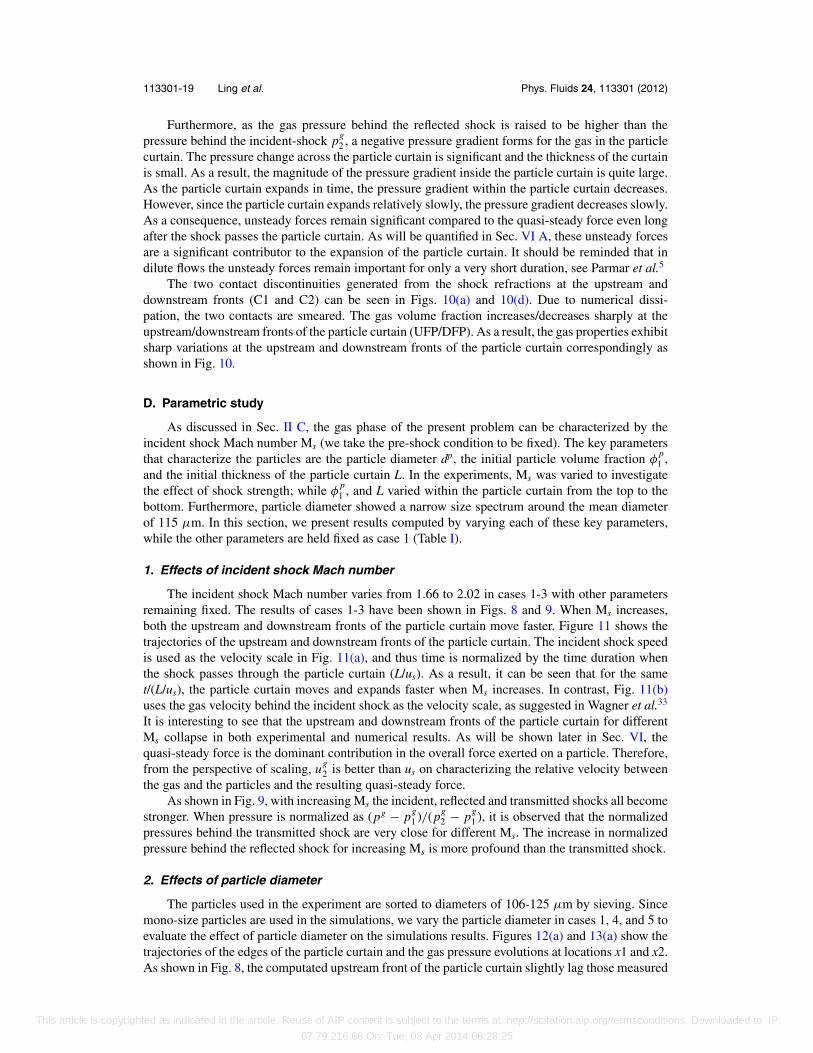
Due to the two-way coupling effect of the particle curtain, the gas flow is significantly changedas can be seen from the spatial profiles of gas density, velocity, pressure, and temperature at t/(L/us)= 24 for cases 0 (φp = 0) and 1 (φp = 0.21) in Fig. 10. Since the gas velocity decreases/increasesbehind the reflected/transmitted shock, a positive velocity gradient forms for the gas inside theparticle curtain. As a result, the relative velocity and the resulting quasi-steady drag force for theparticle located at the downstream front of the curtain is larger than at the upstream front, contributingto the expansion of the particle curtain. Note that this rapid expansion behavior is a unique feature ofshock-particle-curtain interaction. When a shock wave interacts with a gaseous curtain, the thicknessof the curtain is observed to increase only when interface instability and mixing happen.52, 53
This article is copyrighted as indicated in the article. Reuse of AIP content is subject to the terms at: http://scitation.aip.org/termsconditions. Downloaded to IP:
67.79.216.66 On: Tue, 08 Apr 2014 06:28:25
113301-19 Ling et al. Phys. Fluids 24, 113301 (2012)
Furthermore, as the gas pressure behind the reflected shock is raised to be higher than thepressure behind the incident-shock pg
2 , a negative pressure gradient forms for the gas in the particlecurtain. The pressure change across the particle curtain is significant and the thickness of the curtainis small. As a result, the magnitude of the pressure gradient inside the particle curtain is quite large.As the particle curtain expands in time, the pressure gradient within the particle curtain decreases.However, since the particle curtain expands relatively slowly, the pressure gradient decreases slowly.As a consequence, unsteady forces remain significant compared to the quasi-steady force even longafter the shock passes the particle curtain. As will be quantified in Sec. VI A, these unsteady forcesare a significant contributor to the expansion of the particle curtain. It should be reminded that indilute flows the unsteady forces remain important for only a very short duration, see Parmar et al.5
The two contact discontinuities generated from the shock refractions at the upstream anddownstream fronts (C1 and C2) can be seen in Figs. 10(a) and 10(d). Due to numerical dissi-pation, the two contacts are smeared. The gas volume fraction increases/decreases sharply at theupstream/downstream fronts of the particle curtain (UFP/DFP). As a result, the gas properties exhibitsharp variations at the upstream and downstream fronts of the particle curtain correspondingly asshown in Fig. 10.
D. Parametric study
As discussed in Sec. II C, the gas phase of the present problem can be characterized by theincident shock Mach number Ms (we take the pre-shock condition to be fixed). The key parametersthat characterize the particles are the particle diameter dp, the initial particle volume fraction φ
p1 ,
and the initial thickness of the particle curtain L. In the experiments, Ms was varied to investigatethe effect of shock strength; while φ
p1 , and L varied within the particle curtain from the top to the
bottom. Furthermore, particle diameter showed a narrow size spectrum around the mean diameterof 115 μm. In this section, we present results computed by varying each of these key parameters,while the other parameters are held fixed as case 1 (Table I).
1. Effects of incident shock Mach number
The incident shock Mach number varies from 1.66 to 2.02 in cases 1-3 with other parametersremaining fixed. The results of cases 1-3 have been shown in Figs. 8 and 9. When Ms increases,both the upstream and downstream fronts of the particle curtain move faster. Figure 11 shows thetrajectories of the upstream and downstream fronts of the particle curtain. The incident shock speedis used as the velocity scale in Fig. 11(a), and thus time is normalized by the time duration whenthe shock passes through the particle curtain (L/us). As a result, it can be seen that for the samet/(L/us), the particle curtain moves and expands faster when Ms increases. In contrast, Fig. 11(b)uses the gas velocity behind the incident shock as the velocity scale, as suggested in Wagner et al.33
It is interesting to see that the upstream and downstream fronts of the particle curtain for differentMs collapse in both experimental and numerical results. As will be shown later in Sec. VI, thequasi-steady force is the dominant contribution in the overall force exerted on a particle. Therefore,from the perspective of scaling, ug
2 is better than us on characterizing the relative velocity betweenthe gas and the particles and the resulting quasi-steady force.
As shown in Fig. 9, with increasing Ms the incident, reflected and transmitted shocks all becomestronger. When pressure is normalized as (pg − pg
1 )/(pg2 − pg
1 ), it is observed that the normalizedpressures behind the transmitted shock are very close for different Ms. The increase in normalizedpressure behind the reflected shock for increasing Ms is more profound than the transmitted shock.
2. Effects of particle diameter
The particles used in the experiment are sorted to diameters of 106-125 μm by sieving. Sincemono-size particles are used in the simulations, we vary the particle diameter in cases 1, 4, and 5 toevaluate the effect of particle diameter on the simulations results. Figures 12(a) and 13(a) show thetrajectories of the edges of the particle curtain and the gas pressure evolutions at locations x1 and x2.As shown in Fig. 8, the computated upstream front of the particle curtain slightly lag those measured
This article is copyrighted as indicated in the article. Reuse of AIP content is subject to the terms at: http://scitation.aip.org/termsconditions. Downloaded to IP:
67.79.216.66 On: Tue, 08 Apr 2014 06:28:25

113301-20 Ling et al. Phys. Fluids 24, 113301 (2012)
x/L
t/(L/
u s)
0 10 20 30 400
50
100
150
200 (a) (b)
DFP, Ms=1.66, NumUFP, Ms=1.66, NumDFP, Ms=1.92, NumUFP, Ms=1.92, NumDFP, Ms=2.02, NumUFP, Ms=2.02, NumDFP, Ms=1.66, ExpUFP, Ms=1.66, ExpDFP, Ms=1.92, ExpUFP, Ms=1.92, ExpDFP, Ms=2.02, ExpUFP, Ms=2.02, Exp
x/L
t/(L/
ug 2)
0 10 20 30 400
20
40
60
80
100
DFP, Ms=1.66, NumUFP, Ms=1.66, NumDFP, Ms=1.92, NumUFP, Ms=1.92, NumDFP, Ms=2.02, NumUFP, Ms=2.02, NumDFP, Ms=1.66, ExpUFP, Ms=1.66, ExpDFP, Ms=1.92, ExpUFP, Ms=1.92, ExpDFP, Ms=2.02, ExpUFP, Ms=2.02, Exp
FIG. 11. Trajectories of the upstream (UFP) and downstream (DFP) edges of particle curtain for cases 1, 2, and 3 by using(a) us and (b) ug
2 as velocity scale. Numerical and experimental results are denoted by “Num” and “Exp”, respectively.
x/L
t/(L/
u s)
0 5 10 15 20 25 30 35 400
50
100
150
200 (a) (b)
(c)
DFP, dp=100 μmUFP, dp=100 μmDFP, dp=115 μmUFP, dp=115 μmDFP, dp=130 μmUFP, dp=130 μmUFP, ExpDFP, Exp
x/L
t/(L/
u s)
0 5 10 15 20 25 30 35 400
50
100
150
200
DFP, φp=15%UFP, φp=15%DFP, φp=21%UFP, φp=21%DFP, φp=26%UFP, φp=26%UFP, ExpDFP, Exp
x/L
t/(L/
u s)
0 5 10 15 20 25 30 35 400
50
100
150
200
DFP, L=1.6 mmUFP, L=1.6 mmDFP, L=2.0 mmUFP, L=2.0 mmDFP, L=2.4 mmUFP, L=2.4 mmUFP, ExpDFP, Exp
FIG. 12. Trajectories of the computed upstream and downstream fronts of particle curtain for cases with different (a) dp (dp
= 100, 115, 130 μm for cases 1 , 4, 5), (b) φp1 (φ p
1 =15%, 21%, 26% for cases 1, 6, 7), and (c) L (L=1.6, 2.0, 2.4 mm forcases 1, 8, 9). The experimental results for Ms = 1.66 are shown for comparison, which are denoted by “Exp”.
This article is copyrighted as indicated in the article. Reuse of AIP content is subject to the terms at: http://scitation.aip.org/termsconditions. Downloaded to IP:
67.79.216.66 On: Tue, 08 Apr 2014 06:28:25

113301-21 Ling et al. Phys. Fluids 24, 113301 (2012)
t/(L/us)
(pg -p
g 1)/(
pg 2-pg 1)
0 50 100 150 200 2500
0.5
1
1.5
2
2.5 (a) (b)
(c)
x1, dp=100 μmx2, dp=100 μmx1, dp=115 μmx2, dp=115 μmx1, dp=130 μmx2, dp=130 μmx1, Expx2, Exp
t/(L/us)
(pg-p
g 1)/(
pg 2-
pg 1)
0 50 100 150 200 2500
0.5
1
1.5
2
2.5 x1, φp=0.15x2, φp=0.15x1, φp=0.21x2, φp=0.21x1, φp=0.26x2, φp=0.26x1, Expx2, Exp
t/(L/us)
(pg -p
g 1)/(
pg 2-pg 1)
0 50 100 150 200 2500
0.5
1
1.5
2
2.5x1, L=1.6 mmx2, L=1.6 mmx1, L=2.0 mmx2, L=2.0 mmx1, L=2.4 mmx2, L=2.4 mmx1, Expx2, Exp
FIG. 13. Time evolution of computed gas pressure at x1 = −68.6 mm and x2 = 64.1 mm for cases with different (a) dp (dp
= 100, 80, 120 μm for cases 1 , 4, 5), (b) φp1 (φ p
1 =15%, 21%, 26% for cases 1, 6, 7), and (c) L (L=1.6, 2.0, 2.4 mm forcases 1, 8, 9). The experimental results for Ms = 1.66 are shown for comparison, which are denoted by “Exp”.
experimentally. It can be seen from Fig. 12(a) that particles move slightly faster with decreasingdiameter. If distribution of particle sizes exist in the field, then particle of different sizes may separateas they move at different speed. For the size range considered here, the effect of particle size is quitesmall. In Fig. 13(a), pressure at x1 decreases and that at x2 increases with increasing particle size.Again, the variations in pressure and arrival time for the reflected and transmitted shocks are ingeneral small.
3. Effects of initial particle volume fraction
The particle curtain in the experiment is generated by feeding particles from the top of theshock tube. In the streamwise (x) and spanwise (y) directions, the particle volume fraction remainsapproximately constant. In the vertical direction (z), the particle volume fraction varies from 26% atthe top of the constant L portion to about 15% at the bottom of the particle curtain. At the center ofthe constant L portion of the curtain, φ p
1 is about 21%. To evaluate the effect of initial particle volumefraction, cases 1, 6, and 7 are computed for φ
p1 = 15%, 21%, and 26%, respectively. It can be seen
from Fig. 12(b) that the upstream front of the particle curtain moves faster with decreasing φp1 . In
contrast, the variation of the downstream front with φp1 is more complex. Upon a close inspection,
it can be found that the downstream front for larger φp1 moves faster initially, but accelerates slower
and later is crossed by that with smaller φp1 . For example, the downstream front for φ
p1 = 15%
crosses the one for φp1 = 21% at around x/L = 23.
This article is copyrighted as indicated in the article. Reuse of AIP content is subject to the terms at: http://scitation.aip.org/termsconditions. Downloaded to IP:
67.79.216.66 On: Tue, 08 Apr 2014 06:28:25

113301-22 Ling et al. Phys. Fluids 24, 113301 (2012)
From Fig. 13(b) it can be seen that both the upstream and downstream pressure evolutions changesignificantly with φ
p1 . As φ
p1 increases, the strength and the propagation speed of the reflected shock
increase. It is interesting to notice that the experimental results for later time evolution match betterwith the simulation results for φ
p1 = 15%. For the downstream location x2, the pressure jump at the
transmitted shock decreases significantly when φp1 goes up. As discussed previously, the deviation
between numerical and experimental results in the pressure rise at the transmitted shock (seeFig. 9) is likely due to the variation of φ
p1 . This explanation is consistent with our observation in
Fig. 13(b). The simulation results of φp1 = 15% indeed matches the experimental results the best.
As φp1 increases, the blockage effect of the particle curtain becomes more significant, resulting in
a stronger reflected shock wave. The transmitted shock loses more momentum as it passes throughthe particle curtain, thus contributing to the observed trend of pressure evolution.
4. Effects of initial particle curtain thickness
Due to the limitation of the feeding device, the particle curtain thickness varies somewhatfrom shot-to-shot. The standard deviation in L is about 0.4 mm. As the mass flow rate of parti-cles from the feeder is fixed, when L varies, φ
p1 changes accordingly. To evaluate the effect of
L, cases 1, 8, and 9 are run for L = 1.6, 2.0, and 2.4 mm, respectively. From Fig. 12(c), theupstream front of the particle curtain varies little with L. Similar to the effect of larger φ
p1 , for
smaller L the downstream front moves faster initially but later slower than the one with larger L.In general, the influence of L on the particle curtain edges is quite small. As φ
p1 increases with
decreasing L, the strength of the reflected shock increases while that of the transmitted shocksdecrease with L (see Fig. 13(c)). However, in contrast to Fig. 13(b), the pressures for different Lconverge at later times. This indicates that after the initial period, only the total mass of particlesin the curtain matters and the initial thickness of the particle curtain becomes less important. Incontrast, in Fig. 13(b), the total mass of particles in the particle curtain increases between cases 6,1, and 7, and as a result the difference in pressure for these cases persists over time.
VI. DISCUSSIONS OF THE PRESENT FORCE MODEL
Compared to the conventional standard-drag law of Clift and Gauvin,37 there are four majoradditions in the present force model: (1) unsteady force contributions to particle force are included;(2) effect of compressibility on hydrodynamic forces is included; (3) effect of particle volumefraction on hydrodynamic forces is included; (4) effect of inter-particle interaction is taken intoaccount. We will evaluate the importance of these improvements in capturing the physics of shockinteraction with a dense cloud of particles.
The trajectories of the edges of the particle curtain computed with the present model for case1 are shown in Fig. 14 and are compared with those computed with the standard drag law of Cliftand Gauvin.37 It can be observed that the upstream and downstream fronts of the particle curtaincalculated by these two models are substantially different. If the standard drag law is used, both theupstream and downstream fronts of the particle curtain move slower than the experimental results.For the downstream front, at t/(L/us) = 150, the locations computed by the present model, thestandard drag law, and measured in the experiment are 19.23L, 10.56L, and 20.47L, respectively. Inother words, the standard drag law underestimates the downstream front location by about 50%. Asa result of the underestimate on the downstream front, the expansion of the particle curtain is alsounderestimated by the standard drag law. The present model yields results that better compare withexperiments. Given the complexity of the problem and the models, caution is required in drawingconclusion. In what follows we will investigate the contributions of the four additional mechanismsthat were included in the present models and their sensitivity to model parameters.
A. Unsteady forces
The importance of unsteady forces in accurately predicting the peak force and sustained motionof an isolated particle subjected to a shock wave has been emphasized in Ling et al.6 The unsteady
This article is copyrighted as indicated in the article. Reuse of AIP content is subject to the terms at: http://scitation.aip.org/termsconditions. Downloaded to IP:
67.79.216.66 On: Tue, 08 Apr 2014 06:28:25

113301-23 Ling et al. Phys. Fluids 24, 113301 (2012)
x/L
t/(L/
u s)
0 5 10 15 20 25 30 35 400
50
100
150
200
DFP, PresentUFP, PresentDFP, Std dragUFP, Std dragDFP, ExpUFP, Exp
FIG. 14. Trajectories of the upstream and downstream fronts of particle curtain for case 1 computed with the present model(“Present”) and the standard drag law37 (“Std drag”), compared with the experimental results (“Exp”).
force contributions are large compared to the quasi-steady force during the brief initial period as theshock wave passes over the particle. Soon after the passage of the shock, unsteady forces decay onacoustic time scale to be negligibly small. The overall effects of the unsteady force contributions onthe particle velocity are inversely proportional to the particle-to-fluid density ratio. For the presentproblem, the particle-to-fluid density ratio is over a thousand. Thus, if the particle volume fraction islow, then the effects of unsteady forces on particle motion will be negligibly small. However, due tothe substantial volume fraction of particles in the present problem, a reflected shock is generated anda negative pressure gradient of large magnitude forms inside the particle curtain as shown previouslyin Fig. 10(c). As a consequence, the gas acceleration inside the particle curtain is substantial, and itintroduces unsteady forces of significant magnitude that sustain for a long time. Therefore, ignoringthe unsteady force contributions will introduce significant errors in the simulations.
The time evolution of the contributions of the different forces to particle acceleration for aparticle initially located in the center of the particle curtain (x p
t=0 = L/2) for case 1 are plotted inFig. 15. As expected, the unsteady contributions are quite large during the brief initial period asthe shock wave passes over the particle (see Fig. 15(a)). The unsteady contributions decay very
t/(L/us)
dup /d
t (10
4 m/s
2 )
0 0.5 1 1.5 2 2.5 3 3.5 4
0
10
20
30
40
50
60(a) (b)
Quasi-steadyPressure-gradientAdded-massViscous-unsteadyInter-particle
t/(L/us)
dup /d
t (10
4 m/s
2 )
0 50 100 150 200 250
0
5
10
15
20
Quasi-steadyPressure-gradientAdded-massViscous-unsteadyInter-particle
FIG. 15. Time evolutions of different force contributions to particle acceleration for the particle initially located at xp/L= 0.5 for case 1. (a) t/(L/us) < 4, (b) t/(L/us) < 250.
This article is copyrighted as indicated in the article. Reuse of AIP content is subject to the terms at: http://scitation.aip.org/termsconditions. Downloaded to IP:
67.79.216.66 On: Tue, 08 Apr 2014 06:28:25

113301-24 Ling et al. Phys. Fluids 24, 113301 (2012)
t/(L/us)
Cor
rect
ion
func
tions
Mp
0 50 100 150 2001
1.1
1.2
1.3
1.4
1.5
1.6
1.7 (a) (b)
0
0.1
0.2
0.3
0.4
Mp
ξ1
η1
t/(L/us)
Cor
rect
ion
func
tions
p
0 50 100 150 2001
1.5
2
2.5
0
0.05
0.1
0.15
0.2
p
2
2
FIG. 16. Time evolution of (a) particle Mach number and correction functions ξ1 and η1 and (b) particle volume fractionand correction functions ξ2, η2, and θ , for the particle initially located at xp/L = 0.5 for case 1.
fast after the shock has gone past the particle curtain, but remain significant compared to the quasi-steady force for a long time (see Fig. 15(b)). It can be seen that at t/(L/us) = 30, the magnitudesof pressure-gradient, added-mass, and viscous-unsteady forces are about 46.1%, 34.1%, and 48.3%of that of quasi-steady force. Thus, together the contributions of the unsteady forces are as large asthe quasi-steady force. As time continues to evolve, the particle curtain expands and the pressuregradient and gas acceleration inside decrease, and the magnitude of the unsteady forces decreaseaccordingly.
We also note that, the pressure-gradient, added-mass, and viscous-unsteady forces are of thesame order of magnitude. This is consistent with the observations made in Ling et al.6 Therefore,keeping only the pressure-gradient force without the other two contributions is inconsistent and canintroduce significant errors.
B. Mach number effect on hydrodynamic forces
The effects of Mach number on the quasi-steady and added-mass forces have been taken intoaccount by the correction functions ξ 1 and η1 (see Eqs. (14) and (15)). Figure 16(a) shows the timeevolutions of the particle Mach number and the correction functions ξ 1 and η1 for a particle initiallylocated at the center of the particle curtain for case 1. It is seen that Mp rises up to about 0.45when reached by the incident shock. The local gas velocity drops quickly due to the reflected shockwave, resulting in a rapid decrease of Mp to about 0.29. After that Mp gradually increases untilabout t/(L/us) = 100. Since the relative velocity continues to decrease due to the quasi-steady drag,Mp will eventually approach zero on the order of particle response time. During the time periodconsidered here, Mp stays lower than the critical Mach number (Mp
cr ≈ 0.6) and therefore the Machnumber correction η1 proposed by Parmar et al.20 remains valid. The correction functions ξ 1 andη1 in general follow Mp. The maximum value of ξ 1 is about 1.1, while that of η1 is about 1.6. Thisindicates that the Mach number effect contributes to increases of 10% and 60% in quasi-steady andadded-mass forces, respectively, compared to their incompressible expressions.
C. Particle volume fraction effect on hydrodynamic forces
The effect of particle volume fraction on quasi-steady, added-mass, and viscous-unsteady forceshas been taken into account by the correction functions ξ 2, η2, and θ . Figure 16(b) shows the timeevolutions of the local particle volume fraction and the correction functions ξ 2, η2, and θ for aparticle initially located at the center of the particle curtain for case 1.
This article is copyrighted as indicated in the article. Reuse of AIP content is subject to the terms at: http://scitation.aip.org/termsconditions. Downloaded to IP:
67.79.216.66 On: Tue, 08 Apr 2014 06:28:25

113301-25 Ling et al. Phys. Fluids 24, 113301 (2012)
x/L
up/u
s
0 0.5 1 1.50
0.005
0.01
0.015
0.02
0.025 (a) (b)t/(L/us)=0.6t/(L/us)=3.4t/(L/us)=6.3t/(L/us)=9.1
x/L
p
0 0.5 1 1.50
0.05
0.1
0.15
0.2
0.25
t/(L/us)=0.6t/(L/us)=3.4t/(L/us)=6.3t/(L/us)=9.1
FIG. 17. Early time evolutions of particle (a) velocity and (b) volume fraction for case 1.
The upstream front of the particle curtain starts to move downstream immediately followingthe arrival of the shock wave. This results in a negative particle velocity gradient (∂up/∂x < 0) anda compression of the particle curtain at early times, see Fig. 17(a). The particle volume fractionslightly increases near the upstream front accordingly as shown in Fig. 17(b). Soon after the passageof the transmitted shock, due to the positive velocity gradient of the gas within the curtain (seeFig. 10(b)), the particle velocity gradient gradually becomes positive, see Fig. 17(a). Then theparticle volume fraction starts to decrease and the particle curtain changes from compression toexpansion. As shown in Figs. 17(a) and 17(b), the compression of the particle curtain only lastsfor a very short time and during the period the thickness of the particle curtain does not changesignificantly.
The expansion of the particle curtain is fast from t/(L/us) = 10 to 100 and accordingly φp decaysfrom about 0.22 to 0.029, see Fig. 16(b). After that, the rate of decrease in φ
pi slows down. The
correction functions ξ 2, η2, and θ follow the trend of φpi . Maximum values of ξ 2, η2, and θ are 2.3,
1.8, and 1.3, respectively. In other words, the magnitudes of the quasi-steady and added-mass forcescan be about two times of their values in the dilute limit. When φ
pi decays to 1% at t/(L/us) = 240,
ξ 2 = 1.04, η2 = 1.03, and θ = 1.01.Since the quasi-steady force is generally dominant in the overall force exerted on the particle,
extra attention must be paid to accurate modeling of the particle volume fraction correction functionξ 2. The expression for ξ 2 used in the present model is based on the work by Sangani et al., whereξ 2 is a only function of φp.22 There are other drag force models in the literature considered ξ 2 tobe a function of both particle volume fraction and Reynolds number.24, 54 To examine the effect ofdifferent expressions of ξ 2 on the results presented above, the drag laws of Wen and Yu23 (ξ 2(φp)= 1/(1 − φp)4.7) and Di Felice24 (ξ 2(φp, Rep) = 1/(1 − φp)α , where α = 3.7 + 0.65exp [ − (1.5− log Rep)2/2]) are used to compute case 1. The correlation of Wen and Yu23 is recognized to beaccurate for particle volume fraction up to 20%, which is in general satisfied in the present study.55
The results of the trajectories of the edges of the particle curtain are shown in Fig. 18(a) along withthe present results. It can be seen that all of the three quasi-steady force models yield almost thesame results. The results of the models of Di Felice24 and Wen and Yu23 are very close, indicatingthat the dependence of ξ 2 on Rep is small. Therefore, it can be concluded that the results presentedhere is not sensitive to the choice of quasi-steady force model.
D. Inter-particle interaction and sensitivity to model parameters
For the present problem, the initial particle volume fraction in the particle curtain is about15%-26%, which is relatively low compared to the close packing limit of 60%. As discussed inSec. VI C, the particle volume fraction near the upstream front increases for a short duration
This article is copyrighted as indicated in the article. Reuse of AIP content is subject to the terms at: http://scitation.aip.org/termsconditions. Downloaded to IP:
67.79.216.66 On: Tue, 08 Apr 2014 06:28:25

113301-26 Ling et al. Phys. Fluids 24, 113301 (2012)
x/L
t/(L/
u s)
0 5 10 15 20 25 30 35 400
50
100
150
200 (a) (b)
DFP, Sangani et al. (1991)UFP, Sangani et al. (1991)DFP, Wen & Yu (1966)UFP, Wen & Yu (1966)DFP, Di Felice (1994)UFP, Di Felice (1994)UFP, ExpDFP, Exp
x/L
t/(L/
u s)
0 10 20 30 400
50
100
150
200
DFP, Ps=1e5DFP, Ps=2e5DFP, Ps=4e5DFP, Ps=8e5DFP, Ps=1e7DFP, ExpUFP, Ps=1e5UFP, Ps=2e5UFP, Ps=4e5UFP, Exp
FIG. 18. Trajectories of the upstream and downstream fronts of particle curtain for case 1 computed (a) by using differentcorrection functions ξ2(φp) and (b) by using different values of Ps (Pa) in the inter-particle interaction force Fpp.
following the passage of the shock through the particle curtain. Except for this short-lived localbehavior, the particle volume fraction decreases over time as the particle curtain expands along thestreamwise direction. As a consequence, the inter-particle interaction force is generally smaller thanthe hydrodynamic forces (see Fig. 15). Only during the initial compression phase, inter-particleinteraction plays a role in preventing the volume fraction from exceeding the close packing limit.
The inter-particle interaction model of Harris and Crighton29 used in Eq. (17) involves Ps asa model parameter. Here we will investigate the sensitivity of the results to its variation. FromFig. 15, we observe the pressure gradient force to be the dominant hydrodynamic force onthe particles during the early period of shock-particle-curtain interaction. For the inter-particleinteraction force to be as important as the pressure gradient force, we require τ pp to be of the orderof φppg (from a balance of Eqs. (11) and (16)). Based on this scaling, we obtain the following simpleestimate: Ps ∼ O(105 Pa) for the present problem.
Figure 18(b) shows the trajectories of the upstream and downstream fronts of the particle curtainfor five different values of Ps. For values of Ps from 1 × 10⁵ to 8 × 10⁵ Pa, it is observed that thetrajectories of the upstream and downstream fronts are not very sensitive to the choice of Ps. WhenPs is too large (107 Pa), the effect of the inter-particle interaction is amplified and the trajectory ofthe downstream front is observed to be overly dissipated. We have also examined the sensitivity ofother quantities such as locations of reflected and transmitted shocks, gas property evolution, andparticle concentration. It is observed that the results discussed in Sec. V are insensitive to the precisevalue of Ps, provided it is O(105 Pa).
VII. CONCLUSIONS
The interaction of a planar shock wave with a dense particle curtain is investigated in thispaper both through simulations and experiments. A physics-based model is developed to accountfor the interphase interaction in compressible dense particle-laden flows. The present model isused to simulate the interaction between a planar shock wave and a dense particle curtain, and thesimulation results are compared with the experimental data. The agreement is good and the aspects ofdisagreement are explained in terms of experimental factors not simulated (particle volume fractionvarying vertically, wall boundary layers). It is observed that the strong two-way coupling betweenthe gas and particles substantially changes the gas flow. Shock refractions that occur at the upstreamand downstream fronts of the particle curtain generate an upstream-propagating reflected shockwave and a downstream-propagating transmitted shock wave. These two shock waves introduce apositive velocity gradient and a negative pressure gradient inside the particle curtain, which causesthe particle curtain to expand, as observed in both experiments and simulations.
This article is copyrighted as indicated in the article. Reuse of AIP content is subject to the terms at: http://scitation.aip.org/termsconditions. Downloaded to IP:
67.79.216.66 On: Tue, 08 Apr 2014 06:28:25

113301-27 Ling et al. Phys. Fluids 24, 113301 (2012)
The key parameters in the present problem are the incident shock Mach number, the particlediameter, the initial particle volume fraction, and the initial thickness of the particle curtain. Para-metric studies are performed to estimate the effects of these key parameters and the sensitivity ofthe simulated results on the spreading of the particle curtain. Compared to the conventional standarddrag law,37 four major improvements are made in the present model: (1) unsteady force contributionsto particle force are included; (2) effect of compressibility on hydrodynamic forces is included; (3)effect of particle volume fraction on hydrodynamic forces is included; (4) effect of inter-particlecollision is taken into account. It is shown that without including these improvements, the interactionbetween the planar shock wave and the particle curtain and the resulting expansion of the particlecurtain will not be captured accurately. An important finding is that the unsteady forces in the presentproblem (pressure-gradient, added-mass, and viscous-unsteady forces) remain significant for a longtime compared to the quasi-steady force and have an important effect on the overall motion ofthe particle curtain even when the particle-to-gas density ratio is large. This occurs because of thesignificant pressure gradient within the particle curtain.
Given the complexity of the problem of shock-particle interaction, caution is required in drawingconclusion on the validity of the present models. Although the present modeling and experimentalresults agree quite well, comparison against other experimental data may be needed to fully validatethe present models.
ACKNOWLEDGMENTS
The authors would like to acknowledge support from AFOSR (Grant No. FA 9550-10-1-0309).The authors also thank Brian Pruett and Elton Wright for their assistance with the experiments.The experiments were supported by Sandia National Laboratories and the United States Departmentof Energy with an internal Laboratory Directed Research and Development (LDRD) grant. SandiaNational Laboratories is a multi-program laboratory managed and operated by Sandia Corporation,a wholly owned subsidiary of Lockheed Martin Corporation, for the U.S. Department of Energy’sNational Nuclear Security Administration (Contract No. DE-AC04-94AL85000).
APPENDIX A: MODELING OF FORCE DUE TO GAS-PARTICLE INTERACTION
The particle Reynolds and Mach numbers are defined as
Repi = ρ
gi |ug
i − u pi |d p
μgi
(A1)
and
Mpi = |ug
i − u pi |
agi
, (A2)
where agi is sound speed of gas.
The classic standard drag correlation of Clift and Gauvin37 is used here for CD, std as
CD,std (Repi ) = 24
Repi
(1 + 0.15(Repi )0.687) + 0.42
(1 + 42500
(Repi )1.16
). (A3)
The correction function ξ1(Mpi , Rep
i ), which accounts for the effect of finite particle Machnumber on the quasi-steady force, is given by Parmar et al.17 for a sphere in compressible flows as
ξ1(Mpi , Rep
i ) =
⎧⎪⎪⎨⎪⎪⎩
1 + (CD,Mpcr/CD,std − 1)Mp
i /Mpcr if Mp
i ≤ Mpcr ,
CD,Mpsub
/CD,std if Mpcr < Mp
i ≤ 1.0 ,
CD,Mpsup
/CD,std if 1.0 < Mpi ≤ 1.75 ,
(A4)
This article is copyrighted as indicated in the article. Reuse of AIP content is subject to the terms at: http://scitation.aip.org/termsconditions. Downloaded to IP:
67.79.216.66 On: Tue, 08 Apr 2014 06:28:25

113301-28 Ling et al. Phys. Fluids 24, 113301 (2012)
where Mpcr is the critical Mach number, at which the flow in the vicinity of a particle becomes super-
sonic. For a sphere, Mpcr is approximately 0.6. The expressions for CD,Mp
cr(Rep
i ), CD,Mpsub
(Mpi , Rep
i ),and CD,Mp
sup(Mp
i , Repi ) can be found in Parmar et al.17
For the correction function ξ2(φ pi ), which accounts for the effect of finite particle volume fraction
on the quasi-steady force, we employed the expression given by Sangani et al.22 as
ξ2(φ pi ) = 1 + 2φ
pi
(1 − φpi )2
. (A5)
The above expression was analytically derived from dilute periodic arrays of spherical particles inthe Stokes flow limit. It has been shown to be a good approximation for random arrays of spheresfor φ
pi up to about 30%.22 This criterion is generally satisfied in the present problem.The correction function η1(Mp
i ), which accounts for the effect of finite particle Mach numberon the added-mass force, is taken to be the correlation given by Parmar et al.20 for a sphere incompressible flows as
η1(Mpi ) = 1 + 1.8(Mp
i )2 + 7.6(Mpi )4 . (A6)
The above correlation is valid up to the critical Mach number, i.e., Mpi ≤ Mp
cr . This condition is alsogenerally satisfied for all cases considered here.
The correction function η2(φ pi ) is used to account for the effect of finite particle volume fraction
on added-mass force. Here we employ the expression of Zuber56 as
η2(φ pi ) = 1 + 2φ
pi . (A7)
The above expression was rigorously derived by Zuber56 and Sangani et al.22 This expression isvalid for regular and random arrays of spheres when φp � 30%.
The correction function θ (φ pi ) is used to take into account the effect of φ
pi on viscous-unsteady
force. For dilute periodic arrays of spheres in incompressible flows, the expression of θ (φ pi ) is given
by Sangani et al.22 as
θ (φ pi ) = 1
1 − φpi
. (A8)
This expression is shown to be accurate for regular and random array configurations provided φp
� 30%. The dependence of viscous-unsteady force on the particle Mach number is still not fullyunderstood. Therefore, the effect of Mp on viscous-unsteady force is neglected.
APPENDIX B: MODELING OF HEAT TRANSFER DUE TO GAS-PARTICLE INTERACTION
Similar to Eq. (9), the overall heat transferred to the ith particle Qgpi is expressed as
Qgpi = Qqs,i + Quu,i + Qdu,i , (B1)
where Qqs, i, Quu, i, and Qdu, i represent quasi-steady, undisturbed-unsteady, and diffusive-unsteadycontributions, which are the thermal analogs of Fqs, i, Fpg, i, and Fvu,i , respectively. Note that thereis no thermal analog to the added-mass force because the latter is inviscid in nature and arises fromthe no-penetration boundary condition.
The present experimental diagnostics have been limited to the dynamics of the particle curtainand gas pressure measurements. As a result, the primary emphasis of the present modeling andvalidation efforts have been on momentum coupling between the gas and particulate phases. Forenergy coupling, we simply use the empirical correlations of Qqs, i, and Qdu, i for an isolated particlein the literature.57, 58 Furthermore, in the present context of rigid particles and inviscid gas flow,the undisturbed-unsteady contribution reduces to Quu, i = 0. In the correlation of Fox et al.,57 theNusselt number depends on the particle Mach number, and therefore the compressibility effect onquasi-steady heat transfer has been taken into account. Nevertheless, the effect of finite particlevolume fraction has not been incorporated. In the governing equations, heat transferred to particleswill influence the gas phase energy equation (Eq. (4)), which in turn is coupled to the gas momentum
This article is copyrighted as indicated in the article. Reuse of AIP content is subject to the terms at: http://scitation.aip.org/termsconditions. Downloaded to IP:
67.79.216.66 On: Tue, 08 Apr 2014 06:28:25

113301-29 Ling et al. Phys. Fluids 24, 113301 (2012)
equation (Eq. (3)). As a result, the simplification of particle heat transfer model may indirectlyinfluence the gas and particle motion. However, the errors caused by the simplified heat transfermodel are expected to be of secondary importance and will not change the key conclusions.
1 A. E. Bryson and R. W. F. Gross, “Diffraction of strong shocks by cones, cylinders, and spheres,” J. Fluid Mech. 10, 1–16(1961).
2 M. Sun, T. Saito, K. Takayama, and H. Tanno, “Unsteady drag on a sphere by shock wave loading,” Shock Waves 14, 3–9(2005).
3 H. Tanno, K. Itoh, T. Saito, A. Abe, and K. Takayama, “Interaction of a shock with a sphere suspended in a vertical shocktube,” Shock Waves 13, 191–200 (2003).
4 M. S. Bredin and B. W. Skews, “Drag measurements in unsteady compressible flow. Part 1: An unsteady flow facility andstress wave balance,” R&D J. South Afr. Inst. Mech. Eng. 23, 3–12 (2007).
5 M. Parmar, A. Haselbacher, and S. Balachandar, “Modeling of the unsteady force for shock–particle interaction,” ShockWaves 19, 317–329 (2009).
6 Y. Ling, A. Haselbacher, and S. Balachandar, “Importance of unsteady contributions to force and heating for particles incompressible flows. Part 1: Modeling and analysis for shock-particle interaction,” Int. J. Multiphase Flow 37, 1026–1044(2011).
7 Z. Zarei, D. L. Frost, and E. V. Timofeev, “Numerical modelling of the entrainment of particles in inviscid supersonicflow,” Shock Waves 21, 341–355 (2011).
8 G. B. Jacobs, W. S. Don, and T. Dittmann, “High-order resolution Eulerian-Lagrangian simulations of particle dispersionin the accelerated flow behind a moving shock,” Theor. Comput. Fluid Dyn. 26, 37–50 (2012).
9 S. Balachandar and J. K. Eaton, “Turbulent dispersed multiphase flow,” Annu. Rev. Fluid Mech. 42, 111–133 (2010).10 M. R. Maxey and J. J. Riley, “Equation of motion for a small rigid sphere in a nonuniform flow,” Phys. Fluids 26, 883–889
(1983).11 R. Gatignol, “The Faxen formulae for a rigid particle in an unsteady non-uniform Stokes flow,” J. Mec. Theor. Appl. 1,
143–160 (1983).12 M. Parmar, A. Haselbacher, and S. Balachandar, “Generalized Basset-Boussinesq-Oseen equation for unsteady forces on
a sphere in a compressible flow,” Phys. Rev. Lett. 106, 084501 (2011).13 M. Parmar, A. Haselbacher, and S. Balachandar, “Equation of motion for a sphere in non-uniform compressible flows,”
J. Fluid Mech. 699, 352–375 (2012).14 J. Magnaudet and I. Eames, “The motion of high-Reynolds-number bubbles in inhomogeneous flows,” Annu. Rev. Fluid
Mech. 32, 659–708 (2000).15 C. B. Henderson, “Drag coefficients of spheres in continuum and rarefied flows,” AIAA J. 14, 707–708 (1976).16 E. Loth, “Compressibility and rarefaction effects on drag of a spherical particle,” AIAA J. 46, 2219–2228 (2008).17 M. Parmar, A. Haselbacher, and S. Balachandar, “Improved drag correlation for spheres and application to shock-tube
experiments,” AIAA J. 48, 1273–1276 (2010).18 G. Jourdan, L. Houas, O. Igra, J. Estivalezes, C. Devals, and E. Meshkov, “Drag coefficient of a sphere in a non-stationary
flow: new results,” Proc. R. Soc. London, Ser. A 463, 3323–3345 (2007).19 Y. Ling, A. Haselbacher, and S. Balachandar, “Importance of unsteady contributions to force and heating for particles in
compressible flows. Part 2: Application to particle dispersal by blast wave,” Int. J. Multiphase Flow 37, 1013–1025 (2011).20 M. Parmar, A. Haselbacher, and S. Balachandar, “On the unsteady inviscid force on cylinders and spheres in subcritical
compressible flow,” Philos. Trans. R. Soc. London, Ser. A 366, 2161–2175 (2008).21 A. Britan, T. Elperin, O. Igra, and J. P. Jiang, “Acceleration of a sphere behind planar shock waves,” Exp. Fluids 20, 84–90
(1995).22 A. S. Sangani, D. Z. Zhang, and A. Prosperetti, “The added mass, basset, and viscous drag coefficients in nondilute bubbly
liquids undergoing small-amplitude oscillatory motion,” Phys. Fluids A 3, 2955 (1991).23 C. Y. Wen and Y. H. Yu, “Mechanics of fluidization,” Chem. Eng. Prog., Symp. Ser. 62, 100–111 (1966).24 R. Di Felice, “The voidage function for fluid-particle interaction systems,” Int. J. Multiphase Flow 20, 153–159 (1994).25 S. Tenneti, R. Garg, and S. Subramaniam, “Drag law for monodisperse gas-solid systems using particle-resolved direct
numerical simulation of flow past fixed assemblies of spheres,” Int. J. Multiphase Flow 37, 1072–1092 (2011).26 J. Li and J. A. M. Kuipers, “Gas-particle interactions in dense gas-fluidized beds,” Chem. Eng. Sci. 58, 711–718 (2003).27 D. J. Gunn, “Transfer of heat or mass to particles in fixed and fluidised beds,” Int. J. Heat Mass Transfer 21, 467–476
(1978).28 F. Zhang, D. L. Frost, P. A. Thibault, and S. B. Murray, “Explosive dispersal of solid particles,” Shock Waves 10, 431–443
(2001).29 S. E. Harris and D. G. Crighton, “Solitons, solitary waves, and voidage disturbances in gas-fluidized beds,” J. Fluid Mech.
266, 243–276 (1994).30 M. J. Andrews and P. J. O’Rourke, “The multiphase particle-in-cell (MP-PIC) method for dense particulate flows,” Int. J.
Multiphase Flow 22, 379–402 (1996).31 D. M. Snider, P. J. O’Rourke, and M. J. Andrews, “Sediment flow in inclined vessels calculated using a multiphase
particle-in-cell model for dense particle flows,” Int. J. Multiphase Flow 24, 1359–1382 (1998).32 N. A. Patankar and D. D. Joseph, “Modeling and numerical simulation of particulate flows by the Eulerian-Lagrangian
approach,” Int. J. Multiphase Flow 27, 1659–1684 (2001).33 J. L. Wagner, S. J. Beresh, S. P. Kearney, W. M. Trott, J. N. Castaneda, B. O. Pruett, and M. R. Baer, “A multiphase shock
tube for shock wave interactions with dense particle fields,” Exp. Fluids 52, 1507–1517 (2012).34 V. M. Boiko, V. P. Kiselev, S. P. Kiselev, A. N. Papyrin, S. V. Poplavsky, and V. M. Fomin, “Shock wave interaction with
a cloud of particles,” Shock Waves 7, 275–285 (1997).
This article is copyrighted as indicated in the article. Reuse of AIP content is subject to the terms at: http://scitation.aip.org/termsconditions. Downloaded to IP:
67.79.216.66 On: Tue, 08 Apr 2014 06:28:25
113301-30 Ling et al. Phys. Fluids 24, 113301 (2012)
35 X. Rogue, G. Rodriguez, J. Haas, and R. Saurel, “Experimental and numerical investigation of the shock-induced fluidizationof a particles bed,” Shock Waves 8, 29–45 (1998).
36 R. Mei and R. J. Adrian, “Flow past a sphere with an oscillation in the free-stream velocity and unsteady drag at finiteReynolds number,” J. Fluid Mech. 237, 323–341 (1992).
37 R. Clift and W. H. Gauvin, “The motion of particles in turbulent gas streams,” Proc. Chemeca 1, 14–28 (1970).38 H. Faxen, “Der Widerstand gegen die Bewegung einer starren Kugel in einer zahen Flussigkeit, die zwischen zwei parallelen
ebenen Wanden eingeschlossen ist,” Ann. Phys. 373, 89–119 (1922).39 M. S. Liou, “A sequel to AUSM: AUSM+,” J. Comput. Phys. 129, 364–382 (1996).40 T. J. Barth, “A 3D upwind Euler solver for unstructured meshes,” AIAA Paper No. 91–1548, 1991.41 A. Haselbacher, “A WENO reconstruction algorithm for unstructured grids based on explicit stencil construction,” AIAA
Paper No. 2005–0879, 2005.42 A. Haselbacher and F. Najjar, “Multiphase flow simulations of solid-propellant rocket motors on unstructured grids,” AIAA
Paper No. 2006–1292, 2006.43 Y. Ling, A. Haselbacher, and S. Balachandar, “Transient phenomena in one-dimensional compressible gas-particle flows,”
Shock Waves 19, 67–81 (2009).44 Y. Ling, A. Haselbacher, and S. Balachandar, “A numerical source of small-scale number-density fluctuations in Eulerian-
Lagrangian simulations of multiphase flows,” J. Comput. Phys. 229, 1828–1851 (2010).45 H. Mark, “The interaction of a reflected shock wave with the boundary layer in a shock tube,” Technical Report No. TM
1418, 1958.46 L. Davies and J. L. Wilson, “Influence of reflected shock and boundary-layer interaction on shock-tube flows,” Phys. Fluids
12, 37–43 (1969).47 G. Rudinger, “Some effects of finite particle volume on the dynamics of gas-particle mixtures,” AIAA J. 3, 1217–1222
(1965).48 F. E. Marble, “Dynamics of a dusty gas,” Annu. Rev. Fluid Mech. 2, 397–446 (1970).49 M. Sommerfeld, “The unsteadiness of shock waves propagating through gas-particle mixture,” Exp. Fluids 3, 197–206
(1985).50 L. F. Henderson, “On the refraction of shock waves,” J. Fluid Mech. 198, 365–386 (1989).51 D. Ranjan, J. Oakley, and R. Bonazza, “Shock-bubble interactions,” Annu. Rev. Fluid Mech. 43, 117–140 (2011).52 K. Prestridge, P. Rightley, P. Vorobieff, R. Benjamin, and N. Kurnit, “Simultaneous density-field visualization and PIV of
a shock-accelerated gas curtain,” Exp. Fluids 29, 339–346 (2000).53 G. C. Orlicz, B. J. Balakumar, C. D. Tomkins, and K. P. Prestridge, “A mach number study of the Richtmyer-Meshkov
instability in a varicose, heavy-gas curtain,” Phys. Fluids 21, 064102 (2009).54 D. L. Koch and R. J. Hill, “Inertial effects in suspension and porous-media flows,” Annu. Rev. Fluid Mech. 33, 619–647
(2001).55 D. Gidaspow, “Hydrodynamics of fiuidizatlon and heat transfer: Supercomputer modeling,” Appl. Mech. Rev. 39, 1–23
(1986).56 N. Zuber, “On the dispersed two-phase flow in the laminar flow regime,” Chem. Eng. Sci. 19, 897–917 (1964).57 T. W. Fox, C. W. Rackett, and J. A. Nicholls, “Shock wave ignition of magnesium powders,” in Proceedings of 11th
International Symposium on Shock Tubes and Waves (University of Washington Press, Seattle, WA, 1978), pp. 262–268.58 Z. G. Feng and E. E. Michaelides, “Unsteady heat transfer from a sphere at small Peclet numbers,” ASME Trans. J. Fluids
Eng. 118, 96–102 (1996).
This article is copyrighted as indicated in the article. Reuse of AIP content is subject to the terms at: http://scitation.aip.org/termsconditions. Downloaded to IP:
67.79.216.66 On: Tue, 08 Apr 2014 06:28:25