interaction between the amount of dietary protein and the
TRANSCRIPT

Alemán et al. Genes & Nutrition (2019) 14:19 https://doi.org/10.1186/s12263-019-0642-x
RESEARCH Open Access
Interaction between the amount of dietary
protein and the environmental temperatureon the expression of browning markers inadipose tissue of rats Gabriela Alemán1, Ana Laura Castro1, Ana Vigil-Martínez1, Ivan Torre-Villalvazo1, Andrea Díaz-Villaseñor1,2,Lilia G. Noriega1, Isabel Medina-Vera3, Guillermo Ordáz1, Nimbe Torres1 and Armando R. Tovar1*Abstract
Background: A low-protein diet increases the expression and circulating concentration of FGF21. FGF21stimulates the browning process of WAT by enhancing the expression of UCP1 coupled with an increase inPGC1α. Interestingly, the consumption of a low-protein diet could stimulate WAT differentiation into beige/brite cells by increasing FGF21 expression and Ucp1 mRNA abundance. However, whether the stimulus of alow-protein diet on WAT browning can synergistically interact with another browning stimulus, such as coldexposure, remains elusive.
Results: In the present study, rats were fed 6% (low), 20% (adequate), or 50% (high) dietary protein for 10 days andsubsequently exposed to 4 °C for 72 h. Body weight, food intake, and energy expenditure were measured, as well asWAT browning and BAT thermogenesis markers and FGF21 circulating levels. The results showed that during coldexposure, the consumption of a high-protein diet reduced UCP1, TBX1, Cidea, Cd137, and Prdm16 in WAT whencompared with the consumption of a low-protein diet. In contrast, at room temperature, a low-protein diet increasedthe expression of UCP1, Cidea, and Prdm16 associated with an increase in FGF21 expression and circulating levels whencompared with a consumption of a high-protein diet. Consequently, the consumption of a low-protein diet increasedenergy expenditure.
Conclusions: These results indicate that in addition to the environmental temperature, WAT browning is nutritionallymodulated by dietary protein, affecting whole-body energy expenditure.
Keywords: Dietary protein, Browning, Cold exposure, FGF21, Brown adipose tissue
BackgroundAdipose tissue in mammals is largely composed of twotypes of adipocytes, white adipocytes that form white adi-pose tissue (WAT) and brown adipocytes that form brownadipose tissue (BAT), and both tissues use glucose andfatty acids [1] to regulate energy storage and energy ex-penditure [2, 3]. Research in the last several years hasshown that WAT can be induced to “browning” under
© The Author(s). 2019 Open Access This articInternational License (http://creativecommonsreproduction in any medium, provided you gthe Creative Commons license, and indicate if(http://creativecommons.org/publicdomain/ze
* Correspondence: [email protected] of Fisiología de la Nutrición, Instituto Nacional de CienciasMédicas y Nutrición Salvador Zubirán, Ciudad de México, Av. Vasco deQuiroga No. 15, Col. Belisario Domínguez Sección XVI, 14080 México, D.F,MexicoFull list of author information is available at the end of the article
circumstances, such as cold exposure, nutrient availability,or β-adrenergic stimulation [4–7]. The brown-like cellsthat appear in regular WAT have been called “beige” or“brite” (brown in white) adipocytes [8], characterized byan increase in uncoupling protein 1 (UCP1) expressionalong with specific markers, such as PRDM16 and CIDEA.Several pharmacological and nutritional stimuli have beenrelated to the process of WAT browning, includingPPARα or PPARγ agonists, methionine or leucine restric-tion, capsaicin, and high-fat diet [4, 9]; there is evidencethat the amount of dietary protein can modify the brown-ing process of WAT [10–12].
le is distributed under the terms of the Creative Commons Attribution 4.0.org/licenses/by/4.0/), which permits unrestricted use, distribution, andive appropriate credit to the original author(s) and the source, provide a link tochanges were made. The Creative Commons Public Domain Dedication waiverro/1.0/) applies to the data made available in this article, unless otherwise stated.
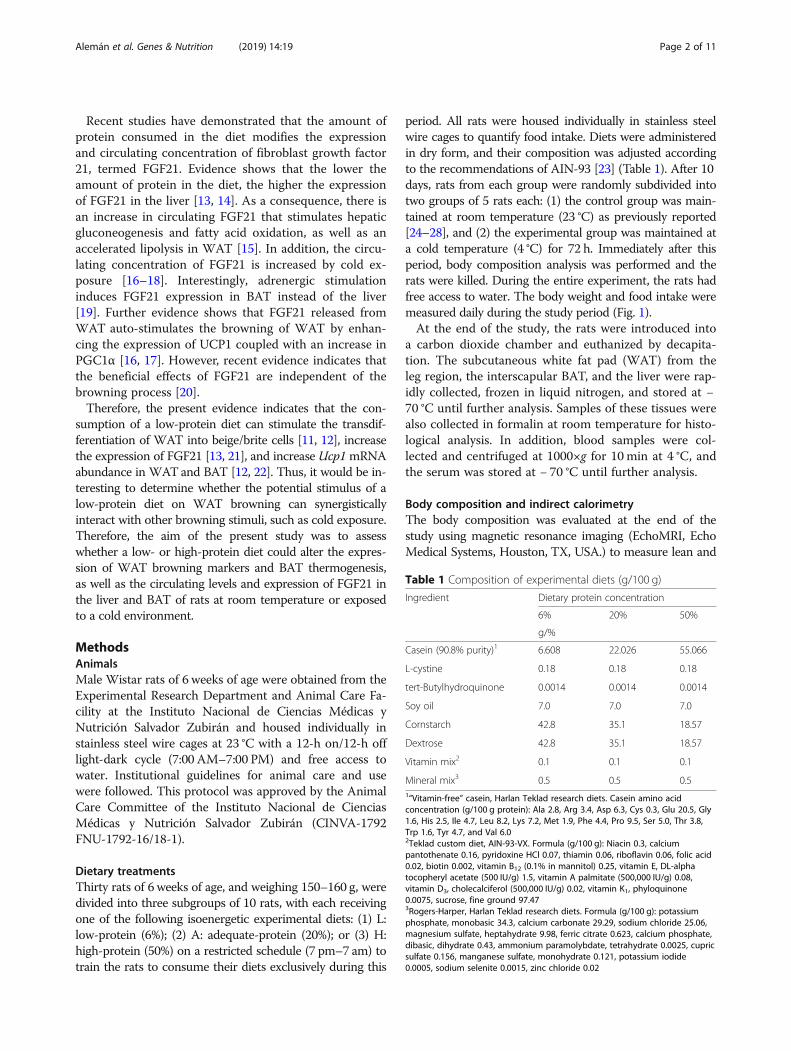
Table 1 Composition of experimental diets (g/100 g)
Ingredient Dietary protein concentration
6% 20% 50%
g/%
Casein (90.8% purity)1 6.608 22.026 55.066
L-cystine 0.18 0.18 0.18
tert-Butylhydroquinone 0.0014 0.0014 0.0014
Soy oil 7.0 7.0 7.0
Cornstarch 42.8 35.1 18.57
Dextrose 42.8 35.1 18.57
Vitamin mix2 0.1 0.1 0.1
Mineral mix3 0.5 0.5 0.51“Vitamin-free” casein, Harlan Teklad research diets. Casein amino acidconcentration (g/100 g protein): Ala 2.8, Arg 3.4, Asp 6.3, Cys 0.3, Glu 20.5, Gly1.6, His 2.5, Ile 4.7, Leu 8.2, Lys 7.2, Met 1.9, Phe 4.4, Pro 9.5, Ser 5.0, Thr 3.8,Trp 1.6, Tyr 4.7, and Val 6.02Teklad custom diet, AIN-93-VX. Formula (g/100 g): Niacin 0.3, calciumpantothenate 0.16, pyridoxine HCl 0.07, thiamin 0.06, riboflavin 0.06, folic acid0.02, biotin 0.002, vitamin B12 (0.1% in mannitol) 0.25, vitamin E, DL-alphatocopheryl acetate (500 IU/g) 1.5, vitamin A palmitate (500,000 IU/g) 0.08,vitamin D3, cholecalciferol (500,000 IU/g) 0.02, vitamin K1, phyloquinone0.0075, sucrose, fine ground 97.473Rogers-Harper, Harlan Teklad research diets. Formula (g/100 g): potassiumphosphate, monobasic 34.3, calcium carbonate 29.29, sodium chloride 25.06,magnesium sulfate, heptahydrate 9.98, ferric citrate 0.623, calcium phosphate,dibasic, dihydrate 0.43, ammonium paramolybdate, tetrahydrate 0.0025, cupricsulfate 0.156, manganese sulfate, monohydrate 0.121, potassium iodide0.0005, sodium selenite 0.0015, zinc chloride 0.02
Alemán et al. Genes & Nutrition (2019) 14:19 Page 2 of 11
Recent studies have demonstrated that the amount ofprotein consumed in the diet modifies the expressionand circulating concentration of fibroblast growth factor21, termed FGF21. Evidence shows that the lower theamount of protein in the diet, the higher the expressionof FGF21 in the liver [13, 14]. As a consequence, there isan increase in circulating FGF21 that stimulates hepaticgluconeogenesis and fatty acid oxidation, as well as anaccelerated lipolysis in WAT [15]. In addition, the circu-lating concentration of FGF21 is increased by cold ex-posure [16–18]. Interestingly, adrenergic stimulationinduces FGF21 expression in BAT instead of the liver[19]. Further evidence shows that FGF21 released fromWAT auto-stimulates the browning of WAT by enhan-cing the expression of UCP1 coupled with an increase inPGC1α [16, 17]. However, recent evidence indicates thatthe beneficial effects of FGF21 are independent of thebrowning process [20].Therefore, the present evidence indicates that the con-
sumption of a low-protein diet can stimulate the transdif-ferentiation of WAT into beige/brite cells [11, 12], increasethe expression of FGF21 [13, 21], and increase Ucp1mRNAabundance in WATand BAT [12, 22]. Thus, it would be in-teresting to determine whether the potential stimulus of alow-protein diet on WAT browning can synergisticallyinteract with other browning stimuli, such as cold exposure.Therefore, the aim of the present study was to assesswhether a low- or high-protein diet could alter the expres-sion of WAT browning markers and BAT thermogenesis,as well as the circulating levels and expression of FGF21 inthe liver and BAT of rats at room temperature or exposedto a cold environment.
MethodsAnimalsMale Wistar rats of 6 weeks of age were obtained from theExperimental Research Department and Animal Care Fa-cility at the Instituto Nacional de Ciencias Médicas yNutrición Salvador Zubirán and housed individually instainless steel wire cages at 23 °C with a 12-h on/12-h offlight-dark cycle (7:00 AM–7:00 PM) and free access towater. Institutional guidelines for animal care and usewere followed. This protocol was approved by the AnimalCare Committee of the Instituto Nacional de CienciasMédicas y Nutrición Salvador Zubirán (CINVA-1792FNU-1792-16/18-1).
Dietary treatmentsThirty rats of 6 weeks of age, and weighing 150–160 g, weredivided into three subgroups of 10 rats, with each receivingone of the following isoenergetic experimental diets: (1) L:low-protein (6%); (2) A: adequate-protein (20%); or (3) H:high-protein (50%) on a restricted schedule (7 pm–7 am) totrain the rats to consume their diets exclusively during this
period. All rats were housed individually in stainless steelwire cages to quantify food intake. Diets were administeredin dry form, and their composition was adjusted accordingto the recommendations of AIN-93 [23] (Table 1). After 10days, rats from each group were randomly subdivided intotwo groups of 5 rats each: (1) the control group was main-tained at room temperature (23 °C) as previously reported[24–28], and (2) the experimental group was maintained ata cold temperature (4 °C) for 72 h. Immediately after thisperiod, body composition analysis was performed and therats were killed. During the entire experiment, the rats hadfree access to water. The body weight and food intake weremeasured daily during the study period (Fig. 1).At the end of the study, the rats were introduced into
a carbon dioxide chamber and euthanized by decapita-tion. The subcutaneous white fat pad (WAT) from theleg region, the interscapular BAT, and the liver were rap-idly collected, frozen in liquid nitrogen, and stored at −70 °C until further analysis. Samples of these tissues werealso collected in formalin at room temperature for histo-logical analysis. In addition, blood samples were col-lected and centrifuged at 1000×g for 10 min at 4 °C, andthe serum was stored at − 70 °C until further analysis.
Body composition and indirect calorimetryThe body composition was evaluated at the end of thestudy using magnetic resonance imaging (EchoMRI, EchoMedical Systems, Houston, TX, USA.) to measure lean and

Fig. 1 Experimental design timeline
Alemán et al. Genes & Nutrition (2019) 14:19 Page 3 of 11
fat mass. The scannings were performed by introducing theanimals in a thin-walled plastic cylinder (3mm thick, 6.8cm internal diameter), and a cylindrical plastic insert tolimit the rat movement. While in the cylinder, the animalswere briefly subjected to a low intensity electromagneticfield (0.05 Tesla) for 2min.Energy expenditure analysis was assessed by indirect cal-
orimetry using the Oxymax CLAMS system (Comprehen-sive Lab Animal Monitoring System, Columbus, OH, USA)at the end of the study. The rats were food-deprived for 6 hfor fasting recordings and were fed their corresponding di-ets for the next 18 h. The animals were placed in a polycar-bonate plastic chamber with a constant air flow that wasmonitored by a mass-sensitive flow meter and analyzed byan O2 and CO2 sensor. Oxygen consumption and CO2 gen-eration were continuously measured throughout the test.Respiratory exchange ratio (RER) was calculated as the vol-ume of CO2 produced (VCO2 ml kg−1 h−1) divided by thevolume of O2 consumed (VO2 ml kg−1 h− 1).
Serum biochemical variablesSerum glucose was measured using a glucose analyzer(Model 2700, YSI Inc.). Serum triacylglycerols (TG) weremeasured with a commercial enzymatic colorimetric kit(DiaSys Diagnostic Systems International, Holzheim,Germany) in a Beckman DU 640 spectrophotometer. Theserum FGF21 concentration was determined by ELISA(rat/mouse fibroblast growth factor-21 (FGF21) Elisa Kit,EMD Millipore).
Quantitative real-time PCRTotal RNA was extracted from the liver, WAT, and BAT ofrats as described by Chomczynski and Sacchi [29], and theRNA integrity, concentration, and purity were measured.The synthesis of cDNAs was performed with M-MLV
reverse transcriptase and oligo-(dT)12–18 primer (Invitro-gen). The concentrations of specific mRNAs were mea-sured by real-time quantitative PCR using TaqManUniversal Master Mix (Applied Biosystems/Roche, Branch-burg, NJ, USA) with an ABI Prism 7000 Sequence Detec-tion System (Applied Biosystems, Foster City, CA).TaqMan fluorogenic probes and oligonucleotide primerswere obtained from Applied Biosystems for the followinggenes: peroxisome proliferator-activated receptor coactiva-tor 1-α (Pgc-1α; Rn00580241 m1), and T-box 1 (Tbx1;Rn01405403_m1) and uncoupling protein-1 (Ucp1;Rn00562126_m1). Hypoxanthine phosphoribosyltransferase(Hprt) (Rn01527840_m1) was used as the invariant controlfor BAT and WAT. The relative amounts of all mRNAsamples were calculated using the comparative CT method[30, 31]. The expression of PR domain containing 16(Prdm16), tumor necrosis factor receptor superfamily,member 9 (CD137/Tnfrs9), cell death-inducing DNA frag-mentation factor-α-like effector A (Cidea), Fgf21, and Hprtgenes was determined by the SYBR green PCR kit (Roche)with the following pairs of primers: 5′-aggcccctgtctacattcct-3′ and 5′-tctcctgggatgacacctct-3′ for Prdm16, 5′-gacttcctcggctgtctcaa-3′ and 5′-ttctgtgtcacccagtgctc-3′ for Cidea, 5′-acaccgcagtccagaaagtc-3′ and 5′-caggcctcaggatcaaagtg-3′ forCD137, 5′-ctggtgaaaaggacctctcg-3′ and 5′-ggccacatcaacaggactct-3′ for Hprt as housekeeping gene. All primers weredesigned with at least one primer spanning an exon-exonboundary.
ImmunoblottingTissues were homogenized at 4 °C in ice-cold RIPA buf-fer containing phosphate-buffered saline (PBS), 1% IGEPAL, 0.5% sodium deoxycholate, 0.1% sodium dodecylsulfate, 1 mmol/L sodium fluoride, 2 mmol/L sodiumorthovanadate, and 1 tablet/10mL of protease inhibitor

Alemán et al. Genes & Nutrition (2019) 14:19 Page 4 of 11
mixture (Complete Mini, Roche Diagnostics). The ex-tracts were stored at − 70 °C until further use. The pro-tein concentration was determined with the Lowrymethod. Total protein from each rat tissue (20 μg each)was separated on a 7% SDS-polyacrylamide gel andtransferred to a PVDF membrane (Hybond-P, Amer-sham) through electroblotting (Trans-Blot, Bio-Rad).The membranes were blocked for 1 h with 5% non-fatdry milk, washed 3 times for 5 min each with Tris-buffered saline containing 0.1% Tween (TBS-T), and in-cubated with primary antibody diluted in blocking solu-tion overnight. Primary antibodies against the followingproteins were used: TBX-1 (1:1000) (Santa Cruz Biotech-nology), FGF21 (1:750), PGC-1α (1:250), and UCP1(1:3000) (Abcam). The membranes were washed threetimes with TBS-T for 10 min and later incubated withhorseradish peroxidase- conjugated secondary antibody(1:3500) for 1.5 h. Visualization was performed using achemiluminescent detection reagent (Millipore, MA,USA). Digital images of the membranes were obtained by aChemiDoc MP densitometer and processed by Image Labsoftware (Bio-Rad, Hercules, CA, USA). The results are re-ported relative to GAPDH (liver, BAT) and γ-tubulin(WAT and BAT). A value of 1 was arbitrarily assigned tothe 20% room temperature group, which were used as areference for the other conditions.
Immunofluorescence analysesSamples of BAT and subcutaneous WAT were dissected,immediately fixed with ice-cold 4% (w/v) paraformaldehydein PBS, and embedded in paraffin, and sections of 4 μmwere obtained. The sections were deparaffinized at 60 °Cfor 20min, immersed in xylene, rehydrated through gradedethanol solutions, and finally in distilled water. The sectionswere washed with 1X PBS and blocked with 10% rabbitserum (Santa Cruz Biotechnology) for 30min at roomtemperature. The sections were subsequently incubatedwith rabbit anti-UCP1 1:100 (Abcam) at room temperaturefor 1 h. After washing with 1X PBS, the sections were incu-bated with goat anti-rabbit FITC-conjugated secondaryantibody (1:500; Santa Cruz Biotechnology) at roomtemperature for 1 h. The sections were washed again with1X PBS, mounted with UltraCruz™ mounting medium(Santa Cruz Biotechnology), and viewed on a Leica DM750microscope (Leica, Wetzlar, Germany).
Statistical analysisThe values are expressed as the means ± SEM. Data wereassessed using the Kolmogorov-Smirnov Z test to examinethe distribution type; all results exhibited a normal distribu-tion. Two-way ANOVA was used to determine the main ef-fects of diet (% protein) and environmental temperature(room temperature 23 °C vs. cold exposure 4 °C) and theirinteraction. When a significant interaction effect was found,
the differences between all groups were determined usingFisher’s protected least significant difference test. The datawere analyzed by using GraphPad Prism (version 7.0 GraphPad Software, Inc.). Analysis of covariance (ANCOVA) forenergy expenditure and body weight in rats fed with differ-ent dietary protein concentrations was performed usingSPSS for Mac (version 21). All analyses were performed atleast 3 times to ensure reproducibility. The differences wereconsidered statistically significant at P < 0.05. Mean valueswith different lowercase letters show statistical differencesbetween each other (a> b> c> d> e).
ResultsBody weight, food intake, and biochemical variables inrats fed with different amounts of dietary proteinexposed at room and cold temperatureWe first analyzed the effect of the amount of dietaryprotein on body weight gain and food intake in ratsmaintained at room temperature or exposed to a coldenvironment. The data showed that in those rats main-tained at room temperature during the 3-day experimen-tal period, there was no significant difference in bodyweight gain; however, rats fed 20% or 50% dietary pro-tein tended to have a higher body weight than those fed6%. Interestingly, rats exposed to a cold environment for72 h had a significant reduction in body weight that didnot differ among groups; however, those fed 50% dietaryprotein tended to lose less body weight (Table 2). Thechanges in the six experimental groups showed no sig-nificant difference in food intake expressed as gram perday or kilocalorie per day, since the diets were isocaloric.Nonetheless, the amount of protein consumed was ac-cording to the protein content of the diet. Notably, theamount of protein consumed for the correspondinggroups under room or cold temperature conditions didnot show a significant difference. Interestingly, despitethe protein content in the diet or temperature differ-ences, the rats maintained their percentage of fat andlean body mass. Serum blood glucose and triglycerideswere significantly higher in rats exposed to a cold envir-onment by approximately 9% and 69%, respectively,compared to those maintained at room temperature,without a significant difference with regard to the pro-tein content of the diet.
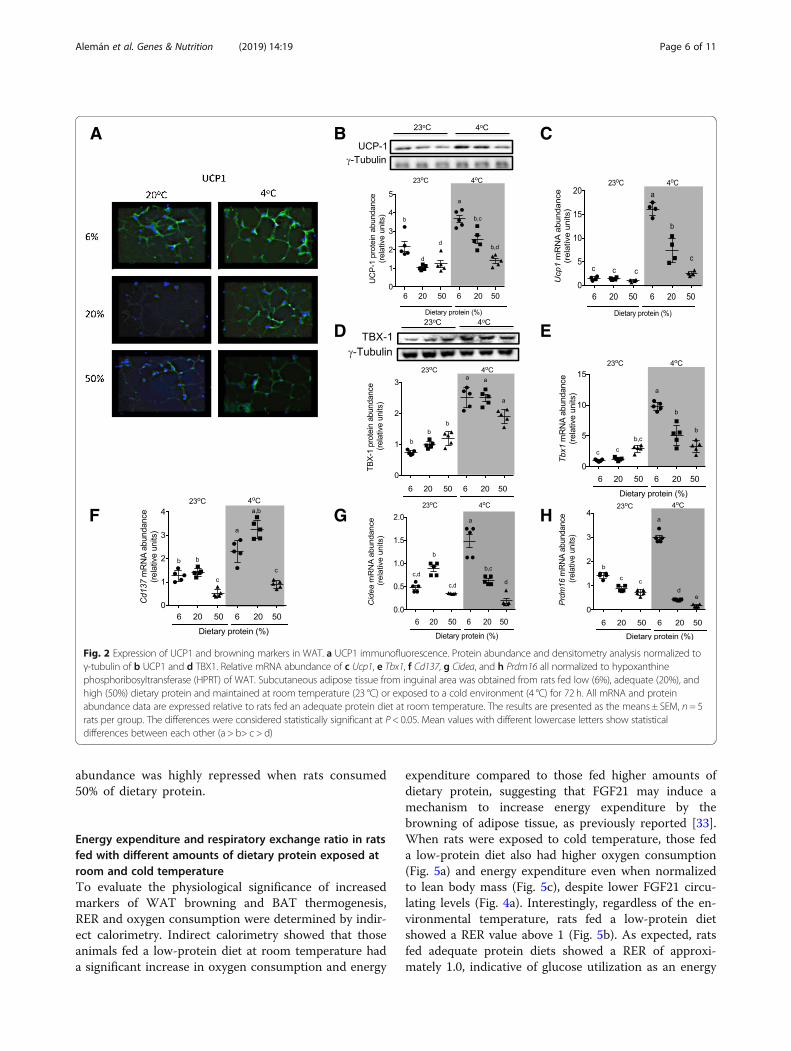
Expression of WAT browning markers in rats fed withdifferent amounts of dietary protein exposed at roomand cold temperatureNext, we assessed the effect of the consumption of differentamounts of dietary protein on the WAT browning. As ex-pected, rats exposed to a cold environment showed a sig-nificantly increased expression of UCP1 and all of thebrowning markers, particularly TBX1 (Fig. 2d, e). Interest-ingly, these data clearly showed that the consumption of a
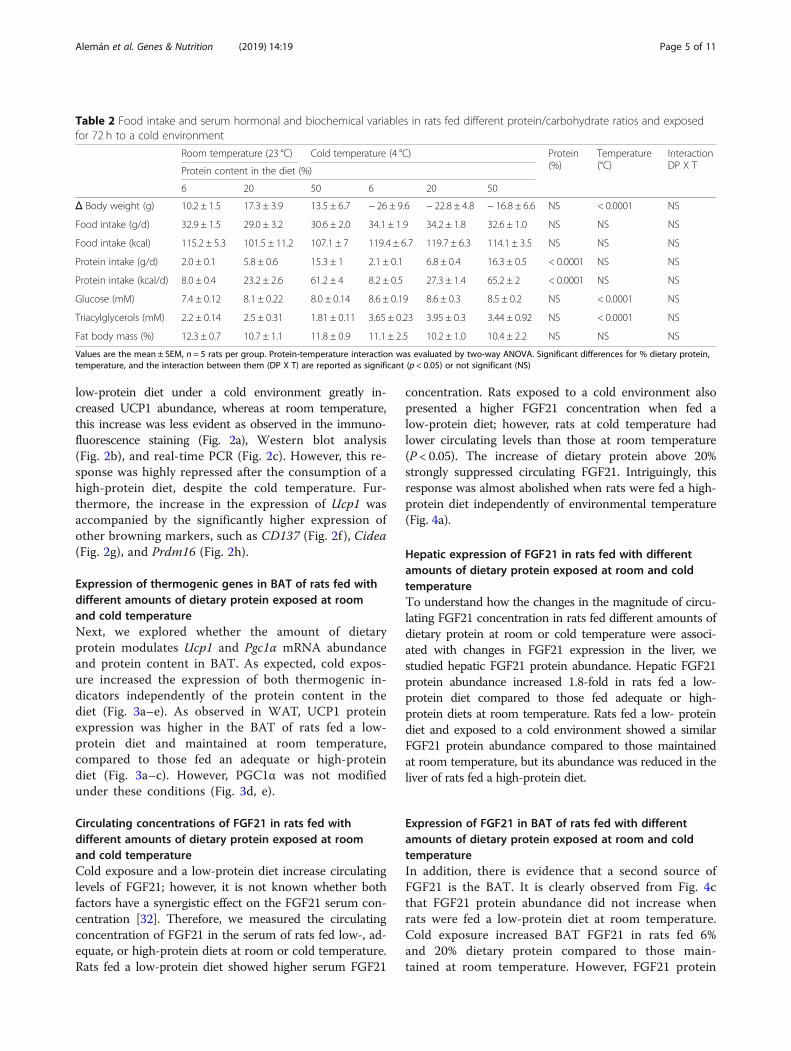
Table 2 Food intake and serum hormonal and biochemical variables in rats fed different protein/carbohydrate ratios and exposedfor 72 h to a cold environment
Room temperature (23 °C) Cold temperature (4 °C) Protein(%)
Temperature(°C)
InteractionDP X TProtein content in the diet (%)
6 20 50 6 20 50
Δ Body weight (g) 10.2 ± 1.5 17.3 ± 3.9 13.5 ± 6.7 − 26 ± 9.6 − 22.8 ± 4.8 − 16.8 ± 6.6 NS < 0.0001 NS
Food intake (g/d) 32.9 ± 1.5 29.0 ± 3.2 30.6 ± 2.0 34.1 ± 1.9 34.2 ± 1.8 32.6 ± 1.0 NS NS NS
Food intake (kcal) 115.2 ± 5.3 101.5 ± 11.2 107.1 ± 7 119.4 ± 6.7 119.7 ± 6.3 114.1 ± 3.5 NS NS NS
Protein intake (g/d) 2.0 ± 0.1 5.8 ± 0.6 15.3 ± 1 2.1 ± 0.1 6.8 ± 0.4 16.3 ± 0.5 < 0.0001 NS NS
Protein intake (kcal/d) 8.0 ± 0.4 23.2 ± 2.6 61.2 ± 4 8.2 ± 0.5 27.3 ± 1.4 65.2 ± 2 < 0.0001 NS NS
Glucose (mM) 7.4 ± 0.12 8.1 ± 0.22 8.0 ± 0.14 8.6 ± 0.19 8.6 ± 0.3 8.5 ± 0.2 NS < 0.0001 NS
Triacylglycerols (mM) 2.2 ± 0.14 2.5 ± 0.31 1.81 ± 0.11 3.65 ± 0.23 3.95 ± 0.3 3.44 ± 0.92 NS < 0.0001 NS
Fat body mass (%) 12.3 ± 0.7 10.7 ± 1.1 11.8 ± 0.9 11.1 ± 2.5 10.2 ± 1.0 10.4 ± 2.2 NS NS NS
Values are the mean ± SEM, n = 5 rats per group. Protein-temperature interaction was evaluated by two-way ANOVA. Significant differences for % dietary protein,temperature, and the interaction between them (DP X T) are reported as significant (p < 0.05) or not significant (NS)
Alemán et al. Genes & Nutrition (2019) 14:19 Page 5 of 11
low-protein diet under a cold environment greatly in-creased UCP1 abundance, whereas at room temperature,this increase was less evident as observed in the immuno-fluorescence staining (Fig. 2a), Western blot analysis(Fig. 2b), and real-time PCR (Fig. 2c). However, this re-sponse was highly repressed after the consumption of ahigh-protein diet, despite the cold temperature. Fur-thermore, the increase in the expression of Ucp1 wasaccompanied by the significantly higher expression ofother browning markers, such as CD137 (Fig. 2f ), Cidea(Fig. 2g), and Prdm16 (Fig. 2h).
Expression of thermogenic genes in BAT of rats fed withdifferent amounts of dietary protein exposed at roomand cold temperatureNext, we explored whether the amount of dietaryprotein modulates Ucp1 and Pgc1α mRNA abundanceand protein content in BAT. As expected, cold expos-ure increased the expression of both thermogenic in-dicators independently of the protein content in thediet (Fig. 3a–e). As observed in WAT, UCP1 proteinexpression was higher in the BAT of rats fed a low-protein diet and maintained at room temperature,compared to those fed an adequate or high-proteindiet (Fig. 3a–c). However, PGC1α was not modifiedunder these conditions (Fig. 3d, e).
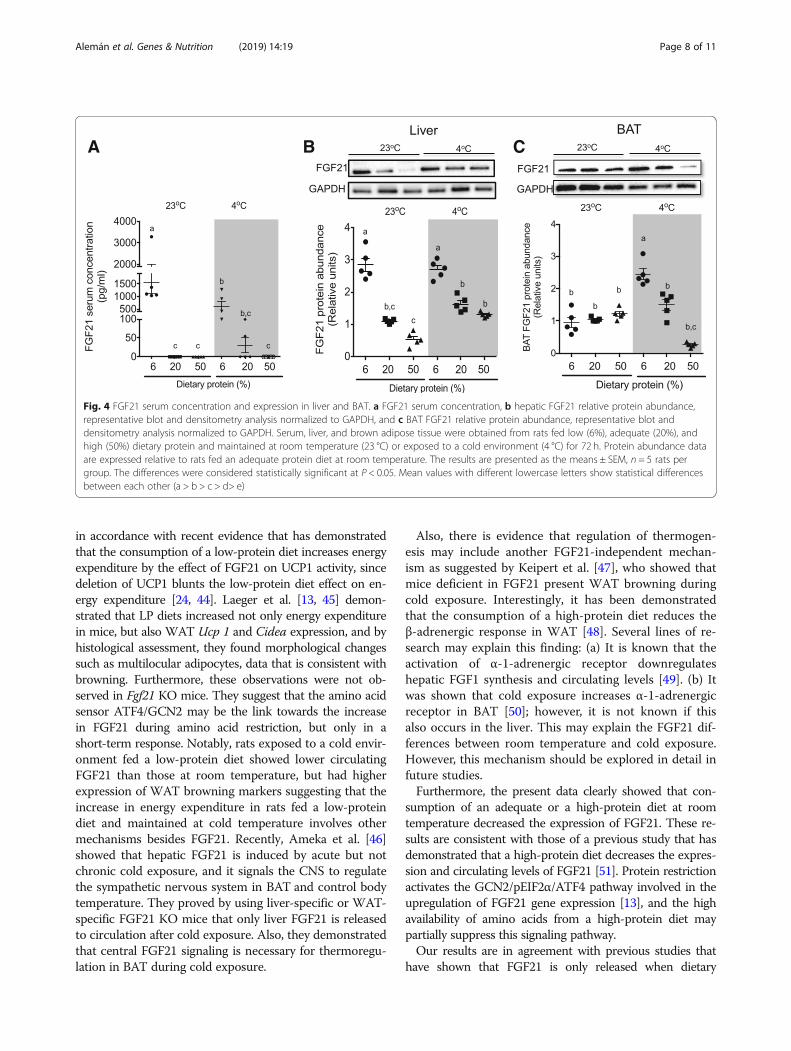
Circulating concentrations of FGF21 in rats fed withdifferent amounts of dietary protein exposed at roomand cold temperatureCold exposure and a low-protein diet increase circulatinglevels of FGF21; however, it is not known whether bothfactors have a synergistic effect on the FGF21 serum con-centration [32]. Therefore, we measured the circulatingconcentration of FGF21 in the serum of rats fed low-, ad-equate, or high-protein diets at room or cold temperature.Rats fed a low-protein diet showed higher serum FGF21
concentration. Rats exposed to a cold environment alsopresented a higher FGF21 concentration when fed alow-protein diet; however, rats at cold temperature hadlower circulating levels than those at room temperature(P < 0.05). The increase of dietary protein above 20%strongly suppressed circulating FGF21. Intriguingly, thisresponse was almost abolished when rats were fed a high-protein diet independently of environmental temperature(Fig. 4a).
Hepatic expression of FGF21 in rats fed with differentamounts of dietary protein exposed at room and coldtemperatureTo understand how the changes in the magnitude of circu-lating FGF21 concentration in rats fed different amounts ofdietary protein at room or cold temperature were associ-ated with changes in FGF21 expression in the liver, westudied hepatic FGF21 protein abundance. Hepatic FGF21protein abundance increased 1.8-fold in rats fed a low-protein diet compared to those fed adequate or high-protein diets at room temperature. Rats fed a low- proteindiet and exposed to a cold environment showed a similarFGF21 protein abundance compared to those maintainedat room temperature, but its abundance was reduced in theliver of rats fed a high-protein diet.
Expression of FGF21 in BAT of rats fed with differentamounts of dietary protein exposed at room and coldtemperatureIn addition, there is evidence that a second source ofFGF21 is the BAT. It is clearly observed from Fig. 4cthat FGF21 protein abundance did not increase whenrats were fed a low-protein diet at room temperature.Cold exposure increased BAT FGF21 in rats fed 6%and 20% dietary protein compared to those main-tained at room temperature. However, FGF21 protein
A B C
D E
GF H
Fig. 2 Expression of UCP1 and browning markers in WAT. a UCP1 immunofluorescence. Protein abundance and densitometry analysis normalized toγ-tubulin of b UCP1 and d TBX1. Relative mRNA abundance of c Ucp1, e Tbx1, f Cd137, g Cidea, and h Prdm16 all normalized to hypoxanthinephosphoribosyltransferase (HPRT) of WAT. Subcutaneous adipose tissue from inguinal area was obtained from rats fed low (6%), adequate (20%), andhigh (50%) dietary protein and maintained at room temperature (23 °C) or exposed to a cold environment (4 °C) for 72 h. All mRNA and proteinabundance data are expressed relative to rats fed an adequate protein diet at room temperature. The results are presented as the means ± SEM, n = 5rats per group. The differences were considered statistically significant at P < 0.05. Mean values with different lowercase letters show statisticaldifferences between each other (a > b> c > d)
Alemán et al. Genes & Nutrition (2019) 14:19 Page 6 of 11
abundance was highly repressed when rats consumed50% of dietary protein.
Energy expenditure and respiratory exchange ratio in ratsfed with different amounts of dietary protein exposed atroom and cold temperatureTo evaluate the physiological significance of increasedmarkers of WAT browning and BAT thermogenesis,RER and oxygen consumption were determined by indir-ect calorimetry. Indirect calorimetry showed that thoseanimals fed a low-protein diet at room temperature hada significant increase in oxygen consumption and energy
expenditure compared to those fed higher amounts ofdietary protein, suggesting that FGF21 may induce amechanism to increase energy expenditure by thebrowning of adipose tissue, as previously reported [33].When rats were exposed to cold temperature, those feda low-protein diet also had higher oxygen consumption(Fig. 5a) and energy expenditure even when normalizedto lean body mass (Fig. 5c), despite lower FGF21 circu-lating levels (Fig. 4a). Interestingly, regardless of the en-vironmental temperature, rats fed a low-protein dietshowed a RER value above 1 (Fig. 5b). As expected, ratsfed adequate protein diets showed a RER of approxi-mately 1.0, indicative of glucose utilization as an energy

A B C
D E
Fig. 3 mRNA abundance and protein expression of genes associated with thermogenesis in BAT. a UCP1 immunofluorescence. Representative blotsand densitometry analysis normalized to γ-tubulin of b UCP1 and d PGC-1α. Relative mRNA abundance of c Ucp1 and e Pgc-1훼. Brown adipose tissuewas obtained from rats fed low (6%), adequate (20%), and high (50%) dietary protein and maintained at room temperature (23 °C) or exposed to acold environment (4 °C) for 72 h. All mRNA and protein abundance data are expressed relative to rats fed an adequate protein diet at roomtemperature. The results are presented as the means ± SEM, n = 5 rats per group. The differences were considered statistically significant at P < 0.05.Mean values with different lowercase letters show statistical differences between each other (a > b > c> d)
Alemán et al. Genes & Nutrition (2019) 14:19 Page 7 of 11
substrate, whereas rats fed a high- protein diet had a 0.9RER, showing that an excess of amino acids is used asenergy substrates (Fig. 5b).
DiscussionDue to the worldwide epidemic of obesity, several mecha-nisms of energy expenditure regulation have been exten-sively studied [34, 35]. Diet has been investigated as a keyelement in the regulation of the energy balance [36–39].Several studies have demonstrated that dietary proteinconsumption can affect energy expenditure; however, theresults have been contradictory, due to a wide range of ex-perimental designs including length of exposure to thediet, type and amount of protein, species, etc. [24, 40–43].Studies in humans show that total energy expenditure issignificantly lower in subjects fed with the low proteincompared to those fed adequate or high-protein diet [40].They suggest that changes in body composition in leanbody mass and fat storage due to the consumption of dif-ferent amounts of dietary protein can alter energy expend-iture. In our study, we did not observe significant changes
in body composition in rats fed different concentrations ofdietary protein in part due to the short period of exposureto the experimental conditions (Table 2). However, an-other study did not show an effect on postprandial restingenergy expenditure in subjects fed different amounts ofdietary protein [42]. A study in rats shows that switchingdiets from an adequate protein diet (14%) to a high-protein diet (55%) for 1, 3, 6, or 14 days did not changetotal or resting energy expenditure, but there was only anincrease in respiratory quotient after diet switching [43].This indicates that the time of adaptation to changes in thediet is very important and thus affects energy expenditureobservations, explaining in part controversial results in ani-mals and humans. The present study showed that the con-sumption of a low-protein diet at room temperatureincreased energy expenditure. Recent evidence has linkedFGF21 with energy expenditure by its ability to activateWAT browning and thermogenesis [32]. Our resultsshowed that the increase in circulating FGF21 in rats fed alow-protein diet was associated with an increase in Ucp1mRNA and protein expression in WAT. These results are
A B C
Fig. 4 FGF21 serum concentration and expression in liver and BAT. a FGF21 serum concentration, b hepatic FGF21 relative protein abundance,representative blot and densitometry analysis normalized to GAPDH, and c BAT FGF21 relative protein abundance, representative blot anddensitometry analysis normalized to GAPDH. Serum, liver, and brown adipose tissue were obtained from rats fed low (6%), adequate (20%), andhigh (50%) dietary protein and maintained at room temperature (23 °C) or exposed to a cold environment (4 °C) for 72 h. Protein abundance dataare expressed relative to rats fed an adequate protein diet at room temperature. The results are presented as the means ± SEM, n = 5 rats pergroup. The differences were considered statistically significant at P < 0.05. Mean values with different lowercase letters show statistical differencesbetween each other (a > b > c > d> e)
Alemán et al. Genes & Nutrition (2019) 14:19 Page 8 of 11
in accordance with recent evidence that has demonstratedthat the consumption of a low-protein diet increases energyexpenditure by the effect of FGF21 on UCP1 activity, sincedeletion of UCP1 blunts the low-protein diet effect on en-ergy expenditure [24, 44]. Laeger et al. [13, 45] demon-strated that LP diets increased not only energy expenditurein mice, but also WAT Ucp 1 and Cidea expression, and byhistological assessment, they found morphological changessuch as multilocular adipocytes, data that is consistent withbrowning. Furthermore, these observations were not ob-served in Fgf21 KO mice. They suggest that the amino acidsensor ATF4/GCN2 may be the link towards the increasein FGF21 during amino acid restriction, but only in ashort-term response. Notably, rats exposed to a cold envir-onment fed a low-protein diet showed lower circulatingFGF21 than those at room temperature, but had higherexpression of WAT browning markers suggesting that theincrease in energy expenditure in rats fed a low-proteindiet and maintained at cold temperature involves othermechanisms besides FGF21. Recently, Ameka et al. [46]showed that hepatic FGF21 is induced by acute but notchronic cold exposure, and it signals the CNS to regulatethe sympathetic nervous system in BAT and control bodytemperature. They proved by using liver-specific or WAT-specific FGF21 KO mice that only liver FGF21 is releasedto circulation after cold exposure. Also, they demonstratedthat central FGF21 signaling is necessary for thermoregu-lation in BAT during cold exposure.
Also, there is evidence that regulation of thermogen-esis may include another FGF21-independent mechan-ism as suggested by Keipert et al. [47], who showed thatmice deficient in FGF21 present WAT browning duringcold exposure. Interestingly, it has been demonstratedthat the consumption of a high-protein diet reduces theβ-adrenergic response in WAT [48]. Several lines of re-search may explain this finding: (a) It is known that theactivation of α-1-adrenergic receptor downregulateshepatic FGF1 synthesis and circulating levels [49]. (b) Itwas shown that cold exposure increases α-1-adrenergicreceptor in BAT [50]; however, it is not known if thisalso occurs in the liver. This may explain the FGF21 dif-ferences between room temperature and cold exposure.However, this mechanism should be explored in detail infuture studies.Furthermore, the present data clearly showed that con-
sumption of an adequate or a high-protein diet at roomtemperature decreased the expression of FGF21. These re-sults are consistent with those of a previous study that hasdemonstrated that a high-protein diet decreases the expres-sion and circulating levels of FGF21 [51]. Protein restrictionactivates the GCN2/pEIF2α/ATF4 pathway involved in theupregulation of FGF21 gene expression [13], and the highavailability of amino acids from a high-protein diet maypartially suppress this signaling pathway.Our results are in agreement with previous studies that
have shown that FGF21 is only released when dietary

A
B
C
Fig. 5 Whole-body energy expenditure. a Oxygen consumption, b respiratory exchange ratio (RER), and c energy expenditure of rats fedlow (6%), adequate (20%), and high (50%) dietary protein and maintained at room temperature (23 °C) or exposed to a cold environment(4 °C) for 72 h (n = 5 rats per group). Energy expenditure (c left) was corrected for body weight. Oxygen consumption and energyexpenditure (c right) were normalized to lean mass. The differences were considered statistically significant at P < 0.05. Mean values withdifferent lowercase letters show statistical differences between each other (a > b > c > d > e)
Alemán et al. Genes & Nutrition (2019) 14:19 Page 9 of 11
protein is low, and there is no difference if it is accompan-ied with high-fat or high-carbohydrate diet [52, 53], effectthat was not observed when mice were fed with adequateor high-protein diets in combination with different concen-trations of fat or carbohydrate in the diet. In fact, thesestudies showed that restricting energy intake without pro-tein restriction fails to increase FGF21 [13].Contrary to the effect of a low-protein diet, we observed
a remarkable inhibitory effect of a high-protein diet incold-stimulated WAT browning. This result suggests thatin WAT, cold exposure and amino acid availability exertantagonistic effects on browning. In fact, a recent studyshows that WAT browning is negatively regulated by theFLCN-mTOR-TFE3-PGC-1β pathway that is modulatedby an increase in amino acid availability [54]. However,
during cold exposure, β-adrenergic activation of mTORthrough PKA leads to S6K phosphorylation and WATbrowning [55]. Thus, these results indicate that an in-crease in dietary protein content and cold exposure exertopposite effects on energy balance through the modula-tion of WAT browning.Similarly, dietary protein content modulated UCP1 abun-
dance in BAT at room temperature. However, during coldexposure, UCP1 abundance was exclusively regulated byenvironmental temperature and did not respond to dietaryprotein intervention. In addition, there is evidence thatBAT synthesizes and releases FGF21 [16, 19]. In fact, wedemonstrated that FGF21 is expressed in BAT. Nonethe-less, although FGF21 protein abundance is upregulatedwhen rats are fed a low or adequate protein diet during

Alemán et al. Genes & Nutrition (2019) 14:19 Page 10 of 11
cold exposure, this increase did not have a significant influ-ence on FGF21 circulating levels. Thus, the role of FGF21in BAT is mostly autocrine, as previously reported [16, 19,56].The present evidence suggests that low-protein diets
can stimulate energy expenditure via FGF21 and WATbrowning and could be used as a dietary strategy for obes-ity treatment. Recent evidence has demonstrated that thisbiological effect likely occurs in obese rat models [45, 57–59]; however, the long-term effects of this dietary strategyshould be carefully evaluated, since long-term low-proteindiets can stimulate the appearance of fatty liver [44], andmoderate restriction can modify the gut microbiota, whichin turn can affect energy harvesting capacity [60, 61], aswell as the WAT browning process.
ConclusionsIn summary, the present results indicate that in additionto the environmental temperature, WAT browning is nu-tritionally activated by low dietary protein, increasingwhole-body energy expenditure, whereas a high-proteindiet can repress this effect. More studies are needed tofurther understand the mechanism by which low dietaryprotein mediates the increase in WAT browning and usethis strategy in obese human subjects to increase energyexpenditure and reduce body weight and fat mass toameliorate the metabolic abnormalities of obesity.
AbbreviationsBAT: Brown adipose tissue; CIDEA: Cell death-inducing DNA fragmentationfactor-α-like effector A; FGF21: Fibroblast growth factor 21;HPRT: Hypoxanthine phosphoribosyl transferase; PGC-1α: Peroxisomeproliferator-activated receptor coactivator-1α; PPAR: Peroxisome proliferator-activated receptor; PRDM16: PR domain containing 16; TBX-1: T-Box-1;UCP1: Uncoupling protein-1; WAT: White adipose tissue
FundingSources of financial support: This work was financially supported through agrant from the CONACYT to GA (grant No. 58187).
Authors’ contributionsGA and ART designed the study. GA, ALC, AV-M, IT-V, AD-V, LGN, and GOperformed the experiments. GA, NT, and ART conducted the analysis of data.GA and ART wrote the paper. All authors read and approved the finalmanuscript.
Ethics approval and consent to participateThis study was approved by the Animal Care Committee of the InstitutoNacional de Ciencias Médicas y Nutrición Salvador Zubirán (CINVA-1792FNU-1792-16/18-1).
Consent for publicationNot applicable
Competing interestsThe authors declare that they have no competing interests.
Publisher’s NoteSpringer Nature remains neutral with regard to jurisdictional claims inpublished maps and institutional affiliations.
Author details1Department of Fisiología de la Nutrición, Instituto Nacional de CienciasMédicas y Nutrición Salvador Zubirán, Ciudad de México, Av. Vasco deQuiroga No. 15, Col. Belisario Domínguez Sección XVI, 14080 México, D.F,Mexico. 2Instituto de Investigaciones Biomédicas, UNAM, 04510 Mexico City,Mexico. 3Department of Research Methodology, Instituto Nacional dePediatría, 04530 Mexico City, Mexico.
Received: 18 October 2018 Accepted: 9 May 2019
References1. Cinti S. The adipose organ. Prostaglandins Leukot Essent Fat Acids. 2005;
73(1):9–15.2. Giordano A, Smorlesi A, Frontini A, Barbatelli G, Cinti S. White, brown and
pink adipocytes: the extraordinary plasticity of the adipose organ. Eur JEndocrinol. 2014;170(5):R159–71.
3. Wu J, Cohen P, Spiegelman BM. Adaptive thermogenesis in adipocytes: isbeige the new brown? Genes Dev. 2013;27:234–50.
4. Bonet ML, Oliver P, Palou A. Pharmacological and nutritional agentspromoting browning of white adipose tissue. Biochim Biophys Acta. 2013;1831(5):969–85.
5. Servera M, López N, Serra F, Palou A. Expression of “brown-in-white”adipocyte biomarkers shows gender differences and the influence of earlydietary exposure. Genes Nutr. 2014;9:372–80.
6. Shore AM, Karamitri A, Kemp P, Speakman JR, Graham NS, Lomax MA. Cold-induced changes in gene expression in brown adipose tissue, whiteadipose tissue and liver. PLoS One. 2013;8:1–9.
7. Barbatelli G, Murano I, Madsen L, Hao Q, Jimenez M, Kristiansen K, et al. Theemergence of cold-induced brown adipocytes in mouse white fat depots isdetermined predominantly by white to brown adipocytetransdifferentiation. Am J Physiol Endocrinol Metab. 2010;298:E1244–E53.
8. Giralt M, Villarroya F. White, brown, beige/brite: different adipose cells fordifferent functions? Endocrinology. 2013;154(9):2992–3000.
9. Garcia-Ruiz E, Reynes B, Diaz-Rua R, Ceresi E, Oliver P, Palou A. The intake ofhigh-fat diets induces the acquisition of brown adipocyte gene expressionfeatures in white adipose tissue. Int J Obes. 2015;39(11):1619–29.
10. Vargas-Castillo A, Fuentes-Romero R, Rodriguez-Lopez LA, Torres N, TovarAR. Understanding the biology of thermogenic fat: is browning a newapproach to the treatment of obesity? Arch Med Res. 2017;48(5):401–13.
11. Pereira MP, Ferreira LAA, da Silva FHS, Christoffolete MA, Metsios GS, ChavesVE, et al. A low-protein, high-carbohydrate diet increases browning inperirenal adipose tissue but not in inguinal adipose tissue. Nutrition. 2017;42:37–45.
12. Perez-Marti A, Garcia-Guasch M, Tresserra-Rimbau A, Carrilho-Do-Rosario A,Estruch R, Salas-Salvado J, et al. A low-protein diet induces body weight lossand browning of subcutaneous white adipose tissue through enhancedexpression of hepatic fibroblast growth factor 21 (FGF21). Mol Nutr FoodRes. 2017;61(8). https://doi.org/10.1002/mnfr.201600725.
13. Laeger T, Henagan TM, Albarado DC, Redman LM, Bray GA, Noland RC, et al.FGF21 is an endocrine signal of protein restriction. J Clin Invest. 2014;124(9):3913–22.
14. Maida A, Zota A, Sjoberg KA, Schumacher J, Sijmonsma TP, Pfenninger A,et al. A liver stress-endocrine nexus promotes metabolic integrity duringdietary protein dilution. J Clin Invest. 2016;126(9):3263–78.
15. Staiger H, Keuper M, Berti L, Hrabe de Angelis M, Haring HU. Fibroblastgrowth factor 21-metabolic role in mice and men. Endocr Rev. 2017;38(5):468–88.
16. Chartoumpekis DV, Habeos IG, Ziros PG, Psyrogiannis AI, Kyriazopoulou VE,Papavassiliou AG. Brown adipose tissue responds to cold and adrenergicstimulation by induction of FGF21. Mol Med. 2011;17(7–8):736–40.
17. Fisher FM, Estall JL, Adams AC, Antonellis PJ, Bina HA, Flier JS, et al.Integrated regulation of hepatic metabolism by fibroblast growth factor 21(FGF21) in vivo. Endocrinology. 2011;152(8):2996–3004.
18. Lee P, Brychta RJ, Linderman J, Smith S, Chen KY, Celi FS. Mild coldexposure modulates fibroblast growth factor 21 (FGF21) diurnal rhythm inhumans: relationship between FGF21 levels, lipolysis, and cold-inducedthermogenesis. J Clin Endocrinol Metab. 2013;98(1):E98–102.
19. Hondares E, Iglesias R, Giralt A, Gonzalez FJ, Giralt M, Mampel T, et al.Thermogenic activation induces FGF21 expression and release in brownadipose tissue. J Biol Chem. 2011;286(15):12983–90.
Alemán et al. Genes & Nutrition (2019) 14:19 Page 11 of 11
20. BonDurant LD, Ameka M, Naber MC, Markan KR, Idiga SO, Acevedo MR, et al.FGF21 regulates metabolism through adipose-dependent and -independentmechanisms. Cell Metab. 2017;25(4):935–44 e4.
21. Veniant MM, Sivits G, Helmering J, Komorowski R, Lee J, Fan W, et al.Pharmacologic effects of FGF21 are independent of the “browning” ofwhite adipose tissue. Cell Metab. 2015;21(5):731–8.
22. Masanes RM, Yubero P, Rafecas I, Remesar X. Changes in UCP expression intissues of Zucker rats fed diets with different protein content. J PhysiolBiochem. 2002;58(3):135–41.
23. Reeves PG, Forrest HN, Fahey GC. AIN-93 purified diets for laboratory rodents:final report of the American Institute of Nutrition ad hoc writing committee onthe reformulation of the AIN-76A rodent diet. J Nutr. 1993;123:1939–51.
24. Hill CM, Laeger T, Albarado DC, McDougal DH, Berthoud HR, Munzberg H, et al.Low protein-induced increases in FGF21 drive UCP1-dependent metabolic butnot thermoregulatory endpoints. Sci Rep. 2017;7(1):8209.
25. Jankovic A, Golic I, Markelic M, Stancic A, Otasevic V, Buzadzic B, et al. Two keytemporally distinguishable molecular and cellular components of white adiposetissue browning during cold acclimation. J Physiol. 2015;593(15):3267–80.
26. Li B, Li L, Li M, Lam SM, Wang G, Wu Y, et al. Microbiota depletion impairsthermogenesis of brown adipose tissue and browning of white adipose tissue.Cell Rep. 2019;26(10):2720–37 e5.
27. Vargovic P, Laukova M, Ukropec J, Manz G, Kvetnansky R. Prior repeated stressattenuates cold-induced immunomodulation associated with “browning” inmesenteric fat of rats. Cell Mol Neurobiol. 2018;38(1):349–61.
28. Yao L, Cui X, Chen Q, Yang X, Fang F, Zhang J, et al. Cold-inducible SIRT6regulates thermogenesis of brown and beige fat. Cell Rep. 2017;20(3):641–54.
29. Chomczynski P, Saachi N. Single step method for RNA isolation by acidguanidinum thyocinate-phenol-chloroform extraction. Anal Biochem. 1987;162:156–9.
30. Livak KJ, Schmittgen TD. Analysis of relative gene expression data using real-timequantitative PCR and the 2(-Delta Delta C(T)) Method. Methods. 2001;25:402–8.
31. Schmittgen TD, Livak KJ. Analyzing real-time PCR data by the comparative C(T)method. Nat Protoc. 2008;3:1101–8.
32. Fisher FM, Kleiner S, Douris N, Fox EC, Mepani RJ, Verdeguer F, et al. FGF21regulates PGC-1alpha and browning of white adipose tissues in adaptivethermogenesis. Genes Dev. 2012;26(3):271–81.
33. Kharitonenkov A, Shiyanova TL, Koester A, Ford AM, Micanovic R, Galbreath EJ,et al. FGF-21 as a novel metabolic regulator. J Clin Invest. 2005;115(6):1627–35.
34. Chouchani ET, Kazak L, Jedrychowski MP, Lu GZ, Erickson BK, Szpyt J, et al.Mitochondrial ROS regulate thermogenic energy expenditure and sulfenylationof UCP1. Nature. 2016;532(7597):112–6.
35. Puigserver P, Wu Z, Park CW, Graves R, Wright M, Spiegelman BM. A cold-inducible coactivator of nuclear receptors linked to adaptive thermogenesis. Cell.1998;92(6):829–39.
36. Dulloo AG, Jacquet J. The control of partitioning between protein and fat duringhuman starvation: its internal determinants and biological significance. Br J Nutr.1999;82(5):339–56.
37. Krishnan S, Cooper JA. Effect of dietary fatty acid composition on substrateutilization and body weight maintenance in humans. Eur J Nutr. 2014;53(3):691–710.
38. Leal-Diaz AM, Noriega LG, Torre-Villalvazo I, Torres N, Aleman-Escondrillas G,Lopez-Romero P, et al. Aguamiel concentrate from Agave salmiana and itsextracted saponins attenuated obesity and hepatic steatosis and increasedAkkermansia muciniphila in C57BL6 mice. Sci Rep. 2016;6:34242.
39. Ohyama K, Nogusa Y, Suzuki K, Shinoda K, Kajimura S, Bannai M. A combinationof exercise and capsinoid supplementation additively suppresses diet-inducedobesity by increasing energy expenditure in mice. Am J Physiol EndocrinolMetab. 2015;308(4):E315–23.
40. Bray GA, Smith SR, de Jonge L, Xie H, Rood J, Martin CK, et al. Effect of dietaryprotein content on weight gain, energy expenditure, and body compositionduring overeating: a randomized controlled trial. JAMA. 2012;307(1):47–55.
41. des Courtis X, Wei A, Kass PH, Fascetti AJ, Graham JL, Havel PJ, et al. Influence ofdietary protein level on body composition and energy expenditure in caloricallyrestricted overweight cats. J Anim Physiol Anim Nutr (Berl). 2015;99(3):474–82.
42. Li J, Armstrong CL, Campbell WW. Effects of dietary protein source andquantity during weight loss on appetite, energy expenditure, and cardio-metabolic responses. Nutrients. 2016;8(2):63.
43. Stepien M, Gaudichon C, Azzout-Marniche D, Fromentin G, Tome D, Even P.Postprandial nutrient partitioning but not energy expenditure is modified ingrowing rats during adaptation to a high-protein diet. J Nutr. 2010;140(5):939–45.
44. Pezeshki A, Zapata RC, Singh A, Yee NJ, Chelikani PK. Low protein dietsproduce divergent effects on energy balance. Sci Rep. 2016;6:25145.
45. Laeger T, Albarado DC, Burke SJ, Trosclair L, Hedgepeth JW, Berthoud HR, et al.Metabolic responses to dietary protein restriction require an increase in FGF21that is delayed by the absence of GCN2. Cell Rep. 2016;16(3):707–16.
46. Ameka M, Markan KR, Morgan DA, BonDurant LD, Idiga SO, Naber MC, et al.Liver derived FGF21 maintains core body temperature during acute coldexposure. Sci Rep. 2019;9(1):630.
47. Keipert S, Kutschke M, Ost M, Schwarzmayr T, van Schothorst EM, Lamp D,et al. Long-term cold adaptation does not require FGF21 or UCP1. CellMetab. 2017;26(2):437–46 e5.
48. Martins-Afferri MP, Festuccia WT, Navegantes LC, Garofalo MA, Botion LM,Kettelhut IC, et al. Response to intra- and extracellular lipolytic agents andhormone-sensitive lipase translocation are impaired in adipocytes from ratsadapted to a high-protein, carbohydrate-free diet. J Nutr. 2004;134(11):2919–23.
49. Nonogaki K, Kaji T. α1-adrenergic receptor downregulates hepaticFGF21 production and circulating FGF21 levels in mice. Neurosci Lett.2017;638:35–8.
50. Granneman JG, Zhai Y, Lahners KN. Selective up-regulation of alpha1a-adrenergic receptor protein and mRNA in brown adipose tissue by neuraland beta3-adrenergic stimulation. Mol Pharmacol. 1997;51(4):644–50.
51. Chalvon-Demersay T, Even PC, Tome D, Chaumontet C, Piedcoq J,Gaudichon C, et al. Low-protein diet induces, whereas high-protein dietreduces hepatic FGF21 production in mice, but glucose and not aminoacids up-regulate FGF21 in cultured hepatocytes. J Nutr Biochem. 2016;36:60–7.
52. Solon-Biet SM, Cogger VC, Pulpitel T, Heblinski M, Wahl D, McMahon AC,et al. Defining the nutritional and metabolic context of FGF21 using thegeometric framework. Cell Metab. 2016;24(4):555–65.
53. Vinales KL, Begaye B, Bogardus C, Walter M, Krakoff J, Piaggi P. FGF21 is ahormonal mediator of the human “thrifty” metabolic phenotype. Diabetes.2019;68(2):318–23.
54. Wada S, Neinast M, Jang C, Ibrahim YH, Lee G, Babu A, et al. The tumorsuppressor FLCN mediates an alternate mTOR pathway to regulatebrowning of adipose tissue. Genes Dev. 2016;30(22):2551–64.
55. Liu D, Bordicchia M, Zhang C, Fang H, Wei W, Li JL, et al. Activation ofmTORC1 is essential for beta-adrenergic stimulation of adipose browning. JClin Invest. 2016;126(5):1704–16.
56. Keipert S, Kutschke M, Lamp D, Brachthauser L, Neff F, Meyer CW, et al.Genetic disruption of uncoupling protein 1 in mice renders brown adiposetissue a significant source of FGF21 secretion. Mol Metab. 2015;4(7):537–42.
57. Coskun T, Bina HA, Schneider MA, Dunbar JD, Hu CC, Chen Y, et al.Fibroblast growth factor 21 corrects obesity in mice. Endocrinology. 2008;149(12):6018–27.
58. Giralt M, Gavalda-Navarro A, Villarroya F. Fibroblast growth factor-21, energybalance and obesity. Mol Cell Endocrinol. 2015;418(Pt 1):66–73.
59. Laeger T, Baumeier C, Wilhelmi I, Wurfel J, Kamitz A, Schurmann A. FGF21improves glucose homeostasis in an obese diabetes-prone mouse modelindependent of body fat changes. Diabetologia. 2017;60(11):2274–84.
60. Fan P, Liu P, Song P, Chen X, Ma X. Moderate dietary protein restrictionalters the composition of gut microbiota and improves ileal barrier functionin adult pig model. Sci Rep. 2017;7:43412.
61. Murphy EF, Cotter PD, Healy S, Marques TM, O'Sullivan O, Fouhy F, et al.Composition and energy harvesting capacity of the gut microbiota:relationship to diet, obesity and time in mouse models. Gut. 2010;59(12):1635–42.