inter vivos transfers or bequests? estate taxes and the ... · pdf fileinter vivos transfers...
TRANSCRIPT
This PDF is a selection from an out-of-print volume from the NationalBureau of Economic Research
Volume Title: Tax Policy and the Economy, Volume 14
Volume Author/Editor: James M. Poterba, editor
Volume Publisher: MIT Press
Volume ISBN: 0-262-66164-0
Volume URL: http://www.nber.org/books/pote00-2
Publication Date: January 2000
Chapter Title: Inter Vivos Transfers or Bequests? Estate Taxes andthe Timing of Parental Giving
Chapter Author: Kathleen McGarry
Chapter URL: http://www.nber.org/chapters/c10848
Chapter pages in book: (p. 93 - 122)

Inter Vivos Transfers orBequests? Estate Taxes and theTiming of Parental Giving
Kathleen McGarryUniversity of California, Los Angeles and NBER
EXECUTIVE SUMMARY
The estates of individuals who die with wealth over specified levels aretaxed at high marginal rates. In 1999 the marginal tax rates ranged from37 percent on estates of $650,000 to 55 percent on estates of over $3million. Because children are the most frequent heirs, one would expectother gift-giving behavior to children to be affected by the potential taxrates faced by the estate. However, surprisingly little is known aboutthis relationship. This paper investigates the link between estate taxesand inter vivos transfers from parents to children. I find that the exis-tence of estate taxes hastens the transfer of resources from parents tochildren. Those parents whose estates are likely to be subject to tax makegreater inter vivos gifts to their children and these gifts increase with themarginal tax rate. I estimate that if estate taxes were eliminated, intervivos transfers from parents to children would be reduced by nearly 30percent per year. Despite these findings, there is also strong evidencethat parents fail to take full advantage of opportunities for tax-free givingand transfer too little to children over their own lifetimes.
I am especially grateful to David Joulfaian for careful reading and helpful comments on anearlier draft of this paper and to James Poterba and Michael }-lurd for their valuablesuggestions. This research was funded by the National Institute on Aging through grantnumber AG1411O-02.
94 McGarry
1. INTRODUCTIONRecent proposals by the United States Congress have once again broughtestate and gift taxes to the forefront in policymaking circles. While estatetaxes affect relatively few decedents, they are the subject of much debateand have spawned an entire industry devoted to estate planning. De-spite the public concern and the continued attention of policymakers,researchers have devoted little attention to the behavioral effects of es-tate taxes, and almost none to the relationship between these taxes andinter vivos giving. We have therefore been able to provide little insightinto how these behaviors would change were there to be changes in thetax laws.
Estate and gift taxes alter the price of transferring resources to others.The estates of individuals who die with wealth above specified levelsface high marginal tax rates. These taxes increase the cost of transferringwealth to heirs and may therefore make consumption and charitablegiving more appealing options for the potential donor. Details of theestate- and gift-tax code also provide strong incentives for gifts to bemade at certain times in the donor's life, and to be made to particularrecipients. These incentives likely affect the well-being of both donorsand recipients and may alter the total amount given over a lifetime.Finally, while estate and gift taxes obviously provide revenue to thegovernment, the amount eventually collected from these taxes wifi de-pend on the responsiveness of individual gift-giving behavior to theincentives embodied in the tax code.
This paper examines the effects of estate taxes on inter vivos giving,with the focus on the transfer of resources from parents to children.1 Ifind that estate taxes hasten such transfers; higher estate taxes increasethe cost of bequeathing wealth to heirs and thus increase the probabilityand amount of inter vivos transfers. Simulations demonstrate that theelimination of the estate tax would reduce yearly inter vivos transfersfrom the wealthy to their children by nearly 30 percent. I also point toevidence that many wealthy parents fail to take full advantage of oppor-tunities to make tax-free transfers despite expected marginal tax rates oneventual estates of over 40 percent. Preliminary analysis of this behaviorsuggests that differences in expected length of life and in the desire totransfer to children may be partially responsible.
The next section outlines the provisions of the tax law, with special
1 Estate taxes likely affect other forms of economic behavior, including savings (Gale andPerozek, 1999), labor supply (Joulfaian and Wilhelm, 1994), and charitable giving (Boskin,1976; Feldstein and Clotfelter, 1976; Joulfaian, 1991, 1998).

Inter Vivos Transfers or Bequests? 95
attention paid to the incentives for inter vivos giving. Section 3 examinesthe relationship between giving and the holding of taxable levels ofwealth, while section 4 focuses on the responsiveness of giving tochanges in the marginal tax rate, and simulates changes in behavior inresponse to proposed changes in the tax law. Section 5 discusses theextent to which parents engage in optimal gift-giving behavior, and afinal section concludes.
2. OUTLINE OF ESTATE- AND GIFT-TAX PROVISIONS
The taxing of financial transfers is governed by a complex set of provi-sions. There are a number of exemptions and special cases embodied inthe law that affect the incentives to give. In this section I first provide anoverview of the general principles involved and then discuss in moredetail those factors that might affect the timing and amount of transfersto children.
2.1 Main Features of the Tax LawTransfer taxes have been used at several times in U.S. history as atemporary revenue raising measure, especially in times of war (see Eller,1996, for a discussion). The current system was instituted with the TaxReform Act of 1976 and is based on a unified treatment of inter vivosgifts and bequests: the taxes owed by an estate are based on the totalamount transferred by an individual, including gifts made during thedecedent's life and those transferred as part of his estate.
There are, however, several important components of the system thateffectively eliminate any such taxes for most individuals and signifi-cantly reduce the tax owed by others. First, there exists a unified taxcredit that exempts all but the very largest transfers from tax. In 1999 theunified credit was $211,300, which served to eliminate all taxes on trans-fers of up to $650,000. Under current law this credit wifi gradually in-crease to $345,800 in 2006, permitting up to $1 million to be transferredtax-free.
A second important component of the estate tax is the unlimited mari-tal deduction. Bequests to a spouse, regardless of the amount, are un-taxed. By taking advantage of the marital deduction and the unifiedcredit a couple may currently transfer tax-free a total of $1.3 million, ifeach gives $650,000 to nonspouse heirs.
In addition to the unified tax credit and spousal deduction, a limitedamount can be transferred in each year without counting against thelifetime ($650,000) exemption. The annual exclusion was $3,000 per recipi-

96 McGarry
Source: IRS (1997, 1999).
(a) Changed to $10 mijlion-$17,184,000 in 1998.
ent in 1977, increased to $10,000 in 1982, and remains there currently.Beginning in 1999 this amount wifi be indexed for inflation.2
This exclusion provides a mechanism whereby wealthy individualscan spend down their estates, reducing the amount subject to tax. Be-cause the $10,000 limit is per donor and per recipient, families can poten-tially transfer a substantial sum in each year. A married couple with twochildren, each of whom is married with two children of his own, cantransfer $160,000 per year to their children's families without incurringgift taxes or impinging on the lifetime exemption. Extending such givingfor a period of years can result in substantial spend-down.3
Finally, charitable bequests are deducted from the gross estate beforecalculating the tax owed. This provision significantly reduces the price ofcharitable giving.4
The marginal tax rates applicable to the combined total of inter vivostransfers and bequests are reported in Table 1. The rates range from 18percent for transfers of less than $10,000 to 55 percent for transfers over$3 million. With the current unified deduction, the lowest marginal rate
2 After adjusting for inflation the amount of the exclusion will be rounded down to thenearest $1000, so that the effects of a moderate rate of inflation will not be felt immediately,nor wifi changes be likely to occur in every year.
I know of no empirical study that has examined the actual patterns of transfers over timewith regard to the potential tax implications.
Studies of the relationship between estate taxes and charitable giving have found a largeresponse in the amount given to the marginal tax rate faced by the estate, with priceelasticities of demand for charitable bequests of greater than 1.0 in absolute value (Boskin,1976; Joulfaian, 1991; Auten and Joulfaian, 1996).
TABLE 1Marginal Estate Tax Rates
Value of estate Tax rate (%) Value of estate Tax rate (%)
0-$10,000 18 500,000-750,000 37
10,000-20,000 20 750,000-1,000,000 39
20,000-40,000 22 1,000,000-1,250,000 41
40,000-60,000 24 1,250,000-1,500,000 43
60,000-80,000 26 1,500,000-2,000,000 4580,000-100,000 28 2,000,000-2,500,000 49
100,000-150,000 30 2,500,000-3,000,000 53150,000-250,000 32 3,000,000-10,000,000 55250,000-500,000 34 10,000,000_21,040,000(a) 60
> 21,040,000 55

Inter Vivos Transfers or Bequests? 97
actually faced by an estate is 37 percent. Estates between $10 million and$21.04 million face a marginal rate of 60 percent, offsetting the lowerrates applied to smaller amounts.5
If wealthy families wish to reduce the number of times dynasticwealth is taxed, they might choose to make bequests that skip a genera-tion, transferring resources directly to grandchildren and reducing thenumber of times the family fortune is taxed. To limit the ability of thewealthy to avoid estate taxes in this way, a generation-skipping tax wasimplemented in 1977. With this tax, transfers of over a given amountmade directly to grandchildren (or others of that generation) are subjectto an additional tax.6 Currently the exempt amount is $1 million and thetax rate for amounts above this limit is 55 percent.7 This tax would beexpected to discourage large transfers to subsequent generations, and infact, a relatively small fraction of estates are liable for generation-skipping taxes. Based on data from 1992 decedents, Joulfaian (1998)reports that less than one-half of one percent of estates filing tax returnsowed generation-skipping taxes.
2.2 Incentives for Inter Vivos GivingFor parents who anticipate bequeathing large sums to their children (orother heirs), the $10,000 annual exemption provides a strong incentivefor inter vivos giving.8 There are, however, additional features of the taxlaw that might also affect the desired timing of gifts. As highlighted inPoterba (2000b) and Joulfaian (1999), while transfers beyond the $10,000limit are often preferable to bequests, the optimal strategy depends verymuch on the type of asset.
The overall preference for taxable inter vivos giving relative to be-quests follows in part from the accounting principles used to determinethe tax owed. Taxes on inter vivos gifts are calculated on top of the actual(net) amount transferred, while taxes on bequests are calculated on the
This interval was changed to $10 million$17,184,000 for those dying in 1998 or later(Internal Revenue Service, 1999). I report the values for earlier years in Table 1 becausethey were the applicable rates in the years to which the data pertain.6 No generation-skipping tax is applied if the parents of the grandchild are deceased sothat the skip in generations is made out of necessity and not as a means of tax avoidance.
This exempt amount wifi be indexed for inflation beginning in 1999, with amountrounded down to the nearest $10,000.8 Throughout this paper I assume that individuals receive utility from their own consump-tion and from transfers to heirs, but not from taxes paid to the government. The desire togive to heirs can come about because the future decedent cares about the well-being of hisheirs (altruism), because he wishes to use the transfer to purchase particular behaviorsfrom the recipient (exchange), or because he receives utility directly from making thetransfer (warm glow).

98 McGcirry
entire estate and subtracted from the (gross) amount bequeathed. Con-sider a parent who is certain to leave an estate that wifi be subject to taxat a marginal rate of 55 percent. Suppose the parent transfers an addi-tional $10,000 as an inter vivos gift; the tax owed is 0.55 X $10,000 =$5,500 which comes out of the parent's other resources. Transferring$10,000 therefore costs the parent $15,500, for an effective tax rate of0.35. If the same amount ($10,000 + $5,500) were transferred as a be-quest and taxed at a rate of 55 percent, the taxed owed would be 0.55 X
$15,500 or $8,525, and the beneficiary would receive $15,500 - $8,525 =$6,975, considerably less than if the $15,500 amount were used to fi-
nance a gift.Prior to the indexing of the exempt amount in 1999, inter vivos trans-
fers also had an advantage over bequests in that since they were madeearlier, a greater real value could be transferred (i.e., $10,000 transferredin 1985 was worth more than $10,000 transferred in 1995). Finally, ifassets grow in real terms, taxable inter vivos giving is preferred to tax-able bequests. For example, if the balance of a savings account, valued at$20,000 in 1985, is transferred in that year, the taxable portion of the giftis $10,000. If the entire $20,000 is left untouched by the recipient in anaccount earning an annual 5-percent real rate of return, it wifi grow to$24,380 by 1995. If the same amount accumulated interest at the samerate but were held by the donor and transferred in 1995, the taxableportion of the gift would be $14,380 and the tax owed would be greaterthan that paid with the earlier transfer.
These aspects of the law seem to indicate unambiguously that trans-fers should be made as early as possible. However, for some assets theadvantages are less clear.
The treatment of capital gains differs for inter vivos transfers andbequests. If assets which have accrued capital gains are transferred atdeath, the value of the asset is "stepped up" so that the recipient's basisfor the calculation of future capital gains taxes is the value at the time ofreceipt. No capital gains taxes are paid on the gains accrued during theoriginal owner's life. Conversely, if such assets are transferred as intervivos gifts, the basis is not stepped up, and the original owner's basis iscarried over to the recipient. When the asset is eventually sold, therecipient must pay taxes on all capital gains as calculated from thebasisof the original owner. This regulation lowers the price of a bequest forassets with unrealized capital gains.
Family farms and businesses also benefit taxwise in several importantways. First, if a farm or business is bequeathed, the value of the realproperty contained in the transfer can be based on its worth as part of

Inter Vivos Transfers or Bequests? 99
the ongoing concern.9 Thus, a family farm that is potentially more valu-able in other use is taxable only up to its value as a farm, provided theheirs continue to operate it as such. Second, taxes owed on the transferof a farm or business can be spread out over 14 years, providing addi-tional tax relief for heirs.1° Finally, the Taxpayer Relief Act of 1997 pro-vides an additional exemption of up to $675,000 for family businesseswith qualifications similar to the requirements for the special valuation.These factors lessen the cost of bequests relative to inter vivos transfers.It is possible to transfer a small number of shares in a business over timeand value them at less than the corresponding fraction of the business'snet worth if they represent minority positions in the concern. The argu-ments in this case are that an individual actually purchasing a smallblock of stock in a closely held business would have little control overthe operation of the concern relative to other stockholders, as well asdifficulty reselling the shares, and the share price would need to bediscounted accordingly. Transferring shares of a family business thisway thus provides an advantage over the use of a bequest wherein thebusiness would be transferred in its entirety. Likewise, a large block ofstock in a publicly owned firm, transferred at a single point in time (sayat the death of the owner), may be devalued relative to the market priceif it is thought that the share price would suffer were the recipient to sellthe block all at once on the open market. Using this method, the total taxbifi might be lessened by transferring the stock as a bequest. Cooper(1979) provides several fascinating examples of individuals who haveused these methods and others to dramatically reduce the tax owed ontransfers.
3. TAXABLE WEALTH AND INTER VIVOS GIVINGThese various incentives embodied in the estate and gift tax make itdifficult to predict the best strategy for an individual seeking to maxi-mize the amount transferred to heirs. However, it is reasonable to pre-sume that those facing eventual estate taxes would first choose to maketax-free inter vivos gifts of $10,000, and a significant fraction of this popu-
Among other limitations, the reduction in the value of the estate due to this specialvaluation is limited to $750,000. This amount is indexed for inflation beginning in 1999.
10 Payment of tax, but not interest charges, may be deferred entirely for up to 5 years, afterwhich time the total must be paid within ten years. The interest rate charged on taxes owedis significantly below the market rate of interest. Joulfaian (1999) finds that this defermentplays a substantial role in increasing the desirability of bequests relative to inter vivostransfers.

100 McGilrry
lation would make at least some gifts beyond that level. Moreover, thepropensity to make inter vivos transfers wifi vary with the types of assetsconstituting bequeathable wealth.1'
Using data from the 1995 Survey of Consumer Finances (SCF), Poterba(2000b) finds a marked increase, both in the probability of making anytransfer and in the probability of making transfers totaling $10,000 ormore, as wealth crosses the $600,000 threshold (the value of exempt be-quests in the year to which his data pertain).12 His results are reproducedin Table 2, along with comparable figures from the Health and RetirementStudy (HRS) and the Asset and Health Dynamics Study (AHEAD).13 Forthose aged 65-74 in the SCF, the probability of making any transfer to achild increases from 11.5 percent for those with net worth below $600,000to 29.5 percent for those with net worth in the range $600,000 to $1.2million. The probability of a transfer of at least $10,000 increases from 1.2to 9.9 percent with this change in wealth. As shown in the second panel ofTable 2, the HRS and AHEAD data yield higher probabilities of givingoverall, but similar increases with taxable wealth.'4 For those aged 65-74the probability of any transfer increases from 25.7 to 56.8 percent as onecrosses from nontaxable to taxable levels of wealth, the probability oftransferring $10,000 or more increases from 3.0 to 17.9 percent for thissame age group.
Those with bequeathable wealth above and below the taxable limitsobviously differ in respects other than the probability of facing estatetaxes, most notably, in their financial ability to make transfers. To con-trol for income, wealth, and other factors that may differ across groups,
Because farms and businesses are illiquid, it may be more difficult or costly to make intervivos transfers of these assets, and individuals with a large fraction of their portfolios tiedup in such enterprises may be less likely to make such gifts than others with similarwealth, despite the potential tax advantages of doing so. This issue will be explored in theempirical work to follow.
12 The SCF is nearly ideal for studying the effect of estate taxes on behavior. In addition toa nationally representative sample of households, it contains an oversample of high-income and high-wealth households. The drawback of these data is that there is littleinformation on the (potential) recipients.
13 The HRS and AHEAD are nationally representative samples of individuals born in theyears 1931-1941 (HRS), and in 1921 or before (AHEAD). Interviews were conducted in1992 and 1993, respectively, when respondents were 51-61 years old, or 70 and over. Thesurveys ask nearly identical questions and can easily be combined into a single sample.They contain a great deal of information on the income and assets of the respondents, aswell as unusually detailed information about their children. The limitation of these data isthat the sample sizes in the upper tails of the wealth distribution are small.
14 The MRS and AHEAD specifically ask parents about transfers made to children in thepast year, and by doing so capture many more such gifts than the SCF, which asks ageneral question about transfers made to individuals outside the household.

TABLE 2Transfer Probabilities by Age and Wealth: SCF and HRSIAHEAD
Age category
Survey of Consumer Finances
Any transfer
Probability of transfer (%)Wealth 600,000- 1.2-2.4 > 2.4
<600,000 1.2 million million million
Sources: SCF results from Poberta (200Db); FIRS/AHEAD results, author's calculations. FIRS/AHEADsamples are limited to families with children.
Definitions of wealth differ slightly across surveys.
55-64 13.1 18.7 27.6 39.0(1.6) (6.4) (10.1) (10.9)
65-74 11.5 29.5 22.2 44.6(1.6) (6.9) (10.4) (10.7)
> 74 9.4 11.9 9.2 48.8(1.9) (8.1) (17.6) (15.7)
>$10,000
55-64 1.7 5.4 8.9 24.2(0.6) (2.3) (3.4) (4.0)
65-74 1.2 9.9 15.1 36.6(0.6) (2.5) (3.8) (4.1)
> 74 1.4 9.6 8.7 38.3(0.7) (3.0) (6.6) (5.9)
Combined HRS/AHEAD surveys
Any transfer
55-64 34.2 51.7 55.9 61.7(0.8) (2.8) (4.6) (7.7)
65-74 25.7 56.8 42.1 72.7(0.9) (4.2) (7.6) (13.4)
> 74 21.2 50.7 63.4 85.4(0.8) (4.6) (9.6) (10.6)
> $10,000
55-64 2.7 17.2 17.8 24.1(0.3) (2.1) (3.5) (6.8)
65-74 3.0 17.9 7.8 40.7(0.3) (3.4) (4.4) (15.5)
> 74 2.4 16.5 18.7 36.8(0.3) (3.6) (8.1) (15.2)

102 McGarry
TABLE 3Probit and Tobit Estimates for the Probability and Amount of
Transfers: HRS/AMEAD
Source: McGarry (2000, Table 3).
Parental characteristics included in the regressions but not shown are: married, number of childrenand grandchildren, income, race, schooling, poor health, mean children's income and schooling,variation in children's income and schooling.
Probability estimated with a probit model, amount estimated with a tobit.
Sample size differs across equations due to missing values on the amount.
McGarry (2000) estimates a probit model for the probability of giving.Included in the specification are the income and wealth of the parent,parental life expectancy, financial status of children, and several othervariables. The results are reproduced in Table 3. Even with these controlvariables, the indicator of a taxable estate has a sizable effect, predictinga 20-percentage-point increase in giving.15 Parents who have longer ex-pected lives need to finance their own consumption for a greater numberof years and, holding income and wealth constant, wifi be less likely todispose of assets. The estimates of the model support this idea: Theeffect of having a taxable estate is reduced by length of life. An addi-tional 10 years of life expectancy reduces the probability of making atransfer by 4 percentage points. Based on these estimates, an individualwith a taxable estate and 10 years to live has a 16-percentage-point (or 50-percent) greater probability of making a transfer than someone in thesame wealth quartile but with an asset level below the taxable limit.
' A family is assumed to have a taxable estate if assets are greater than $600,000 perspouse.
Probabifity Amount
Coeff. SE Deny. Coeff. SE
Household wealth:Lowest quartile 0.478 0.048 0.157 6687 698
2nd quartile 0.277 0.042 0.091 4100 594
3rd quartile 0.132 0.037 0.043 2109 523
Highest quartile (omitted) - - - - -Taxable estate 0.611 0.186 0.201 9037 2384
Taxable estate X lifeexpectancy/lO
0.122 0.046 0.040 1038 583
Life expectancy/lO 0.015 0.013 0.005 471 194
Business wealth ($10,000s) 0.000 0.001 0.000 20 8.4
Farm wealth ($10,000s) 0.013 0.004 0.004 189 54
Number of observations 11,600 11,422
Mean of dependent variable 0.30 1518

Inter Vivos Transfers or Bequests? 103
In addition to affecting the probability of a transfer, the existence of anestate tax likely also affects the amount the donor transfers. In the HRS-AHEAD sample, among those making positive inter vivos transfers,those with taxable bequeathable wealth transferred an average of $14,828,while the less wealthy transferred only $5,588 (not shown). The secondpair of columns in Table 3 reports the effect a taxable estate has on theamount given in a tobit specification. Even when observable characteris-tics of the potential donor are controlled for, there remains a large andsignificant increase in transfers for those with a taxable estate, increasingthe amount of the transfer by over $9,000, and the effect is mitigated bylength of life.'6
The discussion in section 1.2 notes that the composition of the parent'sportfolio wifi affect the price of inter vivos transfers relative to bequests.The tax treatment of farms decreases the costs associated with their trans-fer as a bequest, so a substantial fraction of wealth invested in a familyfarm ought to reduce the probability of an inter vivos gift. In contrast, theability to transfer shares of a business at below-market rates wifi makeinter vivos transfers of such assets more appealing. Assets that containsignificant capital gains wifi benefit from a step up of the basis if trans-ferred as a bequest, and the holding of a large amount of wealth in suchassets may therefore reduce inter vivos transfers. At the same time, re-sources held in these various assets may be more or less liquid thanothers, affecting the ease with which parents can make transfers.
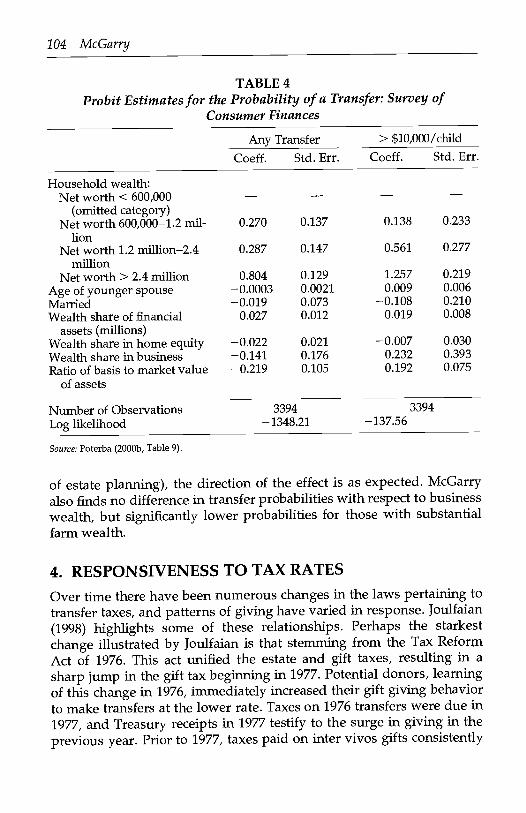
Poterba (2000b) explores these relationships and finds some evidenceof differences in behavior associated with the types of assets held. Theresults, reported in Table 4, indicate that both the probability of makingany gift, and the probability of transferring $10,000 or more per child,are greater among those with a substantial fraction of their wealth infinancial assets, and lower for those whose wealth is held in a home,although this latter effect is not significantly different from zero. Thedirection of the effect of business wealth differs across equations but isnot significantly different from zero. When examining the potential roleplayed by unrealized capital gains, Poterba finds that the greater thebasis value of assets relative to their current market value (the smallerany unrealized gains), the lower the probability of making a transfer,although the effect is not significantly different from zero. This result isin contrast to what a tax-minimizing strategy would predict. However,for transfers above $10,000 (those more likely to be made in the interest
16 Despite the controls for financial resources that are used in these regressions, it remainslikely that some portion of the observed increase in transfers for those with taxable estatesis simply a wealth effect. I discuss this possibility further in section 4.1.
104 McGarry
TABLE 4Probit Estimates for the Probability of a Transfer: Survey of
Consumer Finances
> $10,000/child
of estate planning), the direction of the effect is as expected. McGarryalso finds no difference in transfer probabilities with respect to businesswealth, but significantly lower probabilities for those with substantialfarm wealth.
4. RESPONSIVENESS TO TAX RATESOver time there have been numerous changes in the laws pertaining totransfer taxes, and patterns of giving have varied in response. Joulfaian(1998) highlights some of these relationships. Perhaps the starkestchange illustrated by Joulfaian is that stemming from the Tax ReformAct of 1976. This act unified the estate and gift taxes, resulting in asharp jump in the gift tax beginning in 1977. Potential donors, learningof this change in 1976, immediately increased their gift giving behaviorto make transfers at the lower rate. Taxes on 1976 transfers were due in1977, and Treasury receipts in 1977 testify to the surge in giving in theprevious year. Prior to 1977, taxes paid on inter vivos gifts consistently
Any Transfer
Coeff. Std. Err. Coeff. Std. Err.
Household wealth:Net worth < 600,000
(omitted category)- - -
Net worth 600,000-1.2 mil-lion
0.270 0.137 0.138 0.233
Net worth 1.2 million-2.4million
0.287 0.147 0.561 0.277
Net worth> 2.4 million 0.804 0.129 1.257 0.219Age of younger spouse -0.0003 0.0021 0.009 0.006Married -0.019 0.073 -0.108 0.210Wealth share of financial
assets (millions)0.027 0.012 0.019 0.008
Wealth share in home equity -0.022 0.021 -0.007 0.030Wealth share in business -0.141 0.176 0.232 0.393Ratio of basis to market value
of assets-0.219 0.105 0.192 0.075
Number of Observations 3394 3394
Log likelthood -1348.21 -137.56
Source: Poterba (2000b, Table 9).

Inter Vivos Transfers or Bequests? 105
amounted to approximately 8 percent of total transfer taxes collected.With the tax-induced spike in inter vivos gift giving, the share oftransfer-tax receipts coming from gifts increased to 24 percent in 1977,along with an increase in total receipts, before falling to 3 percent in thesubsequent year (Joulfaian, 1998, Table 17). Joulfaian also notes similar,although less dramatic, responses to legislative changes in the 1930sand 1940s.
One would expect these time-series patterns to be evident in cross-section analyses as well; those facing higher tax rates ought to behavedifferently from those facing lower rates. The continual increase in thelikelthood of a transfer with the wealth of the parent observed in Table 2is consistent with this prediction. In this section I control directly for themarginal tax rate the estate would face were the parent(s) to die on thedate the data were collected. I estimate the responsiveness of inter vivosgiving to changes in this tax rate and forecast the effect on transferbehavior of alternative proposals to modify the estate tax.
4.1 Baseline SpecificationI examine transfer behavior in two steps. First, I estimate the probabilityof making a transfer to at least one child using a probit specification. Inthe second step I select only those parents who made a positive trans-fer and estimate the amount of the transfer as a function of the same setof regressors using ordinary least squares (OLS). This two-step proce-dure is preferable to a tobit model in that it provides more flexibility forthe explanatory variables to affect the probability and the amount of thetransfer differentially.
The explanatory variables in these equations include the income,wealth,17 and life expectancy of the parent (or parent couple),18 and the
In addition to the standard components of net worth, the measure of bequeathablewealth used here also includes the face value of life insurance policies and the value ofbalances in defined-contribution pension plans. It is difficult to know how to incorporatecorrectly the value of life insurance. The value of policies owned by the decedent (i.e.,premiums paid by the decedent) are considered to be part of the estate. However, policieson the decedent's life held by the beneficiaries (or others) are not included. In these data Ido not know who pays the premiums on the insurance policy. I assume that affirmativeanswers to the question "Do you have any life insurance?" indicates a policy he himselfholds. I include the value of all policies held as of the interview date, including both wholelife and term life policies. This assumption implies that the value of bequeathable wealthused here is likely an upper bound on the taxable amount. The conclusions of the paper arenot sensitive to this decision.18 Life expectancy is from United States Department of Health and Human Services (1996).For married couples this is the sum of the life expectancies of the two spouses, since it isthe total number of person-years over which the couple must finance consumption, andcan make estate-reducing transfers, that wifi affect giving.

106 McGarry
average age and income of the children.19 I use three variables to mea-sure the effect of estate taxes on inter vivos giving: a 0-1 indicator ofwhether the estate would be subject to tax, the marginal tax rate, andthe interaction of the marginal tax rate with the expected lifespan of theparent(s). This specification allows for a discontinuity in giving as themarginal tax rate changes from zero for those with assets below theexempt amount, to 0.37 for those above. I limit my sample to respon-dents with living children. Table 10 in the appendix reports the sum-mary statistics for the variables used in this analysis. With $600,000 perspouse as an indicator of a taxable estate, 4.1 percent of the samplewould be required to file an estate tax return were they to die at theinterview date.2° Thirty-two percent of the sample made a transfer to atleast one child in the past year.
4.1.1 Probability of a Transfer The estimates of the probit model arereported in Table 5. Both the income and wealth of the parent are posi-tively and significantly related to the probability of making a transfer.
Assessing the impact of estate taxes is complicated and requires thatone combine the three relevant terms in the equationthe indicator of ataxable estate, the marginal tax rate, and the interaction of the tax ratewith life expectancy. For someone with a life expectancy of 5 years andassets just at the taxable limit (so that the marginal tax rate is 0.37), theeffect of the estate tax is to increase the probability of a transfer by 6.4percentage points (-0.006 + 0.215 X 0.37 - 0.005 X 0.37 X 5) relative tothe probability with no tax. This change is equal to 21 percent of the
use logged values of the dollar-denominated variables of income, wealth, average in-come of children, and value of transfers. For some individuals in the sample, wealth is zeroor negative. I use a splinelike transformation to deal with the nonpositive values. I includea dummy variable indicating zero wealth, and for negative wealth I use ln(wealth). Itreat income similarly, including a dummy variable that is equal to one if the respondentreports zero income. (Negative income is not possible.)
20 This sample obviously differs from the population that will eventually ifie estate taxes.Official estimates place the fraction of the decedent population filing estate tax returns at2.8 percent (Eller, 1996). Estate tax returns are filed if the gross estate is above the limitseven if the estate eventually owes no tax. Only about half of filers actually do owe taxes.The FIRS/AHEAD data come from living respondents, so the measure of bequeathablewealth used here is only a proxy for the size of the eventual estate. Many individuals arecurrently employed and will likely accumulate more wealth over their lifetimes, leavingestates that are subject to tax. Others will dissave sufficiently, either through their ownconsumption or through tax-free gifts and charitable donations, that they wifi avoid allestate taxes. One might expect a higher fraction with taxable estates in these data thanamong recent decedents because these cohorts have greater lifetime income than theirpredecessors and ceteris pan bus wifi have a higher probability of dying with estates valuedat more than $600,000, although increases in longevity wifi likely offset some of thisdifference.

TA
BL
E 5
Prob
it an
d O
LS
Reg
ress
ions
: Pro
babi
lity
and
Am
ount
of
Inte
r V
ivos
Tra
nsfe
rs to
Chi
ldre
n
Reg
ress
ions
als
o in
clud
e a
term
for
neg
ativ
e w
ealth
, dum
my
vari
able
s fo
r ze
ro w
ealth
, zer
o in
com
e, a
nd c
hild
ren'
s in
com
e m
issi
ng a
nda
cons
tant
term
.(a
) C
ondi
tiona
l on
tran
sfer
ring
a p
ositi
ve a
mou
nt.
Bas
elin
e Sp
ecif
icat
ion
With
Por
tfol
io C
ompo
sitio
nG
ave
any
tran
sfer
ln(a
mou
nt)(
a)G
ave
any
tran
sfer
ln(a
mou
nt)(
a)C
oeff
.St
d. e
rr.
Den
y.C
oeff
.St
d. e
rr.
Coe
ff.
Std.
err
.D
eny.
Coe
ff.
Std.
err
.C
hara
cter
istic
s of
the
pare
nt:
ln(w
ealth
) if
wea
lth>
00.
159
0.01
20.
049
0.18
30.
019
0.16
70.
012
0.05
10.
185
0.01
9in
(inc
ome
if in
com
e) >
00.
258
0.01
60.
079
0.18
90.
023
0.24
80.
017
0.07
60.
184
0.02
3T
axab
le e
stat
e-0
.018
0.09
0-0
.006
-0.0
770.
105
-0.0
130.
090
-0.0
04-0
.068
0.10
5M
argi
nal e
stat
e ta
x ra
te 'r
0.70
30.
331
0.21
50.
986
0.40
30.
665
0.33
30.
204
0.91
20.
406
Tax
rat
e X
life
exp
ecta
ncy
-0.0
170.
007
-0.0
05-0
.004
0.00
8-0
.018
0.00
7-0
.006
-0.0
030.
008
Lif
e ex
pect
ancy
-0.0
050.
002
-0.0
02-0
.006
0.00
2-0
.005
0.00
2-0
.001
-0.0
050.
002
Mar
ried
-0.0
890.
039
-0.0
27-0
.082
0.05
9-0
.093
0.04
0-0
.028
-0.0
830.
059
Non
whi
te-0
.106
0.03
6-0
.032
-0.2
000.
055
-0.1
090.
036
-0.0
33-0
.196
0.05
5C
hild
ren'
s ch
arac
teri
stic
s:N
umbe
r of
chi
ldre
n-0
.025
0.00
7-0
.008
0.00
40.
011
-0.0
240.
007
-0.0
070.
004
0.01
1in
(av
erag
e ch
ildre
n's
inco
me)
-0.1
050.
023
-0.0
320.
057
0.03
2-0
.112
0.02
4-0
.034
0.05
30.
032
Ave
rage
age
of
child
ren
-0.0
180.
002
-0.0
06-0
.008
0.00
3-0
.019
0.00
2-0
.006
-0.0
090.
003
Port
folio
com
posi
tion:
Frac
tion
of w
ealth
in h
ome
--
-0.1
700.
037
-0.0
52-0
.131
0.07
0Fr
actio
n of
wea
lth in
busi
ness
--
-0.0
400.
027
-0.0
12-0
.083
0.05
3
Frac
tion
of w
ealth
in f
arm
--
-0.6
100.
137
-0.1
87-0
.207
0.23
0Fr
actio
n of
wea
lth in
stoc
ks-
--
-0.
098
0.05
20.
030
0.16
50.
107
Num
ber
of o
bser
vatio
ns11
754
3320
1175
433
20M
ean
of th
e de
pend
ent
vari
able
0.30
47.
790.
304
7.79

108 McGarry
average (unweighted) probability.21 The probability of a transfer in-creases further as the marginal tax rate increases, and the change issignificantly reduced with increasing length of life. For an individualwith the same life expectancy but facing a marginal tax rate of 0.55, theincrease in the probability due to the estate tax alone (and not the under-lying increase in wealth) is 9.9 percentage points, or 32.4 percent.
Transfers also depend significantly on the characteristics of the chil-dren. A higher average income indicates that children are relatively betteroff financially, and the probability of a transfer is less. Older children areless likely to be liquidity-constrained than younger children, and, consis-tent with this observation, the age of the children is negatively related tothe probability of a transfer (Cox, 1990).
4.1.2 Amount of the Transfer To estimate the effect of taxes on theamount of the transfer, I limit the sample to the 3,320 families making apositive transfer; the predicted value is thus the conditional expectation.The average amount given by these families was $5622. The second set ofcolumns in Table 5 presents the results of a linear regression model withthe left-side variable being the natural log of the amount.
As was the case for the probability of a transfer, both the income andwealth of the parent are positively related to the expected amount. A 10-
percent increase in parental wealth increases the amount of the transferby 2 percent, and the effect of an increase in income is similar
One of the drawbacks of the HRSAHEAD data is the small number ofvery wealthy persons. By reducing the sample to those who make apositive transfer, the number facing nonzero marginal tax rates is furtherlimited, and identification of the three tax variables will likely be lessprecise than one might desire. Despite this qualification, estate taxescontinue to have some effect. For an individual in the 37-percent taxbracket with a life expectancy of 5 years, the expected amount of thetransfer (conditional on its being positive) is 28 percent higher (-0.077 +0.986 X 0.37 - 0.004 X 0.37 X 5) due to the estate tax. Again the effectincreases with the tax rate, so that an individual with the same lifeexpectancy and facing a marginal tax rate of 0.55 has an expectedamount that is 45 percent higher than in the absence of estate taxes.
4.1.3 Tax Rates and Wealth Because the marginal tax rate facing theestate is directly related to parental wealth, the two variables are highly
21 The mean of the left-side variable is 0.304. It differs from the proportion making atransfer as reported above because the regressions are unweighted.
22 See McGarry (1999) for a more detailed analysis of the role of the income of children.

Inter Vivos Transfers or Bequests? 109
collinear. This relationship makes it impossible to separate the effect ofchanges in tax rates from nonlinear changes in wealth.23 A portion of theincreased probability and amounts given by those in higher tax bracketslikely stems from increases in wealth not captured by the log specifica-tion, and the estimate effects are therefore best viewed as upper boundson the role of estate taxes in driving behavior.24
4.2 Portfolio CompositionThese equations treat all types of assets equally. However, as discussedearlier, it is likely that the type of assets held by parents affects their gift-giving behavior. The greater the capital gains tied up in an asset, the lesscostly it is to transfer the asset as a bequest, and the special tax treatmentafforded family businesses at death has a similar effect. In contrast, othertax incentives associated with the transfer of farms or businesses may tiltthe decision towards inter vivos transfers. Finally, issues of liquiditymay make it difficult to transfer portions of family farms, businesses, orhomes during the parent's life, resulting in a greater tendency to bequestwealth in these forms. In these data I have no way of measuring capitalgains, but I am able to distinguish between wealth held in variousforms.25 To control for these factors I add four variables to the abovespecifications: the fraction of wealth in a farm, a business, a home, andin stocks. The rightmost set of columns in Table 5 report the results.
The greater the fraction of wealth in a farm or a home, the significantlylower the probability of a transfer, while the greater the fraction ofwealth in stock, the higher the probability. An increase in the fraction ofwealth in a business decreases the probability of a transfer, but the effectis not significantly different from zero.
In the equation for the amount of the transfer, the effects are of the samesign, but only the fraction of wealth held in a home has a significant effect.The effect of farm wealth is large and negative but is estimated very
23 Empirically the coefficient estimates for the tax rate and the taxable-estate dummyvariable change noticeably when alternative measures of wealth are used in the regres-sions. However, the simulated effects of changes in amounts given (reported in Table 6)are quite similar to those obtained with the log specification.24 One way to attempt to separate the effects is to find alternative sources of variation in taxrates. Because states can impose their own estate, gift, or inheritance taxes, there exists thepotential to identify the effects. Unfortunately for the analyst, the effect of state taxes in thevast majority of states is to reduce the revenue going to the federal government with noadditional tax burden placed on the individual estates. In 1999 only four states had estatetaxes that affected the taxes owed by the estate. Page (1997) uses the cross-state variation inestate taxes in 1983 data to attempt to separate the two effects. He finds that the ma--inalestate-tax rate has a significant effect on the probability and amount of the transfer.25 Note that the additional exclusion for family-owned businesses was not in effect at thetime at which these data were collected.
110 McGarry
imprecisely, likely because of the small number of observations with non-zero farm wealth. In neither equation is there a significant change in theestimated effects of the marginal tax rates with the inclusion of thesevariables.26
4.3 SimulationsThe equations estimated above provide a particularly useful framework foranalyzing the responsiveness of transfers to changes in the tax law. Theprobit and OLS equations can be used separately to calculate the expectedchange in the probabffity of a transfer and in the conditional amount, andthey can be combined to calculate an unconditional change in the amountgiven. In the simulations that follow I first calculate the predicted probabil-ity of making a transfer for each parent or parent couple and then calculatethe expected amount conditional on a transfer being made.27 Using thesetwo values, the unconditional expectation is calculated as
E[t] = P(tk> 0) . E[tkltk> 01 + P(tk = 0) . 0
for each family in the sample. The average of these expectations givesthe average expected transfer over all individuals, and the sum yieldsthe total expected transfers for this population. I repeat this procedureusing the original estimates of the coefficients, but substituting alterna-
tive values of the effective marginal tax rate.28Under current law the lifetime exemption will gradually increase from
the $600,000 applicable when these data were collected to $1 million in2006. A $1-million exemption would decrease the fraction of the samplewith taxable levels of assets from 4.1 to 1.6 percent, but would notchange the marginal rate for those still subject to tax. Because the major-ity of the population does not face estate taxes even with the $600,000limit, raising it to $1 million has no effect on their behavior. To focus onthose actually experiencing a change in the tax environment, I report thesimulated effects of the subsample with wealth above $600,000 per
The weakness of these results is not surprising. Data from 1992 decedents show thatonly 1.1 percent of estates owing tax used the special valuation applicable to family farmsor business (Eller, 1996). It is therefore likely that much of the effect of the compositionalvariables is due to differences in the liquidity of assets.
Here I use the estimates from the equations without the compositional effects, althoughthe results are similar if the latter specification is used.
The marginal effect of a change in the tax rate r on the expected amount given can becalculated as
dE[tk] dE[tkltk > 0] aP(tk> 0)P(tk> 0) . + . E[tkltk> 0].
ar 3T aT

Inter Vivos Transfers or Bequests? 111
TABLE 6Simulated Change in Transfers for Changes in Tax Policy
Decrease in transfersrelative to current status (%)
Tax policy Probability Amount(a)
$1-million exemption 0.9 12.3$1.0-million exemption; 1.1 17.9
decrease in rates of 7.5percentage points
No estate tax 1.6 27.8
Sample is singles with wealth> $600,000, couples with wealth> $1.2 million.
(a) Figure reported is the unconditional change, calculated from the change in the expected value E[t,jP(tk> 0) . E[tkltk > 01 + P(tk 0) . 0.
spouse. These results are presented in Table 6. When the exemptamount is raised to $1 million, the probability of making a transfer fallsby only 0.9 percent, but the total amount of the expected transfer de-creases by 12.3 percent. Thus, while wealthy parents are not likely tostop transferring resources to their children in response to this change inthe tax structure, they are likely to reduce the amount they transfer.
The Taxpayer Refund and Relief Act of 1999 calls for a gradual elimina-tion of the estate and gift taxes by the year 2009. The phase-out of the taxbegins in 2001 and 2002 with reductions in the top marginal rates to 50percent. Tax rates (across the board) are then lowered further in eachyear, beginning in 2003, for a total reduction of 7.5 percentage points bythe end of the phase-out period.29 These decreases in rates are accompa-nied by a gradual increase in the exempt amount to $1 million. When theestate tax is eliminated entirely in 2009, there is a corresponding changein the laws governing the capital gains treatment of bequests. Specifi-cally, the step up in basis value that currently exists for assets transferredas bequests wifi be eliminated for estates of more than $2 million be-queathed to a nonspouse heir.3°
There are a number of possible simulations that these changes bring tomind, I focus on two: First, I simulate the expected transfer behaviorgiven the tax environment in the final year before the estate tax is elimi-nated. In this scenario, the exempt amount is $1 million and the mar-
29 This 7.5-percentage-point reduction for the wealthiest comes after the lowering of thetop marginal rates to 50 percent.
3° The elimination of the step up in basis is not immediate, but is phased in gradually forestates valued between $1.3 million and $2 million. The spousal exemption for basis stepup is limited to $3 million. See United States Congress (1999a, 1999b) for further details.

112 McGarry
ginal rates are reduce by 7.5 percentage points, with the reduction forthe top brackets coming after the lowering of rates to 50 percent. Thissimulation provides an interesting comparison with the one above,wherein the exempt amount is also $1 million, but the marginal tax ratesremain at their initial levels. Second, I simulate the effect of eliminatingall estate taxes.
With the $1-million exemption and the lower marginal tax rates, there isa decrease of 1.1 percent in the average probability of making a transfer,and a relatively large fall of 17.9 percent in the amount transferred. Notethat the change in the reduction in transfer probabilities and amountsfrom row 1 of table 6 is due to the lower tax rates faced by those withestates over $1 million. Thus, the reduction in rates has only a small effecton the probability of a transfer, but a large effect on the amount given.
Assuming there is no estate tax, the change in the probability of atransfer remains relatively small, equal to 1.6 percent, but the expectedamount declines by a large amount, equal to 27.8 percent.
I emphasize that these simulations are based on the assumption thatthe coefficients on the tax variables estimate the true effects of the taxand are not capturing additional nonlinear effects of wealth. If wealtheffects have biased these coefficient estimates, then the actual changes ingiving associated with changes in the tax law wifi be smaller than thesefigures indicate.
An important goal of proposals to reduce or eliminate the estate tax isto enable donors to transfer more resources to their heirs. The results inTables 5 and 6 suggest that the short-term effect wifi be a reduction ininter vivos giving. If the timing of the transfers is important to children,and earlier is preferable to later, then this postponement of parentalgiving may reduce the child's well-being. It is also unclear how much ofthe tax savings wifi be passed along to children. In the absence of anestate tax, the parents' lifetime wealth is greater. Some of this increase inwealth wifi translate into an increase in the amount bequeathed to chil-
dren, some will be used to increase the parents' own consumption, andsome may be used to increase charitable giving.
The effect on charitable giving is noteworthy. On the one hand, thewealth effect increases charitable gifts, while on the other, eliminatingthe estate tax eliminates the preferential tax treatment of charitable giftsso that the prices of bequeathing to children and to charities are thesame. This increase in the relative price of charitable bequests wifi de-crease the fraction of the estate bequeathed to charitable institutions.Evidence in the literature suggests that the net effect would be a de-crease in charitable giving. However, notall research supports this view.Early work by Barthold & Plotnick (1984) found no relationship between

Inter Vivos Transfers or Bequests? 113
the rate of estate tax and charitable bequests. Furthermore, Auten andJoulfaian (1996) estimate that elimination of an estate tax would alsoreduce inter vivos charitable giving by individuals with children.
5. THE EXTENT OF GIVING
Much of the theoretical literature has focused on a comparison of thebenefits of making taxable inter vivos gifts relative to taxable bequests.Little attempt has been made to estimate the extent to which wealthyindividuals are taking full advantage of the opportunities for tax-freegiving. If the wealthy are not using the $10,000 annual exclusion, a focuson the merits of giving beyond this level seems unwarranted. The resultspresented here indicate that individuals do respond to estate and gifttaxes by making more and larger inter vivos transfers to children, butthey have not addressed the question of whether the wealthy give to thefull extent predicted by a tax minimization strategy.
To examine this issue I limit the sample to the subset of wealthyindividuals (those with per-person wealth above $600,000) and calculatethe amount that could be given if each spouse (or single parent) gave$10,000 to each of his children, grandchildren, and children-in-law. Thiscalculation provides a measure of the ability to reduce the size of theestate in a single year through tax-free familial transfers.3' If multipliedby the expected length of life, the total provides the expected amountthat could be given to children, free of any transfer taxes, over theremainder of the parent's life.
The potential for yearly giving in this sample is surprisingly large. Theaverage number of children is 3.1, and the average number of grand-children is 3432 Including children-in-law with these lineal descendantsresults in an average potential number of familial beneficiaries of 9.1.Allowing each spouse in a married couple to make a $10,000 gift, theaverage potential tax-free transfer is $147,000 per year. Continued trans-fers of this magnitude over the parent's expected life yields a total poten-tial for tax-free inter vivos gifts of over $4 million on average, far more thanthe average asset holdings of even this wealthy group. If the number ofpotential recipients in each year, for each spouse, is limited to the childrenof the respondent(s), the potential for yearly tax-free giving is $50,900, orapproximately $1.9 million over the lifetimes of these parents.
31 The potential to give in each year can obviously be as large as the donor wishes, sinceany recipient qualifies for a tax-free gift of $10,000. Furthermore, there is no limit ontransfers to a single recipient made specifically for schooling or health expenditures.32 J remind the reader that the initial selection process limited the sample to those withchildren.

114 McGarry
TABLE 7Distribution of Gifts Relative to Exempt Amount
Giving greater than potentialGiving equal to potentialGiving less than potential
Potential recipients of $10,000 gift
Children, children-in-law, and
grand-children
Percentage of sample All Transfer > 0 All Transfer> 0
2.4 4.00.7 1.2
96.9 94.7
Potential is equal to $10,000 per recipient.
Sample is singles with wealth> $600,000, couples with wealth> 1.2 million.
Sample sizes differ across columns because of missing information on grandchildren.
How close to these figures do parents come? Are there many who aregiving above this limit as would be predicted by the intricacies of the taxcode? Table 7 shows the distribution of total giving relative to these taxlimits. Only 3.1 percent (2.4 + 0.7) of those with taxable levels of wealthgave an amount greater than or equal to this potential, while 96.9 per-cent gave less. Conditional on a positive transfer being made, 5.2 per-cent gave an amount at or beyond the limit. If the potential to transfertax-free is measured with respect to children only, the proportion trans-ferring an amount at least equal to the potential is 6.6 percent overall and11.1 percent among the givers.33
The potential tax savings lost by this relatively low level of giving issubstantial. Poterba (2000a) estimates that planned giving in each year upto the annual exclusion could reduce taxable wealth by 23 percent. Basedon his calculations, this level of giving implies a yearly flow of inter vivostransfers of $235 billion. However, estimates made by Poterba and byothers (Gale and Scholz, 1994) indicate that the amount actually trans-ferred is less than one-quarter as much, implying a substantial shortfall ingiving. Using the same survey, Page (1997) calculates that if parentsmaximized their tax-free giving, no one in his sample would be faced withpaying estate taxes.
Additional evidence of this phenomenon comes from McGarry (2000).Estimates in that paper show that by maximizing tax-free giving to chil-
If I ignore the potential for married couples to each make a transfer of $10,000, thefraction of the sample transferring an amount greater than or equal to $10,000 per childremains small at 9.4 percent.
Children only
Number of observations 424 247 416 252
3.8 6.32.8 4.8
93.4 88.9
Inter Vivos Transfers or Bequests? 115
dren, children-in-law, and grandchildren, parents in the HRS andAHEAD could reduce the total tax bifi by 72 percent relative to theamount owed with no giving. Projecting the actual giving observed inthe data over the remainder of the respondents' expected lives yields anexpected reduction in the tax bifi of just 20 percent.
Given the attention paid to estate planning in the popular press andby the public, the frequency with which the wealthy elderly fail to ex-ploit this simple means of decreasing the size of their estates is surpris-ing. There have been several explanations put forth for this lower thanexpected level of giving, many of which are noted in Poterba (2000a).First, it might be that elderly parents are risk-averse and are concernedabout outliving their assets. They do not want to give away too muchand end up with insufficient wealth should they live a long life. On arelated point, these parents may fear that substantial medical expensesor the need for nursing-home care could deplete their resources. Poterbasuggests further that these wealthy elderly may believe they are morecapable investors than their children and seek to maintain control ofdynastic wealth for as long as possible. Likewise, they may receive util-ity from holding wealth or from the respect or power it confers. Alterna-tively, those who do not take advantage of tax-free giving could simplymisunderstand the full implications of the tax law, or could anticipatechanges in the law that would negate the need for inter vivos giving.
Although none of these explanations can be tested directly, there aresome correlates that one can use to investigate their likely relevance. InTable 8 I examine differences in observable characteristics among thosein the wealthy subsample who make transfers equal to at least $10,000per child ("limit-givers") and those who do not ("non-limit-givers").Given the small sample sizes, useful multivariate analyses are not possi-ble, and these simple differences in means across groups should beinterpreted with caution.
Consider first the suggestion that those who are transferring less thanthe potential tax-free amount are doing so because they fear outlivingtheir assets. Table 8 shows that the limit-givers are somewhat older andreport a lower subjective survival probability than their counterparts,consistent with their greater willingness to spend down assets.
Differences in insurance status support the notion that the threat offuture medical expenses might also be responsible for the observed be-havior. Those making large transfers are more likely to have private
The subjective survival measures are responses to the questions:"... what is the proba-bifity you wifi live to age 75?" (for the HRS) and the probability of living approximately 10more years (AHEAD). Responses of spouses are averaged together for both this measureand for age.

TABLE 8Differences by Transfer Behavior for Those with Taxable Estates
Gave at least $10,000 per child
Number of obs. when in 28 396both surveys
Number of obs. when in 13 110AHEAD only
Variables with are available for AHEAD families only; those with ', for HRS only. The number ofobservations therefore differs across variables.
Yes No
Mean Std. err. Mean Std. err.
Age 64.4 2.1 61.3 0.5Probability of surviving to 75 0.65 0.05 0.71 0.01
(HRS)**Probability of surviving 10
years (AHEAD)*0.40 0.10 0.53 0.03
Either spouse in poor health 0.15 0.07 0.07 0.01Private health insurance*
(those with Medicare)0.70 0.11 0.59 0.04
Long-term care insurance* 0.43 0.15 0.25 0.05Long-term care insurance 0.40 0.24 0.07 0.03
(HRS)**
Number of children 1.94 0.19 3.19 0.09Average schooling of
children15.5 0.32 14.6 0.09
Average income of children 51,355 5,843 41,485 958Fraction of children with
more schooling thanparents
0.32 0.09 0.35 0.02
Fraction of children finan-cially better off thanparents*
0.14 0.08 0.25 0.04
Have a financial advisor* 0.29 0.13 0.48 0.05
Transferred $5,000 or morein past 10 years*
1.0 0.0 0.51 0.05
Importance of leaving anIrlheritance**:Percent stating very
important60.0 35.1
Percent stating somewhatimportant
33.3 47.0
Percent stating notimportant
6.7 17.8
Inter Vivos Transfers or Bequests? 117
health insurance to supplement Medicare (among those enrolled inMedicare), and more likely to have long-term care insurance, both ofwhich reduce the probability of catastrophic medical bills, allowing indi-viduals to more readily reduce assets. This explanation takes insuranceholdings as given. If instead if one views insurance holdings as an indica-tor of risk aversion, then these differences suggest that the limit-giversare more risk-averse. By purchasing insurance they have eliminated oneprecautionary motive to save, but one would expect them to remainhesitant to dispose of assets due to other uncertainties, contrary to whatwould be predicted by their giving behavior.
It is obviously not possible using survey data to measure a child'sability to invest wisely. However, it is worth noting that both theaverage schooling and average income of children is marginally higheramong the limit-givers. Thus, on an absolute level, the children oflimit-givers are better off than those of non-limit-givers. Interestingly,the reverse is true if one measures financial status relative to their par-ents. On average, just 32 percent of the children of limit-givers havemore schooling than their parents, and only 14 percent are better offfinancially. For the non-limit-givers these figures are 35 and 25 per-cent.35 These differences in the relative economic well-being of childrenare consistent with transfers being made, in part, out of a desire toreduce inequalities within the family, rather than for tax considerationsalone.
It is unlikely that the wealthiest in the sample are completely unawareof the tax consequences of their behavior. Having amassed a sizableestate, one would imagine that they have a good deal of financial knowl-edge, as well as access to expert opinions. In fact, while 29 percent of thelimit-givers have a financial planner, 48 percent of the non-limit-giversdo, suggesting that the non-limit-givers are not lacking information.
Finally, consider the possibility that not all parents desire to increasetransfers to their children. They may believe that even net of taxes, theamount bequeathed wifi be large, and that additional transfers are betterspent by the government or charitable institutions. While attributingdifferences in behavior to differences in tastes certainly begs the ques-tion of the origin of these tastes, the empirical evidence indicates thatsuch differences are large. Among AHEAD respondents, all of the limit-givers transferred $5000 or more to a child in the past 10 years, comparedto just one-half of the non-limit-givers. This information is not obtained
The variable measuring relative financial status is the response to a question in AHEADthat asks parents to report if the child's "financial situation (is) better, about the same, orworse than" theirs.

118 McGarry
in the HRS, but parents in that survey were asked about their views onbequests. The survey asked whether leaving an inheritance was, "veryimportant, somewhat important, or not important." The distribution ofresponses to this question also demonstrates a strong difference in viewsabout giving. Sixty percent of the limit-givers thought it was very impor-tant to leave an inheritance, compared to just 35 percent of the non-limit-givers. At the other tail, less than 7 percent of the limit-givers viewedleaving an inheritance as unimportant, while 18 percent of the non-limit-givers did. These differences in past giving and in the importance ofleaving an inheritance could be an indicator of substantial heterogeneityin the desire to give to children.
6. CONCLUSIONSThe decision to make inter vivos transfers is complex. Such transfersdepend strongly on parental income and wealth and on the resourcesof the children (McGarry and Schoeni, 1995, 1997). Transfers also dependon the likely tax status of the estate (Poterba, 2000a, b; McGarry, 2000)and, as demonstrated here, on the marginal tax rate itself. Transfers aremore common among those with taxable wealth and are made in largeramounts. Furthermore, both the probability and expected amount oftransfers vary positively with the marginal tax rate. Changes in estatetaxes, operating through changes in the lifetime exemption and in the taxrates themselves, have a strong effect on the transfer behavior of thewealthy. In simulations, eliminating the estate tax results in a decrease ofnearly 30 percent in expected transfers to children among those initiallysubject to tax.
While the literature has focused on the role of taxable inter vivos trans-fers as a mechanism to reduce estate and gift taxes, the evidence pre-sented here suggests that not only do the wealthy fail to make inter vivosgifts above the tax-free limits, but they also forgo many opportunities toreduce the tax owed by the estate by costlessly transferring $10,000 peryear to children; 90 percent of wealthy parents transfer less than thisamount. Although several explanations have been offered for this lack ofgiving, we are only beginning to assess their validity, and certainlyadditional investigation is needed.
Finally, inter vivos transfers are also relatively frequent among thoseunlikely to face estate taxation. In the sample used in this paper, 30percent of parents with wealth below the taxable limits made transfers totheir children in the past year, suggesting that there are important mo-tives for transferring resources beyond those due to tax planning. Thus,while one should conclude that estate and gift taxes likely play an impor-

Inter Vivos Transfers or Bequests? 119
tant role in altering the transfer behavior of the wealthy, the decisionprocess is sufficiently complex that numerous other factors also affectthis behavior.
APPENDIX
The means and standard errors of the variables used in the analysis aregiven in Table 9.
TABLE 9Means of Variables Used in Analysis
(a) The number of observations differs for some variables due to missing values.
Mean Std. err.
Financial variables
Bequeathable wealth 261,530 4,550Log of positive values 11.05 0.027
Income (respondent and spouse) 32,929 423Log of positive values 9.62 0.019
Fraction of wealth in home (overall) 0.148 0.004Fraction of wealth in business (overall) 0.058 0.024Fraction of wealth in farm (overall) 0.019 0.001Fraction of wealth in stock (overall) 0.055 0.012
Marginal tax rates
Full sample 0.02 0.001Conditional on positive tax 0.41 0.002
Demographic variables
Life expectancy 29.2 0.15Married 0.58 0.005Nonwhite 0.16 0.003Number of children 3.29 0.012Average age of children 37.4 0.11Average income of children 37,040 195
Transfer behavior
Transfer to at least one child 0.32 0.004Total amount of transfers (over positive
values)5,608 241
Number of observations(a) 11,754
120 McGarry
REFERENCES
Auten, Gerald, and David Joulfaian (1996). "Charitable Contributions and In-tergenerational Transfers." Journal of Public Economics 59:55-68.
Barthold, Thomas and Robert Plotnick (1984). "Estate Taxation and other Deter-minants of Charitable Bequests," National Tax Journal 37 (2): 225-237.
Boskin, Michael I. (1976). "Estate Taxation and Charitable Bequests." Journal ofPublic Economics 5:27-56.
Cooper, George (1976). A Voluntary Tax? Washington: The Brookings Institute.Cox, Donald (1990). "Intergenerational Transfers and Liquidity Constraints."
Quarterly Journal of Economics 95(no. 3):509-546.Eller, Martha Britton (1996). "Federal Taxation of Wealth Transfers." Statistics of
Income Bulletin: Winter, 8-23. Washington: Internal Revenue Service.Feldstein, Martin, and Charles Clotfelter (1976). "Tax Incentives and Charitable
Giving in the United States." Journal of Public Economics 5:1-26.Gale, William, and Maria Perozek (1999). "Do Estate Taxes Reduce Savings?"
The Brookings Institute. Mimeograph.Gale, William, and John Karl Scholz (1994). "Intergenerational Transfers and
the Accumulation of Wealth." The Journal of Economic Perspectives 8(no. 4):145-160.
Internal Revenue Service (1997). Introduction to Estate and Gift Taxes. Departmentof the Treasury. Publication 950. June.
(1999). "Instructions for Form 709." January.Joulfaian, David (1991). "Charitable Bequests and Estate Taxes." National Tax
Journal 44:169-180.(1998). "The Federal Estate and Gift Tax: Description, Profile of Taxpay-
ers and Economic Consequences." U.S. Department of the Treasury. OTAPaper 80.
(1999). "To Gift or to Bequest: Do the Wealthy Equalize True Estate andGift Tax Rates?" U.S. Department of the Treasury. June. Mimeograph.
Joulfaian, David, and Mark Wilhelm (1994). "Inheritance and Labor Supply."Journal of Human Resources 29:1205-1234.
McGarry, Kathleen (1999). "Inter Vivos Transfers and Intended Bequests." Jour-nal of Public Economics 73:321-351.
(2000). "The Cost of Equality: Unequal Bequests and Tax Avoidance."Forthcoming in Journal of Public Economics.
McGarry, Kathleen, and Robert Schoerui (1995). "Transfer Behavior in theHealth and Retirement Study: Measurements and the Redistribution of Re-sources within the Family." Journal of Human Resources 30:s184-s226.
(1997). "Transfer Behavior within the Family: Results from the Asset andHealth Dynamics Survey." Journals of Gerontology 52B:82-92.
Page, Benjamin (1997). "Bequest Taxes, Inter Vivos Gifts, and the Bequest Mo-tive." Congressional Budget Office. Mimeograph.
Poterba, James (2000a). "The Estate Tax and After-Tax Investment Returns."Forthcoming in Does Atlas Shrug? The Economic Consequences of Taxing the Rich,Joel Slemrod (Ed.). Cambridge, MA: Harvard University Press.
(2000b). "Estate and Gift Taxes and Incentives for Inter Vivos Giving inthe United States." Forthcoming in Journal of Public Economics.

Inter Vivos Transfers or Bequests? 121
United States Congress (1999a). Taxpayer Refund and Relief Act of 1999. EnrolledBifi H.R.2488.ENR.
(1999b). Taxpayer Refund and Relief Act of 1999, Conference Report to Accom-pany HR. 2488. Report 106-289.
United States Department of Health and Human Services (1996). Vital Statistics ofthe United States, 1992. Volume II, Mortality. Hyattsville, MD.
