intellectual property rights - cbp.gov · intellectual property rights fiscal year 2013 seizure...
TRANSCRIPT
Intellectual Property RightsFiscal Year 2013 Seizure StatisticsPrepared by U.S. Customs and Border ProtectionOffice of International Trade

Intellectual Property RightsFiscal Year 2013 Seizure StatisticsPrepared by U.S. Customs and Border ProtectionOffice of International Trade

Table of ContentsExecutive Summary .............................................................. 2
Year in Review ..................................................................... 4
Top Commodities Seized ...................................................... 6
Source Economies .............................................................. 10
Shipping Environments ...................................................... 12
IPR Seizure Statistics Infographic................... .................... 14
Statistical Appendix......................................................... ... 17
Disclaimer: The information contained in this report does not constitute the official trade statistics of the United States. The statistics, and the projections based upon those statistics, are not intended to be used for economic analysis, and are provided for the purpose of establishing DHS priorities and workload.
As the U.S. Department of Homeland Security (DHS) continues its trade transformation program to align the agency mission with the realities of modern business practices and trade in the 21st century, we have updated the way in which intellectual property rights enforcement is reported.
Executive SummaryProducts that infringe on U.S. trademarks, copyrights, and patents threaten the health and safety of American consumers, our economy, and our national security. U.S. Customs and Border Protection (CBP) and U.S. Immigration and Customs Enforcement’s (ICE) Homeland Security Investigations (HSI) continued Intellectual Property Rights (IPR) enforcement againstthese illicit imports mitigates the financial and welfare risk.
In Fiscal Year (FY) 2013 the number of IPR seizures increased nearly 7% to 24,361 from 22,848 in FY 2012. The manufacturer’s suggested retail price (MSRP) of the goods had they been genuine, increased 38% to $1,743,515,581.
Tactical interagency collaboration led by the National Intellectual Property Rights Coordination Center led to 693 arrests,411 indictments, and 465 convictions for IPR crimes in FY 2013. Additionally, 1,413 domain names distributing counterfeitmerchandise were seized, 35 exclusion order enforcement actions were completed and 20 shipments of circumvention devices were seized.
Each year, more than 11 million maritime containers arrive at our seaports. At land borders, another 10 million arrive by truckand 3 million by rail. Through air travel arrives an additional quarter billion more cargo, postal, and express consignmentpackages. The agencies within DHS remain vigilant in targeting shipments posing a risk to the American people.
2
3
Year in Review
10 Year Seizure Totals
Num
ber
of S
eizu
res
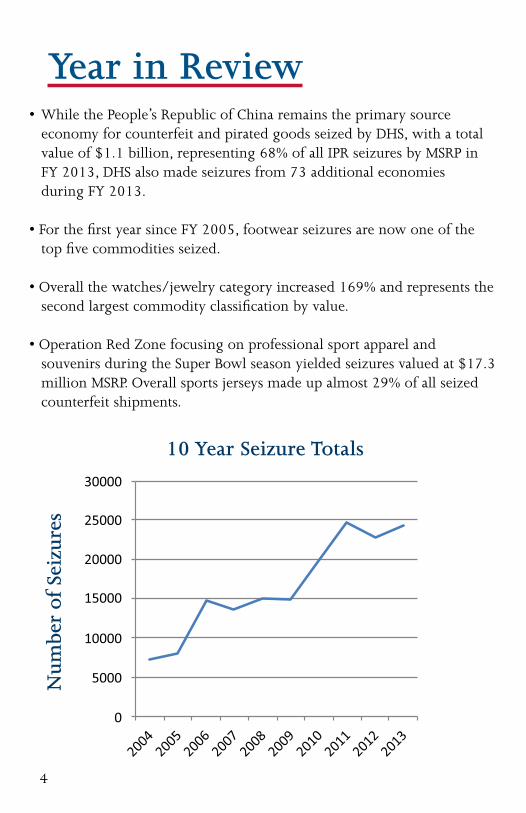
• While the People’s Republic of China remains the primary source economy for counterfeit and pirated goods seized by DHS, with a total value of $1.1 billion, representing 68% of all IPR seizures by MSRP in FY 2013, DHS also made seizures from 73 additional economies during FY 2013.
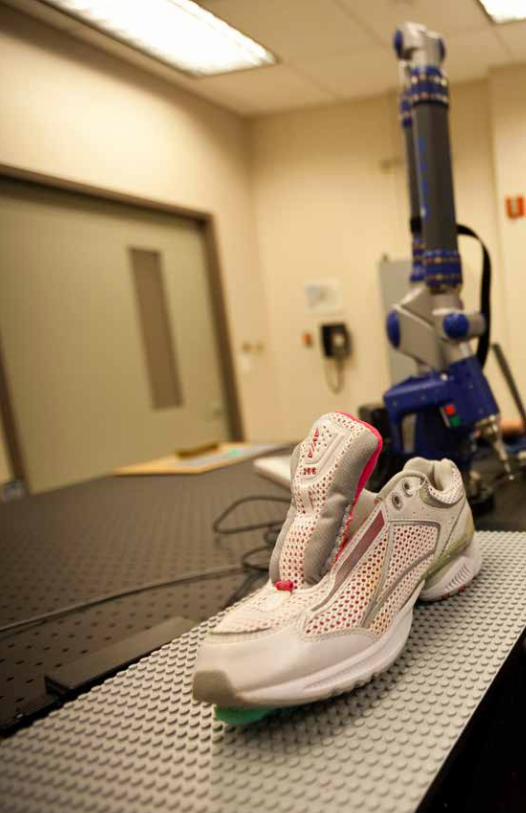
• For the first year since FY 2005, footwear seizures are now one of the top five commodities seized.
• Overall the watches/jewelry category increased 169% and represents the second largest commodity classification by value.
• Operation Red Zone focusing on professional sport apparel and souvenirs during the Super Bowl season yielded seizures valued at $17.3 million MSRP. Overall sports jerseys made up almost 29% of all seized
counterfeit shipments.
4
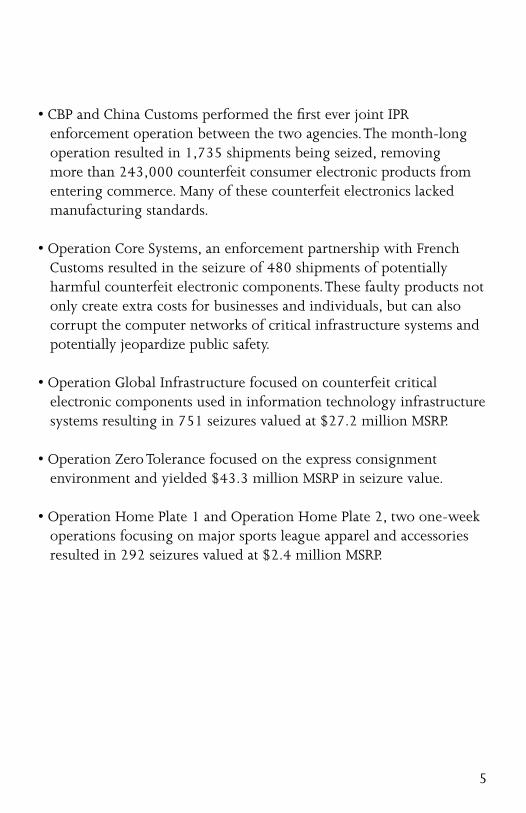
• CBP and China Customs performed the first ever joint IPR enforcement operation between the two agencies. The month-long
operation resulted in 1,735 shipments being seized, removing more than 243,000 counterfeit consumer electronic products from entering commerce. Many of these counterfeit electronics lacked manufacturing standards.
• Operation Core Systems, an enforcement partnership with French Customs resulted in the seizure of 480 shipments of potentially harmful counterfeit electronic components. These faulty products not only create extra costs for businesses and individuals, but can also corrupt the computer networks of critical infrastructure systems and potentially jeopardize public safety.
• Operation Global Infrastructure focused on counterfeit critical electronic components used in information technology infrastructure systems resulting in 751 seizures valued at $27.2 million MSRP.
• Operation Zero Tolerance focused on the express consignment environment and yielded $43.3 million MSRP in seizure value.
• Operation Home Plate 1 and Operation Home Plate 2, two one-week operations focusing on major sports league apparel and accessories resulted in 292 seizures valued at $2.4 million MSRP.
5

Top Commodities
40%
29%
8%
7%
5%
3%3%
2%2%1%
Handbags/WalletsWatches/JewelryConsumer Electronics/PartsWearing Apparel/AccessoriesPharmaceuticals/Personal CareFootwearComputers/AccessoriesLabels/TagsOptical MediaOther
41%
15%11%
8%
8%
7%
3%3%
2%1%2%
Handbags/WalletsWatches/JewelryWearing Apparel/AccessoriesConsumer Electronics/PartsFootwearPharmaceuticals/Personal CareOptical MediaComputers/AccessoriesLabels/TagsToysOther
6
FY 2
013
Seiz
ure
s -
MSR
P V
alu
eFY
201
2 Se
izu
res
- M
SRP
Val
ue
7
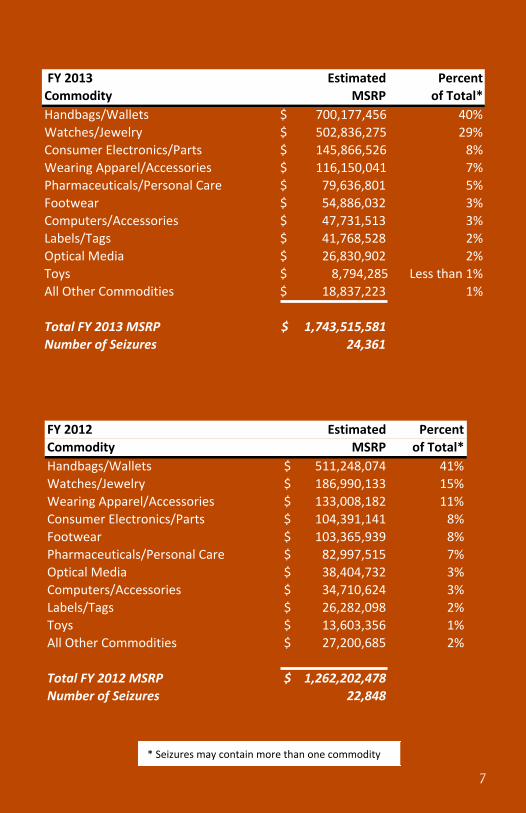
FY 2013 Estimated Percent FY 2012 Estimated PercentCommodity MSRP of Total* Commodity MSRP of Total*Handbags/Wallets $ 700,177,456 40% Handbags/Wallets 511,248,074$ 41%Watches/Jewelry $ 502,836,275 29% Watches/Jewelry 186,990,133$ 15%Consumer Electronics/Parts $ 145,866,526 8% Wearing Apparel/Accessories 133,008,182$ 11%Wearing Apparel/Accessories $ 116,150,041 7% Consumer Electronics/Parts 104,391,141$ 8%Pharmaceuticals/Personal Care $ 79,636,801 5% Footwear 103,365,939$ 8%Footwear $ 54,886,032 3% Pharmaceuticals/Personal Care 82,997,515$ 7%Computers/Accessories $ 47,731,513 3% Optical Media 38,404,732$ 3%Labels/Tags $ 41,768,528 2% Computers/Accessories 34,710,624$ 3%Optical Media $ 26,830,902 2% Labels/Tags 26,282,098$ 2%Toys $ 8,794,285 Less than 1% Toys 13,603,356$ 1%All Other Commodities $ 18,837,223 1% All Other Commodities 27,200,685$ 2%
Total FY 2013 MSRP 1,743,515,581$ Total FY 2012 MSRP 1,262,202,478$ 100%Number of Seizures 24,361 Number of Seizures 22,848
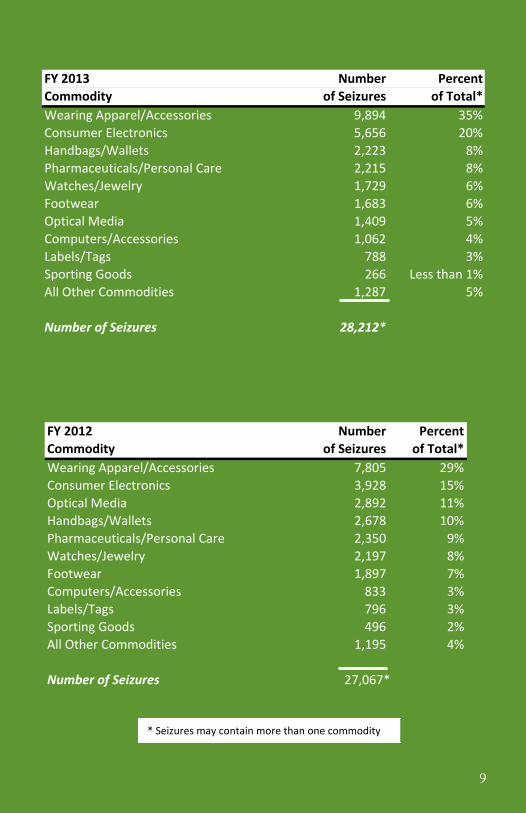
FY 2013 Number Percent FY 2012 Number PercentCommodity of Seizures of Total* Commodity of Seizures of Total*Wearing Apparel/Accessories 9,894 35% Wearing Apparel/Accessories 7,805 29%Consumer Electronics 5,656 20% Consumer Electronics 3,928 15%Handbags/Wallets 2,223 8% Optical Media 2,892 11%Pharmaceuticals/Personal Care 2,215 8% Handbags/Wallets 2,678 10%Watches/Jewelry 1,729 6% Pharmaceuticals/Personal Care 2,350 9%Footwear 1,683 6% Watches/Jewelry 2,197 8%Optical Media 1,409 5% Footwear 1,897 7%Computers/Accessories 1,062 4% Computers/Accessories 833 3%Labels/Tags 788 3% Labels/Tags 796 3%Sporting Goods 266 Less than 1% Sporting Goods 496 2%All Other Commodities 1,287 5% All Other Commodities 1,195 4%
Number of Seizures 28,212* Number of Seizures 27,067* *
* Seizures may contain more than one commodity
FY 2013 Estimated Percent FY 2012 Estimated PercentCommodity MSRP of Total* Commodity MSRP of Total*Handbags/Wallets $ 700,177,456 40% Handbags/Wallets 511,248,074$ 41%Watches/Jewelry $ 502,836,275 29% Watches/Jewelry 186,990,133$ 15%Consumer Electronics/Parts $ 145,866,526 8% Wearing Apparel/Accessories 133,008,182$ 11%Wearing Apparel/Accessories $ 116,150,041 7% Consumer Electronics/Parts 104,391,141$ 8%Pharmaceuticals/Personal Care $ 79,636,801 5% Footwear 103,365,939$ 8%Footwear $ 54,886,032 3% Pharmaceuticals/Personal Care 82,997,515$ 7%Computers/Accessories $ 47,731,513 3% Optical Media 38,404,732$ 3%Labels/Tags $ 41,768,528 2% Computers/Accessories 34,710,624$ 3%Optical Media $ 26,830,902 2% Labels/Tags 26,282,098$ 2%Toys $ 8,794,285 Less than 1% Toys 13,603,356$ 1%All Other Commodities $ 18,837,223 1% All Other Commodities 27,200,685$ 2%
Total FY 2013 MSRP 1,743,515,581$ Total FY 2012 MSRP 1,262,202,478$ 100%Number of Seizures 24,361 Number of Seizures 22,848
FY 2013 Number Percent FY 2012 Number PercentCommodity of Seizures of Total* Commodity of Seizures of Total*Wearing Apparel/Accessories 9,894 35% Wearing Apparel/Accessories 7,805 29%Consumer Electronics 5,656 20% Consumer Electronics 3,928 15%Handbags/Wallets 2,223 8% Optical Media 2,892 11%Pharmaceuticals/Personal Care 2,215 8% Handbags/Wallets 2,678 10%Watches/Jewelry 1,729 6% Pharmaceuticals/Personal Care 2,350 9%Footwear 1,683 6% Watches/Jewelry 2,197 8%Optical Media 1,409 5% Footwear 1,897 7%Computers/Accessories 1,062 4% Computers/Accessories 833 3%Labels/Tags 788 3% Labels/Tags 796 3%Sporting Goods 266 Less than 1% Sporting Goods 496 2%All Other Commodities 1,287 5% All Other Commodities 1,195 4%
Number of Seizures 28,212* Number of Seizures 27,067* *
* Seizures may contain more than one commodity
FY 2013 Number Percent FY 2012 Number PercentCommodity of Seizures of Total* Commodity of Seizures of Total*
Wearing Apparel/Accessories 9,894 35% Wearing Apparel/Accessories 7,805 29%Consumer Electronics 5,656 20% Consumer Electronics 3,928 15%Handbags/Wallets 2,223 8% Optical Media 2,892 11%Pharmaceuticals/Personal Care 2,215 8% Handbags/Wallets 2,678 10%Watches/Jewelry 1,729 6% Pharmaceuticals/Personal Care 2,350 9%Footwear 1,683 6% Watches/Jewelry 2,197 8%Optical Media 1,409 5% Footwear 1,897 7%Computers/Accessories 1,062 4% Computers/Accessories 833 3%Labels/Tags 788 3% Labels/Tags 796 3%Sporting Goods 266 Less than 1% Sporting Goods 496 2%All Other Commodities 1,287 5% All Other Commodities 1,195 4%
Number of Seizures 28,212* Number of Seizures 27,067 *
* Seizures may contain more than one commodity
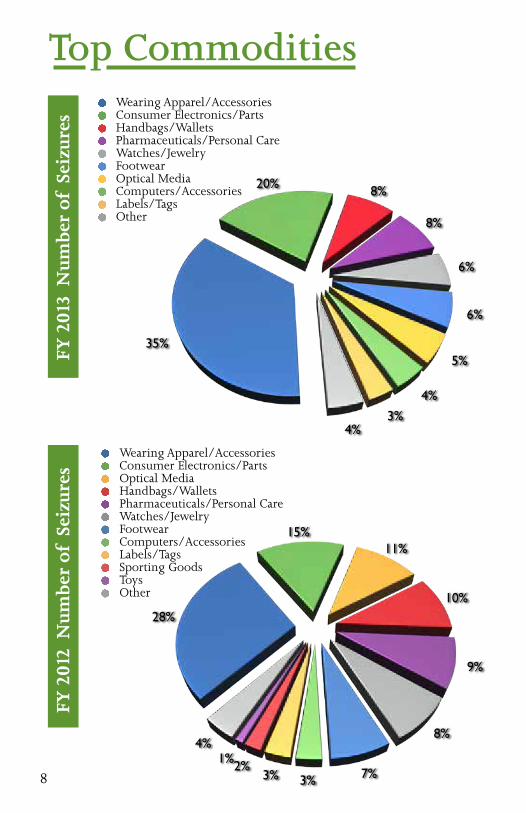
Top Commodities
35%
20% 8%
8%
6%
6%
5%
4%
3%4%
Wearing Apparel/AccessoriesConsumer Electronics/PartsHandbags/WalletsPharmaceuticals/Personal CareWatches/JewelryFootwearOptical MediaComputers/AccessoriesLabels/TagsOther
28%
15%11%
10%
9%
8%
7%3%3%2%1%
4%
Wearing Apparel/AccessoriesConsumer Electronics/PartsOptical MediaHandbags/WalletsPharmaceuticals/Personal CareWatches/JewelryFootwearComputers/AccessoriesLabels/TagsSporting GoodsToysOther
8
FY 2
013
Nu
mbe
r of
Sei
zure
s FY
201
2 N
um
ber
of S
eizu
res
9
FY 2013 Estimated Percent FY 2012 Estimated PercentCommodity MSRP of Total* Commodity MSRP of Total*Handbags/Wallets $ 700,177,456 40% Handbags/Wallets 511,248,074$ 41%Watches/Jewelry $ 502,836,275 29% Watches/Jewelry 186,990,133$ 15%Consumer Electronics/Parts $ 145,866,526 8% Wearing Apparel/Accessories 133,008,182$ 11%Wearing Apparel/Accessories $ 116,150,041 7% Consumer Electronics/Parts 104,391,141$ 8%Pharmaceuticals/Personal Care $ 79,636,801 5% Footwear 103,365,939$ 8%Footwear $ 54,886,032 3% Pharmaceuticals/Personal Care 82,997,515$ 7%Computers/Accessories $ 47,731,513 3% Optical Media 38,404,732$ 3%Labels/Tags $ 41,768,528 2% Computers/Accessories 34,710,624$ 3%Optical Media $ 26,830,902 2% Labels/Tags 26,282,098$ 2%Toys $ 8,794,285 Less than 1% Toys 13,603,356$ 1%All Other Commodities $ 18,837,223 1% All Other Commodities 27,200,685$ 2%
Total FY 2013 MSRP 1,743,515,581$ Total FY 2012 MSRP 1,262,202,478$ 100%Number of Seizures 24,361 Number of Seizures 22,848
FY 2013 Number Percent FY 2012 Number PercentCommodity of Seizures of Total* Commodity of Seizures of Total*Wearing Apparel/Accessories 9,894 35% Wearing Apparel/Accessories 7,805 29%Consumer Electronics 5,656 20% Consumer Electronics 3,928 15%Handbags/Wallets 2,223 8% Optical Media 2,892 11%Pharmaceuticals/Personal Care 2,215 8% Handbags/Wallets 2,678 10%Watches/Jewelry 1,729 6% Pharmaceuticals/Personal Care 2,350 9%Footwear 1,683 6% Watches/Jewelry 2,197 8%Optical Media 1,409 5% Footwear 1,897 7%Computers/Accessories 1,062 4% Computers/Accessories 833 3%Labels/Tags 788 3% Labels/Tags 796 3%Sporting Goods 266 Less than 1% Sporting Goods 496 2%All Other Commodities 1,287 5% All Other Commodities 1,195 4%
Number of Seizures 28,212* Number of Seizures 27,067* *
* Seizures may contain more than one commodity
FY 2013 Number Percent FY 2012 Number PercentCommodity of Seizures of Total* Commodity of Seizures of Total*
Wearing Apparel/Accessories 9,894 35% Wearing Apparel/Accessories 7,805 29%Consumer Electronics 5,656 20% Consumer Electronics 3,928 15%Handbags/Wallets 2,223 8% Optical Media 2,892 11%Pharmaceuticals/Personal Care 2,215 8% Handbags/Wallets 2,678 10%Watches/Jewelry 1,729 6% Pharmaceuticals/Personal Care 2,350 9%Footwear 1,683 6% Watches/Jewelry 2,197 8%Optical Media 1,409 5% Footwear 1,897 7%Computers/Accessories 1,062 4% Computers/Accessories 833 3%Labels/Tags 788 3% Labels/Tags 796 3%Sporting Goods 266 Less than 1% Sporting Goods 496 2%All Other Commodities 1,287 5% All Other Commodities 1,195 4%
Number of Seizures 28,212* Number of Seizures 27,067 *
* Seizures may contain more than one commodity
FY 2013 Estimated Percent FY 2012 Estimated PercentCommodity MSRP of Total* Commodity MSRP of Total*Handbags/Wallets $ 700,177,456 40% Handbags/Wallets 511,248,074$ 41%Watches/Jewelry $ 502,836,275 29% Watches/Jewelry 186,990,133$ 15%Consumer Electronics/Parts $ 145,866,526 8% Wearing Apparel/Accessories 133,008,182$ 11%Wearing Apparel/Accessories $ 116,150,041 7% Consumer Electronics/Parts 104,391,141$ 8%Pharmaceuticals/Personal Care $ 79,636,801 5% Footwear 103,365,939$ 8%Footwear $ 54,886,032 3% Pharmaceuticals/Personal Care 82,997,515$ 7%Computers/Accessories $ 47,731,513 3% Optical Media 38,404,732$ 3%Labels/Tags $ 41,768,528 2% Computers/Accessories 34,710,624$ 3%Optical Media $ 26,830,902 2% Labels/Tags 26,282,098$ 2%Toys $ 8,794,285 Less than 1% Toys 13,603,356$ 1%All Other Commodities $ 18,837,223 1% All Other Commodities 27,200,685$ 2%
Total FY 2013 MSRP 1,743,515,581$ Total FY 2012 MSRP 1,262,202,478$ 100%Number of Seizures 24,361 Number of Seizures 22,848
FY 2013 Number Percent FY 2012 Number PercentCommodity of Seizures of Total* Commodity of Seizures of Total*Wearing Apparel/Accessories 9,894 35% Wearing Apparel/Accessories 7,805 29%Consumer Electronics 5,656 20% Consumer Electronics 3,928 15%Handbags/Wallets 2,223 8% Optical Media 2,892 11%Pharmaceuticals/Personal Care 2,215 8% Handbags/Wallets 2,678 10%Watches/Jewelry 1,729 6% Pharmaceuticals/Personal Care 2,350 9%Footwear 1,683 6% Watches/Jewelry 2,197 8%Optical Media 1,409 5% Footwear 1,897 7%Computers/Accessories 1,062 4% Computers/Accessories 833 3%Labels/Tags 788 3% Labels/Tags 796 3%Sporting Goods 266 Less than 1% Sporting Goods 496 2%All Other Commodities 1,287 5% All Other Commodities 1,195 4%
Number of Seizures 28,212* Number of Seizures 27,067* *
* Seizures may contain more than one commodity
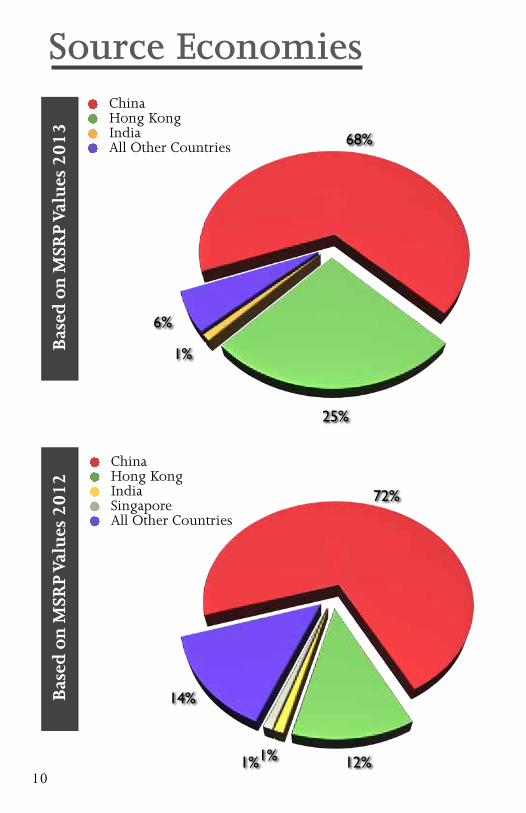
72%
12%1%1%
14%
ChinaHong KongIndiaSingaporeAll Other Countries
68%
25%
1%
6%
ChinaHong KongIndiaAll Other Countries
Source EconomiesB
ased
on
MSR
P Va
lues
201
3 B
ased
on
MSR
P Va
lues
201
2
10
11
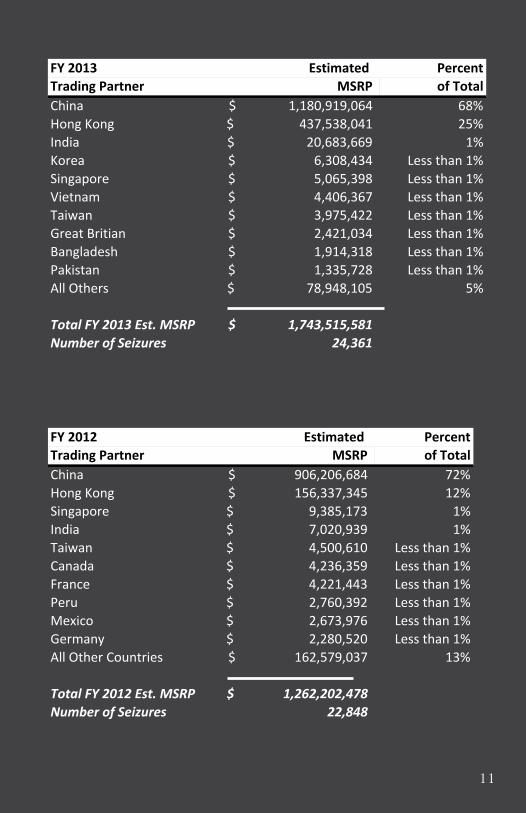
FY 2013 Estimated Percent FY 2012 Estimated PercentTrading Partner MSRP of Total Trading Partner MSRP of TotalChina 1,180,919,064$ 68% China 906,206,684$ 72%Hong Kong 437,538,041$ 25% Hong Kong 156,337,345$ 12%India 20,683,669$ 1% Singapore 9,385,173$ 1%Korea 6,308,434$ Less than 1% India 7,020,939$ 1%Singapore 5,065,398$ Less than 1% Taiwan 4,500,610$ Less than 1%Vietnam 4,406,367$ Less than 1% Canada 4,236,359$ Less than 1%Taiwan 3,975,422$ Less than 1% France 4,221,443$ Less than 1%Great Britian 2,421,034$ Less than 1% Peru 2,760,392$ Less than 1%Bangladesh 1,914,318$ Less than 1% Mexico 2,673,976$ Less than 1%Pakistan 1,335,728$ Less than 1% Germany 2,280,520$ Less than 1%All Others 78,948,105$ 5% All Other Countries 162,579,037$ 13%
Total FY 2013 Est. MSRP 1,743,515,581$ Total FY 2012 Est. MSRP 1,262,202,478$ Number of Seizures 24,361 Number of Seizures 22,848
FY 2013 Number Percent FY 2012 Number PercentTrading Partner of Seizures of Total Trading Partner of Seizures of TotalChina 11,861 China 10,528 46%Hong Kong 8,280 Hong Kong 7,550 33%Singapore 639 Turkey 673 3%Turkey 453 Singapore 574 3%India 380 All Other Countries 3,578 16%All Other Countries 2,779
Number of Seizures 22,903**Number of Seizures 24,392**
0
2,000
4,000
6,000
8,000
10,000
12,000
ExpressMailCargoOthers
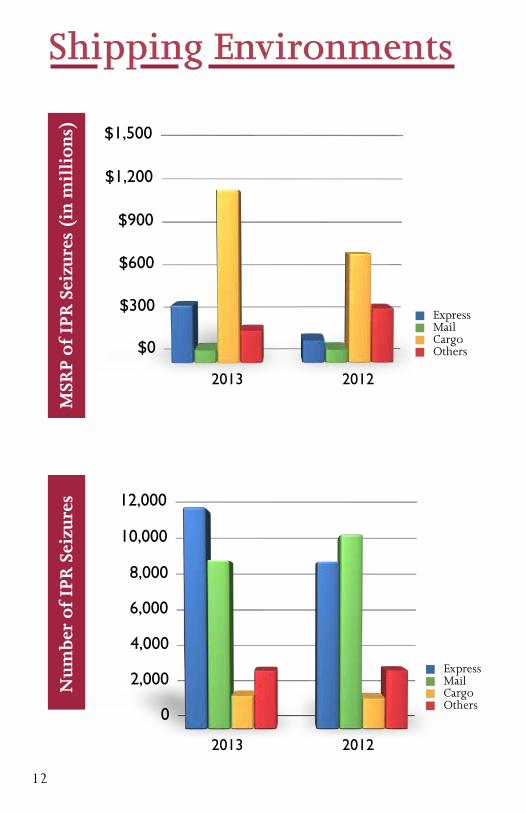
Shipping Environments
$0
$300
$600
$900
$1,200
$1,500
ExpressMailCargoOthers$0
$300
$600
$900
$1,200
$1,500
ExpressMailCargoOthers
12
MSR
P of
IPR
Sei
zure
s (i
n m
illi
ons)
Nu
mbe
r of
IPR
Sei
zure
s
2013
2013
2012
2012
13
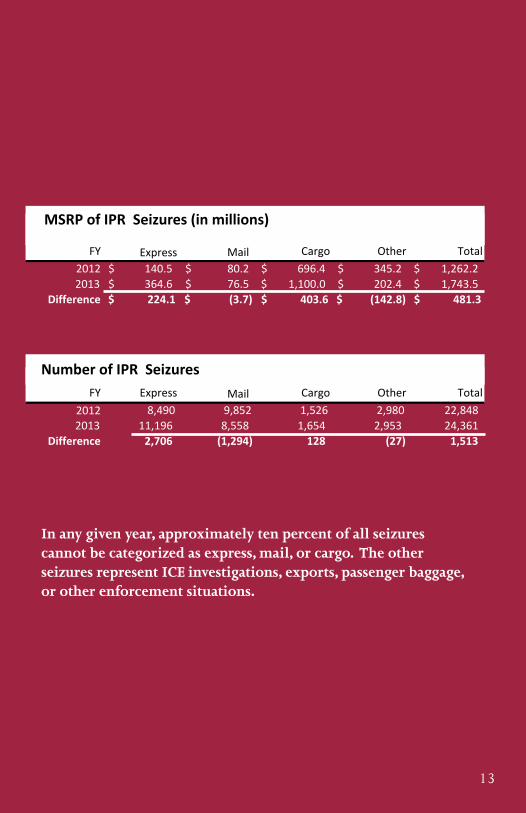
FY Express Mail Cargo Other Total2012 140.5$ 80.2$ 696.4$ 345.2$ 1,262.2$ 2013 364.6$ 76.5$ 1,100.0$ 202.4$ 1,743.5$
Difference $ 224.1 $ (3.7) $ 403.6 $ (142.8) $ 481.3
FY Express Mail Cargo Other Total2012 8,490 9,852 1,526 2,980 22,848 2013 11,196 8,558 1,654 2,953 24,361
Difference 2,706 (1,294) 128 (27) 1,513
Number of IPR Seizures
MSRP of IPR Seizures (in millions)
MSRP of IPR Seizures (in millions)
Number of IPR Seizures
In any given year, approximately ten percent of all seizures cannot be categorized as express, mail, or cargo. The other seizures represent ICE investigations, exports, passenger baggage, or other enforcement situations.

FY 2013 TOTALS:24,361 - NUMBER OF SEIZURES
$1,743,515,581 - MSRP
SOURCE ECONOMIES
SHIPPING ENVIRONMENTS
TOP
COM
MOD
ITIE
S SE
IZED
BY
NUM
BER
OF S
EIZU
RES
11,196
MAI
L
8,558EX
PRES
S1,654
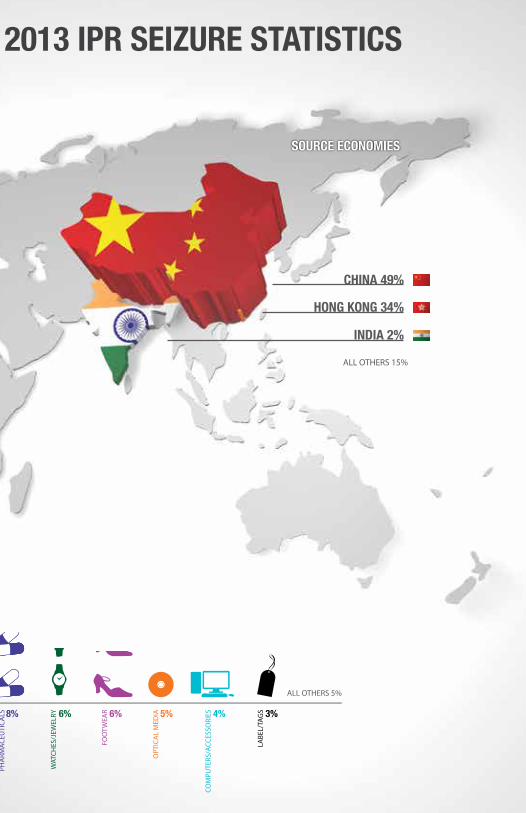
CHINA 49%
HONG KONG 34%
INDIA 2%
ALL OTHERS 15%
CARG
O
ALL OTHERS 5%
FISCAL YEAR 2013 IPR SEIZURE STATISTICS
ELEC
TRO
NIC
S/PA
RTS 20%
APP
ARE
L/AC
CESS
ORI
ES 35%
HA
ND
BAG
S/W
ALL
ETS 8%
OPT
ICA
L M
EDIA 5%
COM
PUTE
RS/A
CCES
SORI
ES 4%
LABE
L/TA
GS 3%
PHA
RMAC
EUTI
CALS 8%
WAT
CHES
/JEW
ELRY 6%
FOO
TWEA
R 6%
FY 2013 TOTALS:24,361 - NUMBER OF SEIZURES
$1,743,515,581 - MSRP
SOURCE ECONOMIES
SHIPPING ENVIRONMENTS
TOP
COM
MOD
ITIE
S SE
IZED
BY
NUM
BER
OF S
EIZU
RES
11,196
MAI
L
8,558
EXPR
ESS
1,654
CHINA 49%
HONG KONG 34%
INDIA 2%
ALL OTHERS 15%
CARG
O
ALL OTHERS 5%
FISCAL YEAR 2013 IPR SEIZURE STATISTICS
ELEC
TRO
NIC
S/PA
RTS 20%
APP
ARE
L/AC
CESS
ORI
ES 35%
HA
ND
BAG
S/W
ALL
ETS 8%
OPT
ICA
L M
EDIA 5%
COM
PUTE
RS/A
CCES
SORI
ES 4%
LABE
L/TA
GS 3%
PHA
RMAC
EUTI
CALS 8%
WAT
CHES
/JEW
ELRY 6%
FOO
TWEA
R 6%
16

Statistical Appendix
17
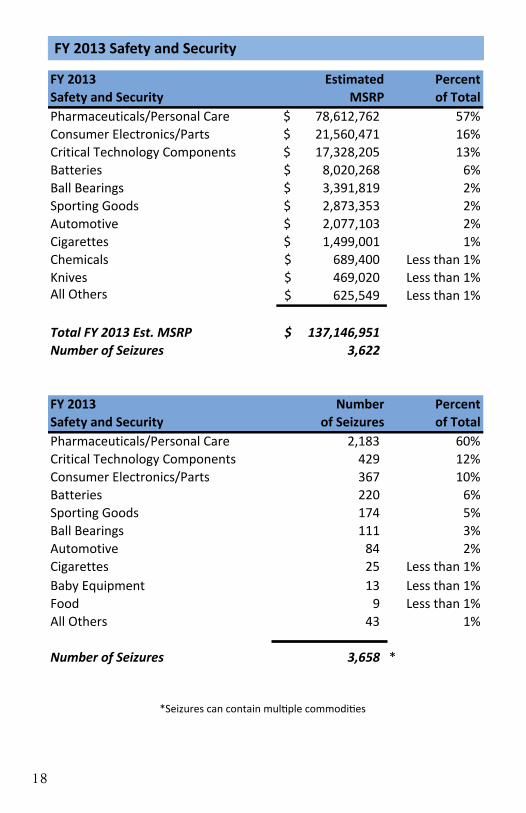
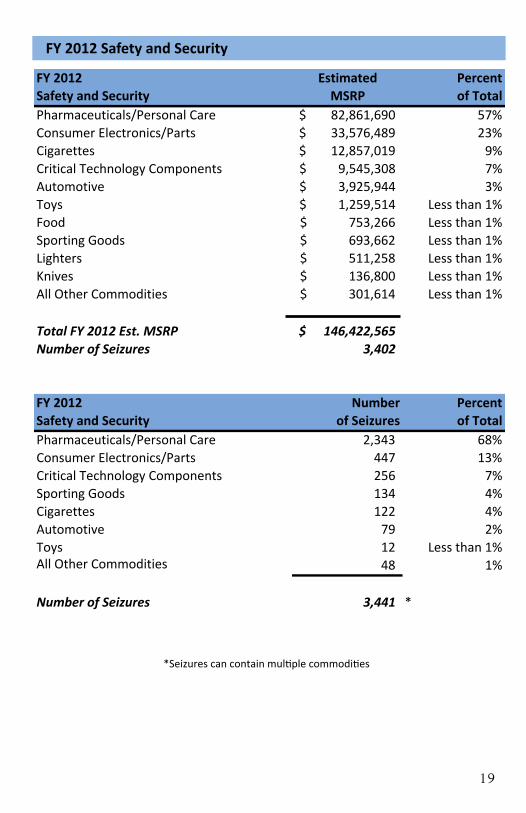
FY 2013 Estimated Percent FY 2012 Estimated PercentSafety and Security MSRP of Total Safety and Security MSRP of TotalPharmaceuticals/Personal Care 78,612,762$ 57% Pharmaceuticals/Personal Care 82,861,690$ 57%Consumer Electronics/Parts 21,560,471$ 16% Consumer Electronics/Parts 33,576,489$ 23%Critical Technology Components 17,328,205$ 13% Cigarettes 12,857,019$ 9%Batteries 8,020,268$ 6% Critical Technology Components 9,545,308$ 7%Ball Bearings 3,391,819$ 2% Automotive 3,925,944$ 3%Sporting Goods 2,873,353$ 2% Toys 1,259,514$ Less than 1%Automotive 2,077,103$ 2% Food 753,266$ Less than 1%Cigarettes 1,499,001$ 1% Sporting Goods 693,662$ Less than 1%Chemicals 689,400$ Less than 1% Lighters 511,258$ Less than 1%Knives 469,020$ Less than 1% Knives 136,800$ Less than 1%All Others 625,549$ Less than 1% All Other Commodities 301,614$ Less than 1%
Total FY 2013 Est. MSRP 137,146,951$ Total FY 2012 Est. MSRP 146,422,565$ Number of Seizures 3,622 Number of Seizures 3,402
FY 2013 Number Percent FY 2012 Number PercentSafety and Security of Seizures of Total Safety and Security of Seizures of TotalPharmaceuticals/Personal Care 2,183 60% Pharmaceuticals/Personal Care 2,343 68%Critical Technology Components 429 12% Consumer Electronics/Parts 447 13%Consumer Electronics/Parts 367 10% Critical Technology Components 256 7%Batteries 220 6% Sporting Goods 134 4%Sporting Goods 174 5% Cigarettes 122 4%Ball Bearings 111 3% Automotive 79 2%Automotive 84 2% Toys 12 Less than 1%Cigarettes 25 Less than 1% All Other Commodities 48 1%Baby Equipment 13 Less than 1%Food 9 Less than 1% Number of Seizures 3,441 *All Others 43 1%
Number of Seizures 3,658 *
18
FY 2013 Safety and Security
FY 2013 Estimated Percent FY 2012 Estimated PercentSafety and Security MSRP of Total Safety and Security MSRP of Total
Pharmaceuticals/Personal Care 78,612,762$ 57% Pharmaceuticals/Personal Care 82,861,690$ 56.59%Consumer Electronics/Parts 21,560,471$ 16% Consumer Electronics/Parts 33,576,489$ 22.93%Critical Technology Components 17,328,205$ 13% Cigarettes 12,857,019$ 8.78%Batteries 8,020,268$ 6% Critical Technology Components 9,545,308$ 6.52%Ball Bearings 3,391,819$ 2% Automotive 3,925,944$ 2.68%Sporting Goods 2,873,353$ 2% Toys 1,259,514$ 0.86%Automotive 2,077,103$ 2% Food 753,266$ 0.51%Cigarettes 1,499,001$ 1% Sporting Goods 693,662$ Less than 1%chem 689,400$ Less than 1% Lighters 511,258$ Less than 1%Knives 469,020$ Less than 1% Knives 136,800$ Less than 1%All Others 625,549$ Less than 1% All Other Commodities 301,614$ Less than 1%
Total FY 2013 Est. MSRP 137,146,951$ Total FY 2012 Est. MSRP 146,422,565$ Number of Seizures 3,622 Number of Seizures 3,402
FY 2013 Number Percent FY 2012 Number PercentSafety and Security of Seizures of Total Safety and Security of Seizures of Total
Pharmaceuticals/Personal Care 2,183 60% Pharmaceuticals/Personal Care 2,343 68%Critical Technology Components 429 12% Consumer Electronics/Parts 447 13%Consumer Electronics/Parts 367 10% Critical Technology Components 256 7%Batteries 220 6% Sporting Goods 134 4%Sporting Goods 174 5% Cigarettes 122 4%Ball Bearings 111 3% Automotive 79 2%Automotive 84 2% Toys 12 Less than 1%Cigarettes 25 Less than 1% All Other Commodities 48 1%Baby Equipment 13 Less than 1%Food 9 Less than 1% Number of Seizures 3,441 *All Others 43 1%
Number of Seizures 3,658 *
*Seizures can contain mulSple commodiSes
19
FY 2013 Estimated Percent FY 2012 Estimated PercentSafety and Security MSRP of Total Safety and Security MSRP of TotalPharmaceuticals/Personal Care 78,612,762$ 57% Pharmaceuticals/Personal Care 82,861,690$ 57%Consumer Electronics/Parts 21,560,471$ 16% Consumer Electronics/Parts 33,576,489$ 23%Critical Technology Components 17,328,205$ 13% Cigarettes 12,857,019$ 9%Batteries 8,020,268$ 6% Critical Technology Components 9,545,308$ 7%Ball Bearings 3,391,819$ 2% Automotive 3,925,944$ 3%Sporting Goods 2,873,353$ 2% Toys 1,259,514$ Less than 1%Automotive 2,077,103$ 2% Food 753,266$ Less than 1%Cigarettes 1,499,001$ 1% Sporting Goods 693,662$ Less than 1%Chemicals 689,400$ Less than 1% Lighters 511,258$ Less than 1%Knives 469,020$ Less than 1% Knives 136,800$ Less than 1%All Others 625,549$ Less than 1% All Other Commodities 301,614$ Less than 1%
Total FY 2013 Est. MSRP 137,146,951$ Total FY 2012 Est. MSRP 146,422,565$ Number of Seizures 3,622 Number of Seizures 3,402
FY 2013 Number Percent FY 2012 Number PercentSafety and Security of Seizures of Total Safety and Security of Seizures of TotalPharmaceuticals/Personal Care 2,183 60% Pharmaceuticals/Personal Care 2,343 68%Critical Technology Components 429 12% Consumer Electronics/Parts 447 13%Consumer Electronics/Parts 367 10% Critical Technology Components 256 7%Batteries 220 6% Sporting Goods 134 4%Sporting Goods 174 5% Cigarettes 122 4%Ball Bearings 111 3% Automotive 79 2%Automotive 84 2% Toys 12 Less than 1%Cigarettes 25 Less than 1% All Other Commodities 48 1%Baby Equipment 13 Less than 1%Food 9 Less than 1% Number of Seizures 3,441 *All Others 43 1%
Number of Seizures 3,658 *
FY 2012 Safety and SecurityFY 2013 Estimated Percent FY 2012 Estimated PercentSafety and Security MSRP of Total Safety and Security MSRP of Total
Pharmaceuticals/Personal Care 78,612,762$ 57% Pharmaceuticals/Personal Care 82,861,690$ 56.59%Consumer Electronics/Parts 21,560,471$ 16% Consumer Electronics/Parts 33,576,489$ 22.93%Critical Technology Components 17,328,205$ 13% Cigarettes 12,857,019$ 8.78%Batteries 8,020,268$ 6% Critical Technology Components 9,545,308$ 6.52%Ball Bearings 3,391,819$ 2% Automotive 3,925,944$ 2.68%Sporting Goods 2,873,353$ 2% Toys 1,259,514$ 0.86%Automotive 2,077,103$ 2% Food 753,266$ 0.51%Cigarettes 1,499,001$ 1% Sporting Goods 693,662$ Less than 1%chem 689,400$ Less than 1% Lighters 511,258$ Less than 1%Knives 469,020$ Less than 1% Knives 136,800$ Less than 1%All Others 625,549$ Less than 1% All Other Commodities 301,614$ Less than 1%
Total FY 2013 Est. MSRP 137,146,951$ Total FY 2012 Est. MSRP 146,422,565$ Number of Seizures 3,622 Number of Seizures 3,402
FY 2013 Number Percent FY 2012 Number PercentSafety and Security of Seizures of Total Safety and Security of Seizures of Total
Pharmaceuticals/Personal Care 2,183 60% Pharmaceuticals/Personal Care 2,343 68%Critical Technology Components 429 12% Consumer Electronics/Parts 447 13%Consumer Electronics/Parts 367 10% Critical Technology Components 256 7%Batteries 220 6% Sporting Goods 134 4%Sporting Goods 174 5% Cigarettes 122 4%Ball Bearings 111 3% Automotive 79 2%Automotive 84 2% Toys 12 Less than 1%Cigarettes 25 Less than 1% All Other Commodities 48 1%Baby Equipment 13 Less than 1%Food 9 Less than 1% Number of Seizures 3,441 *All Others 43 1%
Number of Seizures 3,658 *
*Seizures can contain mulSple commodiSes
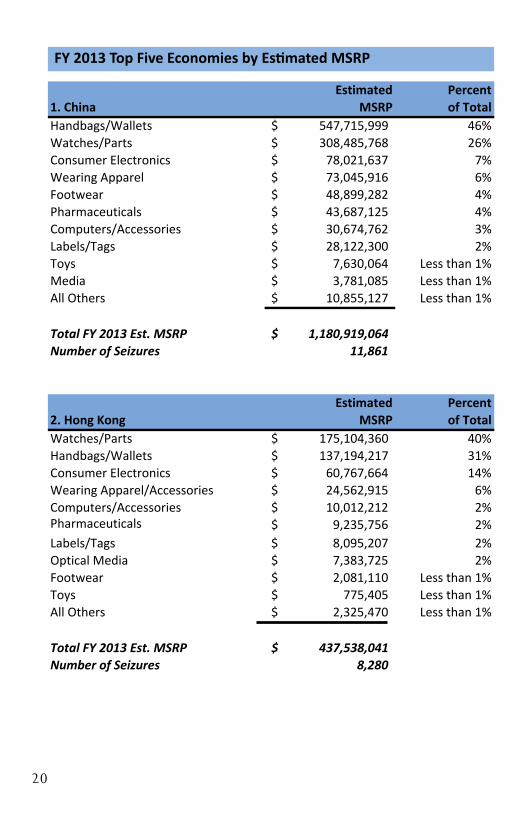
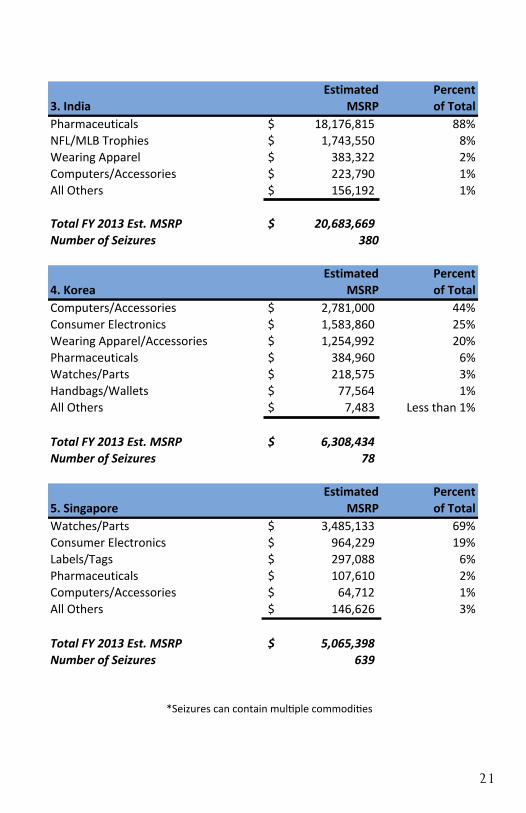
Estimated Percent Estimated Percent1. China MSRP of Total 3. India MSRP of TotalHandbags/Wallets 547,715,999$ 46% Pharmaceuticals 18,176,815$ 88%Watches/Parts 308,485,768$ 26% NFL/MLB Trophies 1,743,550$ 8%Consumer Electronics 78,021,637$ 7% Wearing Apparel 383,322$ 2%Wearing Apparel 73,045,916$ 6% Computers/Accessories 223,790$ 1%Footwear 48,899,282$ 4% All Others 156,192$ 1%Pharmaceuticals 43,687,125$ 4%Computers/Accessories 30,674,762$ 3% Total FY 2013 Est. MSRP 20,683,669$ Labels/Tags 28,122,300$ 2% Number of Seizures 380Toys 7,630,064$ Less than 1%Media 3,781,085$ Less than 1% Estimated PercentAll Others 10,855,127$ Less than 1% 4. Korea MSRP of Total
Computers/Accessories 2,781,000$ 44%Total FY 2013 Est. MSRP 1,180,919,064$ Consumer Electronics 1,583,860$ 25%Number of Seizures 11,861 Wearing Apparel/Accessories 1,254,992$ 20%
Pharmaceuticals 384,960$ 6%Watches/Parts 218,575$ 3%
Estimated Percent Handbags/Wallets 77,564$ 1%2. Hong Kong MSRP of Total All Others 7,483$ Less than 1%Watches/Parts 175,104,360$ 40%Handbags/Wallets 137,194,217$ 31% Total FY 2013 Est. MSRP 6,308,434$ Consumer Electronics 60,767,664$ 14% Number of Seizures 78 Wearing Apparel/Accessories 24,562,915$ 6%Computers/Accessories 10,012,212$ 2% Estimated PercentPharmaceuticals 9,235,756$ 2% 5. Singapore MSRP of TotalLabels/Tags 8,095,207$ 2% Watches/Parts 3,485,133$ 69%Optical Media 7,383,725$ 2% Consumer Electronics 964,229$ 19%Footwear 2,081,110$ Less than 1% Labels/Tags 297,088$ 6%Toys 775,405$ Less than 1% Pharmaceuticals 107,610$ 2%All Others 2,325,470$ Less than 1% Computers/Accessories 64,712$ 1%
All Others 146,626$ 3%Total FY 2013 Est. MSRP 437,538,041$ Number of Seizures 8,280 Total FY 2013 Est. MSRP 5,065,398$
Number of Seizures 639
20
FY 2013 Top Five Economies by Estimated MSRP
21
Estimated Percent Estimated Percent1. China MSRP of Total 3. India MSRP of TotalHandbags/Wallets 547,715,999$ 46% Pharmaceuticals 18,176,815$ 88%Watches/Parts 308,485,768$ 26% NFL/MLB Trophies 1,743,550$ 8%Consumer Electronics 78,021,637$ 7% Wearing Apparel 383,322$ 2%Wearing Apparel 73,045,916$ 6% Computers/Accessories 223,790$ 1%Footwear 48,899,282$ 4% All Others 156,192$ 1%Pharmaceuticals 43,687,125$ 4%Computers/Accessories 30,674,762$ 3% Total FY 2013 Est. MSRP 20,683,669$ Labels/Tags 28,122,300$ 2% Number of Seizures 380Toys 7,630,064$ Less than 1%Media 3,781,085$ Less than 1% Estimated PercentAll Others 10,855,127$ Less than 1% 4. Korea MSRP of Total
Computers/Accessories 2,781,000$ 44%Total FY 2013 Est. MSRP 1,180,919,064$ Consumer Electronics 1,583,860$ 25%Number of Seizures 11,861 Wearing Apparel/Accessories 1,254,992$ 20%
Pharmaceuticals 384,960$ 6%Watches/Parts 218,575$ 3%
Estimated Percent Handbags/Wallets 77,564$ 1%2. Hong Kong MSRP of Total All Others 7,483$ Less than 1%Watches/Parts 175,104,360$ 40%Handbags/Wallets 137,194,217$ 31% Total FY 2013 Est. MSRP 6,308,434$ Consumer Electronics 60,767,664$ 14% Number of Seizures 78 Wearing Apparel/Accessories 24,562,915$ 6%Computers/Accessories 10,012,212$ 2% Estimated PercentPharmaceuticals 9,235,756$ 2% 5. Singapore MSRP of TotalLabels/Tags 8,095,207$ 2% Watches/Parts 3,485,133$ 69%Optical Media 7,383,725$ 2% Consumer Electronics 964,229$ 19%Footwear 2,081,110$ Less than 1% Labels/Tags 297,088$ 6%Toys 775,405$ Less than 1% Pharmaceuticals 107,610$ 2%All Others 2,325,470$ Less than 1% Computers/Accessories 64,712$ 1%
All Others 146,626$ 3%Total FY 2013 Est. MSRP 437,538,041$ Number of Seizures 8,280 Total FY 2013 Est. MSRP 5,065,398$
Number of Seizures 639
FY 2013 Estimated Percent FY 2012 Estimated PercentSafety and Security MSRP of Total Safety and Security MSRP of Total
Pharmaceuticals/Personal Care 78,612,762$ 57% Pharmaceuticals/Personal Care 82,861,690$ 56.59%Consumer Electronics/Parts 21,560,471$ 16% Consumer Electronics/Parts 33,576,489$ 22.93%Critical Technology Components 17,328,205$ 13% Cigarettes 12,857,019$ 8.78%Batteries 8,020,268$ 6% Critical Technology Components 9,545,308$ 6.52%Ball Bearings 3,391,819$ 2% Automotive 3,925,944$ 2.68%Sporting Goods 2,873,353$ 2% Toys 1,259,514$ 0.86%Automotive 2,077,103$ 2% Food 753,266$ 0.51%Cigarettes 1,499,001$ 1% Sporting Goods 693,662$ Less than 1%chem 689,400$ Less than 1% Lighters 511,258$ Less than 1%Knives 469,020$ Less than 1% Knives 136,800$ Less than 1%All Others 625,549$ Less than 1% All Other Commodities 301,614$ Less than 1%
Total FY 2013 Est. MSRP 137,146,951$ Total FY 2012 Est. MSRP 146,422,565$ Number of Seizures 3,622 Number of Seizures 3,402
FY 2013 Number Percent FY 2012 Number PercentSafety and Security of Seizures of Total Safety and Security of Seizures of Total
Pharmaceuticals/Personal Care 2,183 60% Pharmaceuticals/Personal Care 2,343 68%Critical Technology Components 429 12% Consumer Electronics/Parts 447 13%Consumer Electronics/Parts 367 10% Critical Technology Components 256 7%Batteries 220 6% Sporting Goods 134 4%Sporting Goods 174 5% Cigarettes 122 4%Ball Bearings 111 3% Automotive 79 2%Automotive 84 2% Toys 12 Less than 1%Cigarettes 25 Less than 1% All Other Commodities 48 1%Baby Equipment 13 Less than 1%Food 9 Less than 1% Number of Seizures 3,441 *All Others 43 1%
Number of Seizures 3,658 *
*Seizures can contain mulSple commodiSes
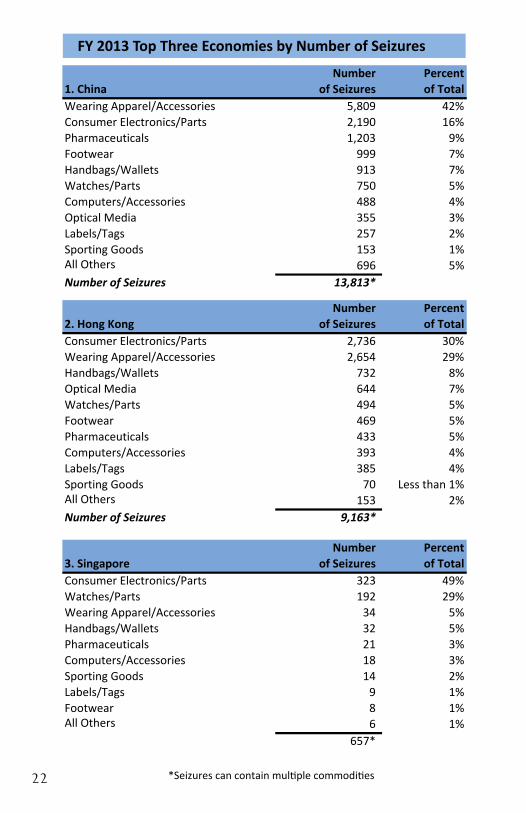
Number Percent1. China of Seizures of TotalWearing Apparel/Accessories 5,809 42%Consumer Electronics/Parts 2,190 16%Pharmaceuticals 1,203 9%Footwear 999 7%Handbags/Wallets 913 7%Watches/Parts 750 5%Computers/Accessories 488 4%Optical Media 355 3%Labels/Tags 257 2%Sporting Goods 153 1%All Others 696 5%Number of Seizures 13,813*
Number Percent2. Hong Kong of Seizures of TotalConsumer Electronics/Parts 2,736 30%Wearing Apparel/Accessories 2,654 29%Handbags/Wallets 732 8%Optical Media 644 7%Watches/Parts 494 5%Footwear 469 5%Pharmaceuticals 433 5%Computers/Accessories 393 4%Labels/Tags 385 4%Sporting Goods 70 Less than 1%All Others 153 2%Number of Seizures 9,163*
Number Percent3. Singapore of Seizures of TotalConsumer Electronics/Parts 323 49%Watches/Parts 192 29%Wearing Apparel/Accessories 34 5%Handbags/Wallets 32 5%Pharmaceuticals 21 3%Computers/Accessories 18 3%Sporting Goods 14 2%Labels/Tags 9 1%Footwear 8 1%All Others 6 1%
657*
22
FY 2013 Top Three Economies by Number of Seizures
FY 2013 Estimated Percent FY 2012 Estimated PercentSafety and Security MSRP of Total Safety and Security MSRP of Total
Pharmaceuticals/Personal Care 78,612,762$ 57% Pharmaceuticals/Personal Care 82,861,690$ 56.59%Consumer Electronics/Parts 21,560,471$ 16% Consumer Electronics/Parts 33,576,489$ 22.93%Critical Technology Components 17,328,205$ 13% Cigarettes 12,857,019$ 8.78%Batteries 8,020,268$ 6% Critical Technology Components 9,545,308$ 6.52%Ball Bearings 3,391,819$ 2% Automotive 3,925,944$ 2.68%Sporting Goods 2,873,353$ 2% Toys 1,259,514$ 0.86%Automotive 2,077,103$ 2% Food 753,266$ 0.51%Cigarettes 1,499,001$ 1% Sporting Goods 693,662$ Less than 1%chem 689,400$ Less than 1% Lighters 511,258$ Less than 1%Knives 469,020$ Less than 1% Knives 136,800$ Less than 1%All Others 625,549$ Less than 1% All Other Commodities 301,614$ Less than 1%
Total FY 2013 Est. MSRP 137,146,951$ Total FY 2012 Est. MSRP 146,422,565$ Number of Seizures 3,622 Number of Seizures 3,402
FY 2013 Number Percent FY 2012 Number PercentSafety and Security of Seizures of Total Safety and Security of Seizures of Total
Pharmaceuticals/Personal Care 2,183 60% Pharmaceuticals/Personal Care 2,343 68%Critical Technology Components 429 12% Consumer Electronics/Parts 447 13%Consumer Electronics/Parts 367 10% Critical Technology Components 256 7%Batteries 220 6% Sporting Goods 134 4%Sporting Goods 174 5% Cigarettes 122 4%Ball Bearings 111 3% Automotive 79 2%Automotive 84 2% Toys 12 Less than 1%Cigarettes 25 Less than 1% All Other Commodities 48 1%Baby Equipment 13 Less than 1%Food 9 Less than 1% Number of Seizures 3,441 *All Others 43 1%
Number of Seizures 3,658 *
*Seizures can contain mulSple commodiSes
25

www.cbp.gov/iprwww.iprcenter.gov
CBP Publication # 0204-0714