integrative analysis of genomic copy number and gene expression data in metastatic ... ·...
TRANSCRIPT

Integrative Analysis of Genomic Copy Number and Gene Expression Data in Metastatic Prostateand Gene Expression Data in Metastatic Prostate
Cancer.
Elise ChangAgilent TechnologiesAgilent [email protected]

AgendaAgenda
SNPs
Introduction
Features of Copy Number WorkflowSNPs…..
CNVs…..
SNPs…..
CNVs
Features of Copy Number Workflow
Case study- Integrative Analysis of Genomic copy number
CNPs……
CNVs…..
CNPs……
and Gene Expression Data in Metastatic Prostate Cancer
CNVRs…..CNVRs…..

Copy Number Variation- Understanding the Relevance to Human DiseasesRelevance to Human Diseases
• Copy number variation (CNV):– DNA segments in which copy-number varies g py
between two or more genomes– Ranges from 1 Kb to millions of DNA bases
in size
• CNVs have been associated with susceptibility to disease complex behavioral traits and otherto disease, complex behavioral traits, and other phenotypic variability
• Identifying significant CNVs is important in understanding the underlying mechanism of disease and disease susceptibility

Supported Array PlatformsAffymetrix:• 100K (50K Xba, 50K Hind)• 500K (250K Nsp, 250K Sty)• SNP 5.0• SNP 6.0
Illumina:• GenomeStudio outputs for all SNP/CNV arrays• GeneSpring GX plugin for GenomeStudio used to export
data in format GeneSpring GX will support • (plug-in located in: INSTALLDIR\app\Illumina\GX.Genotyping.Export.dll to
Genomestudio\modules \ BSGT \ ReportPlugins\)Genomestudio\modules \ BSGT \ ReportPlugins\)-Instructions for installation are in section 26.4.1 of the manual.

Supported ArraysAffymetrix Illumina
•Technology available on Agilent server
•Technology created on the fly.Agilent server.
•Experiment creation involves importing the CEL files,
•Experiment creation involves import from GenomeStudioimporting the CEL files,
summarization and normalization
import from GenomeStudio
•GX11 computes log ratio, CN and LOH
•Log ratios, CN values and LOH are imported from GenomeStudio
•GX11 uses the CN values to get ASCN, PSCN and to run GISTIC
•GX11 uses the CN values to get ASCN, PSCN and to run GISTICGISTIC GISTIC

Experimental Designsf f fIdentification of variation requires comparison to either a reference DNA
source, a reference dataset or a reference genome sequence.
This is important for Affymetrix experiment creationp y p
1. Analysis against a reference: The control is generated from a pool of individuals. All the test samples are then compared against a common, pooled control also known as “reference”pooled control, also known as reference .
– HapMap samples are packaged as Standard Reference– Custom Reference can be createdCustom Reference can be created
2. Paired Analysis: Control and the test DNA are from the same individual
– Pairing is defined during experiment grouping

Custom Reference Creation
Menu: Tools> Create CustomCreate Custom Reference
Typically need 30-40 reference samples for accurate genotype calls on non-reference
Once Custom Reference is created, it will be saved for future experiment creation

Reference Creation
References contain:•Averaged summarised intensities for probe sets from PLIER
•For Affymetrix 50/100K Set– Statistics from BRLMM
•For 250/500K Set and SNP5.0 Affymetrix arrays– Statistics from BirdSeed Algorithm– Clusters from BirdSeed Algorithm (and median and s.d. of clusters)
•For SNP6.0 Affymetrix arrays– Statistics from BirdSeed Algorithm– Clusters from BirdSeed Algorithm (and median and s.d. of clusters)g ( )– Clusters from CANARY (and median and s.d. of clusters)

Experimental Set-up for Paired Normal Design
• For paired-normal experimental designs, two parameters must be specified– “Group” indicates a set of paired
samplessamples – “Condition” indicates which
sample(s) to use as reference (Normal) for test sample(s) (Tumor)(Tumor)
• Parameters must be “Group” and “Condition” for GeneSpring GX to recognize it as a paired design
• Interpretation using “Group” and “Condition” must be used for Copy Number Computation

Copy Number Analysis Workflow in GeneSpring GX 11GX 11
QC / Batch Correction
Copy NumberAnalysis:(CN, LOH, ASCN, Log ratio)
GISTIC for Identification of Statistically Common CN variation
within a set of samples
Filter for Regions of Interest
Biological Contextualization of Genes in Regions of interest
* QC/Batch correction step is not available for Illumina workflow
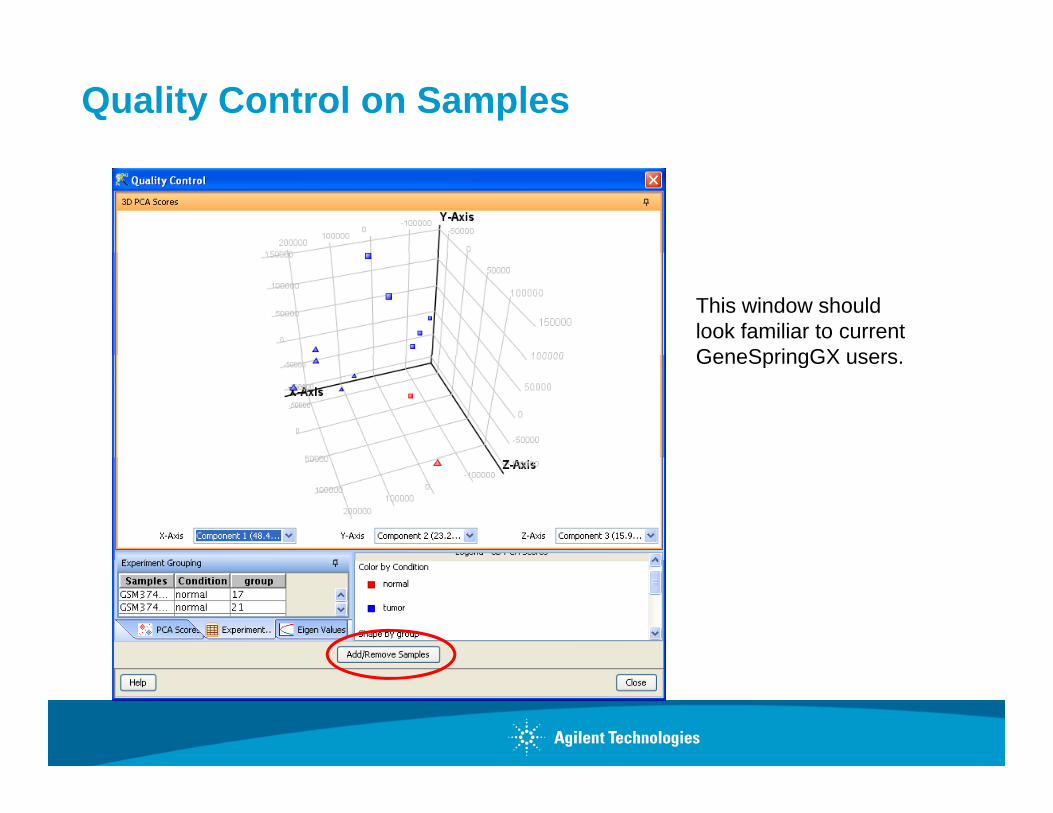
Quality Control on Samples
This window should look familiar to current GeneSpringGX usersGeneSpringGX users.

Quality Control Tools - PCA and Batch Effect
Quality Control
PCA--identifies potential sample outliers
Batch Effect -identifies and corrects for systematic
error when different samples are processed on different days or different conditions.
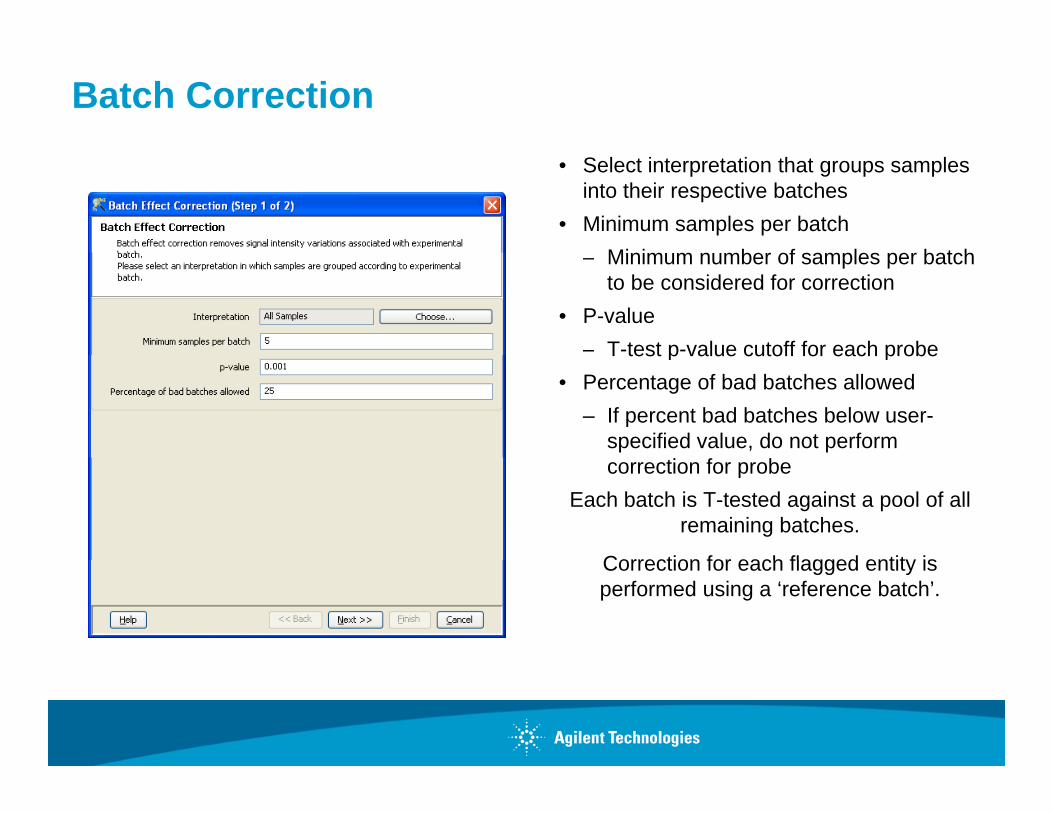
Batch Correction • Select interpretation that groups samples
into their respective batches• Minimum samples per batch
Minim m n mber of samples per batch– Minimum number of samples per batch to be considered for correction
• P-value– T-test p-value cutoff for each probeT test p value cutoff for each probe
• Percentage of bad batches allowed– If percent bad batches below user-
specified value, do not perform correction for probe
Each batch is T-tested against a pool of all remaining batches.
Correction for each flagged entity isCorrection for each flagged entity is performed using a ‘reference batch’.

Copy Number Computation
Copy NumberAnalysis:(CN, LOH, ASCN, Log ratio,
LOD score)

Copy Number Analysis for Affymetrix Data
Computation actually computing:(1) Log ratio values
• Against Reference design: Normalized intensity of sample/ Normalized intensity of reference
• Paired design: Normalized intensity of Case/ Normalized intensity of Control(2) Genomic Copy Number(2) Genomic Copy Number
• Circular Binary Segmentation to identify segments• Log ratio values to estimate genomic copy number
– Confidence value give as –log10 of p-valueConfidence value give as log10 of p value(3) Allele-specific copy number (asCN) information
• Fawkes algorithm used to assign allele-specific copy number using SNP probes(4) Parent-specific copy number (psCN) information( ) p py (p )(5) Loss of Heterozygosity (LOH)
• Hidden Markov Model (HMM) used to calculate LOH score

Log Ratio and Copy Number Computation
Copy Number computation (paired or against reference) is determined by the interpretation selected:y p
First Log2 ratios are calculated for every probe:• Against Reference design: Normalized intensity of sample/ Normalized intensity of referencey• Paired design: Normalized intensity of Case/ Normalized intensity of Control

Copy Number ComputationCircular Binary SegmentationCircular Binary Segmentation• Smooths outliers• Finds change points in each sample using a statistic to identify a segment break
Validation of change point using t test with p value cut off < 0 002• Validation of change point using t-test with p value cut off < 0.002• Outputs are segment break points and mean log ratio for segment
Segment Break Points

Copy Number Computation
Once segments are identified by CBS then copy numbers and confidence scores need to be assigned to themCopy Number:Copy Number:• HapMap dataset is used to generate a ‘median map’• Using the birdseed and CANARY outputs for each possible copy number (0,1,2,3,4) the median and s.d log ratios across all probes is calculated• Log ratios for segments from CBS are compared to the median map and copy numbers are assigned • Homozygous and Hemizygous deletions are given values of 0 and1• Amplifications are given CN values of 3 and 4• Amplifications are given CN values of 3 and 4.
Copy Number Confidence: Copy Numbers between 1.5 and 2.5 are assigned a p value of '1'F th b ‘T t t i t ’ f l ti i f d ith lti l t tiFor any other copy number a ‘T test against zero’ of log ratios is performed with multiples testing correctionNegative logarithm to the base 10 of the final p value reported as confidence.

Copy Number Computation
Copy Number Mean Log Ratio that is mapped
Median MapCopy Number Assigned
Mean Log Ratio that is mapped
Genome-Wide Human SNP Array 6.0
Genome-Wide Human SNP Array
5.0
Human Mapping 500K Array Set -
NSP
Human Mapping 500K Array Set -
STY
Mapping 100k array set
4.0 0.5531951 0.54314524 0.5104986 0.54314524 Same as 0 0 553 95 0 5 3 5 0 5 0 986 0 5 3 5 Sa e asGenome Wide Human SNP Array 6.0
3.5 0.43365917 0.4216105 0.39650044 0.39650044
3.0 0.31824413 0.30864272 0.26924038 0.28693026
2.5 0.16928099 0.16363965 0.13422728 0.15135522
2.0 0.0 0.0 0.0 0.0
1.5 -0.22511256 -0.2103804 -0.18339391 -0.18339391
1.0 -0.48062363 -0.44733366 -0.36318222 -0.36318222
0.5 -0.73515093 -0.68273795 -0.57555604 -0.57555604
0.0 -1.4098581 -1.2451344 -0.9485139 0.9485139

L ti th d t i CN l
Copy Number Analysis
Log ratios are smoothed to give CN values. CN segments are created using Circular Binary Segmentation (CBS) algorithm.
CN values
log ratios
F ti l ll di t CN l i d iFractional as well as discrete CN values are assigned, in the range of 0-4

1. Paired Analysis CN computation “Condition-Type” Interpretation
2. Each tumor is paired against the2. Each tumor is paired against the Normal of its group
3. All Normals are compared against the referenceg
All samples against reference comparison
Only one set of CN Analysis results can be storedbe stored.
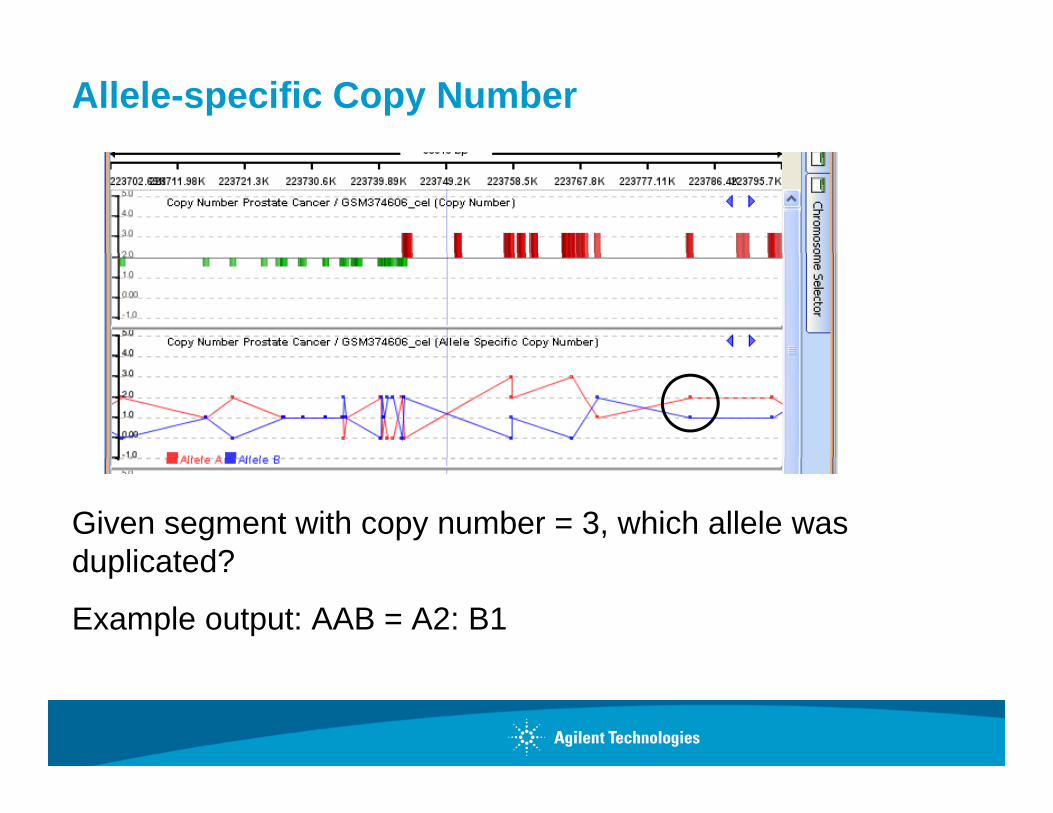
Allele-specific Copy Number
Given segment with copy number = 3, which allele was duplicated?duplicated?
Example output: AAB = A2: B1

Parent-specific Copy Number
Consider a section of a Chromosome with haplotypes:ChrCopy1: A1B2A3B4B5 B |(after duplication): A1B2A3B4B5 B | A1B2A3B4B5 B py 1 2 3 4 5 |( 1 2 3 4 5 | 1 2 3 4 5
ChrCopy2: A1A2B3A4B5
Suppose Copy1 gets duplicated 2 additional times (CN of region =4), the asCN become:A1:4 B1:0 and psCN = 4-0A2:1 B2:3 and psCN = 3-1A2:1 B2:3 and psCN 3 1A3:3 B3:1 and psCN = 3-1A4:1 B4:3 and psCN = 3-1A5:0 B5:4 and psCN = 4-0
PSCN is a measure of allelic imbalance

Copy Number Computation for Illumina Arrays
Copy Number, Log ratio, and LOH scores calculated in GenomeStudio and imported into GeneSpring GXp p g
The following are computed in GeneSpring GX:The following are computed in GeneSpring GX:
• ASCN information• PSCN information• PSCN information

Analysis and Filtering
Once you have identified regions of genomic alteration in individual sample how can you find meaningful events in groups of samples?
•Find Common Genomic Variant RegionsRegions
•Filter By Regions
•Identify Copy Neutral LOHde t y Copy eut a O
•Filter By PSCN
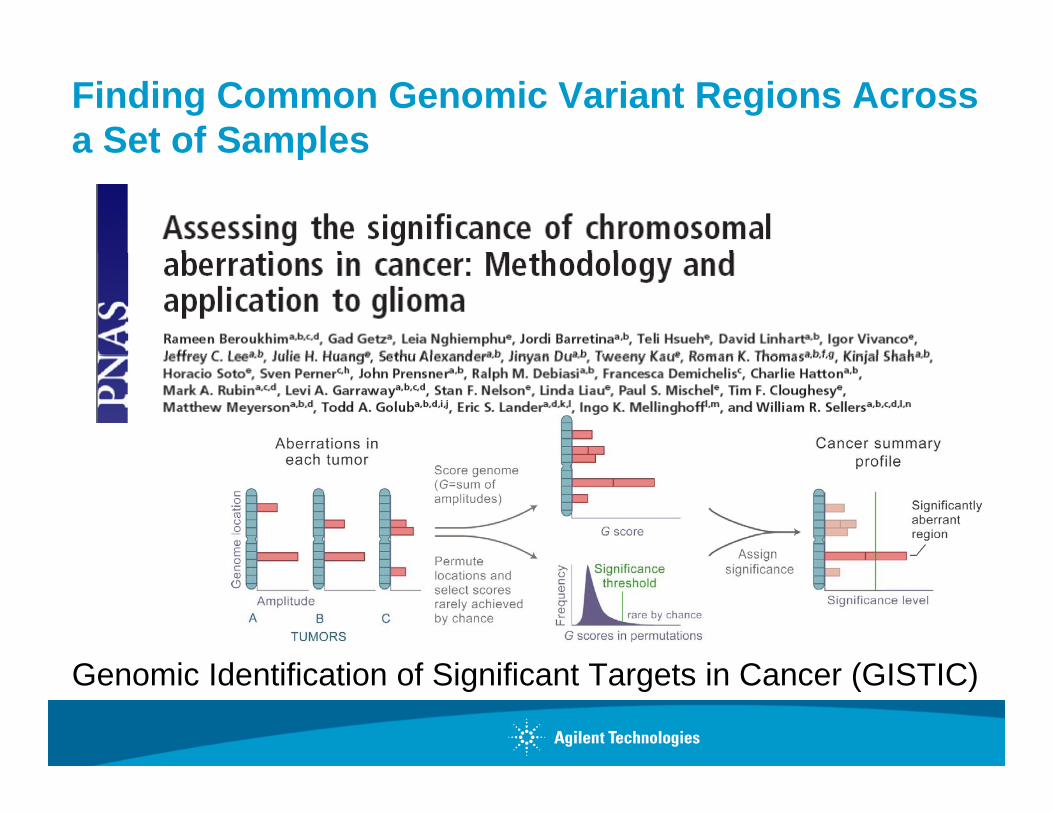
Finding Common Genomic Variant Regions Across a Set of Samplesa Set of Samples
G i Id tifi ti f Si ifi t T t i C (GISTIC)Genomic Identification of Significant Targets in Cancer (GISTIC)

Find Common Genomic Variant Regions
•Many tumour samples have large numbers of chromosomal abberations.
•GISTIC was developed to try and distinguish meaningful or ‘driver’ mutation events from random background somatic or ‘passenger’ eventspassenger events
•‘Driver’ mutations are functionally important events which confer advantageous biological properties to the tumourconfer advantageous biological properties to the tumour allowing it to initiate grow or persist and are more likely to drive cancer pathogenesis
•GISTIC can also be applied to non cancer datasets where you want to find common genomic variant regions

Common Genomic Variant Regions
Choose Fine or Amplified Regions Deleted RegionsCoarse Mode Amplified Regions Deleted Regions

Common Variation Results
Once GISTIC has identified aberrant regions it uses the biological genome to “find overlapping genes” for amplified and deleted segments
For each probeset within the region the upstream and downstream 1000For each probeset within the region, the upstream and downstream 1000 bases are scanned and the genes are identified
G l i thGenes overlapping the significant regions identified and stored in the Project Navigator
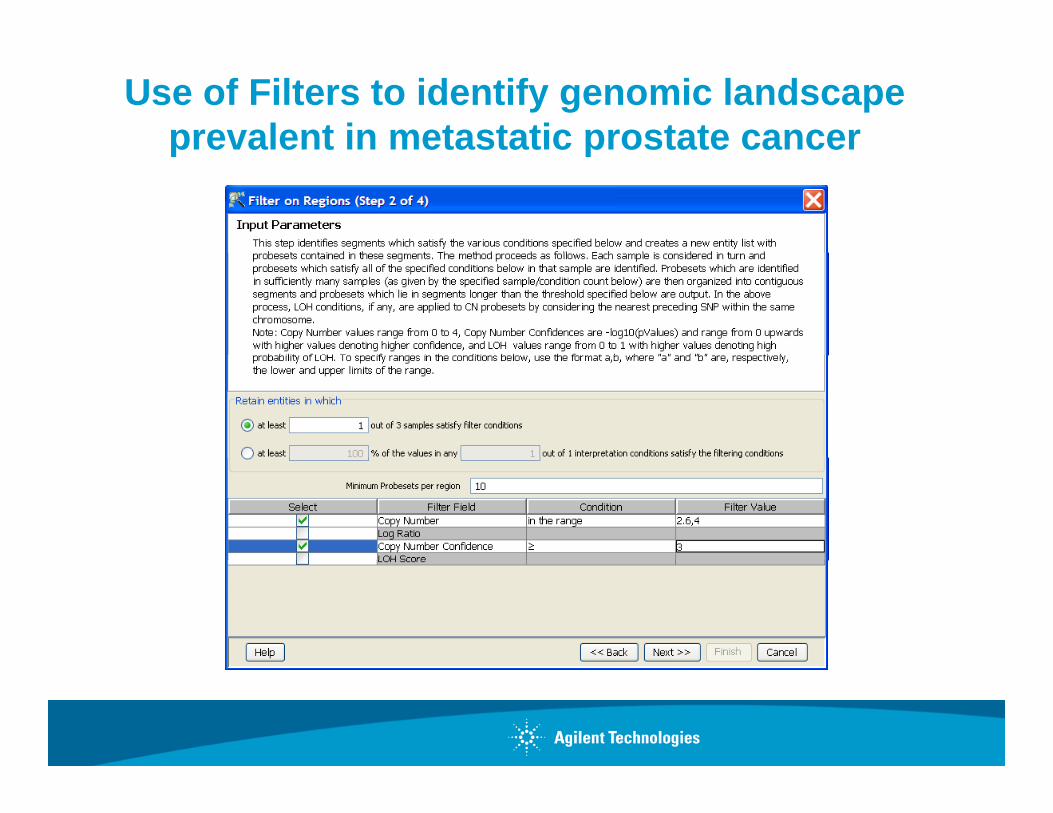
Use of Filters to identify genomic landscape prevalent in metastatic prostate cancerp p

Results Analysis
MarchConfidentialit31

Biological Contextualization of Copy Number Data
MarchConfidentialit32

Case Study

Integrative Analysis of Metastatic Prostate Cancer
•Prostate Cancer is the most common cancer in men.
•Primary tumors are thought to be composed of multiple genetically distinct cancer cell clones.g y
•Both the primary and the metastatic prostate cancers are p y pheterogenous in nature, posing therapeutic challenges.

Datasets Used
Expression:
GSE6919GSE6919
24 metastatic samples from 4 patients and 18 normal samples
Genomic Copy Number:py
GSE14996
58 metastatic locations from 14 patients and 16 subject p jpaired non-cancerous samples
Liu et al, Nat Med. 2009. May;15(5):559-65

Copy Number Analysis in Prostate Cancer SamplesSamples
MarchConfidentialit36

Expression Analysis in Prostate Cancer Samples
MarchConfidentialit37

PCA- Genotyping Data
Shape by Condition:
Normal
Tumor
Color by PatientColor by PatientGroup

PCA- Expression Data
Normal
Metastatic
QC using PCA shows separation of the Normal and the Metastatic samples of GSE6919Metastatic samples of GSE6919

Histogram view of data tracks in Genome Browser showing deletions as green blocks and
lifi ti d bl kamplifications as red blocks
Published data
Chr 6 Deletion-Chr. 6 DeletionPateint #17
V lid t d i GX11Chromosome 6
Validated in GX11

Joint Analysis of Gene Expression and Genomic Copy Number Data in Metastatic Prostate CancerCopy Number Data in Metastatic Prostate Cancer
Copy Number
Gene Expressionp
Prostate Cancer Studies – Controlled for regions
MarchConfidentialit41
Prostate Cancer Studies Controlled for regions and metastatic tissues

Deletions present in chr.6 of patient 17:An Integrative AnalysisAn Integrative Analysis
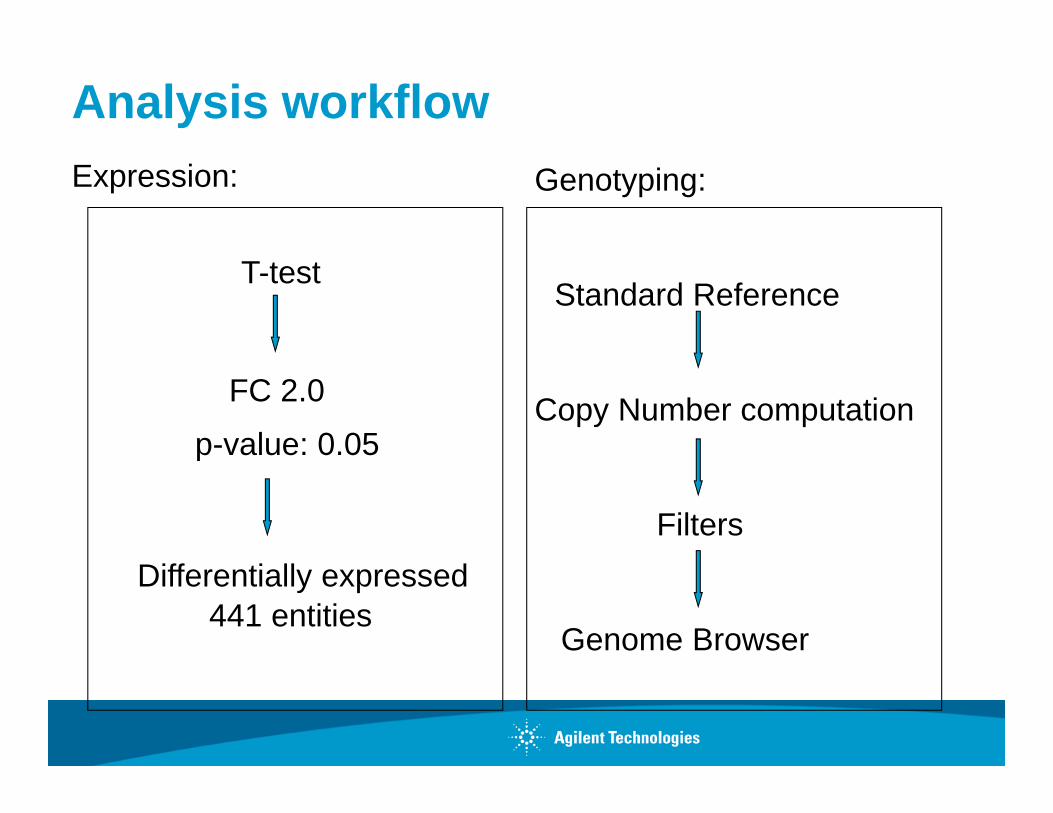
Analysis workflowExpression: Genotyping:
Standard Reference T-test
FC 2.0
p-value: 0.05Copy Number computation
p
Filters
Genome Browser
Differentially expressed441 entities

Deletion of PLAGL1
2.15 Fold Down-regulation of PLAGL1 in
Metastasis
Dat
a
Genomic Dataxpre
ssio
n E
x

PLAGL1
•Candidate Tumor suppressor gene, with anti-proliferative activitiesactivities
•Zinc finger protein with transactivation and DNA binding activity
•Presence of splice variants which allow differential regulation of apoptosis induction and cell cycle arrest
•Frequently deleted in many solid tumors-breast, ovarian and renal cell carcinomas
•Also known as LOT or “Lost On Transformation”•Also known as LOT or Lost On Transformation

PLAG1-network analysis

First order expansion of PLAG1 network and overlay with FC dataoverlay with FC data

TCF21
Genomic Data
Expression Data
No genomic aberration of TCF21
TCF21C
TCF21
CN=2
Down regulation ofDown-regulation of expression levels of
TCF21

TCF21
•First Order Expansion of the PLAGL1 network identified TCF21, a tsgene to be down regulated in the expression analysisgene, to be down regulated in the expression analysis.
•The CN of TCF21 remains at 2, unlike that of PLAGL1.
TCF21 i k t b f tl il d i ti ll i h d d•TCF21 is known to be frequently silenced epigenetically in head and neck cancer. Consistent with this, TCF21 did not show any deletion in the samples examined, raising the possibility that TFC21 could be epigenetically regulated in prostate cancer.p g y g p

Conclusions1. Using GX11, we could validate the presence of ERG-g , pTMPRSS2 in several of metastatic prostate cancer samples
2. Significant Aberration found in PTEN, FGF18, TRIB3 by GISTIC indicates that these could be driver mutations ofGISTIC indicates that these could be driver mutations of prostate cancer.
3. Additional candidates were identified by combined use of3. Additional candidates were identified by combined use of filters to identify amplified regions and regions of allelic imbalance.
4 I t ti l i i i d t i d t4. Integrative analysis using expression and genotyping data has identified PLAGL1, a candidate ts gene, and TCF21, a tsgene, to be having a possible role in prostate cancer.
5. PLAGL1 deletion, though present in a small percentage of population, is an early event, occurring at a pre-metastatic stagestage