integration over song classification replicates: song ... · we utilize, here, an automatic method...
TRANSCRIPT

Integration over song classification replicates: Song variantanalysis in the hihi
Louis Ranjarda)
Bioinformatics Institute, The University of Auckland, Private Bag 92019, Auckland Mail Centre,Auckland 1142, New Zealand
Sarah J. WithersSchool of Biological Sciences, The University of Auckland, Private Bag 92019, Auckland Mail Centre,Auckland 1142, New Zealand
Dianne H. BruntonThe Institute of Natural and Mathematical Sciences, Massey University, Albany Campus, Private Bag 102 904,North Shore Mail Centre, Auckland 0745, New Zealand
Howard A. Ross and Stuart ParsonsSchool of Biological Sciences, The University of Auckland, Private Bag 92019, Auckland Mail Centre,Auckland 1142, New Zealand
(Received 12 May 2014; revised 30 March 2015; accepted 9 April 2015)
Human expert analyses are commonly used in bioacoustic studies and can potentially limit the
reproducibility of these results. In this paper, a machine learning method is presented to statistically
classify avian vocalizations. Automated approaches were applied to isolate bird songs from long
field recordings, assess song similarities, and classify songs into distinct variants. Because no
positive controls were available to assess the true classification of variants, multiple replicates of
automatic classification of song variants were analyzed to investigate clustering uncertainty. The
automatic classifications were more similar to the expert classifications than expected by chance.
Application of these methods demonstrated the presence of discrete song variants in an island
population of the New Zealand hihi (Notiomystis cincta). The geographic patterns of song variation
were then revealed by integrating over classification replicates. Because this automated approach
considers variation in song variant classification, it reduces potential human bias and facilitates the
reproducibility of the results. VC 2015 Acoustical Society of America.
[http://dx.doi.org/10.1121/1.4919329]
[JFL] Pages: 2542–2551
I. INTRODUCTION
Many bioacoustic studies rely on accurate classifications
of animal vocalizations recorded in the field. For example,
similarities between avian sound signals are estimated and
patterns of variation can be attributed to shared genetic
ancestry (de Kort and ten Cate, 2001), shared learning tem-
plate (Bond and Diamond, 2005), or shared environmental
pressures on sound production (Slabbekoorn and den Boer-
Visser, 2006). Bioacoustic analyses, once put into context,
can, for example, be used to monitor species distribution
(Dawson and Efford, 2009), study population connectivity
(Irwin et al., 2001), or show evidence for song learning
(Podos and Warren, 2007). Therefore, it is critical to reliably
measure sound similarities especially when a large number
of recordings are being analyzed. Moreover, one needs to
minimize any bias that could be introduced by the specific
sensory attributes of human experts, which could preclude
reproducibility of the analysis (Milinski, 1997; Giret et al.,2011). For example, inconsistency across investigators has
been reported in the classification of humpback whale songs
(Cholewiak et al., 2013).
A common approach to limit human biases in bioacous-
tic signal classification is to use automatic clustering meth-
ods on selected acoustic parameters. For example, artificial
neural networks (ANNs) have been shown to statistically
classify bat calls at the species level as accurately as human
experts (Jennings et al., 2008). Linear discriminant analysis
(LDA) has also been used to identify shared call variants in
captive red crossbills (Sewall, 2009), but expert knowledge
had to be incorporated to finalize the classification. While
LDA can help identify the acoustic parameters that best dis-
criminate between individuals (Wanker and Fischer, 2013),
the relevance of these parameters cannot be evaluated
a priori when no information is available to estimate classifi-
cation accuracy. When classifying reoccurring motifs consti-
tuting the vocalization of a single individual, e.g., bird
song variants, the “true” classification of these variants is
unknown. In that case, no controls are available to select the
most relevant features of the songs to be used to define
variants. In behavioral studies, one needs to focus on var-
iants to which the species under study is sensitive. Variants
that can be found by comparing parameters not perceived by
that species may lead to false conclusions. Although the
different variants defined according to these parameters
could potentially be perceived differently by the human ear,a)Electronic mail: [email protected]
2542 J. Acoust. Soc. Am. 137 (5), May 2015 0001-4966/2015/137(5)/2542/10/$30.00 VC 2015 Acoustical Society of America
Redistribution subject to ASA license or copyright; see http://acousticalsociety.org/content/terms. Download to IP: 130.56.97.49 On: Tue, 10 May 2016 08:12:26
they would, for instance, have no effect on the animal song
acquisition through learning. Therefore, particular care needs
to be taken in categorizing song elements in behavioral
research. Ideally, laboratory tests are performed to analyze
how the bird’s sensory system responds to song signals
(Margoliash, 2002), but this is often not feasible, in particu-
lar, for endangered species. Without any psychoacoustic
study available, it remains difficult to select the parameters
that are most important for the acoustic sensory system of a
given species.
We utilize, here, an automatic method to measure
acoustic similarities and classify bird vocalizations in an
effort to limit prior selection of sound features, avoid human
bias, and offer a way to achieve reproducible bioacoustic
analysis. Combinations of speech recognition sound parame-
ters and ANNs have been used to perform individual recog-
nition in primate calls (Mielke and Zuberb€uhler, 2013) and
identify recurring sound pattern in humpback whale songs
(Green et al., 2011) with high accuracy. In particular, intra-
specific song variation in the white-crowned sparrow
(Ranjard and Ross, 2008) and antbirds (Vallejo et al., 2007;
Kirschel et al., 2009) have previously been described using
this type of automatic clustering approach. Here, an updated
version of the evolving tree neural network song classifier
(Ranjard and Ross, 2008) is described with a modified neigh-
borhood size function definition. We use a representation of
the full spectrogram of the songs rather than selected param-
eters to automatically isolate and classify song variants.
Song signals are encoded as mel frequency cepstrum (Davis
and Mermelstein, 1980) and perceptual linear predictive cod-
ing coefficients (Hermansky, 1990). Such representations,
even though originally designed to study the human voice,
have now successfully been applied to multiple studies of
animal vocalizations (Clemins and Johnson, 2006; Ranjard
and Ross, 2008; Tao et al., 2008), including field-based
research (Mielke and Zuberb€uhler, 2013; Potamitis et al.,2014). Moreover, song acoustic distances can be quantita-
tively measured by aligning pairs of encoded songs. The
distance between two songs, encoded as time sequences of
coefficients, is derived from a dynamic time warping algo-
rithm that searches for a nonlinear optimal match between
the sequences. From the resulting alignment, the edit
distance is defined as the number of operations required to
transform one sequence into the other (Ranjard et al., 2010;
Krull et al., 2012). This acoustic distance measure is incor-
porated in a machine learning classifier to automatically
cluster the songs into variants. The classifier is structured as
an evolving tree self-organizing map (SOM; Kohonen,
1990) ANN (Ranjard and Ross, 2008). The two main advan-
tages of this approach are that (i) the nodes of the classifier
are structured as a binary tree, which result in lower time
complexity for computation, and (ii) unlike the classic SOM,
the size of the network is not constant and, thus, the number
of clusters is not defined a priori, but results from the
specific properties of the set of songs being classified.
We use a set of automatic computational approaches to
analyze songs of a population of the New Zealand hihi
(Notiomystis cincta). First, male songs are isolated from
audio recordings using hidden Markov models (HMMs).
Second, we test for the presence of song variants in the hihi
by studying patterns of song variation. Third, we use an
implementation of the evolving tree neural network to cata-
log the song variants. Male songs are then classified into the
closest variants, which allows us to characterize the song
repertoire of each individual. Finally, we examine geo-
graphic variation in the song repertoires by comparing dis-
tances separating male territories to a distance characterizing
repertoire overlaps. The distribution of the correlation
between these two distances is estimated by integrating over
multiple classification replicates.
II. MATERIALS AND METHODS
A. Study species and song recordings
The hihi is an endemic New Zealand passerine. Few
studies report information about hihi vocal behavior with
only one carried out on the reintroduced Tiritiri Matangi
Island population (Withers, 2005). This predator-free island
is located off the coast of the North Island of New Zealand
(36.60�S 174.89�E) and is composed of regenerating native
forest. While both males and females produce calls associ-
ated with different behaviors, only males sing (Higgins
et al., 2001). The male song consists of a short, loud, high-
pitched whistle involving two to three beats (Higgins et al.,2001; Withers, 2005). During a song bout, a single male pro-
duces several variations of songs (Higgins et al., 2001), or
song variants as defined by their fine scale structural varia-
tion (Withers, 2005), that are drawn from its song repertoire.
Songs are thought to be mainly territorial in function, being
produced within the territory boundaries, and increasing in
rate at periods of high competition for mating opportunities
(Castro et al., 1996; Higgins et al., 2001; Withers, 2005).
Songs from 22 individual males were recorded on
Tiritiri Matangi Island in the summers of 2004 and 2005
(Withers, 2005). Recordings were made using a digital audio
tape recorder at 44.1 kHz with 16-bit precision. All birds
were uniquely color banded and each male territory was
documented. Territories were centered on artificial nest
boxes and their locations were estimated using global posi-
tioning system (GPS) fixes of the nest boxes.
B. Song extraction
Model-based detectors have been reported to perform
better than energy-based detectors (Skowronski and Harris,
2006). In the present study, songs were extracted from field
recordings using a HMM recognizer (Young et al., 2006),
which allowed us to isolate vocalizations from background
noise (Brandes, 2008; Trifa et al., 2008). Recordings were
encoded using 20 mel-cepstrum coefficients (MFCCs) plus
the C0th cepstral parameter as the energy feature and the
first order temporal derivatives. A window of 20 ms was
used and no cepstral mean normalization was performed. All
transitions were allowed between the six states of each
HMM and the states were modeled as a mixture of four
Gaussian density functions. Five models were manually
defined, aiming to represent background noise and other bird
J. Acoust. Soc. Am., Vol. 137, No. 5, May 2015 Ranjard et al.: Integration over song classifications 2543
Redistribution subject to ASA license or copyright; see http://acousticalsociety.org/content/terms. Download to IP: 130.56.97.49 On: Tue, 10 May 2016 08:12:26

species’ calls, human voice, hihi songs, silence, and record-
ing device generated signals.
Recognition efficiency was assessed using a 24 min tape
recording. For that recognition test, the tape was first anno-
tated by a human expert who identified seven hihi songs.
The automatic recognizer extracted a total of nine songs,
including the seven hihi songs identified manually, a saddle-
back song syllable (Philesturnus carunculatus), as well as an
unidentified low amplitude bird vocalization. These two
false positive signals have similar frequency distribution and
duration as a typical hihi song.
After running the automatic recognizer on the full set of
recordings (�27.7 h), each extracted song was visually
checked using a custom graphical user interface in MATLAB
(MathWorks, Natick, MA) to eliminate poor quality and
noisy hihi songs, as well as other types of hihi calls. Both
male and female hihi can produce a great variety of calls
(Higgins et al., 2001). In particular, contact calls are frequent
vocalizations with similar frequency distribution, although
slightly less modulated and shorter than male songs. In total,
590 extracted vocalizations were discarded. The extraction
approach allowed us to construct a library containing a total
of 1879 high quality adult male songs.
C. Preliminary analysis of song variation
1. Song encoding for classification
For classification, songs were represented as sequences
of 12 MFCCs and 12 perceptual linear prediction coefficient
(PLP) vectors. The C0th cepstral parameter was used as the
energy feature. Cepstral mean normalization was performed
on both sets of coefficients by estimating the mean across
each song file. The first of the 26 filterbank channels was set
at 1 kHz and the last one terminated at 20 kHz. This allowed
us to filter out low-frequency content of the signal, which is
generally not relevant for hihi vocalization analysis; hihi
songs mostly contain energy between 2 kHz and 13 kHz
(Withers, 2005). Under a sampling frequency of 44.1 kHz, a
Hamming window of 128 samples, i.e., a frequency resolu-
tion of �345 Hz, with 50% overlap was used for computing
the spectra and the signal had first order pre-emphasis
applied using a coefficient of 0.97. Two frames prior to and
two frames following the current frame were used to esti-
mate the first temporal derivative of each coefficient. Energy
normalization was implemented by subtracting the maxi-
mum value of the energy and adding 1.0. The cepstral coeffi-
cients were re-scaled by liftering the cepstra using a
coefficient of 22 so that they had similar magnitudes
(Rabiner, 1993). As a result, each song was encoded as a
time sequence of 50-parameter vector frames.
2. Song pairwise distances
As a first exploratory analysis, the presence of song var-
iants was investigated by measuring bioacoustic similarities
across a subset of extracted song recordings. This prelimi-
nary analysis was performed to investigate the general pat-
terns of hihi song variation. It allowed us to test whether
songs group into similar sets, i.e., song variants, which
would justify the use of a cluster analysis approach. A pair-
wise distance measure was calculated and represented as a
dendrogram to investigate grouping structure.
In the case of discrete variants, songs are expected to
group based on their acoustic characteristics. The acoustic
distances measured between songs belonging to the same
variant are expected to be smaller than distances to other
songs. On the other hand, in the absence of song variants, no
particular grouping of songs is expected and the acoustic dis-
tance is expected to vary continuously. A pairwise bioacous-
tic distance was calculated using dynamic time warping
(Ranjard et al., 2010). The resulting distance matrix was
represented on a dendrogram using a neighbor-joining
algorithm for a subset of 469 songs.
D. Song classification using ANN
The full dataset of songs was analyzed using a self-
organizing ANN classifier (Ranjard and Ross, 2008). This
algorithm aims at automatically identifying clusters of simi-
lar songs, removing the need for prior incorporation of infor-
mation about the number of clusters, i.e., the number of song
variants. The neural network is a type of growing SOM
(Kohonen, 1990), derived from the evolving tree SOM
(Pakkanen, 2004), which takes advantage of dynamic time
warping (Ranjard et al., 2010) to compute the weight matri-
ces (Krull et al., 2012) and calculate distances between the
weight matrices and the songs to be classified. The classifica-
tion is performed as a two-step process. First, the neural
network is constructed and, second, the songs are grouped
according to the resulting classification tree.
1. Network training
We implemented an evolving neural network classifier
as specified in Ranjard and Ross (2008). For completeness,
the full network specifications are included below. A set of
M songs, S, is classified using a network defined as a set of
connected weight matrices, Wt, at epoch, t. The neighbor-
hood function is
h Wt xð Þ; S yð Þ� �
¼ a tð Þexp�d Wt xð Þ; S yð Þ� �2
2r tð Þ2
!; (1)
where dðWtðxÞ; SðyÞÞ is the dynamic time warping distance
between the neuron weight matrix, WtðxÞ, and the sample,
S(y). The learning rate aðtÞ is
a tð Þ ¼ max a 0ð Þexp�t2
0:75Tð Þ2
!amin;
;
8><>: (2)
where T is the total number of epochs for learning. In com-
parison to Ranjard and Ross (2008), we slightly modified the
neighborhood size function, rðtÞ, which is now modeled as a
Gaussian distribution, defined as
r tð Þ ¼ rmax exp�t� T þ 1
22r2
sd
0@
1A; (3)
2544 J. Acoust. Soc. Am., Vol. 137, No. 5, May 2015 Ranjard et al.: Integration over song classifications
Redistribution subject to ASA license or copyright; see http://acousticalsociety.org/content/terms. Download to IP: 130.56.97.49 On: Tue, 10 May 2016 08:12:26

where rmax is the maximum value for the neighborhood size
function and rsd is the standard deviation. Consequently, the
neighborhood size function has a small value at the begin-
ning of the learning process when the network is small and
growing, larger values when the network self-organizes, and
then small values toward the end, allowing the fine-tuning of
the neuron weight matrices (Fig. 1). The number of children,
or leaf number, is
n tþ 1ð Þ ¼ max n tð Þ � n tð ÞT
nmin;
((4)
and therefore be set to decrease through the learning process.
The counter of each neuron is countðcðtþ 1ÞÞ ¼ c countðcðtÞÞ.The weight decay, c, restricts the size of the tree; see Pakkanen
(2004) for details.
2. Classification into song variants
Once the network has been constructed and trained on a
given dataset, classification of the songs is performed using
the network weight matrices as cluster centroids, each repre-
senting different song variants. For each song, S(y), the best
matching neuron is found across the tips of the network at a
given depth, so that it minimizes dðSðyÞ;WpÞ, where Wp is
the set of weight matrices in the tree at depth, p. Figure 2
illustrates the learning and classification processes of the net-
work. A MATLAB (MathWorks, Natick, MA) library for this
implementation, dtwave cluster, is available.1
E. Classification evaluation
The accuracy and precision of the automatic neural
network classification were assessed using the repertoire of a
single individual. The song repertoire (20 song recordings;
Fig. 3) was classified into song variants by experts (LR,
SJW, and HR) using spectrogram shapes and audio record-
ings. These three expert classifications were compared to
repeated automatic classifications obtained with the ANN
and to multiple random classifications of these 20 songs.
Neural network classification is not deterministic (Ranjard
and Ross, 2008), therefore, 100 ANN classification replicates
were computed using the parameters listed in Table I to
investigate consistency. A total of 100 random classifications
were constructed by randomly assigning songs to n clusters,
with n ¼ Nð9; 4Þ. The Rand index, RI (Rand, 1971), and
Jaccard index, JI (Jaccard, 1908), were calculated to assess
agreement both within and between the experts, neural net-
work, and random classifications. When comparing classifi-
cation C1 to classification C2, these indexes are defined as
JI ¼ a=ðaþ bþ cÞ and RI ¼ ðaþ dÞ=ðaþ bþ cþ dÞ, with
a: number of pairs of songs classified together in both C1
and C2, b: number of pairs of songs classified together in C1,
but not in C2, c: number of pairs of songs classified together
in C2, but not in C1, and d: number of pairs of songs that are
not classified together in either C1 nor C2.
The JI does not take into account the number of pairs, d,
that are separated in both classifications. Both indexes are
defined from 0 to 1, with high value indicating high similar-
ity between two classifications.
F. Correlation between geographic distance and songrepertoires
The full dataset of 1879 songs was classified into song
variants using the ANN classifier, constructed using the pa-
rameter values listed in Table II. A total of 100 classification
replicates were completed to take into account the variation
in the clustering signal of the song acoustic parameters. For
each replicate, the classification tree rules are potentially
defined according to different features of the extracted
acoustic parameters.
Different levels of classification, i.e., different numbers
of clusters, can be defined by selecting different depths in
the evolving tree. For each level, the number of clusters and
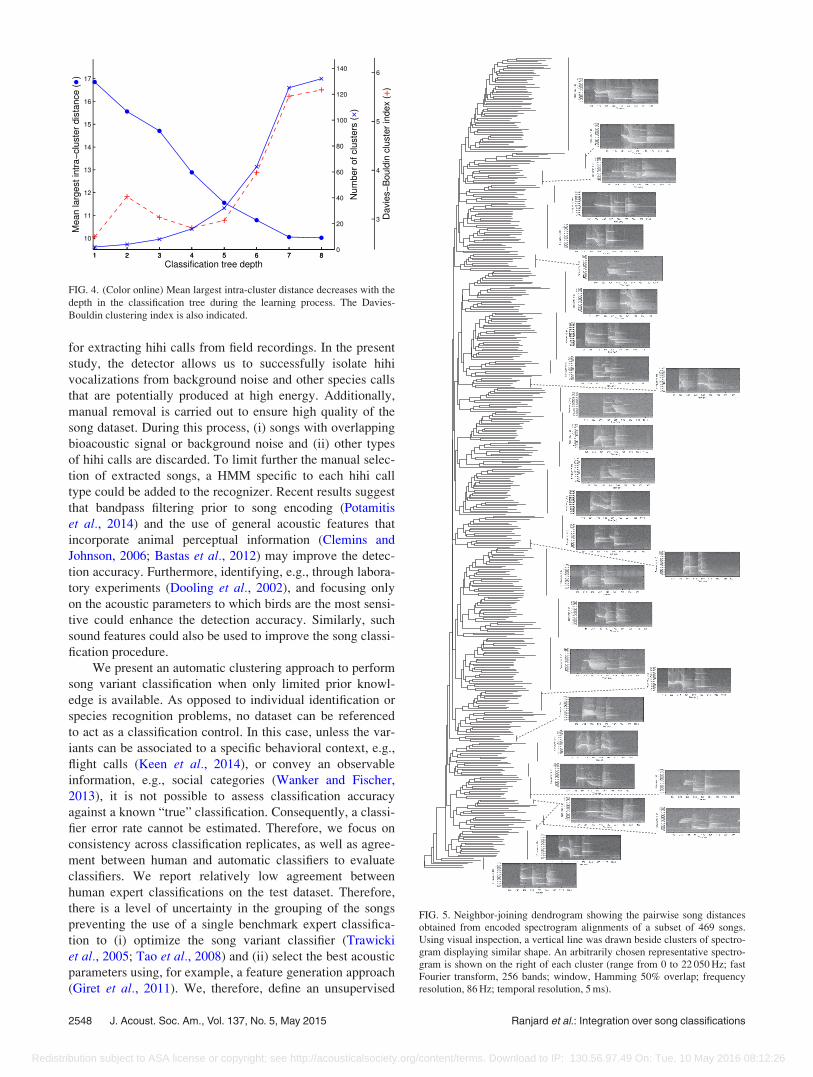
the intra-cluster distance were calculated (see Fig. 4 for an
example on a single classification). With large depth values,
high numbers of clusters are defined and the mean intra-
cluster distance is low, showing high similarity between
songs grouped in the same cluster. However, the resulting
classification may be poor when distinct cluster centroids are
too similar, as shown by high values for the Davies–Bouldin
clustering index (Davies, 1979). A depth of 4 in all classifi-
cations was selected to minimize this index, as well as the
number of clusters and the mean largest intra-cluster distan-
ces. Finally, the repertoire of each bird was defined as the set
of song variants that it sang.
To determine whether micro-geographic patterns of
song sharing were present on Tiritiri Matangi, we evaluated
the proportion of shared song variants between territories by
calculating the Jaccard distance between every pair of terri-
tories. This generated a territory song content pairwise dis-
tance matrix (30� 30) that could be compared to the
geographic distance between the territories. The Pearson
product-moment correlation coefficient was calculated for
each classification replicate, allowing us to obtain an esti-
mated distribution for the correlation between geographic
and repertoire distances.
FIG. 1. Learning weight in the neural network during a 50 epochs learning
process with a neighborhood strength function modeled as a Gaussian for
different distances from the best matching unit in the network.
J. Acoust. Soc. Am., Vol. 137, No. 5, May 2015 Ranjard et al.: Integration over song classifications 2545
Redistribution subject to ASA license or copyright; see http://acousticalsociety.org/content/terms. Download to IP: 130.56.97.49 On: Tue, 10 May 2016 08:12:26
III. RESULTS
The neighbor-joining tree representing the pairwise dis-
tances measured between the subset of 469 songs shows
songs grouping into independent clusters (Fig. 5). The bioa-
coustic dynamic time warping distance between these songs
is, therefore, not continuously distributed and indicates that
smaller distances were obtained between songs belonging to
the same cluster. Several clusters of songs were identified in
the tree for which the spectrogram shapes appear visually
consistent (Fig. 5). However, the relationships between these
clusters are not precisely defined, with each being placed at
approximately the same distance from all the other clusters.
The highest clustering similarities were reported
between replicates of the neural network classifications
(JI ¼ 0:382; RI ¼ 0:927), which demonstrates high consis-
tency within these automatic classifications (Fig. 6). The
lowest agreement was found within random classifications
and between random and other classifications. Agreement
between expert and neural network classifications was rela-
tively high (JI ¼ 0:314; RI ¼ 0:888) and higher on average
than within expert classifications (JI ¼ 0:285; RI ¼ 0:860).
Although fewer expert classifications was performed, the
95% interval range of the index values, ½0:816; 0:905� for RI,
shows that low agreement can be observed between experts
at a level that is not found in the 100 neural networks repli-
cated classifications, 95% interval is ½0:884; 0:968�.However, the interval of value for each index is large, e.g.,
½0:155; 0:578� for JI, but consistently higher than values
obtained against the random classifications (½0:000; 0:155�).The automatic neural network classifications of the total
dataset resulted in 16 clusters, which were used to define 16
different song variants. On average, each male has a reper-
toire containing 9.1 song variants. The distribution of the
correlation coefficient between the geographic distance and
the Jaccard distance shows a low level of positive correlation
(Fig. 7) with the mean equal to 0.11.
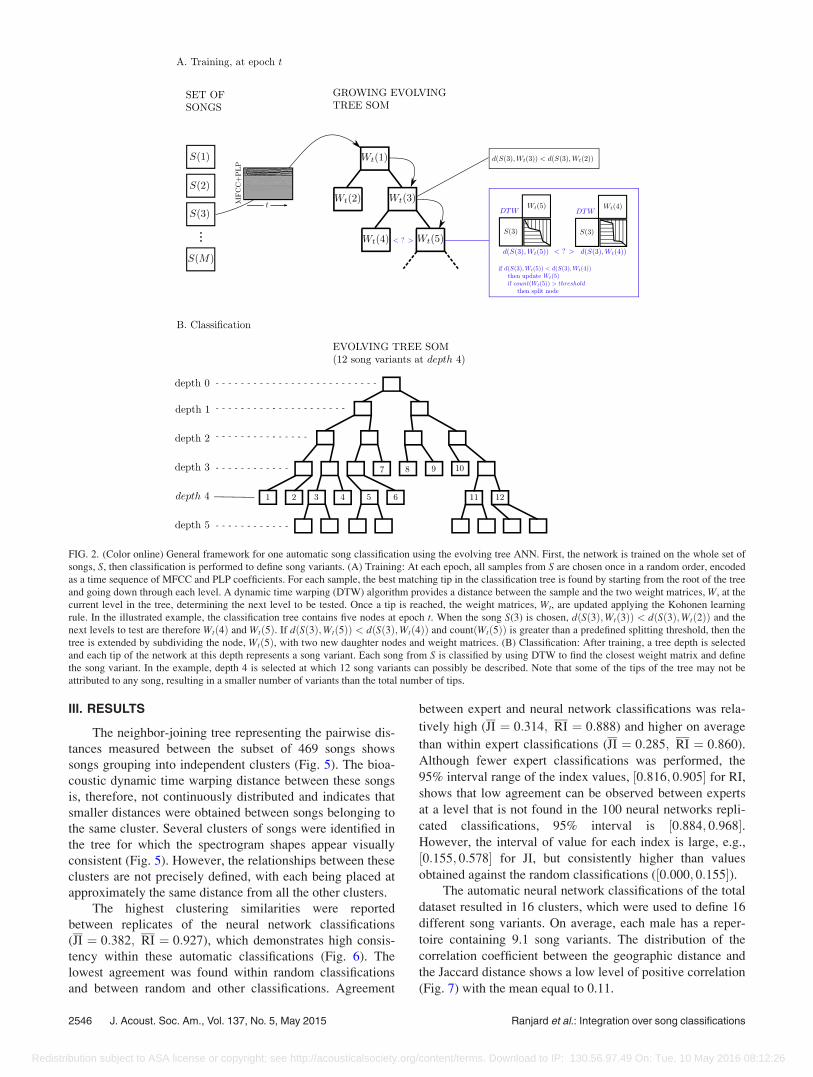
FIG. 2. (Color online) General framework for one automatic song classification using the evolving tree ANN. First, the network is trained on the whole set of
songs, S, then classification is performed to define song variants. (A) Training: At each epoch, all samples from S are chosen once in a random order, encoded
as a time sequence of MFCC and PLP coefficients. For each sample, the best matching tip in the classification tree is found by starting from the root of the tree
and going down through each level. A dynamic time warping (DTW) algorithm provides a distance between the sample and the two weight matrices, W, at the
current level in the tree, determining the next level to be tested. Once a tip is reached, the weight matrices, Wt, are updated applying the Kohonen learning
rule. In the illustrated example, the classification tree contains five nodes at epoch t. When the song S(3) is chosen, dðSð3Þ;Wtð3ÞÞ < dðSð3Þ;Wtð2ÞÞ and the
next levels to test are therefore Wtð4Þ and Wtð5Þ. If dðSð3Þ;Wtð5ÞÞ < dðSð3Þ;Wtð4ÞÞ and countðWtð5ÞÞ is greater than a predefined splitting threshold, then the
tree is extended by subdividing the node, Wtð5Þ, with two new daughter nodes and weight matrices. (B) Classification: After training, a tree depth is selected
and each tip of the network at this depth represents a song variant. Each song from S is classified by using DTW to find the closest weight matrix and define
the song variant. In the example, depth 4 is selected at which 12 song variants can possibly be described. Note that some of the tips of the tree may not be
attributed to any song, resulting in a smaller number of variants than the total number of tips.
2546 J. Acoust. Soc. Am., Vol. 137, No. 5, May 2015 Ranjard et al.: Integration over song classifications
Redistribution subject to ASA license or copyright; see http://acousticalsociety.org/content/terms. Download to IP: 130.56.97.49 On: Tue, 10 May 2016 08:12:26

IV. DISCUSSION
Only a limited number of bioacoustic studies (Stoddard
et al., 1988; Podos et al., 1992; Searcy et al., 1995; Deecke
and Janik, 2006; Gamba and Giacoma, 2007; Green et al.,2011) test for the presence and the biological relevance of
categories in animal vocalizations (Searcy et al., 1999).
However, such investigation is necessary before forming
hypotheses regarding the biological meaning of these pat-
terns (Hauser, 1997). Our results demonstrate the presence
of distinct song variants in the male repertoires of the Tiritiri
Matangi Island hihi population. While the methodological
approach used to identify these variants is of primary
importance, no positive controls are available to assess its
accuracy as the song clusters perceived by the birds and,
therefore, of biological relevance, remain unknown.
Consequently, in order to identify song clusters, we compare
automatic and human-based clustering methods by assessing
their consistency and agreement against randomly structured
classifications. We define an ANN approach that is consist-
ent and can reproduce part of the variation found in human
expert classifications offering a way to overcome limitations
of human-based analyses. The ANN song classification
shows that the constitutive elements of the male repertoires,
defined as their spectro-temporal representations, can be
shared across individuals. These variants are distinguishable
on the basis of their time-frequency parameters as defined by
MFCC and PLP coefficients, although our approach can be
applied to other sound features. The dynamic time warping
distance, which measures subtle changes in the frequency
distribution of the songs, is able to efficiently quantify the
differences across variants.
Both the detection and classification of song variants are
automatically performed. The combination of MFCC coeffi-
cients with an HMM model provides an accurate approach
FIG. 3. Song repertoire of a single male used for classification tests. Songs
are not ordered in any particular way. Spectrograms range from 0 to
22 050 Hz (fast Fourier transform, 256 bands; window, Gaussian 50% over-
lap; frequency resolution, 86 Hz; temporal resolution, 5 ms).
TABLE I. ANN parameter values used for the automatic classification of
songs for classification evaluation.
Parameter Value
Number of epochs 5
Splitting threshold 2
Neighborhood strength maximum 4
Neighborhood strength standard deviation 2
Initial leaf number 2
Final leaf number 2
Gamma 0.95
Initial learning rate 0.90
Final learning rate 0.01
TABLE II. ANN parameter values used for the automatic classification of
songs (full dataset).
Parameter Value
Number of epochs 15
Splitting threshold 94
Neighborhood strength maximum 4
Neighborhood strength standard deviation 2
Initial leaf number 2
Final leaf number 2
Gamma 0.95
Initial learning rate 0.90
Final learning rate 0.01
J. Acoust. Soc. Am., Vol. 137, No. 5, May 2015 Ranjard et al.: Integration over song classifications 2547
Redistribution subject to ASA license or copyright; see http://acousticalsociety.org/content/terms. Download to IP: 130.56.97.49 On: Tue, 10 May 2016 08:12:26
for extracting hihi calls from field recordings. In the present
study, the detector allows us to successfully isolate hihi
vocalizations from background noise and other species calls
that are potentially produced at high energy. Additionally,
manual removal is carried out to ensure high quality of the
song dataset. During this process, (i) songs with overlapping
bioacoustic signal or background noise and (ii) other types
of hihi calls are discarded. To limit further the manual selec-
tion of extracted songs, a HMM specific to each hihi call
type could be added to the recognizer. Recent results suggest
that bandpass filtering prior to song encoding (Potamitis
et al., 2014) and the use of general acoustic features that
incorporate animal perceptual information (Clemins and
Johnson, 2006; Bastas et al., 2012) may improve the detec-
tion accuracy. Furthermore, identifying, e.g., through labora-
tory experiments (Dooling et al., 2002), and focusing only
on the acoustic parameters to which birds are the most sensi-
tive could enhance the detection accuracy. Similarly, such
sound features could also be used to improve the song classi-
fication procedure.
We present an automatic clustering approach to perform
song variant classification when only limited prior knowl-
edge is available. As opposed to individual identification or
species recognition problems, no dataset can be referenced
to act as a classification control. In this case, unless the var-
iants can be associated to a specific behavioral context, e.g.,
flight calls (Keen et al., 2014), or convey an observable
information, e.g., social categories (Wanker and Fischer,
2013), it is not possible to assess classification accuracy
against a known “true” classification. Consequently, a classi-
fier error rate cannot be estimated. Therefore, we focus on
consistency across classification replicates, as well as agree-
ment between human and automatic classifiers to evaluate
classifiers. We report relatively low agreement between
human expert classifications on the test dataset. Therefore,
there is a level of uncertainty in the grouping of the songs
preventing the use of a single benchmark expert classifica-
tion to (i) optimize the song variant classifier (Trawicki
et al., 2005; Tao et al., 2008) and (ii) select the best acoustic
parameters using, for example, a feature generation approach
(Giret et al., 2011). We, therefore, define an unsupervised
FIG. 5. Neighbor-joining dendrogram showing the pairwise song distancesobtained from encoded spectrogram alignments of a subset of 469 songs.Using visual inspection, a vertical line was drawn beside clusters of spectro-gram displaying similar shape. An arbitrarily chosen representative spectro-gram is shown on the right of each cluster (range from 0 to 22 050 Hz; fastFourier transform, 256 bands; window, Hamming 50% overlap; frequencyresolution, 86 Hz; temporal resolution, 5 ms).
FIG. 4. (Color online) Mean largest intra-cluster distance decreases with the
depth in the classification tree during the learning process. The Davies-
Bouldin clustering index is also indicated.
2548 J. Acoust. Soc. Am., Vol. 137, No. 5, May 2015 Ranjard et al.: Integration over song classifications
Redistribution subject to ASA license or copyright; see http://acousticalsociety.org/content/terms. Download to IP: 130.56.97.49 On: Tue, 10 May 2016 08:12:26

ANN algorithm to determine the number, as well as the com-
position of the song clusters. This ANN relies on a measure
of bioacoustic distance that is in agreement with most avail-
able methods (Ranjard et al., 2010) and is therefore suitable
for exploratory analyses. A previous study that applied ANN
algorithms demonstrated that supervised ANNs and LDA
perform equally well in classifying black-capped chickadee
call note types (Dawson et al., 2006) and ANNs can, in
some cases, outperform LDA (Mielke and Zuberb€uhler,
2013). Our results show that an unsupervised ANN algo-
rithm, which does not require an informed training stage,
can also be used to efficiently classify songs. The network
self-organizes on the dataset using nonlinear relationships
between acoustical parameters to uncover high-
dimensionality structure, i.e., song variant clusters.
Several factors may explain the disagreement measured
between human-based classifiers. Experts potentially pay
attention to different visual and auditory features of the song
recordings and spectrograms. Variability can also occur
throughout the process of classification (Jones et al., 2001).
Such results could be produced in the presence of a subset of
songs with a high level of similarities or dissimilarities and
another set of songs more homogeneous. Experts would con-
sistently classify the first set in the same way. However, the
classification of the second set would diverge across expert
classifications. Overall, these results illustrate the difficulty
in classifying hihi male songs. Because our classification
algorithm is fully automatic, it provides a tool to easily gen-
erate multiple classifications. We use such an approach in an
attempt to integrate over the variation in the song variant
clustering illustrated by the conflicting expert classifications.
Variation between automatic ANN classifications can arise
when conflicting signals of similarity are present in the dis-
tinct sound parameters used for the song encoding. While
some parameters may be relevant to the species under study,
others may not or could be generated by background noise.
Integrating over a distribution of song classifications, instead
of a unique or a limited number of expert-generated classifi-
cations, offers the possibility to take classification uncer-
tainty into account in bioacoustic studies. More robust
analyses will result from such an approach while gaining
confidence in the results.
A remaining question is to understand the evolutionary
or the behavioral causes explaining such song variation. In
birds, vocal communication variation within a population can
have a variety of functional significances (Catchpole and
Slater, 2008). A diversity of messages usually related to mate
attraction and territorial defense can be conveyed (Kroodsma
and Byers, 1991). Low level of correlation was reported
between geographic distance and territory song variant reper-
toires. Such results may be purely due to chance, although
geographic song variation may be present, but difficult to
detect because of the small size of the island and a limited
sample size. Most of the territory is indeed located in close
proximity from each other on the island. Several hypotheses
can be advanced to explain patterns of geographic song varia-
tion (Podos and Warren, 2007). For example, geographic
FIG. 7. Distribution of the Pearson correlation coefficient between repertoire
and geographic distances obtained with 100 classification replicates of the
1879 songs dataset.
FIG. 6. (Color online) Distribution of the JIs and RIs. Three human expert
classifications and 100 random and ANN (NNet.) classifications are com-
pared. Boxes represent the 25th and 75th percentiles with median. The 100
replicates of automatic classifications are highly similar and more similar to
expert classifications than expected by chance.
J. Acoust. Soc. Am., Vol. 137, No. 5, May 2015 Ranjard et al.: Integration over song classifications 2549
Redistribution subject to ASA license or copyright; see http://acousticalsociety.org/content/terms. Download to IP: 130.56.97.49 On: Tue, 10 May 2016 08:12:26

song variation can be the consequence of a biased dispersal
behavior. Alternatively, the Tiritiri Matangi Island population
could be at the initial stage of micro-geographic song varia-
tion, potentially leading to the development of geographic
dialects because of specific learning patterns. The pattern of
variation could also be directly related to the genetic diversity
of the bird population with genetically related individuals
acquiring proximate territories. Therefore, the study of
genetic relatedness and dispersal behavior is required in this
species to fully understand the causes responsible for the
observed pattern of song variation.
V. CONCLUSION
We applied an automatic methodology for bird song
detection and classification. High consistency is reported
between song classifications generated automatically. While
human expert classifications show some level of disagree-
ment, they present higher clustering similarity with automatic
song classification than random classifications. We, therefore,
demonstrate that laborious visual or acoustic inspection of
song recordings and spectrograms could be substituted by
computational statistical learning programs. Moreover, our
approach potentially offers a means to analyze a large
amount of data generated by recent high throughput field re-
cording technologies. Finally, we argue that integrating over
classification replicates should be performed in order to
account for song clustering uncertainty. Robust analysis is
then made possible by studying the distribution of a statistic
of interest rather than a single estimated value.
ACKNOWLEDGMENTS
The authors thank Kate Richardson for providing the
GPS location of the nest boxes. Isabel Castro provided field
assistance and helpful comments on the manuscript. Our
thanks go to John Ewen, Rose Thorogood, and Tamara
Henry for access to reproductive data and to the Supporters
of Tiritiri Matangi for assistance with data collection. All
data collection was carried out with permission from The
University of Auckland Animal Ethics Committee and the
New Zealand Department of Conservation. This study was
supported, in part, both by the Marsden Fund Council from
New Zealand Government funding, administrated by the
Royal Society of New Zealand, and by the Allan Wilson
Centre for Molecular Ecology and Evolution. The authors
wish to acknowledge the Centre for eResearch at the
University of Auckland and New Zealand eScience
Infrastructure high-performance computing facilities.
1http://www.bioinformatics.auckland.ac.nz/dtwave_cluster.php (Last accessed
29/04/2015).
Bastas, S., Majid, M. W., Mirzaei, G., Ross, J., Jamali, M. M., Gorsevski, P.
V., Frizado, J., and Bingman, V. P. (2012). “A novel feature extraction
algorithm for classification of bird flight calls,” in 2012 IEEEInternational Symposium on Circuits and Systems (ISCAS) (IEEE Circuits
and Systems Society, New York), pp. 1676–1679.
Bond, A., and Diamond, J. (2005). “Geographic and ontogenetic variation in
the contact calls of the kea (Nestor notabilis),” Behaviour 142, 1–20.
Brandes, T. S. (2008). “Automated sound recording and analysis techniques
for bird surveys and conservation,” Bird Conserv. Int. 18, S163–S173.
Castro, I., Minot, E. O., Fordham, R. A., and Birkhead, T. R. (1996).
“Polygynandry, face-to-face copulation and sperm competition in the Hihi
Notiomystis cincta (Aves: Meliphagidae),” Ibis 138, 765–771.
Catchpole, C. K., and Slater, P. J. B. (2008). Bird Song—Biological Themesand Variations (Cambridge University Press, Cambridge, UK), pp.
1–335.
Cholewiak, D. M., Sousa-Lima, R. S., and Cerchio, S. (2013). “Humpback
whale song hierarchical structure: Historical context and discussion of cur-
rent classification issues,” Mar. Mammal Sci. 29, E312–E332.
Clemins, P. J., and Johnson, M. T. (2006). “Generalized perceptual linear
prediction features for animal vocalization analysis,” J. Acoust. Soc. Am.
120, 527–534.
Davies, D. L., and Bouldin, D. W. (1979). “A cluster separation measure,”
IEEE Trans. Pattern Anal. Mach. Intell. PAMI-1, 224–227.
Davis, S., and Mermelstein, P. (1980). “Comparison of parametric represen-
tations for monosyllabic word recognition in continuously spoken
sentences,” IEEE Trans. Acoust., Speech, Signal Process. 28, 357–366.
Dawson, D. K., and Efford, M. G. (2009). “Bird population density esti-
mated from acoustic signals,” J. Appl. Ecol. 46, 1201–1209.
Dawson, M. R. W., Charrier, I., and Sturdy, C. B. (2006). “Using an artifi-
cial neural network to classify black-capped chickadee (Poecile atricapil-lus) call note types,” J. Acoust. Soc. Am. 119, 3161–3172.
Deecke, V. B., and Janik, V. M. (2006). “Automated categorization of bioa-
coustic signals: Avoiding perceptual pitfalls,” J. Acoust. Soc. Am. 119,
645–653.
de Kort, S. R., and ten Cate, C. (2001). “Response to interspecific vocaliza-
tions is affected by degree of phylogenetic relatedness in Streptopeliadoves,” Anim. Behav. 61, 239–247.
Dooling, R. J., Leek, M. R., Gleich, O., and Dent, M. L. (2002). “Auditory
temporal resolution in birds: Discrimination of harmonic complexes,”
J. Acoust. Soc. Am. 112, 748–759.
Gamba, M., and Giacoma, C. (2007). “Quantitative acoustic analysis of
the vocal repertoire of the crowned lemur,” Ethol. Ecol. Evol. 19,
323–343.
Giret, N., Roy, P., Albert, A., Pachet, F., Kreutzer, M., and Bovet, D.
(2011). “Finding good acoustic features for parrot vocalizations: The fea-
ture generation approach,” J. Acoust. Soc. Am. 129, 1089–1099.
Green, S. R., Mercado, E., Pack, A. A., and Herman, L. M. (2011).
“Recurring patterns in the songs of humpback whales (Megapteranovaeangliae),” Behav. Processes 86, 284–294.
Hauser, M. D. (1997). The Evolution of Communication (MIT Press,
Cambridge, MA), pp. 1–760.
Hermansky, H. (1990). “Perceptual linear predictive (PLP) analysis of
speech,” J. Acoust. Soc. Am. 87, 1738–1752.
Higgins, P. J., Peter, J. M., and Steele, W. K. (eds.) (2001). Handbook ofAustralian, New Zealand and Antarctic Birds: Volume 5: Tyrant-Flycatchers to Chats (Oxford University Press, Melbourne), pp. 1–1272.
Irwin, D. E., Irwin, J. H., and Price, T. D. (2001). “Ring species
as bridges between microevolution and speciation,” Genetica 112,
223–243.
Jaccard, P. (1908). “New research on floral distribution,” Bull. Soc.
Vaudoise Sci. Nat. 44, 223–270.
Jennings, N., Parsons, S., and Pocock, M. (2008). “Human vs. machine:
Identification of bat species from their echolocation calls by humans and
by artificial neural networks,” Can. J. Zool. 86, 371–377.
Jones, A. E., ten Cate, C., and Bijleveld, C. C. (2001). “The interobserver
reliability of scoring sonagrams by eye: A study on methods, illustrated on
zebra finch songs,” Anim. Behav. 62, 791–801.
Keen, S., Ross, J. C., Griffiths, E. T., Lanzone, M., and Farnsworth, A.
(2014). “A comparison of similarity-based approaches in the classification
of flight calls of four species of North American wood-warblers
(Parulidae),” Ecol. Inform. 21, 25–33.
Kirschel, A. N. G., Earl, D. A., Yao, Y., Escobar, I. A., Vilches, E., Vallejo,
E. E., and Taylor, C. E. (2009). “Using songs to identify individual
Mexican antthrush Formicarius monoliger: Comparison of four classifica-
tion methods,” Bioacoustics 19, 1–20.
Kohonen, T. (1990). “The self-organizing map,”Proc. IEEE 78, 1464–1480.
Kroodsma, D. E., and Byers, B. E. (1991). “The function(s) of bird song,”
Integr. Comp. Biol. 31, 318–328.
Krull, C. R., Ranjard, L., Landers, T. J., Ismar, S. M. H., Matthews, J. L.,
and Hauber, M. E. (2012). “Analyses of sex and individual differences in
vocalizations of Australasian gannets using a dynamic time warping algo-
rithm,” J. Acoust. Soc. Am. 132, 1189–1198.
2550 J. Acoust. Soc. Am., Vol. 137, No. 5, May 2015 Ranjard et al.: Integration over song classifications
Redistribution subject to ASA license or copyright; see http://acousticalsociety.org/content/terms. Download to IP: 130.56.97.49 On: Tue, 10 May 2016 08:12:26

Margoliash, D. (2002). “Evaluating theories of bird song learning:
Implications for future directions,” J. Comp. Physiol., A 188, 851–866.
Mielke, A., and Zuberb€uhler, K. (2013). “A method for automated individ-
ual, species and call type recognition in free-ranging animals,” Anim.
Behav. 86, 475–482.
Milinski, M. (1997). “How to avoid seven deadly sins in the study of behav-
ior,” Adv. Study Behav. 26, 159–180.
Pakkanen, J., Iivarinen, J., and Oja, E. (2004). “The evolving treeA novel
self-organizing network for data analysis,” Neural Process. Lett. 20,
199–211.
Podos, J., Peters, S., Rudnicky, T., Marler, P., and Nowicki, S. (1992). “The
organization of song repertoires in song sparrows: Themes and variations,”
Ethology 90, 89–106.
Podos, J., and Warren, P. S. (2007). “The evolution of geographic variation
in birdsong,” Adv. Study Behav. 37, 403–458.
Potamitis, I., Ntalampiras, S., Jahn, O., and Riede, K. (2014). “Automatic
bird sound detection in long real-field recordings: Applications and tools,”
Appl. Acoust. 80, 1–9.
Rabiner, L., and Juang, B. H. (1993). Fundamentals of Speech Recognition(Prentice-Hall, Upper Saddle River, NJ), pp. 1–507.
Rand, W. M. (1971). “Objective criteria for the evaluation of clustering
methods,” J. Am. Stat. Assoc. 66, 846–850.
Ranjard, L., Anderson, M. G., Rayner, M. J., Payne, R. B., McLean, I.,
Briskie, J. V., Ross, H. A., Brunton, D. H., Woolley, S. M. N., and
Hauber, M. E. (2010). “Bioacoustic distances between the begging calls of
brood parasites and their host species: A comparison of metrics and
techniques,” Behav. Ecol. Sociobiol. 64, 1915–1926.
Ranjard, L., and Ross, H. A. (2008). “Unsupervised bird song syllable clas-
sification using evolving neural networks,” J. Acoust. Soc. Am. 123,
4358–4368.
Searcy, W. A., Nowicki, S., and Peters, S. (1999). “Song types as fundamen-
tal units in vocal repertoires,”Anim. Behav. 58, 37–44.
Searcy, W. A., Podos, J., Peters, S., and Nowicki, S. (1995).
“Discrimination of song types and variants in song sparrows,”Anim.
Behav. 49, 1219–1226.
Sewall, K. B. (2009). “Limited adult vocal learning maintains call dialects
but permits pair-distinctive calls in red crossbills,” Anim. Behav. 77,
1303–1311.
Skowronski, M. D., and Harris, J. G. (2006). “Acoustic detection and classi-
fication of microchiroptera using machine learning: Lessons learned from
automatic speech recognition,” J. Acoust. Soc. Am. 119, 1817–1833.
Slabbekoorn, H., and den Boer-Visser, A. (2006). “Cities change the songs
of birds,” Curr. Biol. 16, 2326–2331.
Stoddard, P. K., Beecher, M. D., and Willis, M. S. (1988). “Response of ter-
ritorial male song sparrows to song types and variations,” Behav. Ecol.
Sociobiol. 22, 125–130.
Tao, J., Johnson, M. T., and Osiejuk, T. S. (2008). “Acoustic model adapta-
tion for ortolan bunting (Emberiza hortulana L.) song-type classification,”
J. Acoust. Soc. Am. 123, 1582–1590.
Trawicki, M. B., Johnson, M. T., and Osiejuk, T. S. (2005). “Automatic
song-type classification and speaker identification of Norwegian Ortolan
Bunting (Emberiza hortulana) vocalizations,” in 2005 IEEE Workshop onMachine Learning for Signal Processing, Vol. 2, pp. 277–282.
Trifa, V. M., Kirschel, A. N., Taylor, C. E., and Vallejo, E. E. (2008).
“Automated species recognition of antbirds in a Mexican rainforest using
hidden Markov models,” J. Acoust. Soc. Am. 123, 2424–2431.
Vallejo, E. E., Cody, M. L., and Taylor, C. E. (2007). “Unsupervised acous-
tic classification of bird species using hierarchical self-organizing maps,”
in Progress in Artificial Life, Third Australian Conference, ACAL,
Volume 4828/2007 of Lecture Notes in Computer Science, edited by M.
Randall, H. A. Abbass, and J. Wiles (Springer Berlin), pp. 212–221.
Wanker, R., and Fischer, J. (2001). “Intra- and interindividual variation in
the contact calls of Spectacled Parrotlets (Forpus conspicillatus),”
Behaviour 138, 709–726.
Withers, S. J. (2005). “The structure, function and variation of song in the
adult male hihi (Notiomystis cincta),” Master’s thesis, School of
Biological Sciences, The University of Auckland, pp. 1–382.
Young, S. J., Kershaw, D., Odell, J., Ollason, D., Valtchev, V., and
Woodland, P. (2006). The HTK Book Version 3.4 (Cambridge University
Press, Cambridge, UK), pp. 1–375.
J. Acoust. Soc. Am., Vol. 137, No. 5, May 2015 Ranjard et al.: Integration over song classifications 2551
Redistribution subject to ASA license or copyright; see http://acousticalsociety.org/content/terms. Download to IP: 130.56.97.49 On: Tue, 10 May 2016 08:12:26