integration of simca and near-infrared spectroscopy for ... · integration of simca and...
TRANSCRIPT
ww.sciencedirect.com
j o u rn a l o f f o o d a nd d r u g an a l y s i s 2 1 ( 2 0 1 3 ) 2 6 8e2 7 8
Available online at w
journal homepage: www.j fda-onl ine.com
Original Article
Integration of SIMCA and near-infraredspectroscopy for rapid and precise identificationof herbal medicines
I-Chang Yang a,b, Chao-Yin Tsai c,d, Kuang-Wen Hsieh e, Ci-Wen Yang c,Fu Ouyang c, Yangming Martin Lo a, Suming Chen b,c,d,*aDepartment of Nutrition and Food Science, University of Maryland, College Park, MD, USAbTaiwan Agricultural Mechanization Research and Development Center, Taipei, Taiwan, ROCcDepartment of Bio-Industrial Mechatronics Engineering, National Taiwan University, Taipei, Taiwan, ROCdBioenergy Research Center, National Taiwan University, Taipei, Taiwan, ROCeDepartment of Bio-Industrial Mechatronics Engineering, National Chung-Hsing University, Taichung, Taiwan, ROC
a r t i c l e i n f o
Article history:
Received 9 November 2012
Received in revised form
6 January 2013
Accepted 11 March 2013
Available online 8 August 2013
Keywords:
Classification
Herbal medicine
Near infrared
SIMCA
Spectroscopy
* Corresponding author. Department of Bio-Road, Taipei, 10617, Taiwan, ROC.
E-mail address: [email protected] (S. Ch
1021-9498 Copyright ª 2013, Food and Drug Adhttp://dx.doi.org/10.1016/j.jfda.2013.07.008
a b s t r a c t
The recognition, control, and monitoring of herbal medicinal materials is a crucial work
and challenge in the pharmaceutical industry. Consequently, the development of a rapid
and accurate inspectionmethod andmodel is an important goal and job. The rawmaterials
of a variety of herbal medicines were measured using nondestructive near-infrared spec-
troscopy with soft independent modeling of class analogy to build up the classification
model. The adulterated samples could be eliminated by the analysis of the model, and
identification rates were demonstrated in the range of 98e100%. The method could be
applied not only to the pharmaceutical industry but also to the food industry. Food ma-
terials can be measured with the inspection model for effective identification and deter-
mination of adulteration.
Copyright ª 2013, Food and Drug Administration, Taiwan. Published by Elsevier Taiwan
LLC. Open access under CC BY-NC-ND license.
1. Introduction especially when accurate determination of functional in-
The integration of Chinese herbal medicines into modern
medical treatments has assumed a more prominent profile in
recent years [1]. Without purification to single out specific
ingredients, quality control of these raw materials of phar-
maceutical value is crucial and yet remains a challenge,
Industrial Mechatronics E
en).
ministration, Taiwan. Publ
gredients in raw materials often requires extensive analytical
tasks. In fact, many Chinese herbal medicines are now pre-
served in dry powder form for ease of storage and distribution.
The herbs are not easily differentiated visually for materials
still in driedwhole formwithout expert training; identification
of the specific varieties in powder form is even more
ngineering, National Taiwan University, No. 1, Sec. 4, Roosevelt
ished by Elsevier Taiwan LLC. Open access under CC BY-NC-ND license.
j o u r n a l o f f o o d and d ru g an a l y s i s 2 1 ( 2 0 1 3 ) 2 6 8e2 7 8 269
challenging. There is a dire need to develop a rapid and ac-
curate detection method for these herbal materials in order to
foster their application in modern medicine.
It is well recognized that the quality of herbal pharma-
ceuticals can vary considerably because of the inherent vari-
ability caused by sourcing from regions with different climatic
and soil conditions. Adulteration problems are also likely to be
encountered as economic incentives continue to grow for
herbal materials. To date, sensory and chemical analyses are
often required for the inspection and/or identification of
herbal medicines. With morphological or histological tech-
niques to differentiate herbal materials becoming impossible
in the powder form, analytical approaches such as high-
performance liquid chromatography [2], gas chromatogra-
phyemass spectrometry [3], thin layer chromatography [4],
and capillary electrophoresis [5] are often used. However, it is
impossible to apply these methods for online inspection
because of the complicated sample preparation procedures
and long analysis times required. Moreover, these sample-
destructive methods are poorly suited for inspection because
they inevitably damage and consume the sample materials.
Nondestructive inspection methods such as optical [6,7],
ultrasonic [8], and electromagnetic [9] techniques that make
online inspection and automation possible are becoming
popular with practical applications in a variety of areas,
especially in the pharmaceutical [10,11], food [12], agricultural
[13], chemical [14], and biobased industries [15]. Because
traditional Chinesemedicines come from a variety of different
plant parts, near-infrared spectroscopic analysis is well suited
to the analysis of the highly varied chemical compositions of
the herbal materials [16,17]. The above inspections with high-
performance classification methods would be needed and
appreciated. The soft independent modeling of class analogy
(SIMCA) method provides a useful classification of high-
dimensional variations and incorporates principal compo-
nent analysis (PCA) to reduce the dimensions of the spectra
[18,19]. A SIMCAmodel consists of a collection of PCAmodels,
and the data sets are independent. In comparison with the
nonlinear modeling method, the calculation speed of SIMCA
with PCA can be increased by calculating the covariance
matrices and the indices. Therefore, the SIMCA model with
PCA was selected for the development of the offline calibra-
tion model.
In the previous study [16], a robust inspection model using
near-infrared spectroscopy with artificial neural network
(ANN) analysis was developed for the classification of herbal
materials. Although the results were excellent, developing the
calibration database was time-consuming, consequently
limiting the applicability of the model. In the present study, a
SIMCA [20,21] based on near-infrared spectroscopy was
developed to improve the calculation speed and retain the
capacity for accurate classification of the herbal medicine
materials.
2. Materials and methods
This study used 48 different raw herbal medicines that were
provided by Sun Ten Pharmaceutical Co., Ltd. (New Taipei
City, Taiwan). In the form of dry powder. For each of the 48
medicines, there were 30 individual samples, producing a
total of 1440 spectral measurements for this study. Each
sample was loaded into a 20-mL vial such that the volume of
the vial was approximately 2/3 full with a powder depth of at
least 2 cm, in order to prevent light transmission during the
spectral reflectance measurement.
This study included only raw unprocessed dry herbal
sample types originating primarily from plant leaves, stems,
roots, flowers, fruits, seeds, and nuts; other possible herbal
ingredients that occur naturally in nonsolid forms, such as
liquids or gels, were not included. All samples were ground to
the crude powder form for the near-infrared spectroscopic
inspection.
2.1. Sample preparation and grouping
Table 1 lists the pool of 48 medicinal herbs used in this study.
The stability of the SIMCAmodel was evaluated using Group 1
data, which consisted of three nonoverlapping calibration
subgroups (A, C, E) paired with three prediction subgroups (B,
D, F), respectively. Thirty different kinds of herbs were
randomly selected (from among the 48 available) and sepa-
rated into the three independent calibration subgroups. The
selection process also assigned 15 herbs to each prediction
subgroup, allowing for some overlap between the prediction
subgroups and also between nonpaired calibration and pre-
diction subgroups. There was no overlap between A and B,
between C and D, or between E and F. The selection process
was as follows: (1) starting with the pool of 48 available herbs,
subgroup A (10 herbs) was selected, leaving 38 herbs available
in the pool; (2) both subgroups B (15) and C (10) were each
selected randomly from the pool of 38 and then the members
of subgroup C were eliminated, leaving 28 in the pool; (3) both
subgroups D (15) and E (10) were each selected randomly from
the pool of 28 and then the members of subgroup E were
eliminated, leaving 18 in the pool; (4) finally, subgroup F (15)
was selected from the pool of 18.
The above data in Group 1 was used to test SIMCA models
using different (independent) sets of spectral data. For Group
2, the pool of all 48 herbs was separated into two subgroups:
calibration subgroup G containing 30 herbs and prediction
subgroup H containing 18 herbs. These Group 2 data were
used to test SIMCA models using a larger set of calibration
data; by design, the herbs in subgroup G (calibration set of 30)
include all the herbs in Group 1 calibration subgroups A (10)
and C (10) but none of those in subgroup E (10).
Group 1
� Subgroup A contained 10 herbs: Angelicae Sinensis Radix,
Artemisia scoparia Waldst et Kit., Citrus Sinensis Exo-
carpium, Clematidis Radix, Ligustici Rhizoma, Magnoliae
Flos, Nelumbinis Folum, Platycodi Radix, Polyporus, and
Rhei Rhizoma.
� Subgroup B contained 15 herbs: Atractylodis Rhizoma,
Bupleuri Radix, Cinnamomi Ramulus, Ephedrae Herba,
Evodiae Fructus, Hoelen, Paeoniae Lactiflorae Radix,
Paeoniae Veitchii Radix, Perillae Folium, Pinelliae Tuber,
Puerriae Radix, Salviae Miltiorrhizae Radix, Sapo-
shinkoviae Radix, Scutellariae Radix, and Zingiberis Sic-
catum Rhizoma.
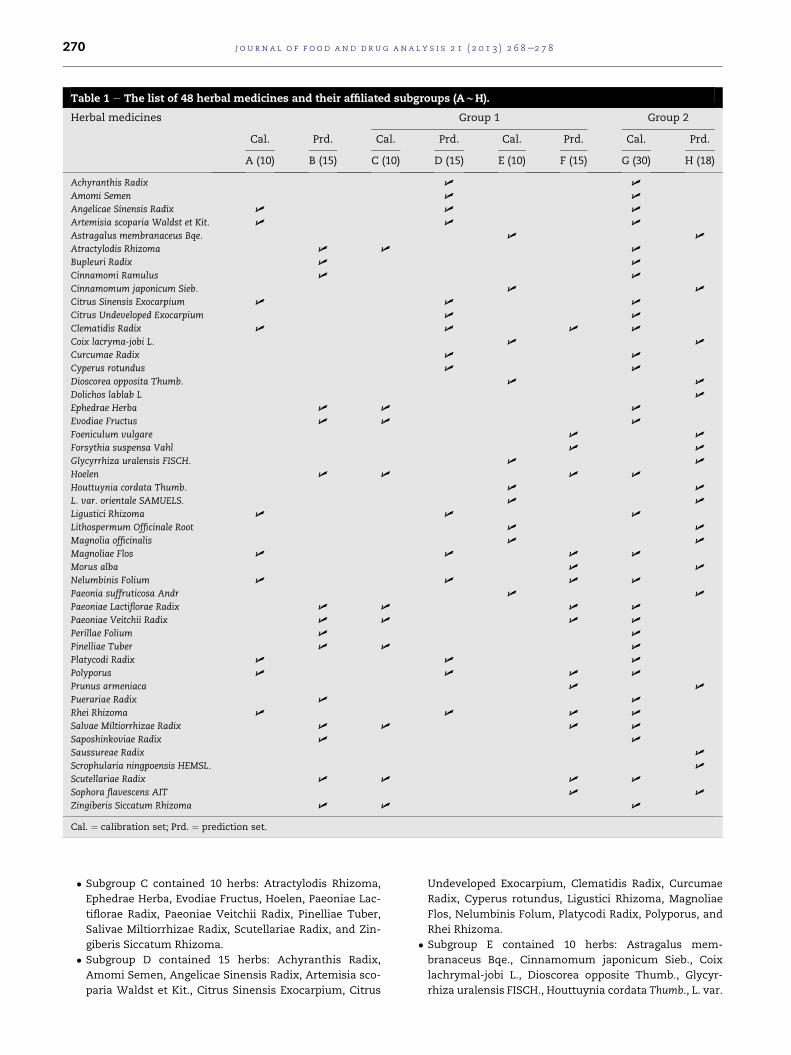
Table 1 e The list of 48 herbal medicines and their affiliated subgroups (AwH).
Herbal medicines Group 1 Group 2
Cal. Prd. Cal. Prd. Cal. Prd. Cal. Prd.
A (10) B (15) C (10) D (15) E (10) F (15) G (30) H (18)
Achyranthis Radix U U
Amomi Semen U U
Angelicae Sinensis Radix U U U
Artemisia scoparia Waldst et Kit. U U U
Astragalus membranaceus Bqe. U U
Atractylodis Rhizoma U U U
Bupleuri Radix U U
Cinnamomi Ramulus U U
Cinnamomum japonicum Sieb. U U
Citrus Sinensis Exocarpium U U U
Citrus Undeveloped Exocarpium U U
Clematidis Radix U U U U
Coix lacryma-jobi L. U U
Curcumae Radix U U
Cyperus rotundus U U
Dioscorea opposita Thumb. U U
Dolichos lablab L U
Ephedrae Herba U U U
Evodiae Fructus U U U
Foeniculum vulgare U U
Forsythia suspensa Vahl U U
Glycyrrhiza uralensis FISCH. U U
Hoelen U U U U
Houttuynia cordata Thumb. U U
L. var. orientale SAMUELS. U U
Ligustici Rhizoma U U U
Lithospermum Officinale Root U U
Magnolia officinalis U U
Magnoliae Flos U U U U
Morus alba U U
Nelumbinis Folium U U U U
Paeonia suffruticosa Andr U U
Paeoniae Lactiflorae Radix U U U U
Paeoniae Veitchii Radix U U U U
Perillae Folium U U
Pinelliae Tuber U U U
Platycodi Radix U U U
Polyporus U U U U
Prunus armeniaca U U
Puerariae Radix U U
Rhei Rhizoma U U U U
Salvae Miltiorrhizae Radix U U U U
Saposhinkoviae Radix U U
Saussureae Radix U
Scrophularia ningpoensis HEMSL. U
Scutellariae Radix U U U U
Sophora flavescens AIT U U
Zingiberis Siccatum Rhizoma U U U
Cal. ¼ calibration set; Prd. ¼ prediction set.
j o u rn a l o f f o o d a nd d r u g an a l y s i s 2 1 ( 2 0 1 3 ) 2 6 8e2 7 8270
� Subgroup C contained 10 herbs: Atractylodis Rhizoma,
Ephedrae Herba, Evodiae Fructus, Hoelen, Paeoniae Lac-
tiflorae Radix, Paeoniae Veitchii Radix, Pinelliae Tuber,
Salivae Miltiorrhizae Radix, Scutellariae Radix, and Zin-
giberis Siccatum Rhizoma.
� Subgroup D contained 15 herbs: Achyranthis Radix,
Amomi Semen, Angelicae Sinensis Radix, Artemisia sco-
paria Waldst et Kit., Citrus Sinensis Exocarpium, Citrus
Undeveloped Exocarpium, Clematidis Radix, Curcumae
Radix, Cyperus rotundus, Ligustici Rhizoma, Magnoliae
Flos, Nelumbinis Folum, Platycodi Radix, Polyporus, and
Rhei Rhizoma.
� Subgroup E contained 10 herbs: Astragalus mem-
branaceus Bqe., Cinnamomum japonicum Sieb., Coix
lachrymal-jobi L., Dioscorea opposite Thumb., Glycyr-
rhiza uralensis FISCH., Houttuynia cordata Thumb., L. var.
j o u r n a l o f f o o d and d ru g an a l y s i s 2 1 ( 2 0 1 3 ) 2 6 8e2 7 8 271
orientale SAMUELS., Lithospermum Officinale Root,
Magnolia officinalis, and Paeonia suffruticosa Andr.
� Subgroup F contained 15 herbs: Clematidis Radix, Foe-
niculum vulgare, Forsythia suspensa Vahl, Hoelen, Mag-
noliae Flos, Morus alba, Nelumbinis Folium, Paeoniae
Lactiflorae Radix, Paeoniae Veitchii Radix, Polyporus,
Prunus armeniaca, Salivae Miltiorrhizae Radix, Rhei Rhi-
zoma, Scutellariae Radix, and Sophora flavescens AIT.
Group 2
� Subgroup G contained 30 herbs: Achyranthis Radix,
Amomi Semen, Anglicae Sinensis Radix, Artemisia sco-
paria Waldst et Kit., Atractylodis Rhizoma, Bupleuri
Radix, Cinnamomi Ramulus, Citrus Sinensis Exocarpium,
Citrus Undeveloped Exocarpium, Clematidis Radix, Cur-
cumae Radix, Cyperus rotundus, Ephedrae Herba, Evo-
diae Fructus, Hoelen, Ligustici Rhizoma, Magnoliae Flos,
Nelumbinis Folum, Paeoniae Lactiflorae Radix, Paeonia
Veitchii Radix, Perillae Folium, Pinelliae Tuber, Platycodi
Radix, Polyporus, Puerariae Radix, Rhei Rhizoma, Sailvae
Miltiorrhizae Radix, Saposhinkoviae Radix, Scutellariae
Radix, and Zingiberis Siccatum Rhizoma.
� Subgroup H contained 18 herbs: Astragalus mem-
branaceus Bqe., Cinnamomum japonicum Sieb., Coix
lachrymal-jobi L., Dioscorea opposite Thumb., Dolichos
lablab L., Foeniculum vulgare, Forsythia suspensa Vahl,
Glycyrrhiza uralensis FISCH., Houttuynia cordata Thumb.,
L. var. orientale SAMUELS., Lithospermum Officinale
Root, Magnolia officinalis, Morus alba, Paeonia suf-
fruticosa Andr, Prunus armeniaca, Saussureae Radix,
Scrophularia ningpoensis HEMSL., and Sophora fla-
vescens AIT.
2.2. Apparatus and experiments
The spectra of the herb samples were measured on a FOSS
NIRSystems instrument Model 6500 NIR reflectance spec-
trometer (FOSS NIRSystems, Inc., Laurel, MD, USA) configured
with a rapid content analyzer module and a tungsten halogen
lamp as the light source, and using the VISION 3.0 software
(FOSS NIRSystems, Inc.) for system control and data acquisi-
tion. The sampleswere scanned at 2-nm intervals in the range
of 400e2498 nm, encompassing the visible and near-infrared
wavelengths. Silicon detectors were used below 1100 nm,
followed by lead sulfide detectors above 1100 nm. Spectral
analysis and the development of SIMCA models were carried
out using Matlab 7.2 (The Mathworks, Inc., Natick, MA, USA)
with PLS Toolbox 5.0 (Eigenvector Research, Inc., Wenatchee,
WA, USA).
2.3. Data pretreatment
For all 1440 sample spectra, the standard normalized variate
transformation [22] was applied to reduce spectral variation.
For the Group 1 calibration subgroups (A, C, E), the 300 sample
spectra in each subgroup were separated into two setsda
calibration set of 200 spectra and a validation set of 100
spectradusing the KennardeStone algorithm [23]. For Group
2, calibration subgroup G contained 900 sample spectra that
were separated into a set of 600 calibration set samples and
300 validation set samples. SIMCA models were developed
using the calibration data sets and then used to predict the
spectral samples in the prediction sets.
2.4. Principal component analysis
PCA [20] is a useful chemometric analysis tool for spectral data
compression and information extraction that allows the most
important information contained in the spectra to be
described using a small number of principal components (PC).
In this study,M is a near-infrared spectral data matrix with m
rows (m samples) and n columns (n wavelengths). PCA de-
composesM as the sum of series combinations of ti and pi. The
ti and pi pairs are ordered (i) by the amount of variance
captured. The scores (ti vectors) contain information on how
the samples relate to each other. The loadings ( pi vectors)
contain information on how the variables relate to each other.
The PCA model is truncated after the k components and
remaining variance factors are consolidated into a residual
matrix E:
M ¼ t1pT1 þ t2p
T2 þ/þ tkp
Tk þ E (1)
Mathematically, PCA relies on an eigenvector decomposi-
tion of the covariance matrix of the process variables. For a
given data matrix M with m rows and n columns, the covari-
ance matrix of M is defined as:
covðMÞ ¼ MTMm� 1
(2)
The columns of M have been “mean-centered” by sub-
tracting the original mean of each column. In the PCA
decomposition, the pi vectors are eigenvectors of the covari-
ance matrix. For each pi,:
covðMÞpi ¼ lipi (3)
li is the eigenvalue associated with the eigenvector pi. The tiforms an orthogonal set (ti
Ttj ¼ 0, for i s j ), whereas pi is
orthonormal ( piTpj ¼ 0 for is j; pi
Tpj ¼ 1, for i ¼ j ). Note that for
M and any ti, pi pair,
Mpi ¼ ti (4)
Here, ti is the projection of M onto pi. The ti and pi pairs are
arranged in descending order according to the associated,
which is ameasure of the amount of variance described by the
ti and pi pair. The t1, p1 pair captures the greatest amount of
variation in the data that can be captured with a linear factor;
and then each subsequent pair captures the greatest possible
amount of variance remaining after subtracting tipTi from M.
2.5. Monitoring indices associated with PCA models
Hotelling’s T2 and the Q residual [24] are two indices
commonly used to evaluate new data using a previously
developed PCA model. Hotelling’s T2 can be viewed as the
distance from a sample’s projection into the k-dimensional
subspace to the centroid of the subspace. The Q residual is the
distance between a sample point in n-space and its projection
in the k-dimensional subspace of the model (as shown in
Fig. 1).
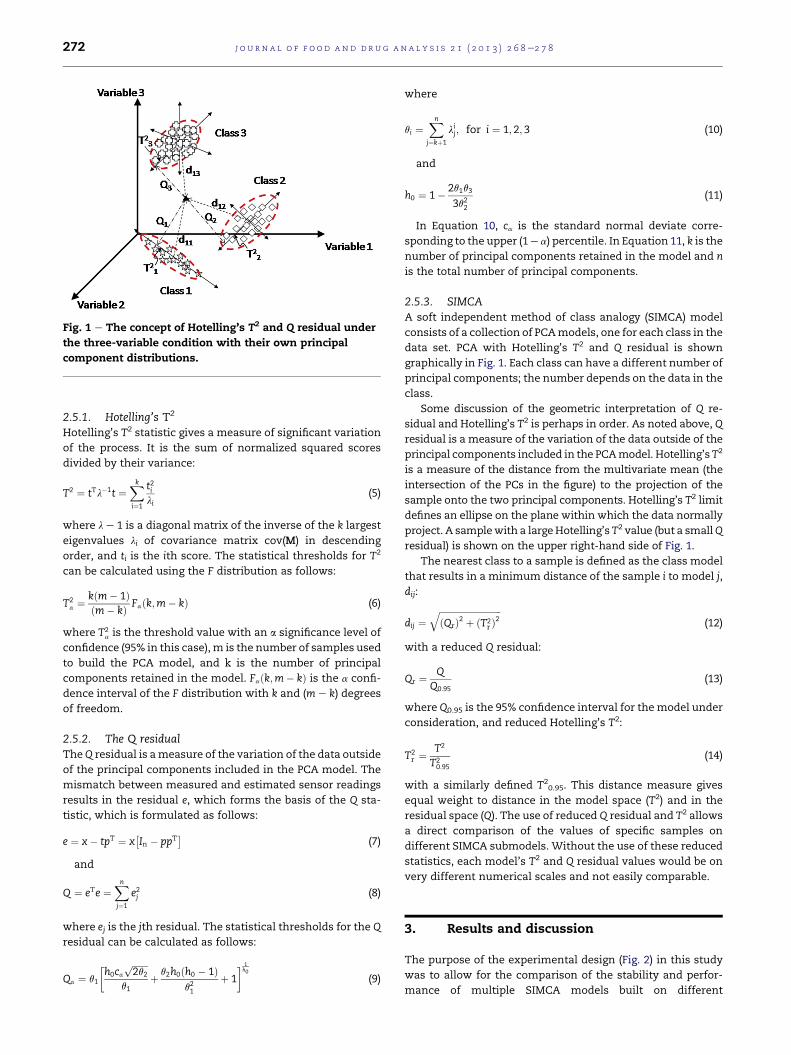
Fig. 1 e The concept of Hotelling’s T2 and Q residual under
the three-variable condition with their own principal
component distributions.
j o u rn a l o f f o o d a nd d r u g an a l y s i s 2 1 ( 2 0 1 3 ) 2 6 8e2 7 8272
2.5.1. Hotelling’s T2
Hotelling’s T2 statistic gives a measure of significant variation
of the process. It is the sum of normalized squared scores
divided by their variance:
T2 ¼ tTl�1t ¼Xk
i¼1
t2ili
(5)
where l e 1 is a diagonal matrix of the inverse of the k largest
eigenvalues li of covariance matrix cov(M) in descending
order, and ti is the ith score. The statistical thresholds for T2
can be calculated using the F distribution as follows:
T2a ¼ kðm� 1Þ
ðm� kÞ Faðk;m� kÞ (6)
where T2a is the threshold value with an a significance level of
confidence (95% in this case),m is the number of samples used
to build the PCA model, and k is the number of principal
components retained in the model. Faðk;m� kÞ is the a confi-
dence interval of the F distribution with k and (m e k) degrees
of freedom.
2.5.2. The Q residualTheQ residual is ameasure of the variation of the data outside
of the principal components included in the PCA model. The
mismatch between measured and estimated sensor readings
results in the residual e, which forms the basis of the Q sta-
tistic, which is formulated as follows:
e ¼ x� tpT ¼ x�In � ppT
�(7)
and
Q ¼ eTe ¼Xn
j¼1
e2j (8)
where ej is the jth residual. The statistical thresholds for the Q
residual can be calculated as follows:
Qa ¼ q1
�h0ca
ffiffiffiffiffiffiffi2q2
pq1
þ q2h0ðh0 � 1Þq21
þ 1
� 1h0
(9)
where
qi ¼Xnj¼kþ1
lij; for i ¼ 1; 2; 3 (10)
and
h0 ¼ 1� 2q1q33q22
(11)
In Equation 10, ca is the standard normal deviate corre-
sponding to the upper (1e a) percentile. In Equation 11, k is the
number of principal components retained in the model and n
is the total number of principal components.
2.5.3. SIMCAA soft independent method of class analogy (SIMCA) model
consists of a collection of PCAmodels, one for each class in the
data set. PCA with Hotelling’s T2 and Q residual is shown
graphically in Fig. 1. Each class can have a different number of
principal components; the number depends on the data in the
class.
Some discussion of the geometric interpretation of Q re-
sidual and Hotelling’s T2 is perhaps in order. As noted above, Q
residual is a measure of the variation of the data outside of the
principal components included in the PCAmodel. Hotelling’sT2
is a measure of the distance from the multivariate mean (the
intersection of the PCs in the figure) to the projection of the
sample onto the two principal components. Hotelling’s T2 limit
defines an ellipse on the plane within which the data normally
project. A samplewith a largeHotelling’s T2 value (but a smallQ
residual) is shown on the upper right-hand side of Fig. 1.
The nearest class to a sample is defined as the class model
that results in a minimum distance of the sample i to model j,
dij:
dij ¼ffiffiffiffiffiffiffiffiffiffiffiffiffiffiffiffiffiffiffiffiffiffiffiffiffiffiffiffiðQrÞ2 þ ðT2
r Þ2q
(12)
with a reduced Q residual:
Qr ¼ QQ0:95
(13)
where Q0.95 is the 95% confidence interval for themodel under
consideration, and reduced Hotelling’s T2:
T2r ¼
T2
T20:95
(14)
with a similarly defined T20.95. This distance measure gives
equal weight to distance in the model space (T2) and in the
residual space (Q). The use of reduced Q residual and T2 allows
a direct comparison of the values of specific samples on
different SIMCA submodels. Without the use of these reduced
statistics, each model’s T2 and Q residual values would be on
very different numerical scales and not easily comparable.
3. Results and discussion
The purpose of the experimental design (Fig. 2) in this study
was to allow for the comparison of the stability and perfor-
mance of multiple SIMCA models built on different
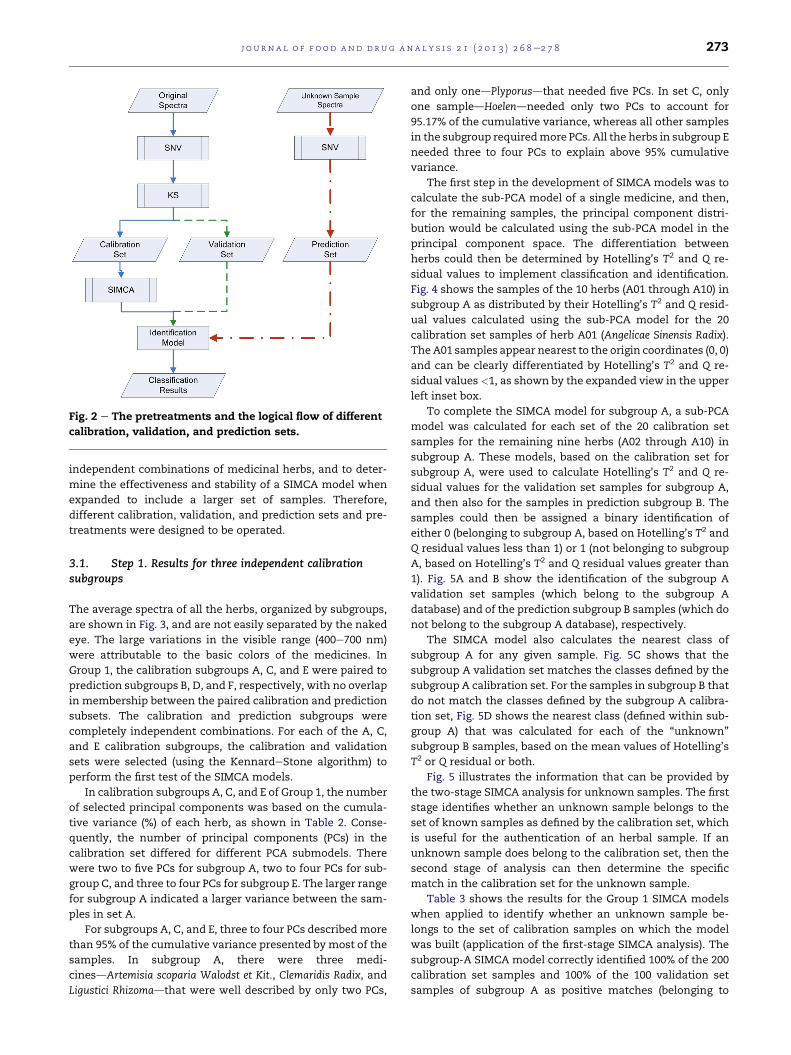
Fig. 2 e The pretreatments and the logical flow of different
calibration, validation, and prediction sets.
j o u r n a l o f f o o d and d ru g an a l y s i s 2 1 ( 2 0 1 3 ) 2 6 8e2 7 8 273
independent combinations of medicinal herbs, and to deter-
mine the effectiveness and stability of a SIMCA model when
expanded to include a larger set of samples. Therefore,
different calibration, validation, and prediction sets and pre-
treatments were designed to be operated.
3.1. Step 1. Results for three independent calibrationsubgroups
The average spectra of all the herbs, organized by subgroups,
are shown in Fig. 3, and are not easily separated by the naked
eye. The large variations in the visible range (400e700 nm)
were attributable to the basic colors of the medicines. In
Group 1, the calibration subgroups A, C, and E were paired to
prediction subgroups B, D, and F, respectively, with no overlap
in membership between the paired calibration and prediction
subsets. The calibration and prediction subgroups were
completely independent combinations. For each of the A, C,
and E calibration subgroups, the calibration and validation
sets were selected (using the KennardeStone algorithm) to
perform the first test of the SIMCA models.
In calibration subgroups A, C, and E of Group 1, the number
of selected principal components was based on the cumula-
tive variance (%) of each herb, as shown in Table 2. Conse-
quently, the number of principal components (PCs) in the
calibration set differed for different PCA submodels. There
were two to five PCs for subgroup A, two to four PCs for sub-
group C, and three to four PCs for subgroup E. The larger range
for subgroup A indicated a larger variance between the sam-
ples in set A.
For subgroups A, C, and E, three to four PCs describedmore
than 95% of the cumulative variance presented by most of the
samples. In subgroup A, there were three medi-
cinesdArtemisia scoparia Walodst et Kit., Clemaridis Radix, and
Ligustici Rhizomadthat were well described by only two PCs,
and only onedPlyporusdthat needed five PCs. In set C, only
one sampledHoelendneeded only two PCs to account for
95.17% of the cumulative variance, whereas all other samples
in the subgroup requiredmore PCs. All the herbs in subgroup E
needed three to four PCs to explain above 95% cumulative
variance.
The first step in the development of SIMCA models was to
calculate the sub-PCA model of a single medicine, and then,
for the remaining samples, the principal component distri-
bution would be calculated using the sub-PCA model in the
principal component space. The differentiation between
herbs could then be determined by Hotelling’s T2 and Q re-
sidual values to implement classification and identification.
Fig. 4 shows the samples of the 10 herbs (A01 through A10) in
subgroup A as distributed by their Hotelling’s T2 and Q resid-
ual values calculated using the sub-PCA model for the 20
calibration set samples of herb A01 (Angelicae Sinensis Radix).
The A01 samples appear nearest to the origin coordinates (0, 0)
and can be clearly differentiated by Hotelling’s T2 and Q re-
sidual values <1, as shown by the expanded view in the upper
left inset box.
To complete the SIMCA model for subgroup A, a sub-PCA
model was calculated for each set of the 20 calibration set
samples for the remaining nine herbs (A02 through A10) in
subgroup A. These models, based on the calibration set for
subgroup A, were used to calculate Hotelling’s T2 and Q re-
sidual values for the validation set samples for subgroup A,
and then also for the samples in prediction subgroup B. The
samples could then be assigned a binary identification of
either 0 (belonging to subgroup A, based on Hotelling’s T2 and
Q residual values less than 1) or 1 (not belonging to subgroup
A, based on Hotelling’s T2 and Q residual values greater than
1). Fig. 5A and B show the identification of the subgroup A
validation set samples (which belong to the subgroup A
database) and of the prediction subgroup B samples (which do
not belong to the subgroup A database), respectively.
The SIMCA model also calculates the nearest class of
subgroup A for any given sample. Fig. 5C shows that the
subgroup A validation set matches the classes defined by the
subgroup A calibration set. For the samples in subgroup B that
do not match the classes defined by the subgroup A calibra-
tion set, Fig. 5D shows the nearest class (defined within sub-
group A) that was calculated for each of the “unknown”
subgroup B samples, based on the mean values of Hotelling’s
T2 or Q residual or both.
Fig. 5 illustrates the information that can be provided by
the two-stage SIMCA analysis for unknown samples. The first
stage identifies whether an unknown sample belongs to the
set of known samples as defined by the calibration set, which
is useful for the authentication of an herbal sample. If an
unknown sample does belong to the calibration set, then the
second stage of analysis can then determine the specific
match in the calibration set for the unknown sample.
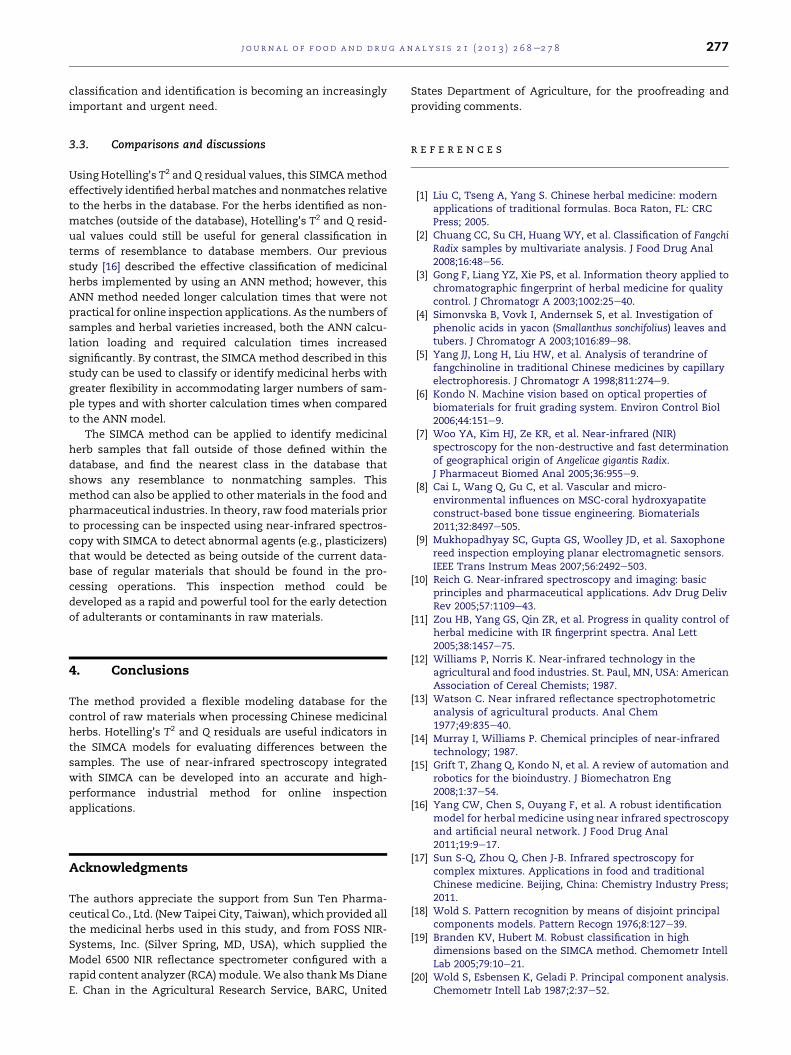
Table 3 shows the results for the Group 1 SIMCA models
when applied to identify whether an unknown sample be-
longs to the set of calibration samples on which the model
was built (application of the first-stage SIMCA analysis). The
subgroup-A SIMCA model correctly identified 100% of the 200
calibration set samples and 100% of the 100 validation set
samples of subgroup A as positive matches (belonging to
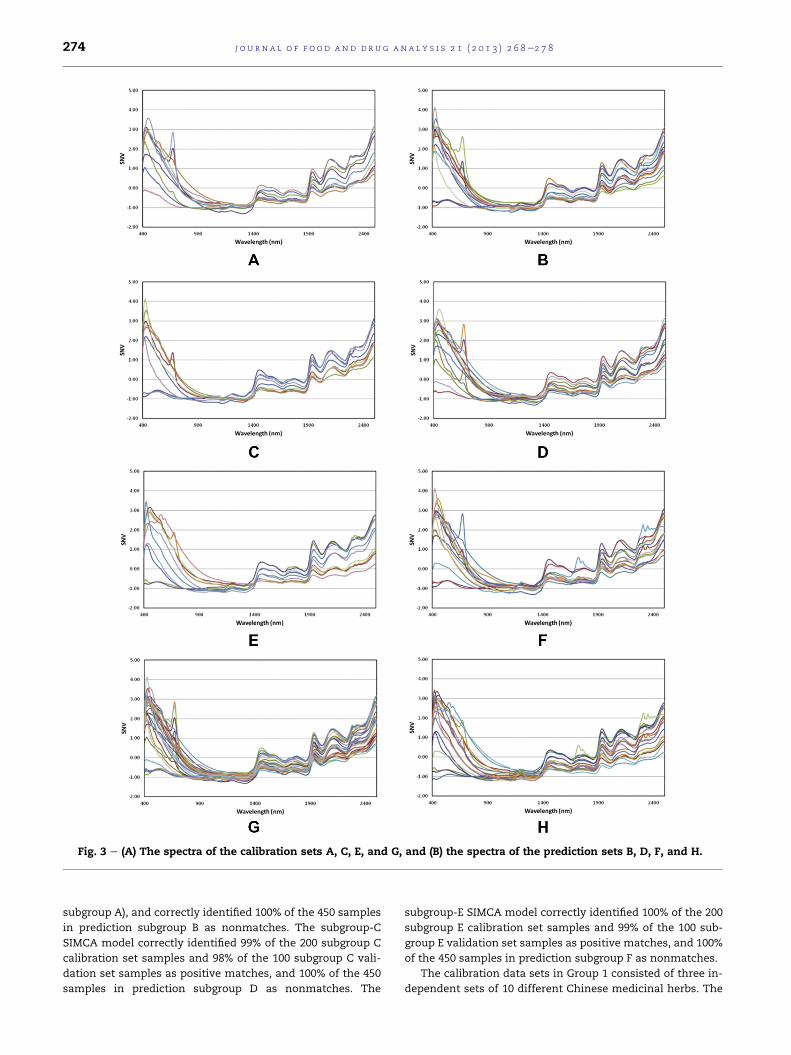
Fig. 3 e (A) The spectra of the calibration sets A, C, E, and G, and (B) the spectra of the prediction sets B, D, F, and H.
j o u rn a l o f f o o d a nd d r u g an a l y s i s 2 1 ( 2 0 1 3 ) 2 6 8e2 7 8274
subgroup A), and correctly identified 100% of the 450 samples
in prediction subgroup B as nonmatches. The subgroup-C
SIMCA model correctly identified 99% of the 200 subgroup C
calibration set samples and 98% of the 100 subgroup C vali-
dation set samples as positive matches, and 100% of the 450
samples in prediction subgroup D as nonmatches. The
subgroup-E SIMCA model correctly identified 100% of the 200
subgroup E calibration set samples and 99% of the 100 sub-
group E validation set samples as positive matches, and 100%
of the 450 samples in prediction subgroup F as nonmatches.
The calibration data sets in Group 1 consisted of three in-
dependent sets of 10 different Chinese medicinal herbs. The
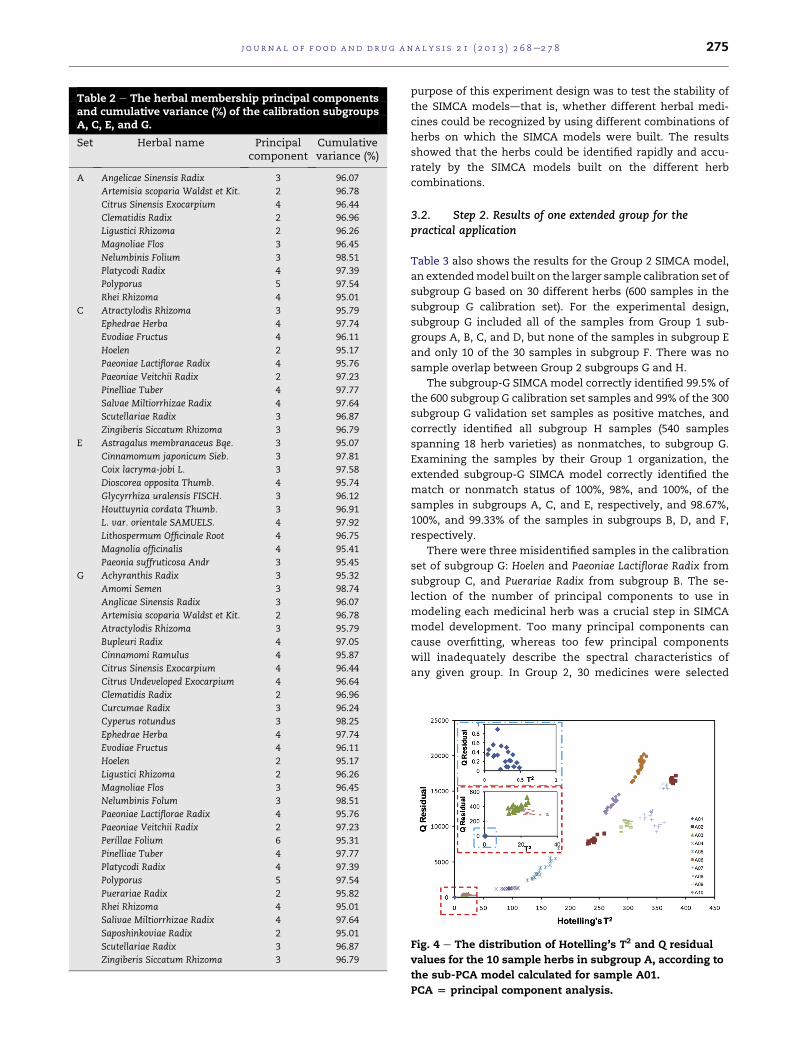
Table 2 e The herbal membership principal componentsand cumulative variance (%) of the calibration subgroupsA, C, E, and G.
Set Herbal name Principalcomponent
Cumulativevariance (%)
A Angelicae Sinensis Radix 3 96.07
Artemisia scoparia Waldst et Kit. 2 96.78
Citrus Sinensis Exocarpium 4 96.44
Clematidis Radix 2 96.96
Ligustici Rhizoma 2 96.26
Magnoliae Flos 3 96.45
Nelumbinis Folium 3 98.51
Platycodi Radix 4 97.39
Polyporus 5 97.54
Rhei Rhizoma 4 95.01
C Atractylodis Rhizoma 3 95.79
Ephedrae Herba 4 97.74
Evodiae Fructus 4 96.11
Hoelen 2 95.17
Paeoniae Lactiflorae Radix 4 95.76
Paeoniae Veitchii Radix 2 97.23
Pinelliae Tuber 4 97.77
Salvae Miltiorrhizae Radix 4 97.64
Scutellariae Radix 3 96.87
Zingiberis Siccatum Rhizoma 3 96.79
E Astragalus membranaceus Bqe. 3 95.07
Cinnamomum japonicum Sieb. 3 97.81
Coix lacryma-jobi L. 3 97.58
Dioscorea opposita Thumb. 4 95.74
Glycyrrhiza uralensis FISCH. 3 96.12
Houttuynia cordata Thumb. 3 96.91
L. var. orientale SAMUELS. 4 97.92
Lithospermum Officinale Root 4 96.75
Magnolia officinalis 4 95.41
Paeonia suffruticosa Andr 3 95.45
G Achyranthis Radix 3 95.32
Amomi Semen 3 98.74
Anglicae Sinensis Radix 3 96.07
Artemisia scoparia Waldst et Kit. 2 96.78
Atractylodis Rhizoma 3 95.79
Bupleuri Radix 4 97.05
Cinnamomi Ramulus 4 95.87
Citrus Sinensis Exocarpium 4 96.44
Citrus Undeveloped Exocarpium 4 96.64
Clematidis Radix 2 96.96
Curcumae Radix 3 96.24
Cyperus rotundus 3 98.25
Ephedrae Herba 4 97.74
Evodiae Fructus 4 96.11
Hoelen 2 95.17
Ligustici Rhizoma 2 96.26
Magnoliae Flos 3 96.45
Nelumbinis Folum 3 98.51
Paeoniae Lactiflorae Radix 4 95.76
Paeoniae Veitchii Radix 2 97.23
Perillae Folium 6 95.31
Pinelliae Tuber 4 97.77
Platycodi Radix 4 97.39
Polyporus 5 97.54
Puerariae Radix 2 95.82
Rhei Rhizoma 4 95.01
Salivae Miltiorrhizae Radix 4 97.64
Saposhinkoviae Radix 2 95.01
Scutellariae Radix 3 96.87
Zingiberis Siccatum Rhizoma 3 96.79
j o u r n a l o f f o o d and d ru g an a l y s i s 2 1 ( 2 0 1 3 ) 2 6 8e2 7 8 275
purpose of this experiment design was to test the stability of
the SIMCA modelsdthat is, whether different herbal medi-
cines could be recognized by using different combinations of
herbs on which the SIMCA models were built. The results
showed that the herbs could be identified rapidly and accu-
rately by the SIMCA models built on the different herb
combinations.
3.2. Step 2. Results of one extended group for thepractical application
Table 3 also shows the results for the Group 2 SIMCA model,
an extendedmodel built on the larger sample calibration set of
subgroup G based on 30 different herbs (600 samples in the
subgroup G calibration set). For the experimental design,
subgroup G included all of the samples from Group 1 sub-
groups A, B, C, and D, but none of the samples in subgroup E
and only 10 of the 30 samples in subgroup F. There was no
sample overlap between Group 2 subgroups G and H.
The subgroup-G SIMCA model correctly identified 99.5% of
the 600 subgroup G calibration set samples and 99% of the 300
subgroup G validation set samples as positive matches, and
correctly identified all subgroup H samples (540 samples
spanning 18 herb varieties) as nonmatches, to subgroup G.
Examining the samples by their Group 1 organization, the
extended subgroup-G SIMCA model correctly identified the
match or nonmatch status of 100%, 98%, and 100%, of the
samples in subgroups A, C, and E, respectively, and 98.67%,
100%, and 99.33% of the samples in subgroups B, D, and F,
respectively.
There were three misidentified samples in the calibration
set of subgroup G: Hoelen and Paeoniae Lactiflorae Radix from
subgroup C, and Puerariae Radix from subgroup B. The se-
lection of the number of principal components to use in
modeling each medicinal herb was a crucial step in SIMCA
model development. Too many principal components can
cause overfitting, whereas too few principal components
will inadequately describe the spectral characteristics of
any given group. In Group 2, 30 medicines were selected
Fig. 4 e The distribution of Hotelling’s T2 and Q residual
values for the 10 sample herbs in subgroup A, according to
the sub-PCA model calculated for sample A01.
PCA [ principal component analysis.
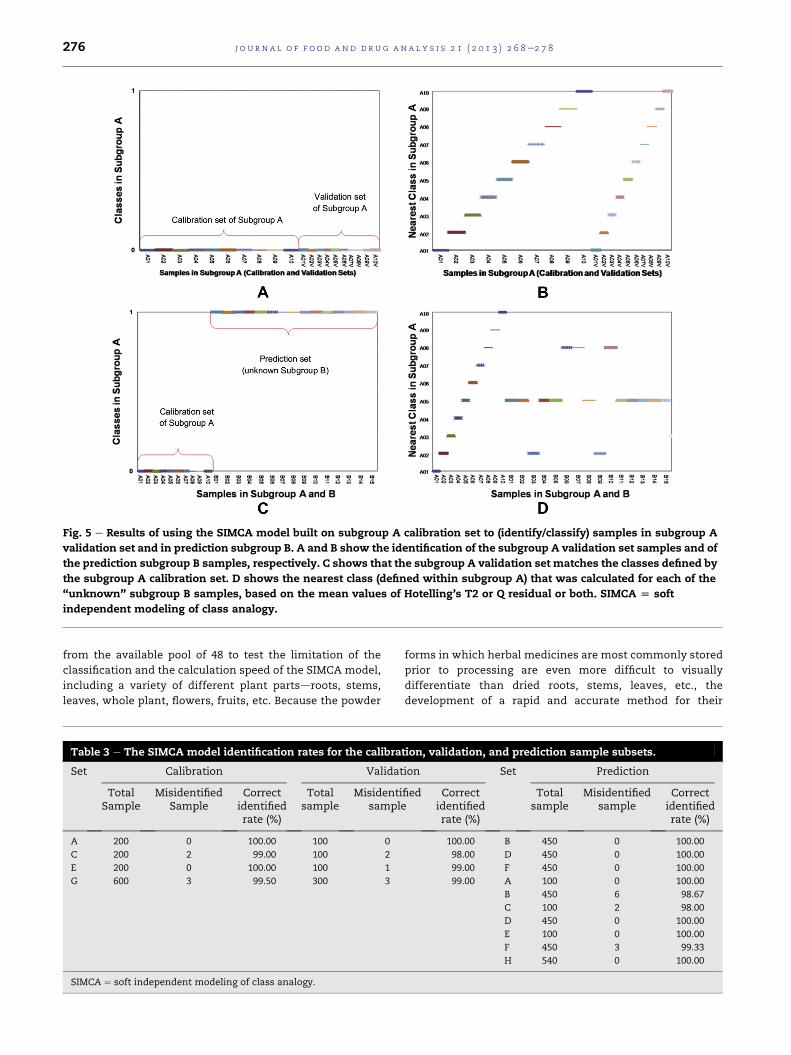
Fig. 5 e Results of using the SIMCA model built on subgroup A calibration set to (identify/classify) samples in subgroup A
validation set and in prediction subgroup B. A and B show the identification of the subgroup A validation set samples and of
the prediction subgroup B samples, respectively. C shows that the subgroup A validation set matches the classes defined by
the subgroup A calibration set. D shows the nearest class (defined within subgroup A) that was calculated for each of the
“unknown” subgroup B samples, based on the mean values of Hotelling’s T2 or Q residual or both. SIMCA [ soft
independent modeling of class analogy.
j o u rn a l o f f o o d a nd d r u g an a l y s i s 2 1 ( 2 0 1 3 ) 2 6 8e2 7 8276
from the available pool of 48 to test the limitation of the
classification and the calculation speed of the SIMCA model,
including a variety of different plant partsdroots, stems,
leaves, whole plant, flowers, fruits, etc. Because the powder
Table 3 e The SIMCA model identification rates for the calibra
Set Calibration Validat
TotalSample
MisidentifiedSample
Correctidentifiedrate (%)
Totalsample
Misidentisampl
A 200 0 100.00 100 0
C 200 2 99.00 100 2
E 200 0 100.00 100 1
G 600 3 99.50 300 3
SIMCA ¼ soft independent modeling of class analogy.
forms in which herbal medicines are most commonly stored
prior to processing are even more difficult to visually
differentiate than dried roots, stems, leaves, etc., the
development of a rapid and accurate method for their
tion, validation, and prediction sample subsets.
ion Set Prediction
fiede
Correctidentifiedrate (%)
Totalsample
Misidentifiedsample
Correctidentifiedrate (%)
100.00 B 450 0 100.00
98.00 D 450 0 100.00
99.00 F 450 0 100.00
99.00 A 100 0 100.00
B 450 6 98.67
C 100 2 98.00
D 450 0 100.00
E 100 0 100.00
F 450 3 99.33
H 540 0 100.00
j o u r n a l o f f o o d and d ru g an a l y s i s 2 1 ( 2 0 1 3 ) 2 6 8e2 7 8 277
classification and identification is becoming an increasingly
important and urgent need.
3.3. Comparisons and discussions
Using Hotelling’s T2 and Q residual values, this SIMCAmethod
effectively identified herbal matches and nonmatches relative
to the herbs in the database. For the herbs identified as non-
matches (outside of the database), Hotelling’s T2 and Q resid-
ual values could still be useful for general classification in
terms of resemblance to database members. Our previous
study [16] described the effective classification of medicinal
herbs implemented by using an ANN method; however, this
ANN method needed longer calculation times that were not
practical for online inspection applications. As the numbers of
samples and herbal varieties increased, both the ANN calcu-
lation loading and required calculation times increased
significantly. By contrast, the SIMCAmethod described in this
study can be used to classify or identify medicinal herbs with
greater flexibility in accommodating larger numbers of sam-
ple types and with shorter calculation times when compared
to the ANN model.
The SIMCA method can be applied to identify medicinal
herb samples that fall outside of those defined within the
database, and find the nearest class in the database that
shows any resemblance to nonmatching samples. This
method can also be applied to other materials in the food and
pharmaceutical industries. In theory, raw foodmaterials prior
to processing can be inspected using near-infrared spectros-
copy with SIMCA to detect abnormal agents (e.g., plasticizers)
that would be detected as being outside of the current data-
base of regular materials that should be found in the pro-
cessing operations. This inspection method could be
developed as a rapid and powerful tool for the early detection
of adulterants or contaminants in raw materials.
4. Conclusions
The method provided a flexible modeling database for the
control of raw materials when processing Chinese medicinal
herbs. Hotelling’s T2 and Q residuals are useful indicators in
the SIMCA models for evaluating differences between the
samples. The use of near-infrared spectroscopy integrated
with SIMCA can be developed into an accurate and high-
performance industrial method for online inspection
applications.
Acknowledgments
The authors appreciate the support from Sun Ten Pharma-
ceutical Co., Ltd. (New Taipei City, Taiwan), which provided all
the medicinal herbs used in this study, and from FOSS NIR-
Systems, Inc. (Silver Spring, MD, USA), which supplied the
Model 6500 NIR reflectance spectrometer configured with a
rapid content analyzer (RCA)module.We also thankMs Diane
E. Chan in the Agricultural Research Service, BARC, United
States Department of Agriculture, for the proofreading and
providing comments.
r e f e r e n c e s
[1] Liu C, Tseng A, Yang S. Chinese herbal medicine: modernapplications of traditional formulas. Boca Raton, FL: CRCPress; 2005.
[2] Chuang CC, Su CH, Huang WY, et al. Classification of FangchiRadix samples by multivariate analysis. J Food Drug Anal2008;16:48e56.
[3] Gong F, Liang YZ, Xie PS, et al. Information theory applied tochromatographic fingerprint of herbal medicine for qualitycontrol. J Chromatogr A 2003;1002:25e40.
[4] Simonvska B, Vovk I, Andernsek S, et al. Investigation ofphenolic acids in yacon (Smallanthus sonchifolius) leaves andtubers. J Chromatogr A 2003;1016:89e98.
[5] Yang JJ, Long H, Liu HW, et al. Analysis of terandrine offangchinoline in traditional Chinese medicines by capillaryelectrophoresis. J Chromatogr A 1998;811:274e9.
[6] Kondo N. Machine vision based on optical properties ofbiomaterials for fruit grading system. Environ Control Biol2006;44:151e9.
[7] Woo YA, Kim HJ, Ze KR, et al. Near-infrared (NIR)spectroscopy for the non-destructive and fast determinationof geographical origin of Angelicae gigantis Radix.J Pharmaceut Biomed Anal 2005;36:955e9.
[8] Cai L, Wang Q, Gu C, et al. Vascular and micro-environmental influences on MSC-coral hydroxyapatiteconstruct-based bone tissue engineering. Biomaterials2011;32:8497e505.
[9] Mukhopadhyay SC, Gupta GS, Woolley JD, et al. Saxophonereed inspection employing planar electromagnetic sensors.IEEE Trans Instrum Meas 2007;56:2492e503.
[10] Reich G. Near-infrared spectroscopy and imaging: basicprinciples and pharmaceutical applications. Adv Drug DelivRev 2005;57:1109e43.
[11] Zou HB, Yang GS, Qin ZR, et al. Progress in quality control ofherbal medicine with IR fingerprint spectra. Anal Lett2005;38:1457e75.
[12] Williams P, Norris K. Near-infrared technology in theagricultural and food industries. St. Paul, MN, USA: AmericanAssociation of Cereal Chemists; 1987.
[13] Watson C. Near infrared reflectance spectrophotometricanalysis of agricultural products. Anal Chem1977;49:835e40.
[14] Murray I, Williams P. Chemical principles of near-infraredtechnology; 1987.
[15] Grift T, Zhang Q, Kondo N, et al. A review of automation androbotics for the bioindustry. J Biomechatron Eng2008;1:37e54.
[16] Yang CW, Chen S, Ouyang F, et al. A robust identificationmodel for herbal medicine using near infrared spectroscopyand artificial neural network. J Food Drug Anal2011;19:9e17.
[17] Sun S-Q, Zhou Q, Chen J-B. Infrared spectroscopy forcomplex mixtures. Applications in food and traditionalChinese medicine. Beijing, China: Chemistry Industry Press;2011.
[18] Wold S. Pattern recognition by means of disjoint principalcomponents models. Pattern Recogn 1976;8:127e39.
[19] Branden KV, Hubert M. Robust classification in highdimensions based on the SIMCA method. Chemometr IntellLab 2005;79:10e21.
[20] Wold S, Esbensen K, Geladi P. Principal component analysis.Chemometr Intell Lab 1987;2:37e52.

j o u rn a l o f f o o d a nd d r u g an a l y s i s 2 1 ( 2 0 1 3 ) 2 6 8e2 7 8278
[21] Dunn III WJ, Wold S. An assessment of the carcinogenicity ofN-nitroso compounds by the SIMCA method of patternrecognition. J Chem Inf Comp Sci 1981;21:8e13.
[22] Barnes R, Dhanoa M, Lister SJ. Standard normal variatetransformation and de-trending of near-infrared diffusereflectance spectra. Appl Spectrosc 1989;43:772e7.
[23] Kennard RW, Stone LA. Computer aided design ofexperiments. Technometrics 1969;11:137e48.
[24] Chen Q, Kruger U, Meronk M, et al. Synthesis of T2 and Qstatistics for process monitoring. Control Eng Pract2004;12:745e55.