integration of membrane filtration and photolysis ... thesis sandra... · a crescer não só...
TRANSCRIPT

Sandra Sanches
Dissertation presented to obtain the Ph.D degree in
Engineering and Technology Sciences, Chemical Engineering
Instituto de Tecnologia Química e Biológica | Universidade Nova de Lisboa
Oeiras,
December, 2013
Insert here an image
with rounded corners
Integration of Membrane Filtration and Photolysis
Processes for Drinking Water Treatment
Sandra Marisa Lourenço Sanches
Dissertation presented to obtain
Engineering and Technology Sciences
Integration of Membrane
and Photolysis Processes for
Drinking Water Treatment
Engineering and Technology SciencesInstituto de Tecnologia Química e Biológica | Universidade Nova de Lisboa
Oeiras, December 2013
Sandra Marisa Lourenço Sanches
obtain the Ph.D degree in
Sciences, Chemical Engineering
Membrane Filtration
Processes for
Treatment
Sciences, Chemical EngineeringInstituto de Tecnologia Química e Biológica | Universidade Nova de Lisboa
ii
ITQB-UNL and IBET, Microbiology of Man-made Environments Laboratory Instituto de Tecnologia Química e Biológica, Universidade Nova de Lisboa and Instituto de Biologia Experimental e Tecnológica Apartado 12, 2781-901 Oeiras, Portugal Fax: +351 21 442 11 61; Phone: +351 21 446 95 52 http://www.itqb.unl.pt http://www.ibet.pt
Copyright © 2013 by Sandra Sanches All Rights Reserved Printed in Portugal

iii
SUPERVISORS
Prof. João Crespo:Full Professor at the Chemistry Department of FCT-UNL
(supervisor).
Dr. Vanessa Pereira: Post-doctoral researcher at the Microbiology of Man-Made
Environments Laboratory, IBET and ITQB-UNL (co-supervisor).
Dr. Teresa Crespo: Researcher and Head of the Microbiology of Man-Made
Environments Laboratory of IBET and ITQB-UNL and Director of the Analytical Services
Unit of IBET and ITQB-UNL (co-supervisor).

iv

v
Aos meus pais

vi

vii
ACKNOWLEDGEMENTS
O trabalho conducente à elaboração desta tese teve o apoio financeiro da Fundação
para a Ciência e Tecnologia (FCT) e do FSE no âmbito do quadro Comunitário de
apoio, BD nº 72244/2010. O trabalho desenvolvido teve também o apoio do IBET e
ITQB-UNL.
Muitos são aqueles a quem quero expressar a minha gratidão por me terem
encorajado e ajudado, contribuindo para a concretização desta etapa.
À Doutora Vanessa Pereira, minha orientadora, agradeço por me ter guiado ao longo
de vários anos e por todo o conhecimento e rigor científico que me transmitiu.
Vanessa, amiga, “irmã”, muito obrigada por estares sempre disponível para me ouvir
e “aturar” os meus desânimos face aos resultados menos bons ou aos altos e baixos
da vida. Obrigada por teres estado sempre lá, mesmo que fosse à distância de um
“click”, por teres sempre uma palavra de conforto e por me mostrares sempre os dois
lados da “moeda”. O teu bom senso, generosidade com todos os que te rodeiam e
rigor em tudo o que fazes caracterizam-te e inspiraram-me durante o meu percurso.
Guardo com carinho os teus conselhos e os momentos de cumplicidade!
Ao Professor João, meu orientador, agradeço também por me ter guiado numa
viagem repleta de valiosas discussões científicas que tantas vezes me fizeram olhar
para os vários assuntos de uma outra perspetiva. Foi um privilégio poder beneficiar da
sua experiência e quantidade incrível de conhecimentos que tem para transmitir.
Obrigada pelo apoio, confiança e por me fazer acreditar que sou capaz, ajudando-me
a crescer não só profissionalmente mas também pessoalmente. Foi um prazer fazer
esta viagem consigo!
À Doutora Teresa Crespo, minha orientadora, agradeço todo o carinho com que me
recebeu no seu laboratório, mesmo para trabalhar com instalações grandes e
viii
ruidosas que não são habituais num laboratório de microbiologia. Obrigada pelos seus
“inputs”, pela sua boa disposição e por tornar o seu laboratório num local onde nos
sentimos em casa e gostamos de trabalhar. O meu muito obrigada também por tornar
os meus fins de tarde, a caminho de casa, mais animados com conversas banais sobre
cultura, viagens, política e tantas histórias tão bem humoradas que são autênticas
lições de vida. Vou guardar esses momentos de descontração comigo!
Aos meus colegas da Microbiologia, especialmente aqueles que estiveram lá desde o
primeiro dia e que ainda lá se encontram: Filipa e Paula. Também àqueles que já
partiram em busca de novas aventuras Rusa, Marta, Bárbara, Catarina e Joana
Galinha e àqueles que se juntaram mais tarde: Dulce, Beatriz e Joana Lamego.
Muito obrigada pelo vosso companheirismo e momentos de descontração! Gilda,
minha companheira de “gym”, obrigada também pelas conversas bem-humoradas na
passadeira do “holmicos” e pelos momentos de cumplicidade e descontração nas
aulas de zumba.
À Cláudia Galinha, agradeço todo o empenho em transmitir-me os seus
conhecimentos em modelação e as muitas e valiosas discussões nesta área.
À Paula Chicau e à Cristina Leitão, agradeço o apoio técnico, a disponibilidade sempre
demonstrada para ajudar-me e o companheirismo. Agradeço também a colaboração
da Doutora Paula Passarinho, da Doutora Clarisse Nunes e do Doutor Frederico
Ferreira. Ao Engenheiro Vitor Cardoso, Ana Penetra, Alexandre Rodrigues, Engenheira
Maria João Benoliel e Doutora Elisabete Ferreira, da Empresa Portuguesa das Águas
Livres, quero expressar a minha sincera gratidão pela excelente colaboração,
essencial para a concretização desta tese.
À Doutora Maria João Rosa e à Doutora Cristina Almeida, agradeço as frutíferas
discussões científicas.

ix
Ao Doutor Sebastien Logette e à sua equipa da Veolia Environnement Recherche &
Innovation, Maisons Laffitte, France, agradeço por me terem recebido e ensinado
técnicas e metodologias que contribuíram para o alargamento dos meus
conhecimentos e por me permitirem contactar diretamente com problemas reais.
Aos meus amigos, agradeço toda a amizade. O vosso apoio, mesmo que por vezes à
distância, foi muito importante! Um obrigado especial à Inês Oliveira e à Inês Veiga.
Inês Veiga, a tua amizade ficará para sempre associada à minha tese, através da
bonita fotografia gentilmente cedida para a capa.
À minha família, quero agradecer todo o apoio. Um obrigado muito especial àqueles
que me acolheram em Paris durante o meu estágio na Veolia; o vosso apoio e carinho
foram fundamentais e fizeram-me sentir realmente em casa!
Aos meus pais, dedico esta tese. Obrigada por estarem presentes em todos os
momentos da minha vida e por me apoiarem incondicionalmente. Vocês são o meu
exemplo de integridade, humildade, dedicação e trabalho. Mostram-me todos os dias
que nada se faz sem esforço e que é sempre possível fazer mais, mesmo quando as
forças nos querem abandonar e pensamos que já não somos capazes de prosseguir. O
orgulho que vejo nos vossos olhos é aquilo que me motiva a continuar e a querer
fazer sempre mais e melhor. É um orgulho ser vossa filha!

x

xi
ABSTRACT
Water is a fundamental resource for life. The presence of hazardous micropollutants
such as pesticides and hormones in drinking water sources as well as the evidence of
their presence in several treated waters raised concerns regarding the quality of the
water intended for human consumption. The development of new technologies which
are able to cope with these micropollutants and ensure the fulfillment of future more
stringent regulations is therefore needed. Low pressure ultraviolet direct and indirect
photolysis (using hydrogen peroxide and titanium dioxide) and nanofiltration are
extremely promising technologies to effectively remove organic micropollutants from
water. Nevertheless, there are some challenges related with their application:
namely, the formation of photolysis by-products and the need to remove titanium
dioxide particles downstream from the photocatalysis process, as well as the
development of membrane fouling and formation of a concentrated retentate during
nanofiltration.
In this study, the potential of either low pressure ultraviolet direct photolysis,
titanium dioxide photocatalysis or nanofiltration to remove several pesticides
(atrazine, isoproturon, diuron, alachlor, pentachloropnenol, and chlorfenvinphos) and
hormones (17-estradiol, 17-ethinylestradiol, estrone, estriol, and progesterone)
from drinking water sources was evaluated. A configuration that combines ultraviolet
photolysis and nanofiltration technologies in sequence was assembled to tackle the
aforementioned challenges and produce high quality drinking water in terms of these
micropollutants, selected due to their persistence, different structures and physico-
chemical properties, bioaccumulation potential, and toxicity.
Low pressure ultraviolet direct photolysis demonstrated high potential towards the
degradation of all the pesticides addressed except isoproturon as well as the
hormones progesterone and estrone. Similar degradations were obtained for the

xii
target compounds when assessed individually or as mixtures. Titanium dioxide
photocatalysis was able to improve significantly the degradation attained by direct
photolysis for the hormones 17-estradiol, 17-ethinylestradiol, and estriol while
noteworthy differences were not observed for the other compounds. The main
kinetic parameters of the degradation of the target pesticides were determined and
applied to predict their degradation under different experimental conditions, allowing
further optimisation of the process. The applied model predicted well direct
photolysis while overestimating titanium dioxide photocatalysis efficiency.
Ultrafiltered groundwater and surface water were used to address the potential of
nanofiltration to treat waters with different compositions and understand the impact
of ionic species and natural organic matter, without the interference of particulate
and large colloidal organic matter. Using the flat-sheet Desal 5DK membrane,
nanofiltration showed high effectiveness towards the removal of the target pesticides
and hormones, often independently of the water composition. Similar results were
also generally attained during the experiments carried out with pre-adsorption of the
compounds on the membrane, suggesting that the removal of the target
micropollutants may not be considerably changed after long term operation in water
utilities. Even though results suggested that size exclusion and hydrophobic
interactions were important rejection mechanisms, multivariate statistical analysis
was further conducted to better elucidate the synergies and concurrent effects that
impact rejection and adsorption. Multilinear projection to latent structure models
with good descriptive capability were developed. Alkalinity, molecular size
descriptors, molecular weight, molar volume, and the logarithm of the octanol-water
distribution ratio were found to be the most relevant contributors for the rejection of
the selected micropollutants, showing the impact of size exclusion and electrostatic
interactions. Molecular geometry was found to be very important to determine
rejection, when molecules have very different geometry.
xiii
When the sequential treatment of titanium dioxide followed by nanofiltration was
conducted, the catalyst was completely adsorbed on the membrane, limiting further
assessment. However, a combined treatment consisting of direct low pressure
ultraviolet photolysis followed by nanofiltration was able to efficiently remove the
target pesticides and hormones from surface water collected after the sedimentation
process, with removal higher than 85.1% throughout a six hour treatment.
Remarkable decreases in the endocrine disrupting activity were also attained in the
treated water for the mixture of pesticides (64.4-93.8%) and hormones (95.4-99.6%)
throughout the treatment. Generally, photolysis by-products generated with higher
endocrine disrupting activity than the parent compounds were successfully retained
by the membrane. Furthermore, the concentration of the selected micropollutants in
the retentate was highly decreased, reducing the need to further treat/dispose the
retentate and lowering the respective costs. Fouling was not significantly observed
during the treatment. The combined treatment thus demonstrated the potential to
tackle the challenges associated with the individual application of the UV and
nanofiltration processes.
The work presented in this thesis provides important knowledge that may be further
applied to improve the design and operation of drinking water treatment systems.

xiv

xv
RESUMO
A água é fundamental para a vida. A presença de micropoluentes, tais como
pesticidas e hormonas, em águas superficiais e águas destinada ao consumo humano
constitui um problema. Torna-se, por isso, necessário o desenvolvimento de novas
tecnologias de tratamento capazes de remover estes compostos da água e assegurar
o cumprimento de futuras legislações mais rígidas do que as atuais. A fotólise direta e
indireta (usando peróxido de hidrogénio e dióxido de titânio) promovida por radiação
ultravioleta de baixa pressão, assim como a nanofiltração, são tecnologias
promissoras para a remoção efetiva de micropoluentes orgânicos da água. No
entanto, a aplicação destas tecnologias enfrenta alguns desafios: a formação de
subprodutos da fotólise, a necessidade de remover as partículas de dióxido de titânio
após fotocatálise, a ocorrência de colmatação de membranas durante a nanofiltração
e a formação de um retentado de nanofiltração muito concentrado.
Na presente tese, os processos de fotólise direta de baixa pressão, fotocatálise com
dióxido de titânio e nanofiltração são avaliados individualmente em termos do seu
potencial para remover vários pesticidas (atrazina, isoproturão, diurão, alacloro,
pentaclorofenol e clorofenvinfos) e hormonas (17-estradiol, 17-etinilestradiol,
estrona, estriol e progesterona) de águas superficiais. Estes pesticidas e hormonas
foram selecionados neste estudo devido à sua persistência, diferentes estruturas e
propriedades físico-químicas, potencial de bioacumulação e elevada toxicidade. A
combinação sequencial de fotólise/fotocatálise com dióxido de titânio e nanofiltração
foi depois avaliada em termos da sua capacidade de superar os desafios referidos
acima e produzir água com boa qualidade.
A fotólise direta de baixa pressão demonstrou elevado potencial para degradar todos
os pesticidas selecionados, exceto o isoproturão, assim como as hormonas estrona e
progesterona. As degradações obtidas para os compostos fortificados
xvi
individualmente ou sob a forma de misturas foram bastante semelhantes. Apesar da
fotocatálise com dióxido de titânio ter melhorado significativamente a degradação
das hormonas 17-estradiol, 17-etinilestradiol e estriol, obtida por fotólise direta,
não foram observadas diferenças significativas para os restantes compostos. Este
estudo permitiu a determinação de parâmetros cinéticos relacionados com a
degradação dos pesticidas alvo, que foram posteriormente usados para prever a sua
degradação em diferentes condições experimentais, permitindo a otimização do
processo. O modelo matemático usado permitiu prever os resultados experimentais
obtidos por fotólise direta, embora sobrestime a eficiência da fotocatálise com
dióxido de titânio.
A membrana Desal 5DK foi usada para testar a eficiência da nanofiltração para tratar
águas com diferentes composições, tais como água subterrânea e água superficial
ultrafiltradas. O impacto de espécies iónicas e da matéria orgânica foram por isso
estudados, sem a interferência de matéria particulada e matéria orgânica coloidal de
grandes dimensões. O processo de nanofiltração demonstrou elevada eficiência para
remover os pesticidas e as hormonas selecionados, de forma geralmente
independente da composição da água. A semelhança dos resultados obtidos nas
experiências realizadas, com e sem pré-adsorção dos compostos à membrana, sugeriu
que a remoção destes micropoluentes não deverá ser significativamente alterada
após longa operação em estações de tratamento de água. Apesar dos resultados
experimentais obtidos sugerirem que a exclusão molecular e as interações
hidrofóbicas são importantes mecanismos de rejeição destes compostos, uma análise
estatística multivariada foi também realizada para elucidar as sinergias e efeitos
concorrentes que influenciam a sua rejeição e adsorção à membrana. Modelos
multilineares, via projeção de estruturas latentes, com boa capacidade descritiva
foram desenvolvidos. De acordo com os modelos obtidos, os parâmetros mais
relevantes para descrever a rejeição são os seguintes: alcalinidade, descritores de

xvii
tamanho molecular, peso molecular, volume molar e o logaritmo do coeficiente de
distribuição octanol-água. A importância destes parâmetros evidencia o impacto de
mecanismos de exclusão molecular e interações eletrostáticas, demonstrando que a
geometria molecular tem um papel muito importante na rejeição.
O catalisador dióxido de titânio foi completamente adsorvido na membrana quando o
processo que integra a fotocatálise, seguido de nanofiltração, foi testado, não sendo
possível avaliar a eficiência deste processo. No entanto, o processo que integra a
fotólise direta com a nanofiltração demonstrou ser extremamente eficiente para
remover os pesticidas e as hormonas alvo de água superficial, recolhida após o
processo de sedimentação numa estação de tratamento. As remoções obtidas
durante 6 horas de tratamento foram superiores a 85.1%. A atividade de disrupção
endócrina da água tratada ao longo do tempo também foi consideravelmente
reduzida relativamente à água não tratada, fortificada com uma mistura dos
pesticidas (64.4%-93.8%) ou uma mistura das hormonas (95.4-99.6%). Os sub-
produtos da fotólise gerados durante o tratamento foram retidos pela membrana. A
concentração dos micropoluentes alvo no retentado foi também consideravelmente
reduzida, atenuando a necessidade de efetuar um tratamento posterior e reduzindo
os respetivos custos. A colmatação da membrana durante o tratamento não foi
significativa. Estes resultados demonstram que o tratamento integrado permite
ultrapassar as limitações associadas à aplicação individual dos processos de fotólise e
nanofiltração.
Os estudos realizados no âmbito desta tese fornecem conhecimentos importantes
que podem ser aplicados para otimizar as operações dos sistemas de tratamento de
águas destinadas ao consumo humano.

xviii

xix
THESIS PUBLICATIONS
Sanches S, Barreto Crespo MT, Pereira VJ (2010) Drinking water treatment of priority
pesticides using low pressure UV photolysis and advanced oxidation processes. Water
Res 44(6): 1809-1818.
Sanches S, Penetra A, Rodrigues A, Ferreira E, Cardoso VV, Benoliel MJ, Barreto
Crespo MT, Pereira VJ, Crespo JG (2012) Nanofiltration of hormones and pesticides in
different real drinking water sources. Sep Purif Technol 94: 44-53.
Sanches S, Galinha CF, Barreto Crespo MT, Pereira VJ, Crespo JG (2013) Assessment of
phenomena underlying the removal of micropollutants during water treatment by
nanofiltration using a multivariate statistical analysis. Sep Purif Technol 118: 377-386.
Sanches S, Penetra A, Rodrigues A, Cardoso VV, Ferreira E, Benoliel MJ, Barreto
Crespo MT, Crespo JG, Pereira VJ (2013) Removal of pesticides from water combining
low pressure UV photolysis with nanofiltration. Sep Purif Technol 115: 73-82.
Sanches S, Rodrigues A, Cardoso VV, Ferreira E, Benoliel MJ, Barreto Crespo MT,
Crespo JG, Pereira VJ (2013) Combination of UV photolysis and nanofiltration to
overcome their drawbacks and remove endocrine disrupting compounds from a
drinking water source. Re-submitted after revision to Desalination.

xx
LIST OF ABBREVIATIONS
Absorbance A Adsorption ACN Acetonitrile ALA Alachlor Alk Alkalinity AOPs Advanced oxidation processes ATR Atrazine ByP By-product Cf Concentration of a given compound in the feed CFVP Chlorfenvinphos Cp Concentration of a given compound in the permeate CPRG Chlorophenol red--D-galactopyranoside Cr Concentration of a given compound in the retentate DBPs Disinfection by-products DC Direct current DIU Diuron DOC Dissolved organic carbon Dyn ads Mass pre-adsorbed under dynamic conditions EC50 Concentration of a given compound that induces 50% of the
maximum response EDCs Endocrine disrupting compounds EEQ Estradiol equivalents
p Incident photon irradiance
EPAL Empresa Portuguesa das Águas Livres ERE Estrogen response elements exp Experimental FL Fluorescence GC Gas chromatography GW Groundwater H2O2 Hydrogen peroxide hER Human estrogen receptor HPLC High performance liquid chromatography
h Radiant energy
ind Individual ISO Isoproturon k’d Pseudo-first order direct photolysis rate constant k’f Fluence-based pseudo-first order photolysis rate constant k’i Pseudo-first order indirect photolysis rate constant

xxi
kO O
Pseudo-first-order rate of reaction of hydroxyl radicals with carbonate ions
kO O Pseudo-first-order rate of reaction of hydroxyl radicals with dissolved organic carbon
kO O Pseudo-first-order rate of reaction of hydroxyl radicals with
hydrogen peroxide kO O
Pseudo-first-order rate of reaction of hydroxyl radicals with bicarbonate ions
kO Second-order rate constant for reaction of hydroxyl radicals with micropollutants
kO p Pseudo-first-order rate of reaction of hydroxyl radicals with para-chlorobenzoic acid
Ks Specific rate of light absorption by a given compound k’t Time-based pseudo-first order photolysis rate constant LGW Laboratory grade water log D Logarithm of the octanol-water distribution ratio at pH 7.4 log Kow Logarithm of octanol-water partition coefficient LP Low pressure Md Molecular depth MeOH Methanol MF Microfiltration mix Mixture Ml Molecular length MP Medium pressure MQ Milli-Q water MRM Multiple reaction monitoring MS Mass spectrometry MW Molecular weight MWCO Molecular weight cut-off Mwd Molecular width m/z Mass to charge ratio na Not available nd Not determined NF Nanofiltration NOM Natural organic matter •OH Hydroxyl radicals [•OH]ss Steady-state concentration of hydroxyl radicals P Polarisability PAHs Polycyclic aromatic hydrocarbons pCBA para-Chlorobenzoic acid

xxii
PCP Pentachlorophenol pKa Inverse of the logarithm of the acid dissociation constant PLS Projection to latent structures Qf Feed flow rate Qp Permeate flow rate R2 Determination coefficient Rapp Apparent rejection RMSECV Root mean square error of cross-validation RMSEP Root mean square error of prediction RO Reverse osmosis S Scavengers SPE Solid phase extraction Stat ads Mass pre-adsorbed under static conditions SW Surface water t Time T Temperature tfilt Time of filtration TiO2 Titanium dioxide TOC Total organic carbon TOTCO3 Total carbonate UF Ultrafiltration UPLC Ultra performance liquid chromatography US EPA United States Environmental Protection Agency UV Ultraviolet Vf Volume of feed Vfilt Filtered volume Vm Molar volume Vp Volume of permeate Vr Volume of retentate Ws Water solubility YES Yeast estrogen screen assay z Distance to the UV source α1, α2 Distribution coefficients of the carbonate species
Decadic molar absorption coefficient
Quantum yield
Wavelength
em Emission wavelength
ex Excitation wavelength
Dipole moment

xxiii
TABLE OF CONTENTS
Chapter 1 – Introduction: state-of-the-art and motivation ............................................ 1
Chapter 2 – Drinking water treatment of pesticides using low pressure UV photolysis and advanced oxidation processes ........................................................... 51
Chapter 3 – Nanofiltration of hormones and pesticides in different real drinking water sources ...................................................................................................... 77
Chapter 4 – Assessment of phenomena underlying the removal of micropollutants during water treatment by nanofiltration using multivariate statistical analysis ................................................................................................... 117
Chapter 5 – Removal of pesticides and hormones from water combining low presure UV photolysis with nanofiltration ......................................................... 149
Chapter 6 – Discussion and future work ..................................................................... 189
Appendices ................................................................................................................ 203
xxiv
LIST OF TABLES
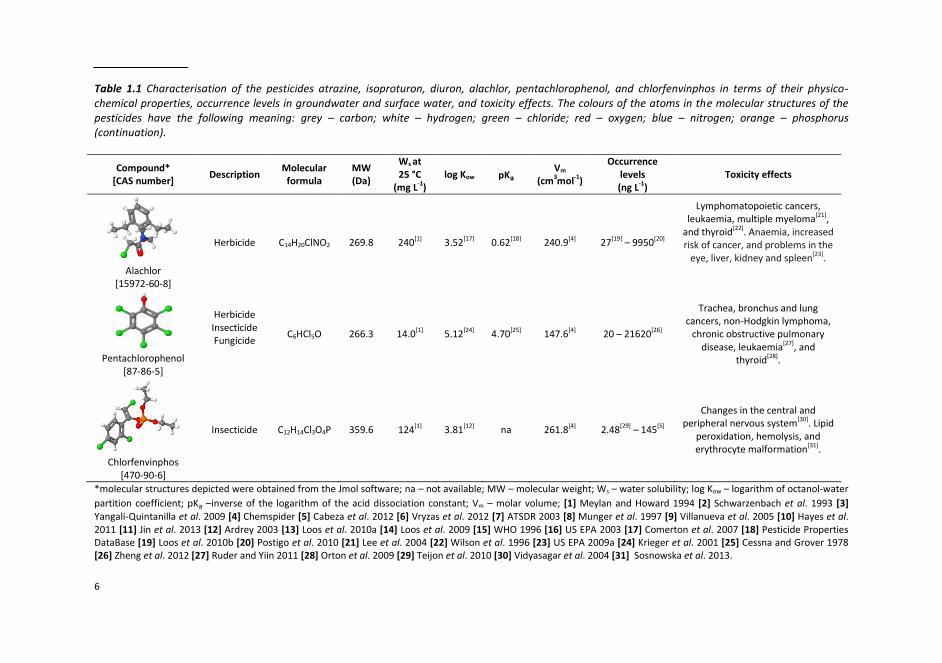
Table 1.1 Characterisation of the pesticides atrazine, isoproturon, diuron, alachlor, pentachlorophenol, and chlorfenvinphos in terms of their physico-chemical properties, occurrence levels in groundwater and surface water, and toxicity effects. The colours of the atoms in the molecular structures of the pesticides have the following meaning: grey – carbon; white – hydrogen; green – chloride; red – oxygen; blue – nitrogen; orange – phosphorus.........................................................................5-6
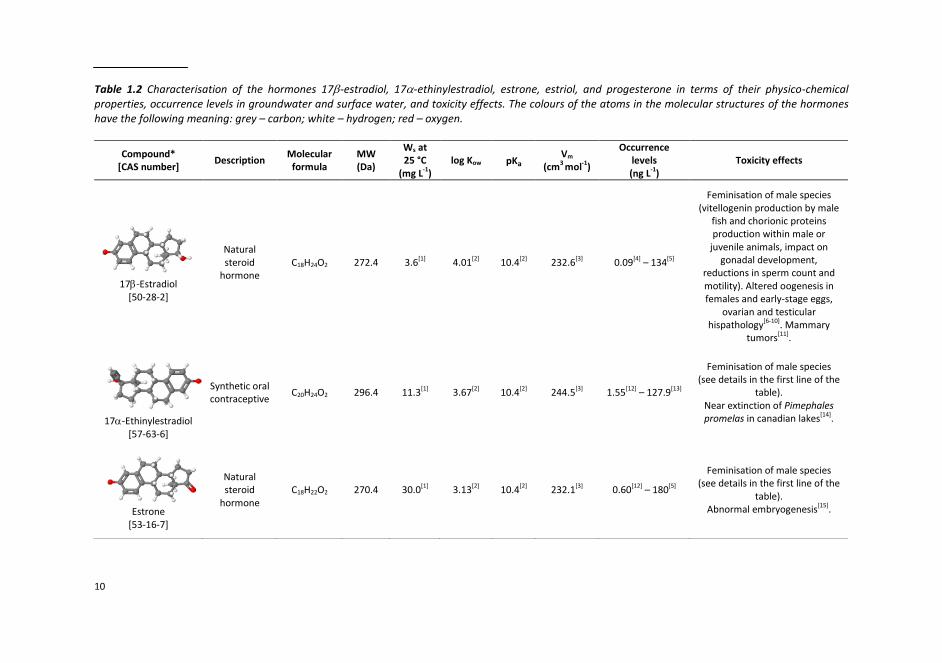
Table 1.2 Characterisation of the hormones 17-estradiol, 17-ethinylestradiol, estrone, estriol, and progesterone in terms of their physico-chemical properties, occurrence levels in groundwater and surface water, and toxicity effects. The colours of the atoms in the molecular structures of the hormones have the following meaning: grey – carbon; white – hydrogen; red – oxygen......................................10-11
Table 2.1 Fluence-based direct photolysis (LP/UV) and AOPs (LP/UV/H2O2 and LP/UV/TiO2) rate constants (k’f) obtained for atrazine (ATR), isoproturon (ISO), diuron (DIU), alachlor (ALA), pentachlorophenol (PCP), and chlorfenvinphos (CFVP) in different water matrices: laboratory grade water (LGW), surface water (SW) and groundwater (GW) as individual compounds (ind) and mixtures (mix); standard errors are given in parenthesis and modelled results are given in square brackets...............64
Table 2.2 Decadic molar absorption coefficient (quantum yield ( and second-order rate constants for reaction of the micropollutants with OH radicals (kOH,M) for the selected pesticides; literature values are given in square brackets (Acero et al. 2008, Song et al. 2008, Wong and Chu 2003b, Benitez et al. 2003, Benitez et al. 2006, De Laat et al. 1999, Beltran et al. 1993, Haag and Yao 1992).......................................65
Table 3.1 Structure and physico-chemical properties of the selected pesticides and hormones......................................................................................................................95
Table 3.2 Characterisation of groundwater and surface water after ultrafiltration...96
Table 3.3 Adsorption of the selected pesticides and hormones on the membrane during the experiments under static conditions and time (t) needed to achieve saturation of the membrane in the groundwater (GW) and surface water (SW) matrices........................................................................................................................98
xxv
Table 3.4 Percent adsorption of the selected pesticides and hormones on the membrane during nanofiltration under different experimental conditions in terms of membrane saturation: without pre-adsorption of the compounds on the membrane, with static pre- adsorption on the membrane, as well as with both static and dynamic pre-adsorption on the membrane..............................................................................105
Table 3.5 Variation of the composition of the spiked groundwater (GW) and surface water (SW) subject to nanofiltration..........................................................................108
Table 4.1 Description of the selected inputs for model developing…………………………125
Table 4.2 Physico-chemical properties and molecular size parameters of the selected pesticides and hormones………………………………………………………………………………………..126
Table 5.1 Time-based pseudo-first order direct and OP rate constants (k’t) obtained for the selected pesticides and hormones in surface water collected after the sedimentation process and the respective determination coefficients (R2)...............165
Table 5.2 Removal of the selected pesticides and hormones during the integrated treatment without fresh feed solution addition.........................................................173
Table 5.3 Summary results obtained by mass spectra analysis of the major by-products detected - parent compound, major daughter ions, their relative abundance, and proposed fragments.............................................................................................181
Table A.1 HPLC methods used for the detection of the pesticides atrazine (ATR), isoproturon (ISO), diuron (DIU), alachlor (ALA), pentachlorophenol (PCP), and chlorfenvinphos (CFVP) as well as para-chlorobenzoic acid (pCBA) in the direct photolysis and AOPs experiments...............................................................................205
Table A.2 HPLC methods used for the detection of pesticides and hormones in the direct HPLC analysis of samples from pre-adsorption experiments preceding nanofiltration assays...................................................................................................206
Table A.3 HPLC methods used for the detection of the selected pesticides and hormones in the direct HPLC analysis of samples from the LP/UV photolysis experiments as well as feed, retentate, and control samples from nanofiltration and combined treatment experiments..............................................................................207
Table A.4 Monitoring conditions – Multiple Reaction Monitoring (MRM) used in the detection of isoproturon and diuron..........................................................................209

xxvi
Table A.5 Optimised mass spectrometry conditions used for the detection of the target hormones.........................................................................................................211
Table A.6 Characterisation of the source waters used in the UV photolysis experiments described in Chapter 2...........................................................................212
Table A.7 Time-based direct (LP/UV) and indirect (LP/UV/H2O2 and LP/UV/TiO2) photolysis rate constants (k’t) obtained for the selected pesticides in different water matrices: Laboratory grade water (LGW), surface water (SW), and groundwater (GW) as individual compounds (ind) and mixtures (mix); standard errors are given in parenthesis..................................................................................................................213
Table A.8 Rejection and adsorption values used in multivariate statistical analysis................................................................................................................217-218

xxvii
LIST OF FIGURES
Figure 1.1 Proposed configuration integrating UV direct photolysis or TiO2 UV photocatalysis and nanofiltration.................................................................................35
Figure 2.1 Experimental (exp) and model low pressure direct photolysis of atrazine (ATR), isoproturon (ISO), diuron (DIU), alachlor (ALA), pentachlorophenol (PCP), and chlorfenvinphos (CFVP) in (a) surface water and (b) groundwater; experimental values are represented by symbols with error bars whereas the lines show the model results............................................................................................................................63
Figure 2.2 Experimental (exp) and model low pressure photolysis of atrazine (ATR), isoproturon (ISO), diuron (DIU), alachlor (ALA), pentachlorophenol (PCP), and chlorfenvinphos (CFVP) in surface water using (a) 40 mg L-1 hydrogen peroxide (H2O2) and (b) 2.5 mg L-1 titanium dioxide (TiO2); experimental values are represented by symbols with error bars whereas the lines show the model results.............................67
Figure 2.3 Modelled time-based direct photolysis rate constants (k’d)........................69
Figure 2.4 Modelled time-based direct photolysis (k’d) and OPs (k’i) rate constants obtained for isoproturon..............................................................................................70
Figure 2.5 LP/UV, LP/UV/H2O2, and LP/UV/TiO2 percent degradation of atrazine (ATR), isoproturon (ISO), diuron (DIU), alachlor (ALA), chlorfenvinphos (CFVP), and pentachlorophenol (PCP) spiked in surface water as individual compounds and mixtures (Mix) using a UV fluence of 1500 mJ cm-2.....................................................71
Figure 2.6 Alachlor by-product detected by HPLC........................................................72
Figure 3.1 Schematic representation of experimental procedure (---- experiments that were only conducted with the selected hormones).....................................................85
Figure 3.2 Schematic representation of the experimental setup………………………………88
Figure 3.3 Rejection of the selected pesticides (atrazine, alachlor, and pentachlorophenol) in the different nanofiltration experiments – without previous adsorption of the selected organic compounds on the membrane and with pre- adsorption under static conditions – in groundwater (GW) and surface water (SW) matrices (error bars correspond to the uncertainty related to analytical methods).....................................................................................................................102
xxviii
Figure 3.4 Rejection of the selected hormones (17-estradiol, 17-ethinylestradiol, estrone, estriol, and progesterone) in the different nanofiltration experiments – without previous adsorption of the selected organic compounds on the membrane, with pre-adsorption under static conditions, and with pre-adsorption under both static and dynamic conditions – in groundwater (GW) and surface water (SW) matrices (error bars correspond to the uncertainty related to analytical methods).....................................................................................................................102
Figure 3.5 Percent rejection of inorganic components of the natural water matrices during nanofiltration experiments (error bars correspond to minimum and maximum values obtained; error bars are not provided when the rejection of the components leaded to concentrations below detection limits)......................................................109
Figure 4.1 Molecular structures of the selected pesticides and hormones encompassed in a box used for the determination of measurements that reflect size parameters (grey – carbon; white – hydrogen; green – chloride; red – oxygen; blue – nitrogen) obtained from Jmol software………………………………………………………………….127
Figure 4.2 Univariated correlations between rejection and (a) molecular weight, (b) dipole moment, and (c) molar volume as well as (d) between adsorption and log D. Experimental data present in the plots were obtained for nanofiltration of groundwater spiked with the selected micropollutants carried out without pre-adsorption………………………………………………………………………………………………………………131
Figure 4.3 Optimised multilinear models developed by PLS to predict apparent rejection and the respective normalised regression coefficients related to the relevant inputs: model 1 (a and b) was obtained using all observed data without including molecular size parameters; model 2 (c and d) was obtained using all observed data and molecular size parameters; model 3 (e and f) was obtained by excluding observations associated with pentachlorophenol without using molecular size parameters. RMSEP, RMSECV, R2 values, and slopes of training and validation sets are
provided for each model. Alk – alkalinity; MW – molecular weight; – dipole moment; Vm – molar volume; P – polarisability; Vfilt – filtered volume; log D – logarithm of the octanol-water distribution ratio at pH 7.4; C – concentration; Ml – molecular length; Mwd – molecular width; Md – molecular depth; pKa – inverse of the logarithm of the acid dissociation constant; Dyn ads – mass of micropollutants pre-adsorbed under dynamic conditions………………………………………………………………..133-134
xxix
Figure 4.4 Optimised models developed by PLS to predict adsorption and the respective normalised regression coefficients related to the relevant inputs: model 4 (a and b) was obtained without using molecular size parameters; model 5 (c and d) was obtained by incorporating quadratic and interaction terms of the input parameters without using molecular size parameters; model 6 (e and f) was obtained by incorporating quadratic and interaction terms of the input parameters and using molecular size parameters. RMSEP, RMSECV, R2 values, and slopes of training and validation sets are provided for each model. Vfilt – filtered volume; Stat ads – mass of micropollutants pre-adsorbed under static conditions; P – polarisability; Alk – alkalinity; Vm – molar volume; Dyn ads – mass of micropollutants pre-adsorbed under
dynamic conditions; – dipole moment; pKa – inverse of the logarithm of the acid dissociation constant; filtration time (tfilt)...........................................................140-141
Figure 5.1 Schematic representation of the experimental setup...............................157
Figure 5.2 Degradation of the selected (a) pesticides and (b) hormones by LP/UV direct photolysis over a 6-7 h experimental period (duplicate injections are provided as error bars; degradations higher than limits of detection are not represented). Horizontal lines in (a) represent % degradations that correspond to the lowest and
highest limits of detection of the target pesticides (5-50 g L-1); the horizontal line in (b) correspond to the detection limit for the hormones estrone and progesterone (25
g L-1)..........................................................................................................................167
Figure 5.3 Degradation of the selected (a) pesticides and (b) hormones by TiO2
photocatalysis over a 3-4 h experimental period (50 mgL-1 TiO2; duplicate injections are provided as error bars; degradations higher than limits of detection are not represented). Horizontal lines in (a) represent % degradations that correspond to the
lowest and highest limits of detection of the target pesticides (5-50 g L-1); horizontal lines in (b) correspond to the lowest and highest limits of detection of the target
hormones (5-100 g L-1)..............................................................................................168
Figure 5.4 Apparent rejections of the selected (a) pesticides and (b) hormones throughout the nanofiltration assay...........................................................................170
xxx
Figure 5.5 Removal of the selected pesticides from the retentate (a) and variation of the respective Estradiol Equivalents in the permeate and retentate (b); removal of the selected hormones from the retentate (c) and variation of the respective Estradiol Equivalents in the permeate and at the inlet of the membrane module (d) throughout the integrated treatment conducted without fresh feed solution addition in the absence of TiO2 over a 6h experimental period (duplicate experiments are provided as error bars; degradations higher than limits of detection are not represented). Horizontal lines in (a) represent % degradations that correspond to the lowest and
highest limits of detection of the target pesticides (5-50 g L-1); horizontal lines in (c) represent the % degradations that correspond to the lowest and highest detection
limits of the hormones not detected after 1 h of operation (25-100 g L-1)............. 175
Figure 5.6 Removal of the selected pesticides from the retentate (a) and variation of the respective Estradiol Equivalents in the permeate and retentate (b); removal of the selected hormones from the retentate (c) and variation of the respective Estradiol Equivalents in the permeate and at the inlet of the membrane module (d) throughout the integrated treatment conducted with the addition of fresh feed solution in the absence of TiO2 over a 6 h experimental period (duplicate experiments are provided as error bars)...............................................................................................................178
Figure 6.1 Scanning electron microscopy images of the top view (Figures (a) and (b)) and cross section (Figures (c) and (d)) of the TiO2 thin films obtained on the surface of a commercial ceramic membrane by pulsed DC reactive magnetron sputtering. The following sputtering conditions were applied to obtain the film depicted in Figures (a) and (c): distance to the target – 9 cm, immobilisation time – 8 h, current intensity – 0.7 A, pressure – 1.2x10⁻² mbar and argon:oxygen ratio – 2:1. To obtain the film depicted in Figures (b) and (d), the following conditions were applied: distance to the target – 15 cm, immobilisation time – 11.5 h, current intensity – 1 A, pressure – 1.2x10⁻² mbar and argon:oxygen ratio – 2:1...............................................................198
Figure A.1 Mass spectra of major by-products detected....................................220-223
Figure A.2 Relative abundance of isoproturon (ISO) and alachlor (ALA) by-products (ByP) area as a function of operation time.................................................................224

CHAPTER 1
Introduction: state-of-the-art and thesis motivation

2
CONTENTS
1.1 Water availability and quality ........................................................................... 3
1.2 Emerging micropollutants in water ................................................................... 3
1.2.1 Pesticides ............................................................................................................... 4
1.2.2 Endocrine disrupting compounds .......................................................................... 8
1.3 Drinking water treatment: aim and challenges ................................................ 12
1.4 UV based processes ........................................................................................ 14
1.4.1 UV direct photolysis ............................................................................................. 14
1.4.2 Advanced oxidation processes ............................................................................ 15
1.4.2.1 UV combined with hydrogen peroxide ................................................... 16
1.4.2.2 Titanium dioxide heterogeneous photocatalysis ................................... 17
1.4.3 Impact of water composition upon UV photolysis .............................................. 20
1.4.4 Current use and challenges ................................................................................. 21
1.5 Pressure-driven membrane processes ............................................................. 24
1.5.1 Nanofiltration ...................................................................................................... 25
1.5.1.1 Membrane types and module configurations ......................................... 26
1.5.1.2 Selection of Desal 5DK membrane .......................................................... 27
1.5.2 Membrane, solute and water-matrix interactions .............................................. 27
1.5.3 Current use and challenges ................................................................................. 30
1.6 Integration of UV photolysis and nanofiltration: overview of recent
developments ...................................................................................................... 32
1.7 Objectives and thesis outline .......................................................................... 35
References .......................................................................................................... 38

Chapter 1
3
This chapter comprises the state-of-the-art related with the water treatment
technologies addressed in the present thesis - ultraviolet (UV) direct photolysis,
advanced oxidation processes (AOPs), and nanofiltration (NF) - as well as the
motivation for the approach followed and the main objectives of this Thesis.
1.1 WATER AVAILABILITY AND QUALITY
Water covers 70 percent of the earth’s surface. Nevertheless, only approximately 2.5
percent is freshwater, and because most of that water is locked up in ice and glaciers,
only 0.3 percent of the total freshwater is easily accessible in rivers and lakes, which
are the most common sources of drinking water (Oki and Kanae 2006, Shiklomanov
1993).
Moreover, the exponential growth of population has led to an increasing demand of
potable water. Since water is a fundamental resource for life, water availability and
quality (chemical and microbial) are among the main environmental challenges of the
21st century.
1.2 EMERGING MICROPOLLUTANTS IN WATER
The disposal of several chemicals that are used in several industries, agriculture,
medicine, and other activities have raised increasing concern regarding their potential
adverse effects for human health and environment in the last decades. Many organic
compounds such as pesticides, pharmaceutical and personal care products, endocrine
disrupting compounds (EDCs), polychlorinated biphenyls, phthalates, alkylphenols,
and polycyclic aromatic hydrocarbons (PAHs) have been detected in water sources all
4
over the world at ng L-1 to low g L-1 levels (Cabeza et al. 2012, Zheng et al. 2012,
Velicu and Suri 2009, Rao et al. 2013).
Based on their relevance in terms of occurrence levels, hazardous potential as well as
the need to comply with current and potentially more stringent future regulations,
some pesticides and endocrine disrupting compounds with different chemical
structures, properties, and behaviour were selected to be addressed in the studies
carried out in the scope of the present thesis.
1.2.1 Pesticides
The widespread and extensive use of pesticides in agriculture and wood preservation
to control weeds, insects, and plant diseases has led to their presence in several
water sources, mainly through runoffs, spray drift, and drainage (Knauert et al. 2008).
A group of pesticides with different structures and properties was targeted in the
studies described in this thesis that included: atrazine (ATR), isoproturon (ISO), diuron
(DIU), alachlor (ALA), pentachlorophenol (PCP), and chlorfenvinphos (CFVP). Table 1.1
depicts their structures, occurrence concentrations in surface water (SW) and
groundwater (GW), toxicity effects, and specific physico-chemical properties such as
molecular weight (MW), water solubility (Ws), logarithm of octanol-water partition
coefficient (log Kow), inverse of the logarithm of the acid dissociation constant (pKa),
and molar volume (Vm).

Chapter 1
5
Table 1.1 Characterisation of the pesticides atrazine, isoproturon, diuron, alachlor, pentachlorophenol, and chlorfenvinphos in terms of their physico-chemical properties, occurrence levels in groundwater and surface water, and toxicity effects. The colours of the atoms in the molecular structures of the pesticides have the following meaning: grey – carbon; white – hydrogen; green – chloride; red – oxygen; blue – nitrogen; orange – phosphorus.
Compound* [CAS number]
Description Molecular
formula MW (Da)
Ws at 25 °C
(mg L-1) log Kow pKa
Vm (cm3mol-1)
Occurrence levels (ng L-1)
Toxicity effects
Atrazine [1912-24-9]
Herbicide C8H14ClN5 215.7 34.7[1] 2.56[2] 1.70[3] 169.9[4] 2[5] – 5200[6]
Decrease of pituitary hormone levels, ovarian and liver histopathology, effects on nervous immune, and cardiovascular systems[7]. Non-Hodgkin’s lymphoma, preterm
delivery, and intrauterine growth retardation[8,9]. Demasculinisation of
male gonads (reduced germ cell numbers in teleost fish, amphibians,
reptiles, and mammals), partial and/or complete feminisation of fish, amphibians, and reptiles[10]. Changes in the testosterone metabolism[11].
Isoproturon [34123-59-6]
Herbicide C12H18N2O 206.3 14[1] 2.87[12] na 196.3 [4] 7[13] – 1959[14] Hepatocellular tumours,
preneoplastic, and neoplastic lesions[15].
Diuron
[330-54-1]
Herbicide C9H10Cl2N2O 233.1 42[1] 2.68[12] na 170.2[4] 0.27[5] – 864[14]
Hemolytic anaemia and compensatory hematopoiesis. Urinary bladder, kidney, and
mammary gland carcinomas[16].
6
Table 1.1 Characterisation of the pesticides atrazine, isoproturon, diuron, alachlor, pentachlorophenol, and chlorfenvinphos in terms of their physico-chemical properties, occurrence levels in groundwater and surface water, and toxicity effects. The colours of the atoms in the molecular structures of the pesticides have the following meaning: grey – carbon; white – hydrogen; green – chloride; red – oxygen; blue – nitrogen; orange – phosphorus (continuation).
Compound* [CAS number]
Description Molecular
formula MW (Da)
Ws at 25 °C
(mg L-1) log Kow pKa
Vm (cm3mol-1)
Occurrence levels (ng L-1)
Toxicity effects
Alachlor
[15972-60-8]
Herbicide C14H20ClNO2 269.8 240[1] 3.52[17] 0.62[18] 240.9[4] 27[19] – 9950[20]
Lymphomatopoietic cancers, leukaemia, multiple myeloma[21],
and thyroid[22]. Anaemia, increased risk of cancer, and problems in the
eye, liver, kidney and spleen[23].
Pentachlorophenol
[87-86-5]
Herbicide Insecticide Fungicide
C6HCl5O 266.3 14.0[1] 5.12[24] 4.70[25] 147.6[4] 20 – 21620[26]
Trachea, bronchus and lung cancers, non-Hodgkin lymphoma,
chronic obstructive pulmonary disease, leukaemia[27], and
thyroid[28].
Chlorfenvinphos
[470-90-6]
Insecticide C12H14Cl3O4P 359.6 124[1] 3.81[12] na 261.8[4] 2.48[29] – 145[5]
Changes in the central and peripheral nervous system[30]. Lipid
peroxidation, hemolysis, and erythrocyte malformation[31].
*molecular structures depicted were obtained from the Jmol software; na – not available; MW – molecular weight; Ws – water solubility; log Kow – logarithm of octanol-water
partition coefficient; pKa –inverse of the logarithm of the acid dissociation constant; Vm – molar volume; [1] Meylan and Howard 1994 [2] Schwarzenbach et al. 1993 [3] Yangali-Quintanilla et al. 2009 [4] Chemspider [5] Cabeza et al. 2012 [6] Vryzas et al. 2012 [7] ATSDR 2003 [8] Munger et al. 1997 [9] Villanueva et al. 2005 [10] Hayes et al. 2011 [11] Jin et al. 2013 [12] Ardrey 2003 [13] Loos et al. 2010a [14] Loos et al. 2009 [15] WHO 1996 [16] US EPA 2003 [17] Comerton et al. 2007 [18] Pesticide Properties DataBase [19] Loos et al. 2010b [20] Postigo et al. 2010 [21] Lee et al. 2004 [22] Wilson et al. 1996 [23] US EPA 2009a [24] Krieger et al. 2001 [25] Cessna and Grover 1978 [26] Zheng et al. 2012 [27] Ruder and Yiin 2011 [28] Orton et al. 2009 [29] Teijon et al. 2010 [30] Vidyasagar et al. 2004 [31] Sosnowska et al. 2013.

Chapter 1
7
The high water solubility of these compounds and their relatively low log Kow values
(exception of pentachlorophenol) suggest that these compounds are expected to
partition to some extent into the aquatic environment. In fact, these micropollutants
have been found in the surface water and groundwater all over the world at
concentrations up to 21.62 g L-1 (Zheng et al. 2012) (Table 1.1). Based on the toxicity
data available, these levels are able to cause severe diseases. Several pathologies
have been related with the exposure of humans and animals, namely aquatic
organisms, to the aforementioned pesticides: disruption of the endocrine system (e.g.
Hayes et al. 2011), several types of cancer (e.g. Ruder and Yin 2011), as well as liver
pathologies and modifications in the nervous, immune, and cardiovascular system
(e.g. Vidyasagar et al. 2004, ATSDR 2003) (Table 1.1). Due to their occurrence levels,
toxicity, persistence, and bioaccumulation potential, these pesticides were considered
priority by the European Water Framework Directive (Decision 2455/2001/EC). This
classification constituted an alert for the need to reduce and monitor their presence
in drinking water sources and was withdrawn by the amending Directive
2013/39/EU, probably because of their banning or introduction of application
restrictions. Even though atrazine, alachlor, and chlorfenvinphos were banned in the
European Union before 2007 (Decisions 2004/248/EC and 2006/966/EC, Regulation
2076/2002) and pentachlorophenol and diuron face severe restrictions in terms of
application for plant protection (Decisions 2004/248/EC, 2006/966/EC, Regulation
2076/2002), they were still detected in European countries such as Spain and Greece
in 2010-2012 at levels up to 10 g L-1 (Postigo et al. 2010, Vryzas et al. 2012, Cabeza et
al. 2012).
Furthermore, these compounds are still extensively produced and applied in other
countries. As an example, atrazine remains one of the most widely used herbicides in
the United States with application of approximately 76.4 million pounds of active
ingredient each year (US EPA 2012). Even though PCP is considered priority by the
8
United States Environmental Protection Agency (US EPA) and regulatory actions were
introduced in 1984 to restrict certain non wood-preservation applications (US EPA
2008), its production is still noteworthy in USA (Van der Zande 2010). Maximum
contaminant levels in drinking water are established in the US National Primary
Drinking Water Regulations for atrazine, alachlor, and pentachlorophenol (3, 2, and 1
g L-1, respectively). Generally less restrictive guideline values are implemented in
Australia (NHMRC and NRMMC 2011) and Canada (Health Canada 2012) although a
similar maximum acceptable concentration is set for atrazine in Canada (5 g L-1).
There is often a gap between legislation and research since banned micropollutants
are still present in drinking water sources and despite their proven hazardous effects
they are not legislated yet in countries where their occurrences have been reported
as maximum.
1.2.2 Endocrine disrupting compounds
Endocrine disrupting compounds are natural or synthetic compounds with the ability
to interfere with hormone biosynthesis, metabolism, secretion, binding action, and
transport, resulting in a deviation from normal homeostatic control or reproduction,
even at very low exposure levels. Endocrine disruptors include plant products such as
phytoestrogens, pesticides, plasticisers, phenols, and hormones (Diamanti-Kandarakis
et al. 2009).
Hormones constitute the most important group of EDCs due to their extremely high
estrogenic activity. A woman is able to excrete daily approximately 64 g of estriol as
well as 3-20 g and 0.5-5 g of estrone and 17-estradiol, respectively, as revised by
Birkett (2003). Remarkable quantities of progesterone are also excreted by women,
particularly during pregnancy, and 17-ethinylestradiol is one of the most relevant
Chapter 1
9
ingredient compounds of oral contraceptive pills. Since they are not fully assimilated
by humans, hormones are continuously released to the environment mostly via
domestic wastewater effluents either in the original form or partially metabolised.
Conventional wastewater treatment processes are often not completely effective to
remove these anthropogenic compounds from the effluent. Thus, non eliminated
compounds are directly released into the environment (Kolpin et al. 2002, Hecker and
Hollert 2011). Hormones such as 17-estradiol, 17-ethinylestradiol, estrone, estriol,
and progesterone became ubiquitous in the environment and are the major
contributors of the estrogenic activity observed in water sources (Birkett 2003).
Based on their water solubility and hydrophilicity, these hormones are also expected
to partition to some degree in the aquatic environment (Table 1.2). These hormones
present very different structures and physico-chemical properties comparatively with
the aforementioned pesticides and are therefore expected to behave differently
during drinking water treatment.
These hormones have been reported to occur in surface waters and groundwaters in
USA (Velicu and Suri 2009), Europe (Aydin and Talinli 2013, Jardim et al. 2012), and
particularly China (Rao et al. 2013, Zhou et al. 2011), at concentrations up to 180 ng
L-1 (Table 1.2). Despite the lower occurrence levels of these hormones comparatively
with the pesticides aforementioned, hormones are able to induce severe
endocrinologic disorders such as male feminisation (Table 1.2). Purdom et al. (1994)
reported the production of vitellogenin (the precursor of egg yolk proteins expressed
in females for embryos development) by male trout due to exposure to 17-
ethinylestradiol at doses as low as 0.1 ng L-1 during 10 days. Furthermore, a 7-year
research in a canadian lake demonstrated that chronic exposure of fathead minnow
(Pimephales promelas) to 5-6 ng L-1 of 17-ethinylestradiol led to feminisation of
males and near extinction of this specie (Kidd et al. 2007).
10
Table 1.2 Characterisation of the hormones 17-estradiol, 17-ethinylestradiol, estrone, estriol, and progesterone in terms of their physico-chemical properties, occurrence levels in groundwater and surface water, and toxicity effects. The colours of the atoms in the molecular structures of the hormones have the following meaning: grey – carbon; white – hydrogen; red – oxygen.
Compound* [CAS number]
Description Molecular
formula MW (Da)
Ws at 25 °C
(mg L-1) log Kow pKa
Vm (cm3 mol-1)
Occurrence levels (ng L-1)
Toxicity effects
17-Estradiol [50-28-2]
Natural steroid
hormone C18H24O2 272.4 3.6[1] 4.01[2] 10.4[2] 232.6[3] 0.09[4] – 134[5]
Feminisation of male species (vitellogenin production by male
fish and chorionic proteins production within male or
juvenile animals, impact on gonadal development,
reductions in sperm count and motility). Altered oogenesis in females and early-stage eggs,
ovarian and testicular hispathology[6-10]. Mammary
tumors[11].
17-Ethinylestradiol
[57-63-6]
Synthetic oral contraceptive
C20H24O2 296.4 11.3[1] 3.67[2] 10.4[2] 244.5[3] 1.55[12] – 127.9[13]
Feminisation of male species (see details in the first line of the
table). Near extinction of Pimephales promelas in canadian lakes[14].
Estrone
[53-16-7]
Natural steroid
hormone C18H22O2 270.4 30.0[1] 3.13[2] 10.4[2] 232.1[3] 0.60[12] – 180[5]
Feminisation of male species (see details in the first line of the
table). Abnormal embryogenesis[15].

Chapter 1
11
Table 1.2 Characterisation of the hormones 17-estradiol, 17-ethinylestradiol, estrone, estriol, and progesterone in terms of their physico-chemical properties, occurrence levels in groundwater and surface water, and toxicity effects. The colours of the atoms in the molecular structures of the hormones have the following meaning: white – hydrogen; grey – carbon; red – oxygen (continuation).
*molecular structures depicted were obtained from the Jmol software; **no dissociation; MW – molecular weight; Ws – water solubility; log Kow – logarithm of octanol-water
partition coefficient; pKa –inverse of the logarithm of the acid dissociation constant; Vm – molar volume; [1] Meylan and Howard 1994 [2] Snyder et al. 2007 [3] Chemspider
[4] Velicu and Suri 2009 [5] Zhou et al. 2011 [6] Harries et al. 1997 [7] Jobling et al. 1998 [8] Desbrow et al. 1998 [9] Vajda et al. 2008 [10] Vajda et al. 2011 [11] Turan et al. 2004 [12] Rao et al. 2013 [13] Sun et al. 2009 [14] Kidd et al. 2007 [15] Saito et al. 2012 [16] Chang et al. 2008 [17] Nickenig et al. 2000.
Compound* [CAS number]
Description Molecular formula
MW (Da)
Ws at 25 °C
(mg-1 L) log Kow pKa
Vm (cm3 mol-1)
Occurrence levels (ng L-1)
Toxicity effects
Estriol
[50-27-1]
Natural steroid
hormone C18H24O3 288.4 441[1] 2.45[2] 10.4[2] 229.6[3] 0.33[4] – 94[5]
Feminisation of male species[10].
Progesterone
[57-83-0]
Natural steroid
hormone C21H30O2 314.5 8.8[1] 3.87[2] ** 288.9[3] 0.07[16] - 11.81[4]
Incidence of postmenopausal cardiovascular
diseases[17].

12
Recently, a directive amending Directives 2000/60/EC and 2008/105/EC has been
submitted that recommends the inclusion of 17-estradiol and 17-ethinylestradiol in
the list of priority substances (European Commission 2012). 17-estradiol, 17-
ethinylestradiol, estrone, and estriol are included in the US EPA Contaminant
Candidate List 3, which comprises compounds that are suspected to require
regulation under the Safe Drinking Water Act (US EPA 2009b).
1.3 DRINKING WATER TREATMENT: AIM AND CHALLENGES
The main goal of drinking water suppliers is to provide water with high microbial and
chemical quality. Conventional surface water treatment often includes coagulation,
flocculation, sedimentation, filtration, and final disinfection (chlorination or
chloramination). Disinfection is sometimes sufficient to obtain drinking water from
groundwater. Although chloramination is also applied, chlorine is the disinfectant
most widely used. Disinfection by-products (DBPs), that are produced during
chlorination, have been detected in several distribution systems (e.g. Wlodyka-Bergier
and Bergier 2011, Jeong et al. 2012) and have been related to different types of
cancer (Costet et al. 2011, Rahman et al. 2010) and adverse reproductive outcomes
(Grellier et al. 2010).
As revised by Brunkard et al. (2011), several outbreaks related with the presence of
bacteria (e.g. Legionella, Salmonella, Campylobacter), viruses (norovirus, hepatitis A
virus), and protozoa (Giardia intestinalis, Cryptosporidium) have been registered due
to failures of sand filtration units, sedimentation contact units and chlorination during
drinkng water treatment. In 1993, a serious outbreak was caused by Cryptosporidium
oocysts that passed through the sand filtration system and were not properly
inactivated by chlorination in one of the plants that supplyed the city of Milwaukee,

Chapter 1
13
USA. Up to 400,000 cases of serious illness and 100 deaths were registered (Gerba
2000a).
Several pesticides and hormones, namely atrazine (McInnis 2010, Rodriguez-Mozaz et
al. 2004), pentachlorophenol (McInnis 2010), and estriol (Kuster et al. 2008) have also
been detected in treated water from drinking water utilities applying conventional
treatment processes. The monitoring of the presence of several compounds in
Canadian municipal treated drinking water from 1986 to 2006 revealed the presence
of several contaminants; atrazine was the most frequently detected pesticide in
treated surface water, largely exceeding the legal limits (McInnis 2010).
The development of alternative technologies that enable the efficient removal of both
microorganisms and chemicals is therefore required. Moreover, such technologies
should allow water utilities to comply with current and future more stringent
regulations.
The need to comply with more stringent US regulations regarding drinking water
quality led to a shift towards the implementation of UV disinfection, as alternative or
in combination with chlorine, due to its proven higher inactivation potential towards
bacteria and protozoa relatively to chlorination (Shin et al. 2009, Le Goff et al. 2010).
Another advantage of using UV radiation is the decrease of the chlorine doses needed
to achieve final disinfection and the consequent reduction in the production of DBPs.
Moreover, many organic compounds may be photochemically degraded by UV direct
photolysis and advanced oxidation processes (e.g. Wu and Linden 2008, Shemer and
Linden 2007a, Pereira et al. 2007a, Marotta et al. 2013, De la Cruz et al. 2013). UV
radiation may, thus, be suitable to considerably improve both microbial and chemical
quality of drinking water.
Good microbial and chemical quality of the water is also likely to be achieved by
pressure-driven-membrane processes, as alternative to commonly rapid sand

14
filtration, that will act as an effective barrier to organic compounds (e.g. Yangali-
Quintanilla et al. 2009, Verliefde et al. 2009, Salvaterra et al. 2011) and natural
organic matter (NOM) (Salvaterra et al. 2011) as well by constituting an extra barrier
for bacteria and viruses (Patterson et al. 2012).
1.4 UV BASED PROCESSES
1.4.1 UV direct photolysis
UV direct photolysis is a process that leads to the degradation of organic compounds
through the application of radiation at the ultraviolet range (200-400 nm). Molecules
in its ground state can absorb a quantum of light energy or photon and transit to a
higher-energy state. Such molecules are therefore much more reactive and can
undergo different reactions than more stable molecules, following different reaction
pathways (Kopecký 1992). These reactions lead to the degradation of molecules that
ultimately result in their mineralisation, with the formation of carbon dioxide, water,
and inorganic ions.
A wide range of UV lamps may be applied to degrade organic compounds.
Nevertheless, a lamp that may simultaneously achieve good microbial inactivation
and micropollutants degradation is ideal. Low pressure (LP) and medium pressure
(MP) UV mercury lamps are conventional UV sources applied for water disinfection
due to their germicidal effect. MP lamps emit radiation at 200 – 500 nm while LP
lamps emit predominantly radiation at 254 nm. Although the use of both LP and MP
lamps is already well implemented in some drinking water utilities for disinfection, by-
product formation and energy demand as well as operating costs are typically lower
for LP lamps (IJpelaar et al. 2007). Even though UV fluences typically applied for
disinfection vary between 40 and 200 mJ cm-2 (Wu and Linden 2008), to achieve

Chapter 1
15
degradation of micropollutants higher UV fluences need to be used. Despite its high
efficiency for disinfection the use of UV radiation for the degradation of organic
compounds should be further tested and optimised.
LP lamps have demonstrated effectiveness towards several micropollutants such as
the pharmaceuticals clofibric acid, iohexol (Pereira et al. 2007b), phenazone, and
phenytoin (Yuan et al. 2009) or the PAHs anthracene and benzo(a)pyrene (Sanches et
al. 2011a). Nevertheless, several compounds do not have the capacity to absorb
photons at 254 nm. As an example, only 6% of dibenzothiophene and dibenzofuran as
well as 15% of fluorine spiked in phosphate buffer solutions were removed by a LP
lamp at a UV fluence of 1000 mJ cm-2 (Shemer and Linden 2007b). Photolysis of
carbamazepine by a LP lamp above 5% was also not observed in another study, even
when a UV fluence of 1700 mJ cm-2 was applied (Pereira et al. 2007b).
1.4.2 Advanced oxidation processes
Advanced oxidation processes combine UV radiation with oxidants or semi-
conductors (heterogeneous photocatalysis) and rely on the formation of highly
reactive, unselective, and short-lived hydroxyl radicals (•OH) (Schwarzenbach et al.
1993). These radicals initiate sequential reactions that result in partial or total
degradation of organic micropollutants. For some compounds, chemical oxidation
processes involved in AOPs have been reported to enhance degradation rates
obtained by direct photolysis (Pereira et al. 2007b, Pereira et al. 2012, Rosenfeldt et
al. 2007) and/or improve their mineralisation levels (De la Cruz et al. 2013).
Hydrogen peroxide (H2O2) and ozone have become the most popular oxidants while
the most common semiconductors are zinc oxide, cadmium sulphide, and titanium
dioxide (TiO2) (Konstantinou et al. 2001).

16
1.4.2.1 UV combined with hydrogen peroxide
During UV/H2O2 oxidation, degradation of micropollutants takes place through the
reaction of organic micropollutants with hydroxyl radicals that are generated by the
reaction between H2O2 and UV photons with certain radiant energy (h). This
mechanism is described in general by the following equations:
OHO 2 hνH 22
productsbyantmicropolluOH t
At very high concentrations, hydrogen peroxide also acts as an hydroxyl radical
scavenger producing a much less reactive hydroperoxyl radical, •HO2, leading to the
production of water (H2O) and oxygen (O2) as illustrated by Equations 1.3 and 1.4 (Wu
and Linden 2008).
OHHOOHO 22 H 22
222 OOHOHHO
LP/UV/H2O2 has been described for the degradation of several micropollutants.
Removals of 90% were attained for estriol, octilphenol, and progesterone in a surface
water employing a UV fluence of 1500 mJ cm-2 and 100 mg L-1 of H2O2 while less than
20% removal was achieved by direct photolysis for estriol and octilphenol (Pereira et
al. 2012). In other studies, the degradation of the pesticides parathion (Wu and
Linden 2008) and metaldehyde (Autin et al. 2012) in synthetic waters by this AOP was
also noteworthy using LP and MP lamps. Hindered effects, attributed to the presence
of H2O2, were, however, observed during the degradation of fluorene, dibenzofuran,
and dibenzothiophene in a natural water (Shemer and Linden 2007a).
(1.1)
(1.2)
(1.3)
(1.4)
Chapter 1
17
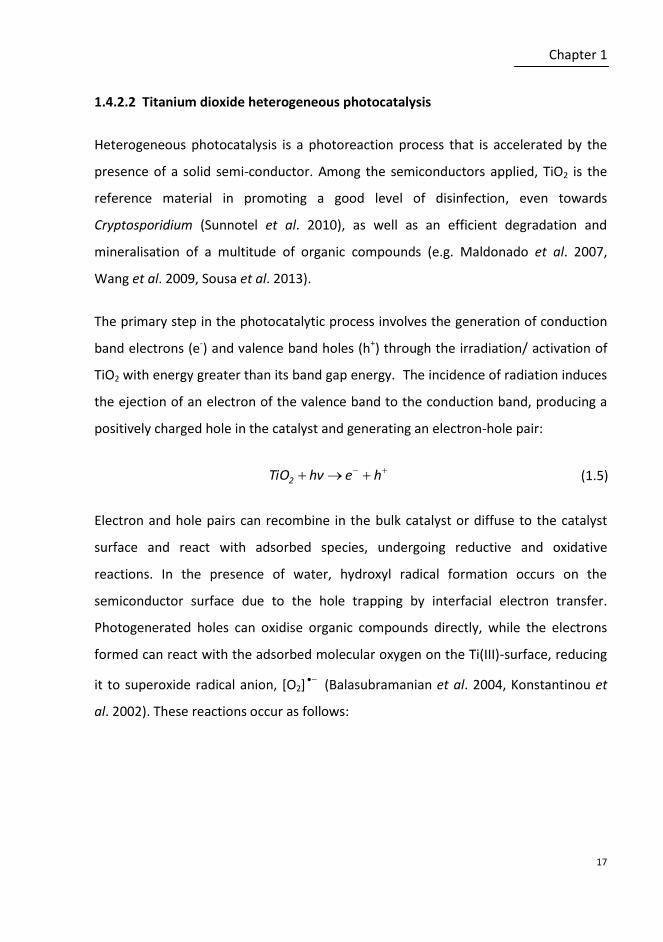
1.4.2.2 Titanium dioxide heterogeneous photocatalysis
Heterogeneous photocatalysis is a photoreaction process that is accelerated by the
presence of a solid semi-conductor. Among the semiconductors applied, TiO2 is the
reference material in promoting a good level of disinfection, even towards
Cryptosporidium (Sunnotel et al. 2010), as well as an efficient degradation and
mineralisation of a multitude of organic compounds (e.g. Maldonado et al. 2007,
Wang et al. 2009, Sousa et al. 2013).
The primary step in the photocatalytic process involves the generation of conduction
band electrons (e-) and valence band holes (h+) through the irradiation/ activation of
TiO2 with energy greater than its band gap energy. The incidence of radiation induces
the ejection of an electron of the valence band to the conduction band, producing a
positively charged hole in the catalyst and generating an electron-hole pair:
hehνTiO2
Electron and hole pairs can recombine in the bulk catalyst or diffuse to the catalyst
surface and react with adsorbed species, undergoing reductive and oxidative
reactions. In the presence of water, hydroxyl radical formation occurs on the
semiconductor surface due to the hole trapping by interfacial electron transfer.
Photogenerated holes can oxidise organic compounds directly, while the electrons
formed can react with the adsorbed molecular oxygen on the Ti(III)-surface, reducing
it to superoxide radical anion, [O2] (Balasubramanian et al. 2004, Konstantinou et
al. 2002). These reactions occur as follows:
(1.5)

18
][OeO 22
OHHOOH][O 222
][HOeHO 22
OHOHOH][OH 2222
OHhOH
Since OH radicals are generated on the semiconductor surface, photocatalysis is a
surface-dependent process. Oxidation may also occur via other oxygen-containing
radicals formed in reactions between the positive holes and hydroxyl groups or water
adsorbed at the catalyst surface. Hydroxyl radical attack and hole oxidation have been
shown to be the primary oxidants responsible for the heterogeneous TiO2
photodecomposition of organic substrates (Balasubramanian et al. 2004,
Konstantinou et al. 2002).
Anatase, rutile and brokite are the three polymorph TiO2 phases that can be
synthesised and applied as pure phases or as mixtures. Photocatalytic activity has
been demonstrated for the three phases. Due to the difficulty of synthesising pure
brookite (it is usually a minority phase along with rutile and/or anatase depending on
experimental conditions), anatase and rutile are the TiO2 polymorphs more commonly
addressed (Addamo et al. 2006). Anatase and rutile present energy band gaps of 3.2
and 3.0 eV, respectively (Balasubramanian et al. 2004). Anatase is generally regarded
as the most photochemically active phase of titania, presumably due to the combined
effect of lower rates of recombination (related with its greater rate of hole trapping)
and higher surface adsorptive capacity towards organic compounds. Mixed-phase
titania exhibit higher photocatalytic activity than anatase or rutile alone due to three
(1.6)
(1.7)
(1.8)
(1.9)
(1.10)

Chapter 1
19
factors: (1) the smaller band gap of rutile extends the useful range of photoactivity
into the visible region; (2) the stabilisation of charge separation by electron transfer
from rutile to anatase slows recombination; (3) the small size of the rutile crystallites
facilitates this transfer, generating catalytic hot spots at the rutile/anatase interface
(Hurum et al. 2003). Different commercial formulations of TiO2 are available. The
photoactivity of Degussa® P25 TiO2 was found to be higher than that of Hombikat UV
100 TiO2 for the treatment of alkylbenzene sulfonate (Mehrvar and Venhuis 2005).
Wong and Chu (2003) also reported an almost duplication of alachlor degradation
using Degussa® P25 comparatively to anatase TiO2 from BDH under 300 nm
irradiation due to the larger surface area available in Degussa® P25. Degussa® P25,
consisting of 70% anatase and 30% rutile with an average particle size of 20-30 nm,
and a BET surface area of 50 ± 15 m2 g-1 is therefore the most widely used
photocatalyst (Alhakimi et al. 2003).
It has been demonstrated that the pesticides and hormones selected for the study
described in this thesis as well as other organic compounds can be treated by
heterogeneous photocatalysis. Efficient degradations using 200 mg L-1 of suspended
Degussa® P25 were attained in a solar pilot plant: atrazine completely disappeared in
less than 1hour while complete mineralisation of alachlor and chlorfenvinphos was
attained within 240 and 320 min, respectively (Maldonado et al. 2007).
Photomineralisation of diuron in less than 45 min was also achieved using Degussa®
P25 TiO2 when an UV lamp with a maximum of light emission at 365 nm was
employed although no degradation was attained by direct photolysis (El Madani et al.
2006). 81% of propanolol was degraded after 240 min of irradiation in a solar plant
while only 30% mineralisation was reached using 0.4 g L-1 of TiO2 (De la Cruz et al.
2013). Total organic carbon (TOC) and bisphenol A were also highly removed
(removals of 95 and 97%, respectively) after 6 hours of LP/UV irradiation using
20
immobilised TiO2 (Wang et al. 2009). LP/UV radiation is much more effective to
achieve disinfection and degradation of some chemical compounds than solar.
Few studies have been conducted to date that address the potential of LP/UV lamps
towards TiO2 photocatalysis of the selected pesticides and hormones. Furthermore,
results are often provided as function of the time needed to achieve certain
degradation instead of UV fluence, which makes the comparison between data
obtained using different experimental setups impossible (Bolton and Linden 2003).
The use of TiO2 is already well-established for a number of technological applications:
indoor and outdoor self-cleaning materials (tiles, lamps, windows, and spray coatings)
and air cleaners, self-sterilising hospital uniforms, and cancer therapy (Fujishima et al.
2000). It presents several advantages relatively to other semiconductors related to its
chemical and biological inertness over a wide range of pH, photostability, absence of
toxicity, recyclability, and low cost (Doll and Frimmel 2005). Another advantage of
using this catalyst is the possibility of its application either as powder dispersion or
immobilised. Furthermore, several light sources including low pressure UV lamps may
be used since TiO2 is catalytically active at wavelengths lower than 380 nm (Wong and
Chu 2003).
1.4.3 Impact of water composition upon UV photolysis
Natural organic matter may accelerate photodegration through the stimulation of the
production of hydroxyl radicals. Its presence may also hinder photodegradation,
particularly the degradation of more hydrophobic compounds, due to the
competition between NOM and organic compounds for radiation absorption (Sanches
et al. 2011a, Xia et al. 2009, Fasnacht and Blough 2002).
Chapter 1
21
Chloride ions were found to accelerate the photodegradation rates of phenicols using
UV–visible radiation due to the formation of singlet oxygen (Ge et al. 2009). The
presence of nitrate has been also reported to increase photodegradation rates of
compounds such as phenanthrene (Jacobs et al. 2008) or atrazine (Sharpless et al.
2003) due to its ability to form hydroxyl radicals. These radicals may also react with
scavengers such as bicarbonate, carbonate, and dissolved organic carbon (Buxton et
al. 1988, Larson and Zepp 1988), reducing photolysis efficiency. Nevertheless, the
impact of these components depends on the overall water composition (e.g. Ge et al.
2009, Jacobs et al. 2008, Ge et al. 2010) as well the water components ability to
absorb radiation at a certain wavelength range (Zepp et al. 1987).
UV photolysis studies have been mainly carried out in pure or synthetic waters.
Nevertheless, the efficiency of these processes may be accurately predicted only if
representative natural water matrices are addressed, creating conditions as close as
possible to those found in water utilities. Further studies using representative natural
waters are therefore needed.
1.4.4 Current use and challenges
UV disinfection became a well established technology in the last decades in several
USA water treatment plants that supply water to very populated cities such as Seattle,
Washington, and New York. UV disinfection has gained acceptance worldwide and it is
also already implemented in some European countries (US EPA 2006). In Portugal, UV
disinfection has been applied in combination with chlorination by Empresa
Portuguesa das Águas Livres (EPAL) to treat spring water from Olhos de Água (EPAL
2010).

22
A study published some years ago by the (US EPA 1996) estimated an average overall
disinfection cost of 0.39-1.09 US$ m-3 during water treatment, based on data
provided by three disinfection manufacturers for a UV dose of 40 mWs cm-2. More
recent data regarding UV costs are not publicly available. Even so, advances in the UV
technology are providing lower cost, more efficient lamps, as well as more reliable
equipment which has contributed to its widespread application (Gerba 2000b).
While widely used for disinfection, the use of UV for degradation of organic
contaminants is still not common practice. Nevertheless, a UV/H2O2 oxidation process
has been in operation since 2004 in a large drinking water treatment plant in Andijk,
The Netherlands, for both primary disinfection and organic contaminants control. An
UV fluence of 540 mJ cm-2 and a H2O2 concentration of 6 mg L-1 are applied in this
utility where removals of atrazine around 80% are achieved (Baeza 2008). Large scale
application of suspended TiO2 photocatalytic treatment is constrained by technical
challenges mainly related with the effective recovery of the catalyst particles in a
continuous process. The release of nanoparticles to the environment, which is
presently a topic of discussion for implementation of legislation, must be avoided
since toxicological effects have recently been associated with their presence in the
environment (Wang et al. 2013, Battin et al. 2009). A subsequent separation step is
therefore needed such as filtration, centrifugation or coagulation/flocculation (Van
der Bruggen et al. 2008).
Even though UV direct and indirect photolysis are extremely promising treatment
processes, further work is needed to define the best operating conditions to achieve
removal of different contaminants due to the higher UV fluences needed, the impact
of the matrix composition in the process performance, and the possible formation of
by-products.

Chapter 1
23
The formation of by-products, that may be even more toxic than the parent
compounds, has been previously observed during the photodegradation of
carbamazepine (Donner et al. 2013) and sulfamethoxazole (Trovo et al. 2009). The
ecotoxicity of transformation products is of major importance when assessing the
suitability of water treatment options. Although UV by-products formed during the
photolysis of several micropollutants have been identified, there is currently lack of
information regarding their toxicity (Donner et al. 2013, Escher and Fenner 2011).
Several toxicity bioassays employing model organisms such as Vibrio fischeri,
Salmonella typhimorium or Daphnia magna have been applied (Escher and Fenner
2011). Although only applicable to determine the toxicity related with endocrine
disrupting compounds, a simpler and reliable bioassay - yeast estrogen screen (YES)
assay - has been developed by Routledge and Sumpter (1996). This methodology has
been successfully employed to evaluate the estrogenicity associated with many
compounds such as estrogens, nonylphenol (Stanford and Weinberg 2010), bisphenol
A, hydrocortisone, dieldrin, atrazine or methoxychlor (Bistan et al. 2012) when
present in wastewater streams.
YES relies on the use of a human estrogen receptor (hER) transfected Saccharomyces
cerevisiae that was developed to identify compounds that can interact with the
human estrogen receptor (Routledge and Sumpter 1996). In this assay, the human
estrogen receptor gene, which is integrated into the main genome, is expressed in a
form capable of binding to estrogen response elements (ERE) within a hybrid
promoter on an expression plasmid containing the reporter gene Lac-Z. The activation
of hER, by binding of the estrogenic compound, leads to the expression of the
reporter gene Lac-Z that encodes the enzyme -galactosidase. When this enzyme is
secreted into the medium, it is able to metabolise the chromogenic substrate
chlorophenol red--D-galactopyranoside (CPRG), which is followed by a change of
colour that is measurable by spectrophotometry (Routledge and Sumpter 1996).
24
1.5 PRESSURE-DRIVEN MEMBRANE PROCESSES
Membrane filtration has gained particular attention for the removal of a broad
spectrum of contaminants from water and wastewater since the 1990’s despite the
demonstration of their potential since early 1960s. The growing interest in the use of
membrane technology for water and wastewater treatment can be explained by the
increasing demand for high quality water, the introduction of more stringent
regulations, and the increasing interest in wastewater reuse (Van der Bruggen et al.
2008). The extended application of membrane technology was also motivated by the
improvement of membrane materials and the development of membranes with
enhanced chemical, thermal and mechanical properties or better permeability and
selectivity, as well as the decrease of operation costs, namely membrane price due to
enhanced use. Furthermore, membrane technologies present several advantages
over conventional processes: do not involve the addition of chemical additives,
usually present reduced plant footprint, and may be easily upscaled and retrofit to an
existing facility or combined with other treatment processes (US EPA 2005, Fane et al.
2011).
Pressure-driven membrane processes are classified as reverse osmosis (RO),
nanofiltration, ultrafiltration (UF), and microfiltration (MF), depending on the
molecular weight cut-off (MWCO) of the respective membranes as well as
transmembrane pressure. RO is commonly used for desalination of sea and brackish
waters due to its ability to remove species with diameter as small as 0.1 nm like
hydrated ions and molecules with low molecular weight. Nanofiltration is an
intermeadiate process between RO and UF that is able to reject molecules with a size
in the order of one nanometer. Ultrafiltration is characterised by the removal of
molecules that have a molecular weight higher than approximately 2x10³ Da.
Microfiltration membranes have the highest MWCO, allowing the removal of
macromolecules with size above 0.1 m (Bergman 2007, Eriksson 1988).

Chapter 1
25
1.5.1 Nanofiltration
Nanofiltration is commonly applied for water softening operations due to its ability to
remove multivalent ions such as magnesium and calcium. Van der Bruggen et al.
(2001) reported extremely high rejections of hardness, up to 95%, using the NF
membranes NF70, NF45, UTC-20, and UTC-60. In another study, rejections higher
than 90% were attained for sulphate, calcium, and magnesium using the membrane
UTC-20 (Schaep et al. 1998). NF membranes are also able to remove a wide range of
microorganisms such as bacteria and viruses (e.g. Patterson et al. 2012). Very high
removals from pure water were also obtained for the pesticides atrazine (97.5%),
simazine (96.7%), malathion (99.64%), and chlorpyrifos (>99.95%), using a NTR-729HF
nanofiltration membrane (Kiso et al. 2000). Likewise, several pharmaceuticals such as
naproxen, ibuprofen, and carbamazepine were very efficiently removed at levels
higher than 98% by a NF-90 membrane (Yangali-Quintanilla et al. 2009). Removals
from surface water as high as 94%, using a NF-90 membrane, have been reported for
NOM, a precursor of DBPs (Salvaterra et al. 2011). Removals of NOM between 72 and
94% have been also attained using synthetic waters with different ionic compositions
and different thin film composite membranes (Schäfer et al. 2004). Nanofiltration is
also suitable for the removal of low molecular weight organic compounds, as low as
200 Da, and is therefore expected to remove the pesticides and hormones presented
in Tables 1.1 and 1.2.
Although the removal of these chemicals and microorganisms may also be achieved
by reverse osmosis, the more compact structure with lower “free volume” of RO
membranes requires the application of higher pressures to ensure high permeability.
Furthermore, addition of essential salts of drinking water such as sodium and chloride
is necessary after RO treatment to ensure ionic water balance since RO is able to
demineralise water. Conversely, NF membranes may be efficiently operated at lower
pressures, leading to energy cost savings (Bergman 2007) while ensuring ionic water
26
balance without downstream salt addition due to its incomplete salt rejection.
Therefore, nanofiltration is preferred whenever freshwater sources (groundwater or
surface water) are available.
1.5.1.1 Membrane types and module configurations
A broad spectrum of NF membranes with different characteristics is available in the
market and has been assessed for drinking water treatment applications. Polymeric
NF membranes are generally manufactured from cellulose acetate or polyamide
materials and their derivatives (US EPA 2005). Ceramic membranes are often
composed of a variety of materials that include titania, alumina, silica, and zirconia.
Ceramic membranes have relatively uniform pore structures, are less prone to
fouling, due to their generally higher hidrophilicity, and have superior chemical,
thermal, and mechanical stability (Kim and Van der Bruggen 2010, Van der Bruggen et
al. 2003). Despite the advantages of ceramic over polymeric membranes, their
commercialisation is yet very restricted because they are still under development. The
membrane market is therefore dominated by polymeric membranes, which are
significantly less expensive.
Even though several membrane configurations are available, the most common in
water treatment applications are hollow-fiber and spiral-wound modules. Spiral-
wound modules are often assembled using NF/RO semipermeable polymeric
membranes, present moderate fouling tendency, and have low cost (Thorsen and
Fløgstad 2006).

Chapter 1
27
1.5.1.2 Selection of Desal 5DK membrane
The selection of a suitable membrane to carry out the studies described in the
present thesis was based on the evaluation of the membranes NF-90, NF-270, and
Desal 5DK in terms of their hydraulic permeability and ability to remove uncharged
organic solutes. Among these three membranes, Desal 5DK was found to allow
attaining an adequate balance between hydraulic permeability and rejection of
uncharged solutes such as glycerol, glucose and saccharose and was therefore
selected. A molecular weight cut-off of approximately 210 Da and a pore radius of
0.59 ± 0.01 nm were estimated for Desal 5DK during this PhD project by applying an
hydrodynamic model described by Bowen and Welfoot (2002).
Desal 5DK is a negatively charged thin film composite membrane, characterised by a
very dense and active layer of cross-linked aromatic polyamide, formed on a support
layer manufactured from polysulphone. The wide applicability of thin film composite
membranes relies on their high salt retention capacity and achievement of high fluxes
at low operating pressures (Ozaki et al. 2002).
1.5.2 Membrane, solute and water-matrix interactions
Special attention has been devoted in the last decade on how interactions taking
place between specific solutes/contaminants, membranes, and other water
components impact the rejection of solutes with different geometry and physico-
chemical properties. The comprehension of such interactions is essential for the
improvement and selection of suitable membranes as well as for the development of
tools that enable the prediction of NF efficiency towards a broad spectrum of
micropollutants.

28
Size exclusion is often regarded as the most important mechanism of rejection.
Although higher rejections are usually expected by membranes that present lower
MWCO, organic solutes with molecular weight higher than membrane MWCO may
also permeate. The prediction of steric hindrance effects upon rejection using
information related with molecular size is often more adequate than using molecular
weight (Bellona et al. 2004, Van der Bruggen et al. 1999). Furthermore, molecular
weight is a poor predictor when molecules are charged or present high
hydrophobicity (Kiso et al. 2001).
Most membranes are negatively charged due to the presence of functional groups
like sulphonic and carboxylic acids that are deprotonated at neutral pH (Bellona et al.
2004). Experiments addressing the removal of the pesticide mecoprop from bank
filtrate of a surface water showed that its dissociated form was the most rejected,
with increases between 10 and 90% among the five NF membranes addressed as pH
increased from 3 to 7 (Berg et al. 1997). The increase in rejection was related with
repulsive electrostatic interactions between the dissociated molecule and the charged
membrane.
Salts present in water may “shield” the charge of the functional groups of organic
compounds and reduce the negative zeta potential of membranes, resulting in
minimisation of repulsive electrostatic interactions. A reduction by up to 15% in
rejection has been previously reported when several NF and RO membranes were
evaluated to remove estrone from synthetic waters enriched with calcium,
bicarbonate, and sodium (Nghiem et al. 2002). Conversely, an improvement upon the
rejection of the pesticides atrazine, desethylatrazine, simazine, cyanazine,
isoproturon, and diuron by approximately 5% (in the presence of calcium chloride)
and 10% (in the presence of calcium sulphate) was reported for a NF-200 membrane
while differences in rejection were not noteworthy using a Desal 5DK membrane
(Boussahel et al. 2002). In addition, the decrease observed in the rejection of

Chapter 1
29
bisphenol A beyond 50 mM of sodium chloride using Desal 5DK was attributed to the
reduction of the molecular hydrodynamic radius due to a “salting-out” effect (Zhang
et al. 2006a). The effect of salts is, thus, dependent of salt concentration and
membrane type (Zhang et al. 2006a).
The impact of NOM on micropollutants removal is not straightforward. Retention
tends to rise with the presence of NOM due to the potential formation of complexes
between micropollutants and NOM (Salvaterra et al. 2011, Devitt et al. 1998) that are,
thus, rejected by size exclusion mechanisms. Retention, however, has been also
reported to remain unchanged in the presence of NOM (Zhang et al. 2006a). The
enhancement of interactions between humic substances and triazines in the presence
of calcium improved triazines rejection, highlighting the different impact of NOM
upon rejection (Plakas and Karabelas 2009). The different nature of commercial humic
and fulvic acids as well as the respective molecular weight and concentrations usually
applied to address the effect of NOM may explain the discrepancies reported.
Furthermore, humic and fulvic acids addressed are often not representative of NOM
found in real water matrices (Devitt and Wiesner 1998).
The diffusion of the molecules across the membrane is often facilitated through polar
interactions between molecules and membranes. Polar interactions with the charged
membranes NF45, NF-70, UTC-20, and NTR-7450 were related with the lower
removals of diuron and isoproturon from groundwater relatively to less polar atrazine
and simazine. These interactions led to minimisation of repulsive electrostatic
interactions between dissociated molecules and charged membranes (Van der
Bruggen et al. 1998).
Adsorption is an important rejection mechanism, particularly for hydrophobic
compounds, often characterised by values of log Kow higher than two (Yangali-
Quintanilla et al. 2009, Kimura et al. 2003). Rejection due to adsorption mechanisms
30
is therefore expected for the aforementioned pesticides and hormones (Tables 1.1
and 1.2). PAHs such as naphthalene, anthracene, and benzo(a)pyrene were found to
extensively absorb on Desal 5DK membrane during dead-end experiments with
adsorption percentages higher than 92% (Sanches et al. 2011b). Adsorption
interactions were also found to be driven by hydrogen bonding between the oxygen
of hydroxyl and carbonyl groups of estrone and NF/RO membranes in a study carried
out with synthetic water (Schäfer et al. 2003). Adsorptive interactions were found to
play a relevant role in the overall rejection of estrone (Nghiem et al. 2004) and
bisphenol A (Zhang et al. 2006a) in the early stage of filtration.
Although rejection mechanisms have been thoroughly investigated, discussion is
mainly based on experiments conducted with pure or synthetic waters that are not
representative of natural waters. Data obtained in a previous study during dead-end
experiments carried out with pure water and four different raw natural waters using
Desal 5DK membrane showed that, although significant variation in the removal of
atrazine (32-37%) was not observed, noteworthy differences were attained in the
rejection of alachlor (17-90%) and pentachlorophenol (11-68%) in different water
sources (Sanches et al. 2011b). Further investigation is therefore still needed to
elucidate the specific effect of organic and inorganic species present in natural waters
or their combined effects upon rejection of these compounds.
1.5.3 Current use and challenges
High capacity drinking water plants are already employing nanofiltration for several
years in Florida, The Netherlands, Spain, England, and France (Thorsen and Fløgstad
2006). The Méry-sur-Oise plant (France) is operational since the 1990s for the
production of potable water from the Oise river using NF technology for a production
Chapter 1
31
capacity of 140 000 m3 day-1. It exhibits an outstanding performance towards the
removal of organic matter and pesticides (Cyna et al. 2002).
A total treatment cost of €0.214 m-3 was estimated for a NF plant with a production
capacity of 100 000 m3 day-1 treating water from Tagus river (Costa and de Pinho
2006). These costs are comparable with those related with conventional processes.
The cost estimated for the production of drinking water from surface water
(encompassing pre-disinfection, coagulation, flocculation, sedimentation, filtration,
and final disinfection) in a utility placed in McAllen, Texas, with a capacity of 31 230
m3 day-1 was $US0.62 m-3 in 2006 (Rogers 2008). Even though treatment costs vary
according with the plant capacity and updated data is not publicly available,
nanofiltration has effectively become economically feasible and competitive to
produce high quality water.
A major disadvantage of pressure-driven membrane processes is the occurrence of
fouling that may result from the accumulation of organic and inorganic molecules,
colloids and biological solids at the membrane surface and pores, ultimately leading
to flux decline (Elimelech et al. 1997, Herzberg and Elimelech 2007, Nghiem et al.
2008, Wang and Tang 2011). As a consequence of fouling, the yield of permeate
decreases and higher pressures are needed to maintain the flow rate, resulting in
higher energy consumption and operating costs. Furthermore, frequent cleaning
considerably reduces membrane life span (Van der Bruggen et al. 2008).
The generation of a retentate stream that is more concentrated than the feed stream
in terms of suspended and dissolved constituents, is another intrinsic constraint of
pressure driven membrane processes. Treatment of the retentate might consist in
further concentration followed by disposal (landfilled or incinerated) or encompass
the removal of specific components with subsequent discharge in surface water or
groundwater (Van der Bruggen et al. 2008). In a previous study, costs related with the

32
disposal of retentate from surface water were estimated as 17% of total operating
costs (Costa and de Pinho 2006). The reduction of this cost would be very
advantageous for the worldwide implementation of membrane processes by water
utilities.
1.6 INTEGRATION OF UV PHOTOLYSIS AND NANOFILTRATION: OVERVIEW OF
RECENT DEVELOPMENTS
Growing interest in the combination of UV and membrane processes has been
observed in the last decade due to their expected potential to overcome some of the
drawbacks associated with the individual application of these processes (described in
sections 1.4.4 and 1.5.3).
A study from Molinari et al. (2002) reported the comparison of different
configurations combining TiO2 photocatalysis with ultrafiltration and nanofiltration:
irradiation of the membrane (catalyst deposited, in suspension or entrapped) and
irradiation of the recirculation tank using suspended catalyst. This latter configuration
was considered the most interesting for industrial applications essentially due to the
higher exposed catalytic surface area of the suspended TiO2 comparatively with the
immobilised form. Other studies have confirmed the advantage of applying the
suspended catalyst. Additional trichloroethylene degradation of 20% were observed
by Cho and co-workers (2005) using suspended catalyst relatively to the immobilised
form. However, the photocatalytic efficiency of immobilised TiO2 depends on the
catalyst load (You et al. 2012) as well as the distribution of the catalyst that is related
with the immobilisation methodology applied (Madaeni et al. 2011).
Most of the research studies combining UV photocatalysis with NF, UF or MF for
drinking water treatment have focused on the application of suspended TiO2, where

Chapter 1
33
the photocatalytic process takes place before filtration (e.g. Molinari et al. 2008,
Benotti et al. 2009, Le-Clech et al. 2006, Patsios et al. 2013). Even though disinfection
is the final stage of drinking water treatment, the positioning of UV photolysis
upstream the membrane process is based on the required retention of TiO2
nanoparticles.
The overall removal efficiency of humic acids during a sequential treatment
comprising UV-A TiO2 photocalysis and a submerged UF membrane relatively to
photocatalysis alone increased from 52% to 83% as a result of the synergistic effects
of photocatalytic oxidation and membrane filtration. A slight improvement was also
observed comparatively to the application of UF alone (Patsios et al. 2013).
Gemfibrozil and tamoxifen were previously successfully photodegradeded during the
operation of a sequential treatment but poor or none retention was observed for
these compounds and respective by-products using a NTR 7410 nanofiltration
membrane (Molinari et al. 2008). The identification of membranes that are able to
simultaneously remove specific micropollutants and the respective UV by-products,
which may have significantly low molecular weight, is therefore needed.
Pre-treatment of NOM soutions by LP/UV/TiO2 photocatalysis using a titanium dioxide
concentration of 0.5 g L-1 completely eliminated fouling of UF and MF membranes
caused by NOM. The effectiveness in membrane fouling control was related with
changes in the molecular characteristics of NOM (molecular weight and specific UV
absorbance) due to the preferential removal and transformation of large and
hydrophobic NOM molecules (Huang et al. 2008). The transformation of
humic/hydrophobic NOM fractions and polysaccharides into less sorbable organic
acids were also identified as the cause of the significant lower flux decline observed
during the nanofiltration of groundwater carried out after a LP/UV/H2O2 oxidation
pre-treatment (Song et al. 2004).
34
Formation of TiO2 aggregates and the respective precipitation, that may take place
due to catalyst insolubility, constitute a limitation of operations applying suspended
catalyst (Li et al. 2010). pH plays a key role in the dispersion of the catalyst in aqueous
suspensions since it determines the size of the particles and the respective number of
catalytic active sites. Excessive disaggregation of the catalyst is avoided by working at
a pH range of 7 ± 3 (Molinari et al. 2008). Benotti and co-workers (2009) addressed
the photocatalysis of several endocrine disrupting compounds using a pilot system in
which the membrane was back-pulsed every 60 seconds to prevent catalyst build-up.
TiO2 was recycled and reused, allowing for long-term operation.
Stable immobilisation of TiO2 on membrane surface has been explored as an
alternative to obtain membranes with photocatalytic and improved anti-fouling
properties (e.g. Ma et al. 2010, Zhang et al. 2006b). In this case, membranes are
irradiated to promote TiO2 photocatalysis. While a variety of membrane materials
may be applied using suspended catalyst, there is a limitation in terms of the type of
the membranes that may be applied using immobilised TiO2. Polymeric membranes
are highly susceptible to UV radiation and radical species generated (Chin et al. 2006).
Furthermore, the decrease of membrane permeability and increased rejection of
membranes obtained using dipping techniques to immobilise TiO2 (Tarabara 2009) as
well as its detachment during cleaning procedures of membranes obtained by sol-gel
precipitation (Su et al. 2012) and grafting (e.g. Madaeni et al. 2011) have been
reported. Stable immobilisation of TiO2 nanoparticles is currently a challenge.

Chapter 1
35
1.7 OBJECTIVES AND THESIS OUTLINE
The main objective of the work developed and presented in this thesis is to evaluate a
multi-barrier approach that integrates UV direct photolysis or TiO2 photocatalysis with
nanofiltration for drinking water treatment (Figure 1.1).
Figure 1.1 Proposed configuration integrating UV direct photolysis or TiO2 UV photocatalysis and nanofiltration.
In this integrated treatment, the degradation of the selected organic micropollutants
takes place by UV direct photolysis or TiO2 photocatalysis, using suspended TiO2
nanoparticles, at atmospheric pressure. A nanofiltration membrane unit is then
subjected to applied pressure in the absence of UV radiation.
The evaluation of the integrated process is focused on its potential to remove the
selected pesticides (atrazine, isoproturon, diuron, alachlor, pentachlorophenol, and
chlorfenvinphos) and hormones (17-estradiol, 17-ethinylestradiol, estrone, estriol,
and progesterone) as well as its ability to overcome the drawbacks associated with
the individual application of UV and nanofiltration processes (Chapter 5). To achieve
this goal, the potential application of the individual processes is firstly explored
(Chapters 2, 3, and 4), focusing essentially on process optimisation as well as the
Treated water
UV
with or without
suspended TiO2
Feed water
UV photolysisunit
Membrane unit
36
impact of specific natural water components and physico-chemical properties of the
target compounds upon their removal efficiency.
The ultimate objective of this study is to provide a step forward towards the
increasingly acceptance and implementation of UV and membrane processes while
attempting to solve their main drawbacks, providing water producers with knowledge
for their implementation.
This thesis is divided in 6 chapters. Chapter 1 consists of a revision of the state-of-the-
art focusing on the occurrence of the target micropollutants in drinking water
sources, the potential and benefits of applying UV photolysis and nanofiltration
technologies over conventional drinking water treatment processes to remove
micropollutants from water, as well as the challenges that these technologies
currently face towards their implementation. Furthermore, the motivation of the
conceptual and experimental approaches followed is provided throughout the text.
In Chapter 2, LP/UV direct photolysis, LP/UV/TiO2 photocatalysis, and LP/UV/H2O2
oxidation of the selected pesticides is described. Laboratory grade water, surface
water, and groundwater were selected to address the impact of water composition
upon photodegradation efficiency and kinetics. Optimisation of the process was
carried out by defining the main kinetic parameters that influence the photolysis of
organic compounds - quantum yield and decadic molar absorption coefficient and the
optimum concentration of TiO2 for the photocatalytic process. A model was applied to
provide other authors and drinking water producers with data that allows them to
select the conditions that ensure an efficient degradation of the selected
micropollutants.
Chapter 3 presents the potential of nanofiltration to remove the target
micropollutants from ultrafiltered groundwater and surface water using a Desal 5DK
membrane. The main mechanisms governing the rejection of the selected pesticides

Chapter 1
37
and hormones are discussed based on the impact of specific organic and inorganic
components of natural waters as well as specific physico-chemical properties of target
micropollutants. The role of adsorption upon the rejection of the selected
micropollutants under extended adsorption conditions is also addressed by
conducting membrane pre-adsorption experiments under static and dynamic
conditions.
A comprehension of the factors affecting the rejection of the selected micropollutants
from natural water matrices reported in Chapter 3 was not fully attained. Non-
mechanistic models are useful tools to correlate large sets of data and unravel
relationships between several variables. Chapter 4 describes the development of
multivariate statistically-based models to assess which specific physico-chemical
properties of the target micropollutants or operating related conditions are the most
relevant to describe their rejection/adsorption during nanofiltration. The models
developed allowed a better understanding of the mechanisms affecting the removal
of the target compounds by nanofiltration.
The assembling and evaluation of the proposed combined treatment is described in
Chapter 5. The efficiency of the individual processes and integrated treatment to
remove the target micropollutants from surface water collected after the
sedimentation process and the ability to produce high-quality drinking water is
depicted. Emphasis is given to the potential of the integrated treatment to overcome
the drawbacks related with the individual technologies through the monitoring of the
concentration of the target compounds in the retentate, the identification of UV
photolysis by-products, and flux decline. The toxicity of the treated water in terms of
endocrine disrupting activity through the YES assay is also presented to further
illustrate the quality of the water produced.

38
Chapter 6 summarises the main results obtained in the studies presented in this
thesis and provides a discussion integrating the results obtained in the different
chapters. Future developments and perspectives towards the implementation of the
technologies evaluated for drinking water treatment are also described. Particular
emphasis is given to the proposal of future work in view of the development of a new
integrated configuration.
REFERENCES
Addamo M, Bellardita M, Di Paola A, Palmisano L (2006) Preparation and photoactivity of nanostructured anatase, rutile and brookite TiO2 thin films. Chem Commun 47: 4943-4945.
Alhakimi G, Gebril S, Studnicki LH (2003) Comparative photocatalytic degradation using natural and
artificial UV-light of 4-chlorophenol as a representative compound in refinery wastewater. J Photoch Photobiol A 157: 103-109.
Ardrey RE, Liquid chromatography - mass spectrometry: An introduction. John Wiley & Sons, England (2003).
ATSDR - US Agency for Toxic Substances and Disease Registry (2003) Toxicological profile for atrazine. Available online: http://www.atsdr.cdc.gov/toxprofiles/tp.asp?id=338&tid=59.
Autin O, Hart J, Jarvis P, MacAdam J, Parsons SA, Jefferson B (2012) Comparison of UV/H2O2 and UV/TiO2 for the degradation of metaldehyde: Kinetics and the impact of background organics. Water Res 46: 5655-5662.
Aydin E, Talinli I (2013) Analysis, occurrence and fate of commonly used pharmaceuticals and hormones in the Buyukcekmece Watershed, Turkey. Chemosphere 90: 2004-2012.
Baeza A, Removal of pharmaceutical and endocrine disrupting chemicals by sequential photochemical and biological oxidation processes. ProQuest, Ann Arbor, USA (2008).
Balasubramanian G, Dionysiou DD, Suidan MT, Baudin I, Audin B, Laine JM (2004) Evaluating the activities of immobilised TiO2 powder films for the photocatalytic degradation of organic contaminants in water. Appl Catal B-Environ 47: 73-84.
Battin TJ, Kammer FVD, Weilhartner A, Ottofuelling S, Hofmann T (2009) Nanostructures TiO2: Transport behaviour and effects on aquatic microbial communities under environmental conditions. Environ Sci Tecnol 43: 8098-8104.
Bellona C, Drewes JE, Xu P, Amy G (2004) Factors affecting the rejection of organic solutes during NF/RO treatment - A literature review. Water Res 38: 2795-2809.
Benotti MJ, Stanford BD, Wert EC, Snyder SA (2009) Evaluation of a photocatalytic reactor membrane pilot system for the removal of pharmaceuticals and endocrine disrupting compounds from water. Water Res 43: 1513-1522.

Chapter 1
39
Berg P, Hagmeyer G, Gimbel R (1997) Removal of pesticides and other micropollutants by nanofiltration. Desalination 113: 205-208.
Bergman R, Reverse osmosis and nanofiltration (2nd
ed.). American Water Works Association, Denver, CO (2007).
Birkett J, Sources of endocrine disrupters, in: Birkett J and Lester, JN (Eds.), Endocrine disrupters in wastewater and sludge treatment processes. CRC Press LLC, London, pp. 35-58 (2003).
Bistan M, Podgorelec M, Logar RM, Tisler T (2012) Yeast estrogen screen assay as a tool for detecting estrogenic activity in water bodies. Food Technol Biotech 50: 427-433.
Bolton J, Linden K (2003) Standardisation of methods for fluence (UV dose) determination in bench-scale UV experiments. J Environ Eng-ASCE 129: 209-215.
Boussahel R, Montiel A, Baudu M (2002) Effects of organic and inorganic matter on pesticide rejection by nanofiltration. Desalination 145: 109-114.
Bowen WR, Welfoot JS (2002) Modelling the performance of membrane nanofiltration - critical assessment and model development. Chem Eng Sci 57: 1121-1137.
Brunkard JM, Ailes E, Roberts VA, Hill V, Hilborn ED, Craun GF, Rajasingham A, Kahler A, Garrison L, Hicks L, Carpenter J, Wade TJ, Beach MJ, Yoder Msw JS, (2011) Surveillance for waterborne disease outbreaks associated with drinking water - United States, 2007-2008. Morbidity and mortality weekly report. Surveillance summaries 60: 38-68.
Buxton GV, Greenstock CL, Helman WP, Ross AB (1988) Critial review of rate constants for reactions of hydrated electrons, hydrogen-atoms and hydroxyl radicals (OH/O
-) in aqueous-solution. J Phys
Chem Ref Data 17: 513-886.
Cabeza Y, Candela L, Ronen D, Teijon G (2012) Monitoring the occurrence of emerging contaminants in treated wastewater and groundwater between 2008 and 2010. The Baix Llobregat (Barcelona, Spain). J Hazard Mater 239: 32-39.
Cessna AJ, Grover R (1978) Spectrophotometric determination of dissociation-constants of selected acidic herbicides. J Agr Food Chem 26: 289-292.
Chang H, Wu S, Hu J, Asami M, Kunikane S (2008) Trace analysis of androgens and progestogens in environmental waters by ultra-performance liquid chromatography-electrospray tandem mass spectrometry. J Chromatogr A 1195: 44-51.
ChemSpider: The free chemical database. Available online http://www.chemspider.com/. Last accessed: December 2012.
Chin SS, Chiang K, Fane AG (2006) The stability of polymeric membranes in a TiO2 photocatalysis process. J Membrane Sci 275: 202-211.
Cho IH, Park JH, Kim YG (2005) Oxidative degradation and toxicity reduction of trichloroethylene (TCE) in water using TiO2/solar light: Comparative study of TiO2 slurry and immobilised systems. J Environ Sci Heal A 40: 1033-1044.
Comerton AM, Andrews RC, Bagley DM, Yang P (2007) Membrane adsorption of endocrine disrupting compounds and pharmaceutically active compounds. J Membrane Sci 303: 267-277.
Costa AR, de Pinho MN (2006) Performance and cost estimation of nanofiltration for surface water treatment in drinking water production. Desalination 196: 55-65.
40
Costet N, Villanueva CM, Jaakkola JJK, Kogevinas M, Cantor KP, King WD, Lynch CF, Nieuwenhuijsen MJ, Cordier S (2011) Water disinfection by-products and bladder cancer: Is there a European specificity? A pooled and meta-analysis of European case-control studies. Occup Environ Med 68: 379-385.
Cyna B, Chagneau G, Bablon G, Tanghe N (2002) Two years of nanofiltration at the Mery-sur-Oise plant, France. Desalination 147: 69-75.
Decision 2004/248/EC of 10 March 2004 concerning the non-inclusion of atrazine in Annex I to Council Directive 91/414/EEC and the withdrawal of authorisations for plant protection products containing this active substance. Official Journal of European Union, L78/53 (2004).
Decision 2006/966/EC of 18 December 2006 concerning the non-inclusion of alachlor in Annex I to Council Directive 91/414/EEC and the withdrawal of authorisations for plant protection products containing this active substance. Official Journal of the European Union, L 397/28 (2006).
Decision 2455/2001/EC of the European Parliament and of the Council of 20 November 2001 establishing the list of priority substances in the field of water policy and amending Directive 2000/60/EC. Official Journal of the European Communities, L 331/1 (2001).
De la Cruz N, Dantas RF, Giménez J, Esplugas S (2013) Photolysis and TiO2 photocatalysis of the pharmaceutical propranolol: Solar and artificial light. Appl Catal B-Environ 130: 249-256.
Desbrow C, Routledge EJ, Brighty GC, Sumpter JP, Waldock M (1998) Identification of estrogenic chemicals in STW effluent. 1. Chemical fractionation and in vitro biological screening. Environ Sci Technol 32: 1549-1558.
Devitt EC, Ducellier F, Cote P, Wiesner MR (1998) Effects of natural organic matter and the raw water matrix on the rejection of atrazine by pressure-driven membranes. Water Res 32: 2563-2568.
Devitt EC, Wiesner MR (1998) Dialysis investigations of atrazine-organic matter interactions and the role of a divalent metal. Environ Sci Technol 32: 232-237.
Diamanti-Kandarakis E, Bourguignon J-P, Giudice LC, Hauser R, Prins GS, Soto AM, Zoeller RT, Gore AC (2009) Endocrine-disrupting chemicals: An endocrine society scientific statement. Endocr Rev 30: 293-342.
Directive 2013/39/EU of the European Parliament and of the council of 19 August 2013 amending Directives 2000/60/EC and 2008/105/EC as regards priority substances in the field of water policy. Official Journal of the European Union, L226/1 (2013).
Doll TE, Frimmel FH (2005) Removal of selected persistent organic pollutants by heterogeneous photocatalysis in water. Catal Today 101: 195-202.
Donner E, Kosjek T, Qualmann S, Kusk KO, Heath E, Revitt DM, Ledin A, Andersen HR (2013) Ecotoxicity of carbamazepine and its UV photolysis transformation products. Sci Total Environ 443: 870-876.
Elimelech M, Zhu XH, Childress AE, Hong SK (1997) Role of membrane surface morphology in colloidal fouling of cellulose acetate and composite aromatic polyamide reverse osmosis membranes. J Membrane Sci 127: 101-109.
El Madani M, Guillard C, Perol N, Chovelon JM, El Azzouzi M, Zrineh A, Herrmann JM (2006) Photocatalytic degradation of diuron in aqueous solution in presence of two industrial titania catalysts, either as suspended powders or deposited on flexible industrial photoresistant papers. Appl Catal B-Environ 65: 70-76.

Chapter 1
41
EPAL (2010) Qualidade da água para consumo humano - Relatório anual 2010. Available online: http://www.epal.pt/epal/DownloadsImgPdf.aspx?src=RelatQualidade&area=283&sub=5615&menu=5615.
Eriksson P (1988) Nanofiltration extends the range of membrane filtration. Environ Prog 7: 58-62.
Escher BI, Fenner K (2011) Recent advances in environmental risk assessment of transformation products. Environ Sci Technol 45: 3835-3847.
European Commission, Proposal for a Directive of the European Parliament and of the Council amending Directives 2000/60/EC and 2008/105/EC as regards priority substances in the field of water policy, Brussels (2012).
Fane AG, Wang R, Jia Y, Membrane technology: Past, present, and future, in: Wang LK. Chen JP, Hung Y-T, Shammas NK (Eds.), Membrane and desalination technologies. Human Press, New York, USA (2011)
Fasnacht M, Blough N (2002) Aqueous photodegradation of polycyclic aromatic hydrocarbons. Environ Sci Technol 36: 4364-4369.
Fujishima A, Rao TN, Tryk DA (2000) Titanium dioxide photocatalysis. J Photoch Photobio C 1: 1-21.
Ge LK, Chen JW, Lin J, Cai XY (2009) Light-source-dependent effects of main water constituents on photodegradation of phenicol antibiotics: Mechanism and kinetics. Environ Sci Technol 43: 3101-3107.
Ge LK, Chen JW, Wei XX, Zhang SY, Qiao XL, Cai XY, Xie Q (2010) Aquatic photochemistry of fluoroquinolone antibiotics: Kinetics, pathways, and multivariate effects of main water constituents. Environ Sci Technol 44: 2400-2405.
Gerba C, Drinking water treatment and distribution, in: Maier RM, Pepper IL, Gerba CP (Eds.), Environmental Microbiology. Academic Press, San Diego, USA, pp. 535-541 (2000a).
Gerba C, Disinfection, in: Maier RM, Pepper IL, Gerba CP (Eds.), Environmental Microbiology. Academic Press, San Diego, USA, pp. 543-556 (2000b).
Grellier J, Bennett J, Patelarou E, Smith RB, Toledano MB, Rushton L, Briggs DJ, Nieuwenhuijsen MJ (2010) Exposure to disinfection by-products, fetal growth, and prematurity: A systematic review and meta-analysis. Epidemiology 21: 300-313.
Harries JE, Sheahan DA, Jobling S, Matthiessen P, Neall M, Sumpter JP, Taylor T, Zaman N (1997) Estrogenic activity in five United Kingdom rivers detected by measurement of vitellogenesis in caged male trout. Environ Toxicol Chem 16: 534-542.
Hayes TB, Anderson LL, Beasley VR, de Solla SR, Iguchi T, Ingraham H, Kestemont P, Kniewald J, Kniewald Z, Langlois VS, Luque EH, McCoy KA, Munoz-de-Toro M, Oka T, Oliveira CA, Orton F, Ruby S, Suzawa M, Tavera-Mendoza LE, Trudeau VL, Victor-Costa AB, Willingham E (2011) Demasculinisation and feminisation of male gonads by atrazine: Consistent effects across vertebrate classes. J Steroid Biochem 127: 64-73.
Health Canada (2012) Guidelines for Canadian drinking water quality - Summary table. Water, Air and Climate Change Bureau, Healthy Environments and Consumer Safety Branch, Health Canada, Ottawa, Ontario. Available online: http://www.hc-sc.gc.ca/ewh-semt/alt_formats/pdf/pubs/water-eau/2012-sum_guide-res_recom/2012-sum_guide-res_recom-eng.pdf.
42
Hecker M, Hollert H (2011) Endocrine disrupter screening: Regulatory perspectives and needs. Environ Sci Eur 23: 1-15.
Herzberg M, Elimelech M (2007) Biofouling of reverse osmosis membranes: Role of biofilm-enhanced osmotic pressure. J Membrane Sci 295: 11-20.
Huang XH, Leal M, Li QL (2008) Degradation of natural organic matter by TiO2 photocatalytic oxidation and its effect on fouling of low-pressure membranes. Water Res 42: 1142-1150.
Hurum DC, Agrios AG, Gray KA, Rajh T, Thurnauer MC (2003) Explaining the enhanced photocatalytic activity of Degussa P25 mixed-phase TiO2 using EPR. J Phys Chem B 107: 4545-4549.
IJpelaar G, Harmsen DJH, Heringa M (2007) UV disinfection and UV/H2O2 oxidation: By-product formation and control - Report elaborated in the scope of the D2411 deliverable of Project TECHNEAU.
Jacobs LE, Weavers LK, Chin YP (2008) Direct and indirect photolysis of polycyclic aromatic hydrocarbons in nitrate-rich surface waters. Environ Toxicol Chem 27: 1643-1648.
Jardim WF, Montagner CC, Pescara IC, Umbuzeiro GA, Di Dea Bergamasco AM, Eldridge ML, Sodré FF (2012) An integrated approach to evaluate emerging contaminants in drinking water. Sep Purif Technol 84: 3-8.
Jeong CH, Wagner ED, Siebert VR, Anduri S, Richardson SD, Daiber EJ, McKague AB, Kogevinas M, Villanueva CM, Goslan EH, Luo W, Isabelle LM, Pankow JF, Grazuleviciene R, Cordier S, Edwards SC, Righi E, Nieuwenhuijsen MJ, Plewa MJ (2012) Occurrence and toxicity of disinfection by-products in European drinking waters in relation with the HIWATE epidemiology Study. Environ Sci Technol 46: 12120-12128.
Jin Y, Wang L, Fu Z (2013) Oral exposure to atrazine modulates hormone synthesis and the transcription of steroidogenic genes in male peripubertal mice. Gen Comp Endocr 184: 120-127.
Jmol: An open-source Java viewer for chemical structures in 3D. Available online: http://jmol.sourceforge.net/.
Jobling S, Nolan M, Tyler CR, Brighty G, Sumpter JP (1998) Widespread sexual disruption in wild fish. Environ Sci Technol 32: 2498-2506.
Kidd KA, Blanchfield PJ, Mills KH, Palace VP, Evans RE, Lazorchak JM, Flick RW (2007) Collapse of a fish population after exposure to a synthetic estrogen. P Natl Acad Sci USA 104: 8897-8901.
Kim J, Van der Bruggen B (2010) The use of nanoparticles in polymeric and ceramic membrane structures: Review of manufacturing procedures and performance improvement for water treatment. Environ Pollut 158: 2335-2349.
Kimura K, Amy G, Drewes J, Watanabe Y (2003) Adsorption of hydrophobic compounds onto NF/RO membranes: An artifact leading to overestimation of rejection. J Membrane Sci 221: 89-101.
Kiso Y, Nishimura Y, Kitao T, Nishimura K (2000) Rejection properties of non-phenylic pesticides with nanofiltration membranes. J Membrane Sci 171: 229-237.
Kiso Y, Sugiura Y, Kitao T, Nishimura K (2001) Effects of hydrophobicity and molecular size on rejection of aromatic pesticides with nanofiltration membranes. J Membrane Sci 192: 1-10.
Knauert S, Escher B, Singer H, Hollender J, Knauer K (2008) Mixture toxicity of three photosystem II inhibitors (atrazine, isoproturon, and diuron) toward photosynthesis of freshwater phytoplankton studied in outdoor mesocosms. Environ Sci Technol 42: 6424-6430.

Chapter 1
43
Kolpin DW, Furlong ET, Meyer MT, Thurman EM, Zaugg SD, Barber LB, Buxton HT (2002) Pharmaceuticals, hormones, and other organic wastewater contaminants in US streams, 1999-2000: A national reconnaissance. Environ Sci Technol 36: 1202-1211.
Konstantinou IK, Sakellarides TM, Sakkas VA, Albanis TA (2001) Photocatalytic degradation of selected s-triazine herbicides and organophosphorus insecticides over aqueous TiO2 suspensions. Environ Sci Technol 35: 398-405.
Konstantinou IK, Sakkas VA, Albanis TA (2002) Photocatalytic degradation of propachlor in aqueous TiO2 suspensions: Determination of the reaction pathway and identification of intermediate products by various analytical methods. Water Res 36: 2733-2742.
Kopecký J, Organic Photochemistry: A visual approach. VCH Publishers Inc, New York (1992).
Krieger R, Doull J, Ecobichon D, Gammon D, Hodgson E, Reiter L, Ross J, Handbook of pesticides toxicology: Principles. Elsevier Science, USA (2001).
Kuster M, José Lopéz de Alda M, Dolores Hernando M, Petrovic M, Martin-Alonso J, Barceló D (2008) Analysis and occurrence of pharmaceuticals, estrogens, progestogens and polar pesticides in sewage treatment plant effluents, river water and drinking water in the Llobregat river basin (Barcelona, Spain). J Hydrol 358: 112-123.
Larson RA, Zepp RG (1988) Reactivity of the carbonate radical with aniline derivatives. Environ Toxicol Chem 7: 265-274.
Le-Clech P, Lee EK, Chen V (2006) Hybrid photocatalysis/membrane treatment for surface waters containing low concentrations of natural organic matters. Water Res 40: 323-330.
Lee WJ, Hoppin JA, Blair A, Lubin JH, Dosemeci M, Sandler DP, Alavanja MCR (2004) Cancer incidence among pesticide applicators exposed to alachlor in the Agricultural Health Study American. J Epidemiol 159: 373-380.
Le Goff L, Khaldi S, Favennec L, Nauleau F, Meneceur P, Perot J, Ballet JJ, Gargala G (2010) Evaluation of water treatment plant UV reactor efficiency against Cryptosporidium parvum oocyst infectivity in immunocompetent suckling mice. J Appl Microbiol 108: 1060-1065.
Li G, Lv L, Fan H, Ma J, Li Y, Wan Y, Zhao XS (2010) Effect of the agglomeration of TiO2 nanoparticles on their photocatalytic performance in the aqueous phase. J Colloid Interf Sci 348: 342-347.
Loos R, Gawlik BM, Locoro G, Rimaviciute E, Contini S, Bidoglio G (2009) EU-wide survey of polar organic persistent pollutants in European river waters. Environ Pollut 157: 561-568.
Loos R, Locoro G, Comero S, Contini S, Schwesig D, Werres F, Balsaa P, Gans O, Weiss S, Blaha L, Bolchi M, Gawlik BM (2010a) Pan-European survey on the occurrence of selected polar organic persistent pollutants in ground water. Water Res 44: 4115-4126.
Loos R, Locoro G. Contini S (2010b) Occurrence of polar organic contaminants in the dissolved water phase of the Danube River and its major tributaries using SPE-LC-MS2 analysis. Water Res 44: 2325-2335.
Ma N, Zhang Y, Quan X, Fan X, Zhao H (2010) Performing a microfiltration integrated with photocatalysis using an Ag-TiO2/HAP/Al2O3 composite membrane for water treatment: Evaluating effectiveness for humic acid removal and anti-fouling properties. Water Res 44: 6104-6114.
Madaeni SS, Zinadini S, Vatanpour V (2011) A new approach to improve antifouling property of PVDF membrane using in situ polymerisation of PAA functionalised TiO2 nanoparticles. J Membrane Sci 380: 155-162.

44
Maldonado M, Passarinho P, Oller I, Gernjak W, Fernandez P, Blanco J, Malato S (2007) Photocatalytic degradation of EU priority substances: A comparison between TiO2 and Fenton plus photo-Fenton in a solar pilot plant. J Photoch Photobio A 185: 354-363.
Marotta R, Spasiano D, Di Somma I, Andreozzi R (2013) Photodegradation of naproxen and its photoproducts in aqueous solution at 254 nm: A kinetic investigation. Water Res 47: 373-383.
McInnis P, Pesticides in Ontario’s Treated Municipal Drinking Water 1986-2006. Environmental Monitoring and Reporting Branch, Ontario Ministry of the Environment (2010). Available online: http://www.ene.gov.on.ca/environment/en/resources/STD01_078819.html.
Mehrvar M, Venhuis SH (2005) Photocatalytic treatment of linear alkylbenzene sulfonate (LAS) in water. J Environ Sci Heal A 40: 1003-1012.
Meylan WM, Howard PH, Validation of water solubility estimation methods using log Kow for application in PCGEMS & EPI. Syracuse Research Corporation, Environmental Science Center, New York (1994).
Molinari R, Palmisano L, Drioli E, Schiavello M (2002) Studies on various reactor configurations for coupling photocatalysis and membrane processes in water purification. J Membrane Sci 206: 399-415.
Molinari R, Caruso A, Argurio P, Poerio T (2008) Degradation of the drugs Gemfibrozil and Tamoxifen in pressurised and de-pressurised membrane photoreactors using suspended polycrystalline TiO2 as catalyst. J Membrane Sci 319: 54-63.
Munger R, Isacson P, Hu S, Burns T, Hanson J, Lynch CF, Cherryholmes K, VanDorpe P, Hausler WJ (1997) Intrauterine growth retardation in Iowa communities with herbicide-contaminated drinking water supplies. Environ Health Persp 105: 308-314.
Nghiem LD, Schäfer AI, Waite TD (2002) Adsorption of estrone on nanofiltration and reverse osmosis membranes in water and wastewater treatment. Water Sci Technol 46: 265-272.
Nghiem L, Schäfer A, Elimelech M (2004) Removal of natural hormones by nanofiltration membranes: Measurement, modeling, and mechanisms. Environ Sci Technol 38: 1888-1896.
Nghiem LD, Espendiller C, Braun G (2008) Influence of organic and colloidal fouling on the removal of sulphamethoxazole by nanofiltration membranes. Water Sci Technol 58: 163-169.
NHMRC, NRMMC (2011) Australian drinking water guidelines paper 6 - National water quality management strategy. National Health and Medical Research Council, National Resource Management Ministerial Council, Commonwealth of Australia, Canberra. Available online: http://www.nhmrc.gov.au/_files_nhmrc/publications/attachments/eh52_aust_drinking_water_guidelines.pdf.
Nickenig G, Strehlow K, Wassmann S, Baumer AT, Albory K, Sauer H, Bohm M (2000) Differential effects of estrogen and progesterone on AT(1) receptor gene expression in vascular smooth muscle cells. Circulation 102: 1828-1833.
Oki T, Kanae S (2006) Global hydrological cycles and world water resources. Science 313: 1068-1072.
Orton F, Lutz I, Kloas W, Routledge EJ (2009) Endocrine disrupting effects of herbicides and pentachlorophenol: In vitro and in vivo evidence. Environ Sci Technol 43: 2144-2150.
Ozaki H, Li HF (2002) Rejection of organic compounds by ultra-low pressure reverse osmosis membrane. Water Res 36: 123-130.
Chapter 1
45
Patsios SI, Sarasidis VC, Karabelas AJ (2013) A hybrid photocatalysis–ultrafiltration continuous process for humic acids degradation. Sep Purif Technol 104: 333-341.
Patterson C, Anderson A, Sinha R, Muhammad N, Pearson D (2012) Nanofiltration membranes for removal of colour and pathogens in small public drinking water sources. J Environ Eng-ASCE 138: 48-57.
Pereira VJ, Linden KG, Weinberg HS (2007a) Evaluation of UV irradiation for photolytic and oxidative degradation of pharmaceutical compounds in water. Water Res 41: 4413-4423.
Pereira VJ, Weinberg HS, Linden KG, Singer PC (2007b) UV degradation kinetics and modeling of pharmaceutical compounds in laboratory grade and surface water via direct and indirect photolysis at 254 nm. Environ Sci Technol 41: 1682-1688.
Pereira VJ, Galinha J, Barreto Crespo MT, Matos CT, Crespo JG (2012) Integration of nanofiltration, UV photolysis, and advanced oxidation processes for the removal of hormones from surface water sources. Sep Purif Technol 95: 89-96.
Pesticide Properties DataBase, Agriculture & Environment Research Unit (AERU). Available online: http://sitem.herts.ac.uk/aeru/footprint/en/index.htm; Last accessed: September 8, 2010.
Plakas KV, Karabelas AJ (2009) Triazine retention by nanofiltration in the presence of organic matter: The role of humic substance characteristics. J Membrane Sci 336: 86-100.
Postigo C, José Lopéz de Alda M, Barceló D, Ginebreda A, Garrido T, Fraile J. (2010) Analysis and occurrence of selected medium to highly polar pesticides in groundwater of Catalonia (NE Spain): An approach based on on-line solid phase extraction-liquid chromatography-electrospray-tandem mass spectrometry detection. J Hydrol 383: 83-92.
Purdom CE, Hardiman PA, Bye VVJ, Eno NC, Tyler CR, Sumpter JP (1994) Estrogenic effects of effluent from sewage treatmentworks. Chem Ecol 8: 275-285.
Rahman MB, Driscoll T, Cowie C, Armstrong BK (2010) Disinfection by-products in drinking water and colorectal cancer: A meta-analysis International. J Epidemiol 39: 733-745.
Rao KF, Lei BL, Li N, Ma M, Wang ZJ (2013) Determination of estrogens and estrogenic activities in water from three rivers in Tianjin, China. J Environ Sci-China 25: 1164-1171.
Regulation 2076/2002 of 20 November 2002 extending the time period referred to in Article 8(2) of Council Directive 91/414/EEC and concerning the non-inclusion of certain active substances in Annex I to that Directive and the withdrawal of authorisations for plant protection products containing these substances. Official Journal of the European Communities, L 319/3 (2002).
Rodriguez-Mozaz S, José López de Alda M, Barceló D (2004) Monitoring of estrogens, pesticides and bisphenol A in natural waters and drinking water treatment plants by solid-phase extraction–liquid chromatography–mass spectrometry. J Chromatogr A 1045: 85-92.
Rogers C, Economic costs of conventional surface-water treatment: A case study of the MCallen northwest facility (Master thesis). Texas A&M University, Texas, USA (2008).
Rosenfeldt E, Chen P, Kullman S, Linden K (2007) Destruction of estrogenic activity in water using UV advanced oxidation. Sci Total Environ 377: 105-113.
Routledge EJ, Sumpter JP (1996) Estrogenic activity of surfactants and some of their degradation products assessed using a recombinant yeast screen. Environ Toxicol Chem 15: 241-248.
Ruder AM, Yiin JH (2011) Mortality of US pentachlorophenol production workers through 2005. Chemosphere 83: 851-861.
46
Saito K, Niijima A, Kamite E, Watanabe M (2012) Bisphenol A and estrone-induced developmental effects in early chick embryos. Environ Toxicol 27: 58-62.
Salvaterra AF, Sarmento G, Minhalma M, de Pinho MN (2011) Nanofiltration of surface water for the removal of endocrine disruptors. Desalin Water Treat 35: 54-61.
Sanches S, Leitão C, Penetra A, Cardoso VV, Ferreira E, Benoliel MJ, Barreto Crespo MT, Pereira VJ (2011a) Direct photolysis of polycyclic aromatic hydrocarbons in drinking water sources. J Hazard Mater 192: 1458-1465.
Sanches S, Penetra A, Granado C, Cardoso VV, Ferreira E, Benoliel MJ, Barreto Crespo MT, Pereira VJ, Crespo JG (2011b) Removal of pesticides and polycyclic aromatic hydrocarbons from different drinking water sources by nanofiltration. Desalin Water Treat 27: 141-149.
Schaep J, Van der Bruggen B, Uytterhoeven S, Croux R, Vandecasteele C, Wilms D, Van Houtte E, Vanlergberghe F (1998) Removal of hardness from groundwater by nanofiltration. Desalination 119: 295-301.
Schäfer A, Nghiem L, Waite T (2003) Removal of the natural hormone estrone from aqueous solutions using nanofiltration and reverse osmosis. Environ Sci Technol 37: 182-188.
Schäfer AI, Pihlajamaki A, Fane AG, Waite TD, Nyström M (2004) Natural organic matter removal by nanofiltration: Effects of solution chemistry on retention of low molar mass acids versus bulk organic matter. J Membrane Sci 242: 73-85.
Schwarzenbach RP, Gschwend PM, Imboden DM, In Environmental Organic Chemistry. John Wiley & Sons Inc, New York (1993).
Sharpless CM, Seibold DA, Linden KG (2003) Nitrate photosensitised degradation of atrazine during UV water treatment. Aquat Sci 65: 359-366.
Shemer H, Linden KG (2007a) Photolysis, oxidation and subsequent toxicity of a mixture of polycyclic aromatic hydrocarbons in natural waters. J Photoch Photobio A-Chemistry 187: 186-195.
Shemer H, Linden KG (2007b) Aqueous photodegradation and toxicity of the polycyclic aromatic hydrocarbons fluorene, dibenzofuran, and dibenzothiophene. Water Res 41: 853-861.
Shiklomanov IA, World fresh water resources, in: Gleick PH (Ed.), Water in crisis: A guide to the world's fresh water resources. Oxford University Press Inc, New York, pp. 13-24 (1993).
Shin GA, Linden KG, Faubert G (2009) Inactivation of Giardia lamblia cysts by polychromatic UV. Lett Appl Microbiol 48: 790-792.
Snyder SA, Adham S, Redding AM, Cannon FS, DeCarolis J, Oppenheimer J, Wert E, Yoon Y (2007) Role of membranes and activated carbon in the removal of endocrine disruptors and pharmaceuticals. Desalination 202: 156-181.
Song W, Ravindran V, Koel BE, Pirbazari M (2004) Nanofiltration of natural organic matter with H2O2/UV pretreatment: Fouling mitigation and membrane surface characterisation. J Membrane Sci 241: 143-160.
Sosnowska B, Huras B, Nowacka-Krukowska H, Bukowska B (2013) Oxidative damage to human red blood cells treated with chlorfenvinphos, an organophosphate insecticide (in vitro). Biologia 68: 773-778.
Chapter 1
47
Sousa MA, Gonçalves C, Pereira J, Vilar VJP, Boaventura RAR, Alpendurada MF (2013) Photolytic and TiO2-assisted photocatalytic oxidation of the anxiolytic drug lorazepam (Lorenin (R) pills) under artificial UV light and natural sunlight: A comparative and comprehensive study. Sol Energy 87: 219-228.
Stanford BD, Weinberg HS (2010) Evaluation of on-site wastewater treatment technology to remove estrogens, nonylphenols, and estrogenic activity from wastewater. Environ Sci Technol 44: 2994-3001.
Su Y-C, Huang C, Pan JR, Hsieh W-P, Chu M-C (2012) Fouling mitigation by TiO2 composite membrane in membrane bioreactors. J Environ Eng-ASCE 138: 344-350.
Sun L, Yong W, Chu X, Lin J-M (2009) Simultaneous determination of 15 steroidal oral contraceptives in water using solid-phase disk extraction followed by high performance liquid chromatography-tandem mass spectrometry. J Chromatogr A 1216: 5416-5423.
Sunnotel O, Verdoold R, Dunlop PSM, Snelling WJ, Lowery CJ, Dooley JSG, Moore JE, Byrne JA (2010) Photocatalytic inactivation of Cryptosporidium parvum on nanostructured titanium dioxide films. J Water Health 8: 83-91.
Tarabara V, Multifunctional nanomaterial-enabled membranes for water treatment, in: Diallo M, Duncan J, Savage N, Sustich R, Street A (Eds.), Nanotechnology Applications for Clean Water. William Andrew Inc, New York, USA, pp. 59-75 (2009).
Teijon G, Candela L, Tamoh K, Molina-Diaz A, Fernandez-Alba AR (2010) Occurrence of emerging contaminants, priority substances (2008/105/CE) and heavy metals in treated wastewater and groundwater at Depurbaix facility (Barcelona, Spain). Sci Total Environ 408: 3584-3595.
Thorsen T, Fløgstad H (2006) Nanofiltration in drinking water treatment - Report elaborated in the scope of the deliverable D 534B of the TECHNEAU project.
Trovo AG, Nogueira RFP, Aguera A, Sirtori C, Fernandez-Alba AR (2009) Photodegradation of sulfamethoxazole in various aqueous media: Persistence, toxicity and photoproducts assessment. Chemosphere 77: 1292-1298.
Turan VK, Sanchez RI, Li JJ, Li SA, Reuhl KR, Thomas PE, Conney AH, Gallo MA, Kauffman FC, Mesia-Vela S (2004) The effects of steroidal estrogens in ACI rat mammary carcinogenesis: 17 beta-estradiol, 2-hydroxyestradiol, 4-hydroxyestradiol, 16 alpha-hydroxyestradiol, and 4-hydroxyestrone. JEndocrinol 183: 91-99.
US EPA (1996) Ultraviolet light disinfection technology in drinking water application – An overview (EPA 811-R-96-002). US Environmental Protection Agency, Office of Ground Water and Drinking Water, Washington DC.
US EPA (2003) Re-registration eligibility decision for diuron (document number 20460). US Environmental Protection Agency, Office of Prevention, Pesticides and Toxic Substances, Washington DC.
US EPA (2005) Membrane filtration guidance manual (EPA 815-R-06-009). US Environmental Protection Agency, Office of Water, Washington DC.
US EPA (2006) Ultraviolet disinfection guidance manual for the final long term 2 enhanced surface water treatment rule (EPA 815-R-06-007). US Environmental Protection Agency, Office of Water, Washington, DC.
US EPA (2008) Reregistration eligibility decision for pentachlorophenol (EPA 739-R-08-008). US Environmental Protection Agency, Office of Prevention, Pesticides and Toxic Substances, Washington DC.

48
US EPA (2009a) National primary drinking water regulations. Available online: http://water.epa.gov/drink/contaminants/basicinformation/alachlor.cfm.
US EPA (2009b) Drinking Water Contaminant Candidate List 3 –Final. Federal Register, Vol. 74, n. 194. Available online: http://water.epa.gov/scitech/drinkingwater/dws/ccl/ccl3.cfm.
US EPA (2012) Pesticides: Topical and chemical fact sheets. Available online: http://wwwepagov/pesticides/factsheets/atrazine_backgroundhtm. Last updated: May 5, 2012, last accessed: May 17, 2013.
Vajda AM, Barber LB, Gray JL, Lopez EM, Woodling JD, Norris DO (2008) Reproductive disruption in fish downstream from an Estrogenic wastewater effluent. Environ Sci Technol 42: 3407-3414.
Vajda AM, Barber LB, Gray JL, Lopez EM, Bolden AM, Schoenfuss HL, Norris DO (2011) Demasculinisation of male fish by wastewater treatment plant effluent. Aquat Toxicol 103: 213-221.
Van der Bruggen B, Schaep J, Maes W, Wilms D, Vandecasteele C (1998) Nanofiltration as a treatment method for the removal of pesticides from ground waters. Desalination 117: 139-147.
Van der Bruggen B, Schaep J, Wilms D, Vandecasteele C (1999) Influence of molecular size, polarity and charge on the retention of organic molecules by nanofiltration. J Membrane Sci 156: 29-41.
Van der Bruggen B, Everaert K, Wilms D, Vandecasteele C (2001) Application of nanofiltration for removal of pesticides, nitrate and hardness from ground water: Rejection properties and economic evaluation. J Membrane Sci 193: 239-248.
Van der Bruggen B, Vandecasteele C, Van Gestel T, Doyen W, Leysen R (2003) A review of pressure-driven membrane processes in wastewater treatment and drinking water production. Environ Prog 22: 46-56.
Van der Bruggen B, Manttari M, Nyström M (2008) Drawbacks of applying nanofiltration and how to avoid them: A review. Sep Purif Technol 63: 251-263.
Van der Zande, A (2010) Exploration of Management Options for Pentachlorophenol (PCP). Paper for the 8
th meeting of the UNECE CLRTAP Task Force on Persistent Organic Pollutants, Montreal, 18 -20
May 2010.
Velicu M, Suri R (2009) Presence of steroid hormones and antibiotics in surface water of agricultural, suburban and mixed-use areas. Environ Monit Assess 154: 349-359.
Verliefde A, Cornelissen E, Heijman S, Verberk J, Amy G, Van der Bruggen B, van Dijk J (2009) Construction and validation of a full-scale model for rejection of organic micropollutants by NF membranes. J Membrane Sci 339: 10-20.
Vidyasagar J, Karunakar N, Reddy MS, Rajnarayana K, Surender T, Krishna DR (2004) Oxidative stress and antioxidant status in acute organophosphorous insecticide poisoning. Indian J Pharmacol 36: 76-79.
Villanueva CM, Durand G, Coutte MB, Chevrier C, Cordier S (2005) Atrazine in municipal drinking water and risk of low birth weight, preterm delivery, and small-for-gestational-age status. Occup Environ Med 62: 400-405.
Vryzas Z, Papadakis EN, Vassiliou G, Papadopoulou-Mourkidou E (2012) Occurrence of pesticides in transboundary aquifers of North-eastern Greece. Sci Total Environ 441: 41-48.
Wang RC, Ren DJ, Xia SQ, Zhang YL, Zhao JF (2009) Photocatalytic degradation of Bisphenol A (BPA) using immobilised TiO2 and UV illumination in a horizontal circulating bed photocatalytic reactor (HCBPR). J Hazard Mater 169: 926-932.
Chapter 1
49
Wang YN, Tang CY (2011) Nanofiltration membrane fouling by oppositely charged macromolecules: Investigation on flux behavior, foulant mass deposition, and solute rejection. Environ Sci Technol 45: 8941-8947.
Wang Y, Chen Z, Ba T, Pu J, Chen T, Song Y, Gu Y, Qian Q, Xu Y, Xiang K, Wang H, Jia G (2013) Susceptibility of young and adult rats to the oral toxicity of titanium dioxide nanoparticles. Small 9: 1742-1752.
WHO (1996) Guidelines for drinking-water quality, Volume 2 - Health criteria and other supporting information (2
nd ed.). World Health Organisation, Geneva.
Wilson AGE, Thake DC, Heydens WE, Brewster DW, Hotz KJ (1996) Mode of action of thyroid tumor formation in the male Long-Evans rat administered high doses of alachlor. Fund Appl Toxicol 33: 16-23.
Wlodyka-Bergier A, Bergier T (2011) The occurrence of haloacetic acids in Krakow water distribution system. Arch Environ Prot 37: 21-29.
Wong C, Chu W (2003) The direct photolysis and photocatalytic degradation of alachlor at different TiO2 and UV sources. Chemosphere 50: 981-987.
Wu C, Linden KG (2008) Degradation and byproduct formation of parathion in aqueous solutions by UV and UV/H2O2 treatment. Water Res 42: 4780-4790.
Xia XH, Li GC, Yang ZF, Chen YM, Huang GH (2009) Effects of fulvic acid concentration and origin on photodegradation of polycyclic aromatic hydrocarbons in aqueous solution: Importance of active oxygen. Environ Pollut 157: 1352-1359.
Yangali-Quintanilla V, Sadmani A, McConville M, Kennedy M, Amy G (2009) Rejection of pharmaceutically active compounds and endocrine disrupting compounds by clean and fouled nanofiltration membranes. Water Res 43: 2349-2362.
You SJ, Semblante GU, Lu SC, Damodar RA, Wei TC (2012) Evaluation of the antifouling and photocatalytic properties of poly(vinylidene fluoride) plasma-grafted poly(acrylic acid) membrane with self-assembled TiO2. J Hazard Mater 237: 10-19.
Yuan F, Hu C, Hu X, Qu J, Yang M (2009) Degradation of selected pharmaceuticals in aqueous solution with UV and UV/H2O2. Water Res 43: 1766-1774.
Zepp RG, Hoigné J, Bader H (1987) Nitrate-induced photooxidation of trace organic-chemicals in water. Environ Sci Technol 21: 443-450.
Zhang Y, Causserand C, Aimar P, Cravedi JP (2006a) Removal of bisphenol A by a nanofiltration membrane in view of drinking water production. Water Res 40: 3793-3799.
Zhang HM, Quan X, Chen S, Zhao HM, Zhao YZ (2006b) Fabrication of photocatalytic membrane and evaluation its efficiency in removal of organic pollutants from water. Sep Purif Technol 50: 147-155.
Zheng W, Yu H, Wang X, Qu W (2012) Systematic review of pentachlorophenol occurrence in the environment and in humans in China: Not a negligible health risk due to the re-emergence of schistosomiasis. Environ Int 42: 105-116.
Zhou X, Lian Z, Wang J, Tan L, Zhao Z (2011) Distribution of estrogens along Licun River in Qingdao, China. Procedia Environ Sci 10: 1876-1880.

50
CHAPTER 2
Drinking water treatment of pesticides using low pressure UV photolysis and advanced oxidation processes

52
Published in Water Research:
Sanches S, Barreto Crespo MT, Pereira VJ (2010) Drinking water treatment of priority
pesticides using low pressure UV photolysis and advanced oxidation processes. Water
Res 44(6): 1809-1818.
Sandra Sanches was involved in all the experimental work presented in this chapter.
Modelling of experimental data was carried out by Vanessa Pereira, who also
supervised all the work developed together with Teresa Crespo.

Chapter 2
53
CONTENTS
Abstract ............................................................................................................... 54
2.1 Introduction ................................................................................................... 55
2.2 Materials and Methods ................................................................................... 58
2.2.1 Reagents ............................................................................................................... 58
2.2.2 Experimental setup .............................................................................................. 59
2.2.2.1 UV photolysis experiments ....................................................................... 59
2.2.2.2 UV/H2O2 photolysis experiments ............................................................. 60
2.2.2.3 UV/TiO2 photolysis experiments............................................................... 60
2.2.2.4 Analytical methods .................................................................................... 61
2.3 Results and Discussion .................................................................................... 62
2.3.1 Direct photolysis ................................................................................................... 62
2.3.2 Advanced oxidation processes ............................................................................. 66
2.4 Conclusions .................................................................................................... 73
Acknowledgements .............................................................................................. 73
References ........................................................................................................... 74

54
ABSTRACT
This study reports the efficiency of low pressure UV photolysis for the degradation of
pesticides identified as priority pollutants by the European Water Framework
Directive 2000/60/EC. Direct low pressure UV photolysis and advanced oxidation
processes (using hydrogen peroxide and titanium dioxide) experiments were
conducted in laboratory grade water, surface water, and groundwater.
LP direct photolysis using a high UV fluence (1500 mJ cm-2) was found to be extremely
efficient to accomplish the degradation of all pesticides except isoproturon, whereas
photolysis using hydrogen peroxide and titanium dioxide did not significantly enhance
their removal. In all matrices tested the experimental photolysis of the pesticides
followed the same trend: isoproturon degradation was negligible, alachlor,
pentachlorophenol, and atrazine showed similar degradation rate constants, whereas
diuron and chlorfenvinphos were highly removed. The degradation trend observed
for the selected compounds followed the decadic molar absorption coefficients order
with exception of isoproturon probably due to its extremely low quantum yield.
Similar direct photolysis rate constants were obtained for each pesticide in the
different matrices tested, showing that the water components did not significantly
impact degradation. Extremely similar photolysis rate constants were also obtained in
surface water for individual compounds when compared to mixtures. The model
fluence and time-based rate constants reported were very similar to the direct
photolysis experimental results obtained, while overestimating the advanced
oxidation results. This model was used to predict how degradation of isoproturon, the
most resilient compound, could be improved.

Chapter 2
55
2.1 INTRODUCTION
In recent years, a large group of organic compounds have been labelled as water
emerging contaminants by the US Environmental Protection Agency and the
European Union. The European Water Framework Directive (Decision 2455/2001/EC)
identifies 33 priority substances that present high toxicity, high environmental
persistence, and bioaccumulation potential. This directive includes pesticides such as
atrazine, diuron, isoproturon, alachlor, pentachlorophenol, and chlorfenvinphos,
which are of special interest due to their easy transport in the environment as well as
potential for seriously threatening the aquatic environment and human health
(Hincapié et al. 2005). The adverse health effects of these compounds include
increased cancer risk as well as anaemia, eye, liver, kidney, spleen cardiovascular
system, and reproductive problems (US EPA 2009). Among these pesticides, alachlor,
atrazine and pentachlorophenol are also known to have endocrine disrupting
capabilities.
These xenobiotics have been detected in drinking water sources such as surface water
and groundwater at levels in the range of 2 to 13000 ng L-1 (Planas et al. 2006, Field et
al. 2003).
Low pressure ultraviolet radiation, that emits primarily monochromatic light at 254
nm, is widely used for drinking water disinfection due to its effectiveness against a
wide range of waterborne pathogens (Linden et al. 2002). The use of high UV fluences
(1000-2000 mJ cm-2) can also promote the degradation of photolabile organic
compounds by direct photolysis due to their potential to absorb light (Sharpless and
Linden 2003, Pereira et al. 2007a, Pereira et al. 2007b). However, some molecules do
not strongly absorb the LP/UV radiation. For these stable micropollutants, advanced
oxidation processes, using hydrogen peroxide and titanium dioxide , may be used to
remove them from drinking water, due to the production of highly reactive,

56
unselective and short-lived hydroxyl radicals (Pereira et al. 2007b). H2O2 has been
widely described for water disinfection and degradation of pollutants (Sharpless and
Linden 2003, Schwarzenbach et al. 1993, von Gunten 2003). TiO2 recently emerged as
a promising material to efficiently degrade pesticides in water. It presents several
advantages related to its chemical and biological inertness, photostability, absence of
toxicity, and low cost. To be catalytically active, TiO2 requires irradiation with a
wavelength lower than 380 nm, which induces the photoexcitation of an electron
since it has an energy band gap of about 3.2 eV. Therefore, light sources such as low
and medium pressure ultraviolet lamps as well as solar radiation are suitable to
induce TiO2 activity (Balasubramanian et al. 2004).
Several authors reported the degradation of the selected pesticides (atrazine, diuron,
isoproturon, alachlor, pentachlorophenol, and chlorfenvinphos) by UV photolysis and
AOPs (such as UV/H2O2 and UV/TiO2), using solar (Hincapié et al. 2005, Malato et al.
2003, Haque and Muneer 2003) and UV-Visible radiation (Haque and Muneer 2003,
Wong and Chu 2003a). Both direct photolysis and AOPs photolysis have proven to be
very efficient although AOPs were usually more efficient (Haque and Muneer 2003,
Wong and Chu 2003a).
LP lamps are the most commonly used lamps in drinking water facilities due to their
extremely effective disinfection potential. To date, few studies have been conducted
addressing the efficiency of LP lamps for the removal of the priority pesticides
mentioned above and therefore further research is needed to address their
degradation potential. LP/UV lamps have been reported to promote high degradation
levels of some of the selected pesticides: atrazine by direct photolysis, UV/TiO2, and
UV/H2O2 (e.g. Bianchi et al. 2006); pentachlorophenol by direct photolysis (Vollmuth
et al. 1994); diuron by direct and Photo-Fenton photolysis (Djebbar et al. 2008); and
chlorfenvinphos by direct and UV/H2O2 (Acero et al. 2008).

Chapter 2
57
Authors often describe the degradation of xenobiotics only as a function of time.
These results provide insight on the efficiency of different systems to degrade the
compounds, but cannot be compared directly with results obtained under different
experimental setups. Reporting degradation in terms of UV fluence permits a
standardisation of bench scale UV testing providing increased confidence in the data
generated and the ability to compare results with other authors that report their
results using the same method (Bolton and Linden 2003). The photolysis of
xenobiotics is often studied for individual compounds and few studies compared
these results to those obtained with mixtures where a competition effect could
probably decrease the rate of degradation. In addition, studies addressing AOPs
potential for the removal of the selected pesticides from water have been conducted
mainly in laboratory grade water (LGW) and synthetic water matrices spiked with
natural organic matter. Few studies concerning the removal of the selected
micropollutants using real water matrices such as surface water and groundwater
have been conducted to date (e.g. Acero et al. 2008, Rosenfeldt et al. 2006, Song et
al. 2008). More studies using real source waters with different characteristics should
therefore be conducted to address the potential of direct photolysis and AOPs to
degrade organic compounds that may be present in those waters.
This study reports the effectiveness of LP/UV direct photolysis and AOPs (using H2O2
and TiO2) for the degradation of the selected pesticides (isoproturon, alachlor,
atrazine, pentachlorophenol, diuron, and chlorfenvinphos) identified as priority
pollutants by the European Water Framework Directive. The degradation of these
compounds was studied in laboratory grade water, surface water and groundwater.
The pesticides were spiked individually in the different matrices and as mixtures in
surface water to address if in real water systems, where a wide combination of
compounds is expected to be present, different degradation trends could be
58
expected. Several kinetic photolysis parameters were determined and used to model
the photolysis results.
2.2 MATERIALS AND METHODS
2.2.1 Reagents
All pesticides and para-chlorobenzoic acid (pCBA) were purchased as solutions or
solids of the highest grade commercially available (Sigma Aldrich, Germany). Aqueous
suspension of bovine liver catalase with 40 000 - 60 000 units mg-1 protein was also
obtained from Sigma Aldrich (one unit decomposed 1 mol of H2O2). Hydrogen
peroxide (30% w/w) was obtained from Panreac (Spain). Titanium dioxide Degussa®
P25, a mixture of 70% anatase and 30% rutile, with an average particle size of 20 nm
and a reactive surface area of 35-65 m2 g-1 was used (Evonik Degussa, Germany). High
performance liquid chromatography (HPLC) grade acetonitrile (ACN) and methanol
(MeOH) from Lab Scan Analytical Sciences (Poland) were used for the
chromatographic analysis and preparation of stock solutions. Laboratory grade water
was produced by a Milli-Q (MQ) water system (Millipore, CA, USA) and the real water
samples were collected in brown glass bottles, filtered through 0.45 m mixed esters
of cellulose filters (Millipore, CA, USA), and stored at 4 °C until used.

Chapter 2
59
2.2.2 Experimental setup
2.2.2.1 UV photolysis experiments
UV photolysis experiments were conducted in a collimated beam bench-scale reactor
(Trojan Technologies Inc., Canada) using a low pressure Hg lamp that emits mainly
monochromatic light at 254 nm.
100 mL of laboratory grade water and two natural water matrices – surface water and
groundwater - were spiked with the appropriate volume of the pesticides stock
solutions to achieve concentrations of 1 mg L-1. This concentration was set in order to
follow the degradation of the compounds, spiked individually (in laboratory grade
water, surface water, and groundwater) and as mixtures (in surface water), by direct
injection using high performance liquid chromatography. 50 mL of sample were
placed in a Petri dish and continuously stirred beneath the LP/UV source. The
remaining 50 mL were used as control and kept in the dark under identical
experimental conditions in order to determine possible pesticide losses due to
evaporation or adsorption to the Petri dish walls. All experiments were conducted at
room temperature (21 2 °C).
The lamp irradiance was measured using a calibrated radiometer (IL1700,
International Light, Newburyport, MA) which was placed at the same height of the
water level in the Petri dish and the solution transmittance was measured by a UV
photometer (P254C, Trojan Technologies Inc.). UV fluences of approximately 0, 40,
100, 500, 750, 1000, and 1500 mJ cm-2 were selected, taking into account the
radiometer meter reading as well as petri, reflection, water and divergence factors
(Bolton and Linden 2003), to establish the corresponding exposure times. At these
exposure times, 200 L of sample were taken to quantify the concentration of the
compounds by HPLC analysis.

60
2.2.2.2 UV/H2O2 photolysis experiments
UV/H2O2 photolysis experiments were conducted similarly to direct photolysis
experiments with the addition of 40 mg L-1 H2O2 and 500 g L-1 pCBA to laboratory
grade water and surface water spiked with the individual pesticides and mixtures.
pCBA was added to the solution in order to determine indirectly, by competition
kinetics, the second order rate constants between the selected micropollutants and
the hydroxyl radicals, kOH,M (Elovitz and von Gunten 1999). At determined exposure
times, 200 L of sample were taken to vials containing catalase to quench the residual
hydrogen peroxide. The residual H2O2 was determined at the beginning and end of
each experiment using the I3- method described by Klassen et al. (1994).
2.2.2.3 UV/TiO2 photolysis experiments
UV/TiO2 photolysis experiments were conducted similarly to direct photolysis
experiments with the addition of 2.5 mg L-1 TiO2 and 500 g L-1 pCBA to laboratory
grade water spiked with the individual pesticides and surface water spiked with a
mixture of the pesticides. During the degradation, samples (200 L) were taken at
each defined exposure time and filtered using 0.2 m filters made of regenerated
cellulose (Whatman, USA) to remove TiO2 particles.
Even though different types of TiO2 particles are available, Degussa® P25 TiO2 (Evonik
Degussa, Germany) was used because it has been referred by many authors as being
the most efficient type of TiO2 due to the presence of the more reactive anatase form
(70%), surface area, and average particle size (Haque and Muneer 2003, Wong and
Chu 2003b).
Chapter 2
61
The UV/TiO2 photocatalysis experiments in surface water were only conducted using a
mixture of the pesticides isoproturon, alachlor, atrazine, diuron, and chlorfenvinphos.
Pentachlorophenol was not added to the samples containing the mixture of pesticides
due to analytical constrains and was not analysed individually because it was found to
be significantly retained by the filters needed to remove the TiO2 particles from the
solutions.
2.2.2.4 Analytical methods
The selected pesticides and pCBA were analysed by reverse-phase high performance
liquid chromatography using a Waters system equipped with an ultraviolet
absorbance detector (Waters Chromatography, Milford, MA, USA).
The individual compounds, mixtures of each pesticide with pCBA, as well as mixtures
containing all the selected pesticides were analysed using a Luna 5 m C18(2) 100Å
(150 x 3.0 mm) column (Phenomenex Inc., Torrance, CA, USA), different mobile phase
compositions and monitored at compromise maximum absorbance wavelengths
(detailed in Table A.1 in Appendix A.1). Pentachlorophenol was not added to the
mixture samples because it could not be detected using the chromatography
conditions used for the detection of the other pesticides. The Temperature Control
Module was set at 34 oC for all analysis except the pesticide mixture samples that
need to be analysed at room temperature to ensure appropriate separation of
atrazine, diuron, and isoproturon.
62
2.3 RESULTS AND DISCUSSION
2.3.1 Direct photolysis
LP direct photolysis experiments were conducted to evaluate the degradation
potential of pesticides with very different structures.
Figure 2.1 and Table 2.1 present the experimental and model direct photolysis results
obtained using two real water matrices with very different compositions: surface
water (Figure 2.1a) and groundwater (Figure 2.1b). The characterisation of the water
matrices used is depicted in Appendix A.2 (Table A.6). In summary, the surface water
matrix showed higher levels of total organic carbon and turbidity, whereas the
groundwater samples presented higher alkalinity (Alk) and total hardness.
Different matrix compositions were taken into account in the fluence calculations. For
the same UV fluence, different matrices were therefore subject to different exposure
times calculated taking into account the absorbance of each matrix used. The direct
photolysis fluence and time-based rate constants (k’f and k’t, respectively) obtained in
LGW, surface water and groundwater (Table 2.1 and Table A.7 in Appendix A.2) show
that for all the selected compounds except pentachlorophenol and chlorfenvinphos
the rates slightly increased in surface water and groundwater. However, very similar
time and fluence-based rate constants were obtained in all the tested matrices for all
the compounds except chlorfenvinphos that presented lower rate constants in the
real water matrices. Extremely similar rate constants were also obtained in surface
water for the individual compounds and the mixtures.

Chapter 2
63
Figure 2.1 Experimental (exp) and model low pressure direct photolysis of atrazine (ATR), isoproturon (ISO), diuron (DIU), alachlor (ALA), pentachlorophenol (PCP), and chlorfenvinphos (CFVP) in (a) surface water and (b) groundwater; experimental values are represented by symbols with error bars whereas the lines show the model results.
-3
-2
-1
0
0 200 400 600 800 1000 1200 1400 1600
Ln(C
/C0)
UV Fluence (mJ cm-2)
ATR_exp ATR_modelISO_exp ISO_modelDIU_exp DIU_modelALA_exp ALA_modelPCP_exp PCP_modelCFVP_exp CFVP_model
-4
-3
-2
-1
0
0 200 400 600 800 1000 1200 1400 1600
Ln(C
/C0)
UV Fluence (mJ cm-2)
ATR_exp ATR_modelISO_exp ISO_modelDIU_exp DIU_modelALA_exp ALA_modelPCP_exp PCP_modelCFVP_exp CFVP_model
(a)
(b)
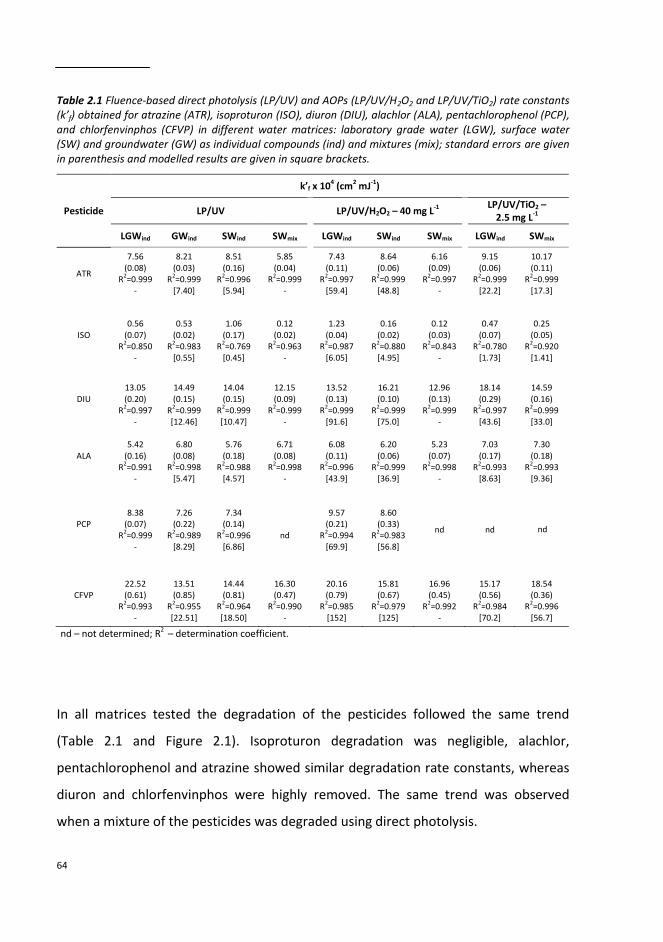
64
Table 2.1 Fluence-based direct photolysis (LP/UV) and AOPs (LP/UV/H2O2 and LP/UV/TiO2) rate constants (k’f) obtained for atrazine (ATR), isoproturon (ISO), diuron (DIU), alachlor (ALA), pentachlorophenol (PCP), and chlorfenvinphos (CFVP) in different water matrices: laboratory grade water (LGW), surface water (SW) and groundwater (GW) as individual compounds (ind) and mixtures (mix); standard errors are given in parenthesis and modelled results are given in square brackets.
Pesticide
k’f x 104 (cm2 mJ-1)
LP/UV LP/UV/H2O2 – 40 mg L-1 LP/UV/TiO2 –
2.5 mg L-1
LGWind GWind SWind SWmix LGWind SWind SWmix LGWind SWmix
ATR
7.56 (0.08)
R2=0.999
-
8.21 (0.03)
R2=0.999
[7.40]
8.51 (0.16)
R2=0.996
[5.94]
5.85 (0.04)
R2=0.999
-
7.43 (0.11)
R2=0.997
[59.4]
8.64 (0.06)
R2=0.999
[48.8]
6.16 (0.09)
R2=0.997
-
9.15 (0.06)
R2=0.999
[22.2]
10.17 (0.11)
R2=0.999
[17.3]
ISO
0.56
(0.07) R2=0.850
-
0.53
(0.02) R2=0.983
[0.55]
1.06
(0.17) R2=0.769
[0.45]
0.12
(0.02) R2=0.963
-
1.23
(0.04) R2=0.987
[6.05]
0.16
(0.02) R2=0.880
[4.95]
0.12
(0.03) R2=0.843
-
0.47
(0.07) R2=0.780
[1.73]
0.25
(0.05) R2=0.920
[1.41]
DIU
13.05 (0.20)
R2=0.997 -
14.49 (0.15)
R2=0.999 [12.46]
14.04 (0.15)
R2=0.999 [10.47]
12.15 (0.09)
R2=0.999 -
13.52 (0.13)
R2=0.999 [91.6]
16.21 (0.10)
R2=0.999 [75.0]
12.96 (0.13)
R2=0.999 -
18.14 (0.29)
R2=0.997 [43.6]
14.59 (0.16)
R2=0.999 [33.0]
ALA
5.42
(0.16) R2=0.991
-
6.80
(0.08) R2=0.998
[5.47]
5.76
(0.18) R2=0.988
[4.57]
6.71
(0.08) R2=0.998
-
6.08
(0.11) R2=0.996
[43.9]
6.20
(0.06) R2=0.999
[36.9]
5.23
(0.07) R2=0.998
-
7.03
(0.17) R2=0.993
[8.63]
7.30
(0.18) R2=0.993
[9.36]
PCP
8.38 (0.07)
R2=0.999 -
7.26 (0.22)
R2=0.989 [8.29]
7.34 (0.14)
R2=0.996 [6.86]
nd
9.57 (0.21)
R2=0.994 [69.9]
8.60 (0.33)
R2=0.983 [56.8]
nd
nd
CFVP
22.52 (0.61)
R2=0.993 -
13.51 (0.85)
R2=0.955 [22.51]
14.44 (0.81)
R2=0.964 [18.50]
16.30 (0.47)
R2=0.990 -
20.16 (0.79)
R2=0.985 [152]
15.81 (0.67)
R2=0.979 [125]
16.96 (0.45)
R2=0.992 -
15.17 (0.56)
R2=0.984 [70.2]
18.54 (0.36)
R2=0.996 [56.7]
nd – not determined; R2 – determination coefficient.
In all matrices tested the degradation of the pesticides followed the same trend
(Table 2.1 and Figure 2.1). Isoproturon degradation was negligible, alachlor,
pentachlorophenol and atrazine showed similar degradation rate constants, whereas
diuron and chlorfenvinphos were highly removed. The same trend was observed
when a mixture of the pesticides was degraded using direct photolysis.
nd

Chapter 2
65
There are two parameters – decadic molar absorption coefficient () and quantum
yield () – that highly impact direct photolysis. Table 2.2 shows the decadic molar
absorption coefficient and the quantum yield obtained for each pesticide. The decadic
molar absorption coefficient presented represents the probability of the selected
pesticides to absorb UV light at 254 nm, whereas the quantum yield can be defined as
the ratio between the total number of molecules of isoproturon degraded to the total
number of photons absorbed by the solution due to the compound’s presence
(Schwarzenbach et al. 1993). The degradation trend observed for the selected
compounds followed the decadic molar absorption coefficients order with exception
of isoproturon probably due to its extremely low quantum yield. All the decadic molar
absorption coefficients and quantum yields obtained agree very well with previously
reported values (Table 2.2).
Table 2.2 Decadic molar absorption coefficient (quantum yield ( and second-order rate constants for reaction of the micropollutants with OH radicals (kOH,M) for the selected pesticides; literature values are given in square brackets (Acero et al. 2008, Song et al. 2008, Wong and Chu 2003b, Benitez et al. 2003, Benitez et al. 2006, De Laat et al. 1999, Beltran et al. 1993, Haag and Yao 1992).
Compound
(M-1
cm-1
)
(mol Einstein-1
)
kOH,M x 10-9
(M-1
s-1
)
LP/UV/H2O2 LP/UV/TiO2
Atrazine
2647 [2847 – 3860]
0.060 [0.041- 0.05]
7.3 [18]
35.0
Isoproturon 5944
[6068] 0.002
[0.0037] 0.8
[5.2] 3.3
Diuron
16162 [15699]
0.019 [0.0115]
12.7 [4.6]
87.0
Alachlor 543
[428 – 467] 0.210
[0.095 - 0.140] 5.4
[7.0] 6.1
Pentachlorophenol
7400 [8500]
0.025 [0.0525]
9.0 [4.0]
nd
Chlorfenvinphos
8656 [7287]
0.056 [0.089]
18.5 [3.2]
132.5
nd not determined
66
The experimental results depicted in Figure 2.1 were modelled using Equations A.1 to
A.4 detailed in Appendix A.2 (Sharpless and Linden 2003, Schwarzenbach et al. 1993).
The model used predicted extremely well the results obtained in groundwater for all
the pesticides except chlorfenvinphos. In the surface water degradation experiments,
the model slightly underestimated the experimental results for alachlor, atrazine and
diuron. However, as can be seen in Table 2.1, the modelled direct photolysis fluence-
based rate constants were similar to the experimental rate constants obtained.
2.3.2 Advanced oxidation processes
Experimental and model advanced oxidation of the selected pesticides was also
tested using hydrogen peroxide and titanium dioxide (Table 2.1 and Figure 2.2).

Chapter 2
67
Figure 2.2 Experimental (exp) and model low pressure photolysis of atrazine (ATR), isoproturon (ISO), diuron (DIU), alachlor (ALA), pentachlorophenol (PCP), and chlorfenvinphos (CFVP) in surface water using (a) 40 mg L
-1 hydrogen peroxide (H2O2) and (b) 2.5 mg L
-1 titanium dioxide (TiO2); experimental values are
represented by symbols with error bars whereas the lines show the model results.
-20
-15
-10
-5
0
0 500 1000 1500 2000
Ln(C
/C0)
UV Fluence (mJ cm-2)
ATR_exp ATR_modelISO_exp ISO_modelDIU_exp DIU_modelALA_exp ALA_modelPCP_exp PCP_modelCFVP_exp CFVP_model
-12
-10
-8
-6
-4
-2
0
0 500 1000 1500 2000
Ln(C
/C0)
UV Fluence (mJ cm-2)
ATR_exp ATR_model
ISO_exp ISO_model
DIU_exp DIU_model
ALA_exp ALA_model
CFVP_exp CFVP_model
(a)
(b)

68
The experimental results represent, in these experiments, a combination of direct
photolysis and AOP results and were modelled using Equations A.1 to A.11 presented
in the Appendix A.2 (Sharpless and Linden 2003, Schwarzenbach et al. 1993, Klassen
et al. 1994, Buxton et al. 1988, Huber et al. 2003, Neta and Dorfman 1968, Larson and
Zepp 1988).
The LP/UV/H2O2 photolysis fluence-based rate constants obtained for atrazine,
diuron, and alachlor slightly increased in surface water compared to laboratory grade
water, similarly to what was observed in the LP/UV experiments (Table 2.1). Likewise,
very similar time (Table A.7 in Appendix A.2) and fluence-based rate constants were
obtained in both tested matrices for all the compounds except chlorfenvinphos that
presented lower photolysis rate constants in the real water matrix. In the LP/UV/TiO2
photolysis experiments similar time and fluence-based rate constants were obtained
for all compounds in LGW and surface water. In addition, the exact same degradation
trend was observed for the mixtures in the surface water matrix when comparing the
LP/UV, the LP/UV/H2O2, and the LP/UV/TiO2 results. The following order of
degradation was observed: isoproturon, alachlor, atrazine, pentachlorophenol,
diuron, and chlorfenvinphos. The results obtained when a mixture of the pesticides
was subject to AOPs were again in agreement with the results obtained for the
individual compounds.
Different concentrations of hydrogen peroxide (20, 60, 80, and 120 mg L-1) and
titanium dioxide (0.5, 5, and 10 mg L-1) were tested but the results obtained showed
no significant improvement in the photolysis rates obtained relatively to 40 mg L-1
H2O2 and 2.5 mg L-1 TiO2.
The second-order rate constants for reaction of the micropollutants with OH radicals
(Table 2.2) were determined by competition kinetics using pCBA as a reference
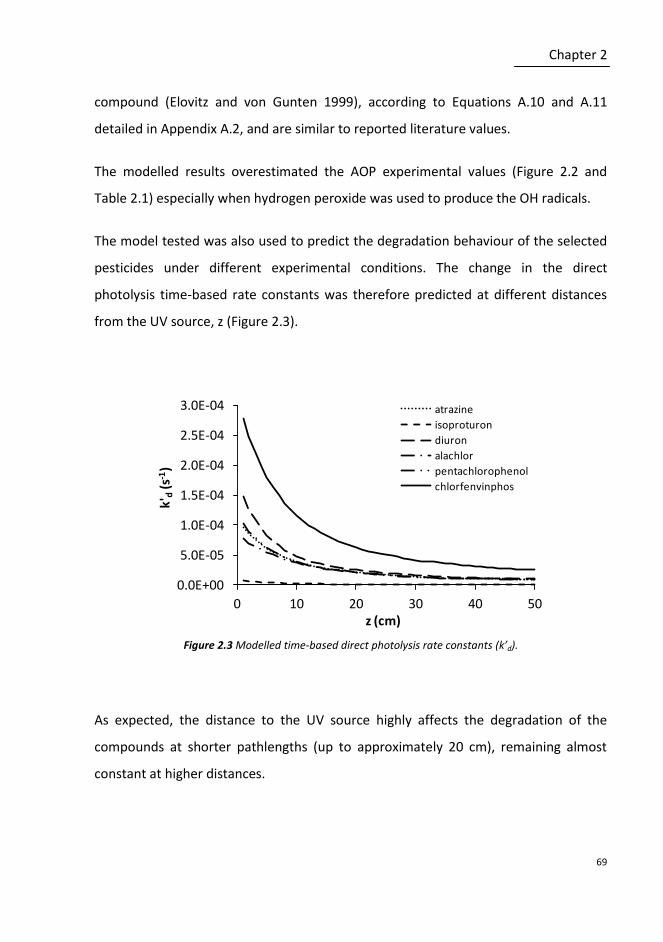
Chapter 2
69
compound (Elovitz and von Gunten 1999), according to Equations A.10 and A.11
detailed in Appendix A.2, and are similar to reported literature values.
The modelled results overestimated the AOP experimental values (Figure 2.2 and
Table 2.1) especially when hydrogen peroxide was used to produce the OH radicals.
The model tested was also used to predict the degradation behaviour of the selected
pesticides under different experimental conditions. The change in the direct
photolysis time-based rate constants was therefore predicted at different distances
from the UV source, z (Figure 2.3).
Figure 2.3 Modelled time-based direct photolysis rate constants (k’d).
As expected, the distance to the UV source highly affects the degradation of the
compounds at shorter pathlengths (up to approximately 20 cm), remaining almost
constant at higher distances.
0.0E+00
5.0E-05
1.0E-04
1.5E-04
2.0E-04
2.5E-04
3.0E-04
0 10 20 30 40 50
k'd
(s-1
)
z (cm)
atrazine
isoproturon
diuron
alachlor
pentachlorophenol
chlorfenvinphos

70
Figure 2.4 shows the AOPs time-based rate constants predicted for isoproturon, the
most resilient compound, in surface water as a function of changes in the distance to
the UV source and the hydrogen peroxide (Figure 2.4a) and titanium dioxide (Figure
2.4b) concentrations.
Figure 2.4 Modelled time-based direct photolysis (k’d) and AOPs (k’i) rate constants obtained for isoproturon.
At the distance to the source used in the collimated beam reactor (29 cm), the overall
AOPs rate constants predicted were found to be fairly independent of the H2O2 and
TiO2 concentrations. However, under different experimental setups, the overall
degradations rate constants obtained are likely to be more efficient using higher
hydrogen peroxide and titanium dioxide concentrations at lower pathlengths.
Figure 2.5 presents a final comparison of the results obtained in the surface water
matrix at a UV fluence of 1500 mJ cm-2 that was achieved after approximately 4 to 5
hours of degradation.
111
2131
41
0.0E+00
2.0E-05
4.0E-05
6.0E-05
8.0E-05
1.0E-04
1.2E-04
020
4060
80100
k'd+
k'i(s
-1)
111
2131
41
0.0E+00
3.0E-05
6.0E-05
9.0E-05
1.2E-04
1.5E-04
1.8E-04
020
4060
80100
k'd+
k'i(s
-1)
(a) (b)

Chapter 2
71
Figure 2.5 LP/UV, LP/UV/H2O2, and LP/UV/TiO2 percent degradation of atrazine (ATR), isoproturon (ISO), diuron (DIU), alachlor (ALA), chlorfenvinphos (CFVP), and pentachlorophenol (PCP) spiked in surface water as individual compounds and mixtures (Mix) using a UV fluence of 1500 mJ cm
-2.
All the pesticides except isoproturon are expected to degrade significantly using
LP/UV. Due to its extremely low quantum yield at 254 nm, isoproturon degradation
using LP lamps will probably be very low even at higher UV fluences. Medium
pressure lamps, that emit light at a broader range of wavelengths, have also proven
to be inefficient for the degradation of isoproturon (Haque and Muneer 2003). To
achieve isoproturon degradation, much higher H2O2 or TiO2 concentrations would
probably need to be used with a different reactor configuration that would allow
shorter distances to the lamp (Figure 2.4).
The photolysis results obtained when mixtures of pesticides were degraded in surface
water were extremely similar to the results obtained for the LP direct photolysis and
AOPs using H2O2 of the individual compounds. The slight decrease in the degradation
of the pesticides in most of the mixture samples may be due to competition between
compounds and the OH radicals produced for the UV light. For all the selected
pesticides, AOPs did not seem to enhance significantly their degradation using LP
0
20
40
60
80
100
ATR ISO DIU ALA CFVP PCP
% D
egra
dat
ion
LP/UV LP/UV Mix LP/UV/H2O2 LP/UV/H2O2 Mix LP/UV/TiO2 Mix
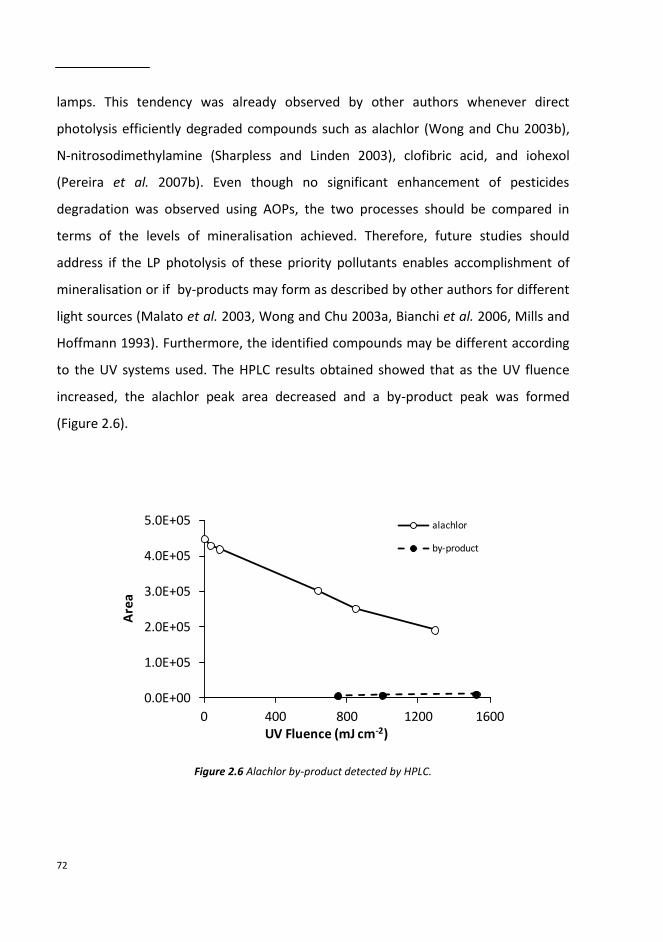
72
lamps. This tendency was already observed by other authors whenever direct
photolysis efficiently degraded compounds such as alachlor (Wong and Chu 2003b),
N-nitrosodimethylamine (Sharpless and Linden 2003), clofibric acid, and iohexol
(Pereira et al. 2007b). Even though no significant enhancement of pesticides
degradation was observed using AOPs, the two processes should be compared in
terms of the levels of mineralisation achieved. Therefore, future studies should
address if the LP photolysis of these priority pollutants enables accomplishment of
mineralisation or if by-products may form as described by other authors for different
light sources (Malato et al. 2003, Wong and Chu 2003a, Bianchi et al. 2006, Mills and
Hoffmann 1993). Furthermore, the identified compounds may be different according
to the UV systems used. The HPLC results obtained showed that as the UV fluence
increased, the alachlor peak area decreased and a by-product peak was formed
(Figure 2.6).
Figure 2.6 Alachlor by-product detected by HPLC.
0.0E+00
1.0E+05
2.0E+05
3.0E+05
4.0E+05
5.0E+05
0 400 800 1200 1600
Are
a
UV Fluence (mJ cm-2)
alachlor
by-product
Chapter 2
73
This compound is probably similar in structure to alachlor since it was detected using
the same HPLC chromatographic method. Even though this was the only by-product
detected in our results, many other by-products may have been formed and could be
identified using mass spectrometry analysis.
2.4 CONCLUSIONS
Besides being known as an extremely efficient process to inactivate microorganisms,
the results of this work show that LP direct photolysis using high UV fluences may also
prove to be very effective to ensure the degradation of several priority substances
with different structures and it is therefore a promising technology for drinking water
treatment.
ACKNOWLEDGEMENTS
We thank Cristina Leitão and Joana Ricardo for their technical assistance. This work
was financed by Fundação para a Ciência e a Tecnologia (PTDC/AMB/66024/2006)
and the European Economic Area Financial Mechanism, Empresa Portuguesa das
Águas Livres, Município de Almada, and Instituto de Biologia Experimental e
Tecnológica (through project PT0012). Vanessa J. Pereira acknowledges the financial
support provided from Fundação para a Ciência e a Tecnologia through the grant
SFRH/BPD/26990/2006. Empresa Portuguesa das Águas Livres is acknowledged for
providing the real water matrices.

74
REFERENCES
Acero JL, Real FJ, Benitez EJ, Gonzalez A (2008) Oxidation of chlorfenvinphos in ultrapure and natural waters by ozonation and photochemical processes. Water Res 42: 3198-3206.
Balasubramanian G, Dionysiou DD, Suidan MT, Baudin I, Audin B, Laine JM (2004) Evaluating the activities of immobilised TiO2 powder films for the photocatalytic degradation of organic contaminants in water. Appl Catal B-Environ 47: 73-84.
Beltran FJ, Ovejero G, Acedo B (1993) Oxidation of atrazine in water by ultraviolet radiation combined with hydrogen peroxide. Water Res 27: 1013-1021.
Benitez FJ, Acero JL, Real FJ, Garcia J (2003) Kinetics of photodegradation and ozonation of pentachlorophenol. Chemosphere 51: 651-662.
Benitez FJ, Real FJ, Acero JL, Garcia C (2006) Photochemical oxidation processes for the elimination of phenyl-urea herbicides in waters. J Hazard Mater 138: 278-287.
Bianchi CL, Pirola C, Ragaini V, Selli E (2006) Mechanism and efficiency of atrazine degradation under combined oxidation processes. Appl Catal B-Environ 64: 131-138.
Bolton J, Linden K (2003) Standardisation of methods for fluence (UV dose) determination in bench-scale UV experiments. J Environ Eng-ASCE 129: 209-215.
Buxton GV, Greenstock CL, Helman WP, Ross AB (1988) Critical-review of rate constants for reactions of hydrated electrons, hydrogen-atoms and hydroxyl radicals (OH/O
-) in aqueous-solution. J Phys
Chem Ref Data 17: 513-886.
Decision 2455/2001/EC of the European Parliament and of the Council of 20 November 2001 establishing the list of priority substances in the field of water policy and amending Directive 2000/60/EC. Official Journal of the European Communities, L 331/1 (2001).
De Laat J, Gallard H, Ancelin S, Legube B (1999) Comparative study of the oxidation of atrazine and acetone by H2O2/UV, Fe(III)/UV, Fe(III)/H2O2/UV and Fe(II) or Fe(III)/H2O2. Chemosphere 39: 2693-2706.
Djebbar KE, Zertal A, Debbache N, Sehili T (2008) Comparison of Diuron degradation by direct UV photolysis and advanced oxidation processes. J Environ Manage 88: 1505-1512.
Elovitz MS, von Gunten U (1999) Hydroxyl radical/ozone ratios during ozonation processes. I. The Rct concept. Ozone-Sci Eng 21: 239-260.
Field JA, Reed RL, Sawyer TE, Griffith SM, Wigington PJ (2003) Diuron occurrence and distribution in soil and surface and groundwater associated with grass seed production. J Environ Qual 32: 171-179.
Haag W, Yao C (1992) Rate constants for reaction of hydroxyl radicals with several drinking water contaminants. Environ Sci Technol 26: 1005-1013.
Haque MM, Muneer M (2003) Heterogeneous photocatalysed degradation of a herbicide derivative, isoproturon in aqueous suspension of titanium dioxide. J Environ Manage 69: 169-176.
Hincapié M, Maldonado M, Oller I, Gernjak W, Sanchez-Perez J, Ballesteros M, Malato S (2005) Solar photocatalytic degradation and detoxification of EU priority substances. Catal Today 101: 203-210.
Huber MM, Canonica S, Park GY, Von Gunten U (2003) Oxidation of pharmaceuticals during ozonation and advanced oxidation processes. Environ Sci Technol 37: 1016-1024.
Chapter 2
75
Klassen NV, Marchington D, McGowan HCE (1994) H2O2 Determination by the I-3 method and by KMNO4
titration. Anal Chem 66: 2921-2925.
Larson RA, Zepp RG (1988) Reactivity of the carbonate radical with aniline derivatives. Environ Toxicol Chem 7: 265-274
Linden K, Shin G, Faubert G, Cairns W, Sobsey M (2002) UV disinfection of Giardia lamblia cysts in water. Environ Sci Technol 36: 2519-2522.
Malato S, Caceres J, Fernandez-Alba A, Piedra L, Hernando M, Aguera A, Vial J (2003) Photocatalytic treatment of diuron by solar photocatalysis: Evaluation of main intermediates and toxicity. Environ Sci Technol 37: 2516-2524.
Mills G, Hoffmann M (1993) Photocatalytic degradation of pentachlorophenol on TiO2 particles - identification of intermediates and mechanism of reaction. Environ Sci Technol 27: 1681-1689.
Neta P, Dorfman LM (1968) Pulse radiolysis studies XIII rate constants for reaction of hydroxyl radicals with aromatic compounds in aqueous solutions. Adv Chem Ser 81: 222-230.
Pereira VJ, Linden KG, Weinberg HS (2007a) Evaluation of UV irradiation for photolytic and oxidative degradation of pharmaceutical compounds in water. Water Res 41: 4413-4423.
Pereira VJ, Weinberg HS, Linden KG, Singer PC (2007b) UV degradation kinetics and modelling of pharmaceutical compounds in laboratory grade and surface water via direct and indirect photolysis at 254 nm. Environ Sci Technol 41: 1682-1688.
Planas C, Puig A, Rivera J, Caixach J (2006) Analysis of pesticides and metabolites in Spanish surface waters by isotope dilution gas chromatography/mass spectrometry with previous automated solid-phase extraction - Estimation of the uncertainty of the analytical results. J Chromatogr A 1131: 242-252.
Rosenfeldt EJ, Linden KG, Canonica S, von Gunten U (2006) Comparison of the efficiency of •OH radical
formation during ozonation and the advanced oxidation processes O3/H2O2 and UV/H2O2. Water Res 40: 3695-3704.
Schwarzenbach RP, Gschwend PM, Imboden DM, In Environmental organic chemistry. John Wiley & Sons Inc., New York (1993).
Sharpless C, Linden K (2003) Experimental and model comparisons of low- and medium-pressure Hg lamps for the direct and H2O2 assisted UV photodegradation of N-nitrosodimethylamine in simulated drinking water. Environ Sci Technol 37: 1933-1940.
Song W, Ravindran V, Pirbazari M (2008) Process optimisation using a kinetic model for the ultraviolet radiation-hydrogen peroxide decomposition of natural and synthetic organic compounds in groundwater. Chem Eng Sci 63: 3249-3270.
US EPA (2009) National primary drinking water regulations. Available online: http://water.epa.gov/drink/contaminants/basicinformation/alachlor.cfm.
Vollmuth S, Zajc A, Niessner R (1994) Formation of polychlorinated dibenzo-P-dioxins and polychlorinated dibenzofurans during the photolysis of pentachlorophenol-containing water. Environ Sci Technol 28: 1145-1149.
von Gunten U (2003) Ozonation of drinking water: Part I Oxidation kinetics and product formation. Water Res 37: 1443-1467.
Wong C, Chu W (2003a) The hydrogen peroxide-assisted photocatalytic degradation of alachlor in TiO2 suspensions. Environ Sci Technol 37: 2310-2316.
76
Wong C, Chu W (2003b) The direct photolysis and photocatalytic degradation of alachlor at different TiO2 and UV sources. Chemosphere 50: 981-987.

CHAPTER 3
Nanofiltration of hormones and pesticides in different real drinking water sources

78
Published in: Separation and Purification Technology
Sanches S, Penetra A, Rodrigues A, Ferreira E, Cardoso VV, Benoliel MJ, Barreto
Crespo MT, Pereira VJ, Crespo JG (2012) Nanofiltration of hormones and pesticides in
different real drinking water sources. Sep Purif Technol 94: 44-53.
Sandra Sanches was involved in all the experimental work presented in this chapter,
except for: 1) the quantification of the target pesticides and hormones in the samples
from nanofiltration experiments that was performed by Ana Penetra, Alexandre
Rodrigues, and Vitor Cardoso at Empresa Portuguesa das Águas Livres, Portugal; 2)
characterisation of the raw and ultrafiltered water samples that was carried out under
the coordination and direction of Elisabete Ferreira and Maria João Benoliel,
respectively, at Laboratório Central of EPAL, Portugal. Vanessa Pereira, João Crespo,
and Teresa Crespo supervised all the experimental work carried out.

Chapter 3
79
CONTENTS
Abstract ............................................................................................................... 80
3.1 Introduction ................................................................................................... 81
3.2 Materials and Methods ................................................................................... 84
3.2.1 Chemical reagents and water matrices ................................................................ 84
3.2.2 Work plan and experimental procedure .............................................................. 85
3.2.2.1 Ultrafiltration experiments ....................................................................... 87
3.2.2.2 Static adsorption experiments ................................................................. 87
3.2.2.3 Nanofiltration experiments ...................................................................... 88
3.2.3 Analytical Methods ............................................................................................... 92
3.2.3.1 Characterisation of natural water matrices .............................................. 92
3.2.3.2 Detection and quantification of target micropollutants ........................... 93
3.3 Results and Discussion .................................................................................... 94
3.3.1 Ultrafiltration experiments .................................................................................. 96
3.3.2 Static adsorption experiments ............................................................................. 98
3.3.3 Nanofiltration experiments ................................................................................ 101
3.4 Conclusions .................................................................................................. 112
Acknowledgements ............................................................................................ 113
References ......................................................................................................... 113

80
ABSTRACT
This study addresses the efficiency of nanofiltration to remove different pesticides
and hormones from different real water sources (surface water and groundwater)
and the effect of the ionic composition of different water sources on the rejection of
the target micropollutants. Ultrafiltration was performed prior to the nanofiltration
process to remove particulate and large colloidal organic matter, that interfere in the
rejection of micropollutants during nanofiltration, without affecting the concentration
of ionic species and natural organic matter present in the water. The other aim of this
study was to understand the role of adsorption on the rejection of the solutes
selected, which was tested by conducting membrane pre-adsorption experiments
using these micropollutants under static and dynamic conditions.
High percent rejections (67.4-99.9%) were obtained for the pesticides and hormones,
often independently of the water composition. Size exclusion and hydrophobic
interactions were found to highly influence the rejections obtained. The lower
rejections (57.5-83.5%) obtained for pentachlorophenol could be explained by its
increased solubility at the waters’ pH. The overall nanofiltration efficiency to remove
the selected compounds was not found to be considerably affected by the pre-
adsorption of the compounds on the membrane under static and dynamic conditions,
except for 17-ethinylestradiol, estrone, and estriol in surface water.

Chapter 3
81
3.1 INTRODUCTION
The occurrence of several xenobiotics like hormones, pesticides, polycyclic aromatic
hydrocarbons, pharmaceuticals, and personal care products in drinking water sources
has raised public concern in the last decades. Pesticides such as atrazine, alachlor, and
pentachlorophenol are listed as priority pollutants by the European Union (Decision
2455/2001/EC) due to their high toxicity, persistence in the environment, and
bioaccumulation potential. These organic compounds are used for agriculture
purposes and wood-preservation and have been detected in groundwater and surface
water at concentrations in the range of 2-13000 ng L-1 (Planas et al. 2006, Field et al.
2003). The hormones 17-estradiol, 17-ethinylestradiol, estrone, estriol, and
progesterone have been also found in surface waters at ng L-1 levels (Snyder et al.
1999, Jardim et al. 2012). Natural hormones such as estrone and 17-estradiol as well
as the synthetic hormone 17-ethinylestradiol present a very high endocrine
disrupting potential (Johnson and Sumpter 2001, Ternes et al. 1999a, Ternes et al.
1999b). These three hormones have been reported to cause feminisation in male fish
after exposure to levels as low as 1 ng L-1 during 21 days (Kolodziej et al. 2004,
Routledge et al. 1998). Since the occurrence of pesticides and hormones in water
sources have been linked to adverse effects in the aquatic environment and towards
humans, further studies are needed to test the ability of different processes to cope
with increasingly stringent regulations. In the last 20 years, nanofiltration (NF) has
been described as very efficient for the removal of several xenobiotics (Van der
Bruggen and Vandecasteele 2003, Bellona et al. 2004).
The rejection of organic compounds by nanofiltration membranes may be influenced
by several mechanisms such as size exclusion, electrostatic interactions, and
hydrophobic interactions, which may also lead to solute adsorption at the membrane
surface. In particular, the different ion species present in the water may impact the
removal of organic micropollutants by changing the interactions between the
82
membrane and the organic compounds by “partially screening” the charge of the
molecules functional groups (Nghiem et al. 2002a, Schäfer et al. 2003). Sodium,
calcium, and bicarbonate were found to decrease the removal of organic molecules
(Nghiem et al. 2002a, Devitt et al. 1998), although this behaviour may depend on the
ion concentration and membrane type.
Several studies mentioned above, addressing the removal of the hormones using
different nanofiltration membranes and experimental setups, reported that rejections
are essentially related to adsorptive interactions of these molecules with the
membrane and size exclusion mechanisms (Schäfer et al. 2003, Comerton et al. 2008,
Nghiem et al. 2004, Bellona and Drewes 2007).
In a previous study, the potential of the nanofiltration membrane Desal 5DK for the
removal of atrazine, alachlor, and pentachlorophenol from different natural water
sources with very diverse compositions (groundwater, spring water, surface water,
and surface water collected after sedimentation) was addressed using a dead-end
filtration system (Sanches et al. 2011). Rejection values reported in that study are
different from those reported by other authors using different nanofiltration systems
(Boussahel et al. 2002, Yangali-Quintanilla et al. 2009). Very different rejection values
can be expected depending on the fluid dynamic conditions. Therefore, it is very
important to compare results generated by similar systems and under similar
conditions because it is possible to obtain large variations in the rejection of one
solute by varying the convective transport towards the membrane and the shear rate
at the membrane surface during nanofiltration.
The adsorption of organic compounds on the membrane has been considered an
extremely important removal mechanism. During the first stages of nanofiltration
some compounds are strongly adsorbed on the membrane and therefore, adsorptive
interactions are the main mechanism of rejection (Schäfer et al. 2003, Nghiem et al.
Chapter 3
83
2004). However, as filtration proceeds, a decrease in rejection has been observed
probably due to membrane site saturation since the adsorbed compounds may
diffuse across the membrane once the equilibrium is accomplished. Therefore,
several authors have suggested that the rejection of organic compounds should be
determined in long term operations after the saturation of the membrane, to avoid
an overestimation of nanofiltration efficiency (Schäfer et al. 2003, Nghiem et al. 2004,
Bellona and Drewes 2007, Yangali-Quintanilla et al. 2009, Kimura et al. 2003). Further
research is therefore necessary to address membrane efficiency under extended
membrane saturation conditions using well characterised matrices.
Studies on the removal of micropollutants by nanofiltration have mainly been
conducted in synthetic water matrices. Although these studies may give insights on
the impact of specific water components in the removal of target micropollutants,
further research addressing the performance of nanofiltration in well characterised
real drinking water sources is necessary. Real water matrices are complex and
therefore, the removal of micropollutants results from the combination of
interactions between the micropollutants, the water components, and the
membrane.
This study has two main objectives. The first one is the assessment of the effect of the
composition of different well characterised real water matrices in terms of the
concentration of different ion species. The water sources were subject to
ultrafiltration prior to the nanofiltration treatment to remove particulate and large
colloidal organic matter that interfere in the rejection of micropollutants during
nanofiltration but will not affect considerably the water composition in terms of the
concentration of ionic species and soluble matter. This approach therefore allows
focusing on the evaluation of the effect of different ionic compounds and total
organic carbon in the rejection of the selected micropollutants. The other focus of the
present study is the comprehension of the adsorption role on the rejection of
84
selected different micropollutants. The effects of static and dynamic pre-adsorption in
the nanofiltration removal of pesticides and hormones from different natural water
sources were tested.
This study was performed with a careful design of control experiments with the aim
of assessing the stability of the compounds and the inertness of the system during
long term operation procedures.
Nanofiltration efficiency is evaluated in terms of the potential to remove the target
pesticides (atrazine, alachlor, and pentachlorophenol) and hormones (estrone, 17-
estradiol, 17-ethinylestradiol, progesterone, and estriol) and relevant water
components responsible for alkalinity, conductivity, total dissolved solids, and several
ions from groundwater and surface water. Rejections obtained are also discussed in
terms of the different structures and physico-chemical properties of the selected
organic compounds as well as water matrices composition. The main rejection
mechanisms are proposed.
3.2 MATERIALS AND METHODS
3.2.1 Chemical reagents and water matrices
The pesticides and hormones used were purchased as solutions or solids of the
highest grade commercially available (higher than 98.9%, Sigma Aldrich, Germany).
High performance liquid chromatography grade acetonitrile and methanol (Fisher,
UK) were used for the chromatographic analysis of the pesticides and the hormones
and for the preparation of stock solutions. Milli-Q water used in the chromatographic
analysis was produced by a Milli-Q water system (Millipore, CA, USA).

Chapter 3
85
The natural water matrices used in the nanofiltration experiments, groundwater and
surface water, were supplied by the drinking water utility Empresa Portuguesa das
Águas Livres, S.A., that treats and supplies drinking water to approximately 2.8 million
people in the region of Lisbon, Portugal. Surface water was collected in the
abstraction zone of Tagus river in Valada do Ribatejo and groundwater was collected
from a well located in the region of Alenquer. The real water samples were collected
in 10 L bottles, characterised, and stored at 5 ± 3 °C until used.
3.2.2 Work plan and experimental procedure
Figure 3.1 presents a schematic representation of the experiments conducted in this
study.
Figure 3.1 Schematic representation of experimental procedure (---- experiments that were only conducted with the selected hormones).
Collection of natural watersSurface water and Groundwater Water characterisation
•Total Organic Carbon (TOC)•Turbidity•Alcalinity•Conductivity•Total hardness•Ions: chloride, sulphate, nitrate, magnesium, sodium, calcium, and potassium
ULTRAFILTRATIONFor removal of particulates and
colloidal matter
Saturation of the membrane with selectedmicropollutants under static conditions
NANOFILTRATION
Quantification of organic micropollutants in the feed, permeate, and retentate
Spike of selected micropollutants in the water matrices
NANOFILTRATION 2
I II
III

86
The water matrices studied (surface water and groundwater) were collected and
immediately characterised in terms of the following parameters: pH, total organic
carbon, total dissolved solids, turbidity, alkalinity, conductivity, total hardness, and
several ionic components (chloride, sulphate, nitrate, magnesium, sodium, calcium,
and potassium). These water matrices were ultrafiltered to remove particulates and
colloidal matter - which may affect the rejection of the organic compounds during
nanofiltration - while preserving the concentration of ions and soluble organic matter
in the real waters. After ultrafiltration, the permeate was also characterised in terms
of the parameters mentioned above to assess the changes in matrix composition.
Nanofiltration experiments were conducted under different experimental conditions:
with and without adsorption of the target organic micropollutants on the membrane
prior to the nanofiltration process. In a set of experiments (Figure 3.1 - I), the
membranes were previously placed in contact with solutions with the same
composition as the solutions fed to the nanofiltration cell (ultrafiltered water
permeates spiked with the selected organic compounds). The membranes were
immersed in stirred solutions to promote the adsorption of the compounds on the
membrane until a constant concentration in the bulk solution was achieved (Figure
3.1 - I). In these experiments, the adsorption of the compounds on the membrane
was accomplished without permeation and these are therefore defined here as
adsorption experiments conducted under static conditions.
In another set of experiments, the membranes used in the nanofiltration were not
subject to a previous contact with the target organic contaminants (Figure 3.1 – II).
For the nanofiltration experiments, the target pesticides and hormones were spiked
in the ultrafiltered water matrices and fed to the system. After nanofiltration, the
spiked micropollutants were quantified in the feed, permeate, and retentate. The
permeate was also characterised in terms of the physical-chemical parameters
mentioned above.

Chapter 3
87
The rejection of hormones was also tested after adsorption on the membrane under
both static and dynamic conditions. Dynamic adsorption is defined here as adsorption
that occurs during nanofiltration. A second nanofiltration (Nanofiltration 2 in Figure
3.1 - III) was therefore performed using the same membrane and a fresh feed
solution.
3.2.2.1 Ultrafiltration experiments
The ultrafiltration of the natural water matrices was conducted using a Micro
Carbosep® module associated to a positive displacement pump (Ismatec, Germany). A
tubular membrane with an activated coating of zirconium oxide and titanium dioxide,
with a molecular weight cut-off of 50 kDa, and an effective membrane area of 108
cm2 (Orelis, France) was used. The ultrafiltration process was performed at 1 bar and
the mean clean water permeability determined for this membrane was 69.4 ± 3.1 L h-1
bar-1 m-2, at 21 2 °C.
3.2.2.2 Static adsorption experiments
In the adsorption experiments conducted under static conditions, membranes were
immersed in stirred solutions (200 mL of water matrices spiked with micropollutants
at 500 g L-1) at room temperature (21 2 °C). The adsorption of the compounds
under these conditions was followed by taking samples (200 L) over time until a
constant concentration of the compounds in the bulk solution was achieved. After
this procedure, membranes were placed in the cross-flow cell and the nanofiltration
experiments were performed (as detailed in section 3.2.2.3).
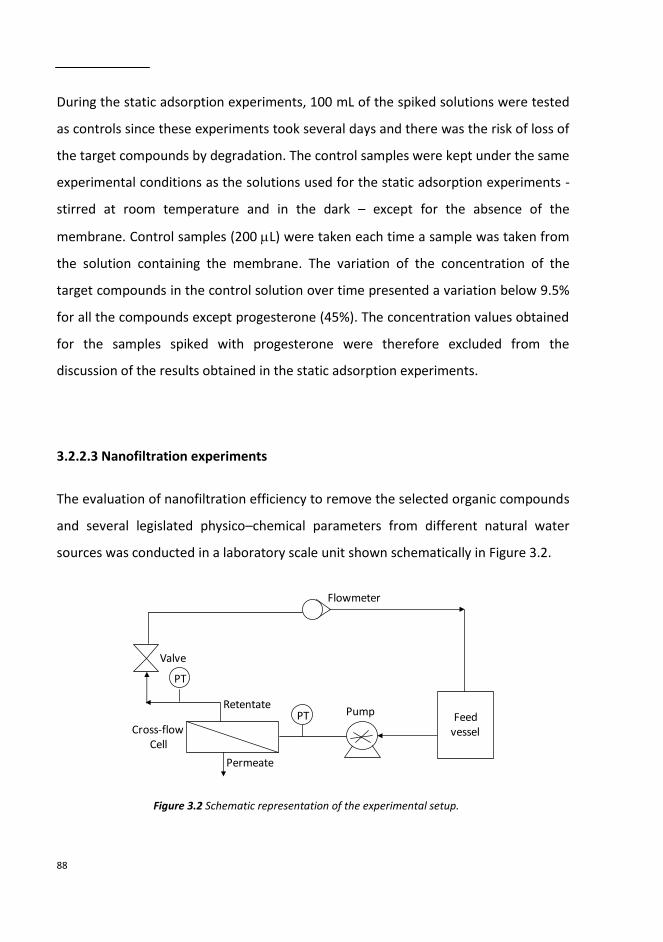
88
During the static adsorption experiments, 100 mL of the spiked solutions were tested
as controls since these experiments took several days and there was the risk of loss of
the target compounds by degradation. The control samples were kept under the same
experimental conditions as the solutions used for the static adsorption experiments -
stirred at room temperature and in the dark – except for the absence of the
membrane. Control samples (200 L) were taken each time a sample was taken from
the solution containing the membrane. The variation of the concentration of the
target compounds in the control solution over time presented a variation below 9.5%
for all the compounds except progesterone (45%). The concentration values obtained
for the samples spiked with progesterone were therefore excluded from the
discussion of the results obtained in the static adsorption experiments.
3.2.2.3 Nanofiltration experiments
The evaluation of nanofiltration efficiency to remove the selected organic compounds
and several legislated physico–chemical parameters from different natural water
sources was conducted in a laboratory scale unit shown schematically in Figure 3.2.
Figure 3.2 Schematic representation of the experimental setup.
PT
PT
Flowmeter
Valve
Cross-flowCell
Permeate
Pump Feedvessel
Retentate

Chapter 3
89
This lab-scale unit consisted of two vessels for the feed and the permeate, a stainless
steel cross-flow cell, a diaphragm pump (Hydra-cell G-13, Wanner Engineering, USA),
as well a brass ball valve with an electric actuator (J2, J+JAutomation, UK) that
allowed the pressure adjustment in the system. Two transmitters (8864, Trafag,
Switzerland) were placed before and after the cross-flow cell to measure the inlet and
outlet pressure and the temperature of the solution circulating in the system. The
stainless steel cross-flow cell was designed and constructed expressly for these
studies. This filtration cell was used with a 15 cm2 flat-sheet Desal 5DK membrane (GE
Osmonics, USA) that was placed between two rectangular cross-section channels
(feed and permeate) measuring 150 mm x 10 mm x 1 mm (length x wide x height)
each. Desal 5DK is a thin film composite membrane with a polysulphone support
layer. This membrane presents a molecular weight cut-off of 150-300 Da (Boussahel
et al. 2002) and is negatively charged at neutral pH (GE Osmonics, USA).
Before nanofiltration experiments, Desal 5DK membranes were compacted by
filtration of laboratory grade water at 10 bar until a constant flux was obtained
(approximately after 3 h of compaction). The deionised water permeability was then
determined as 3.90 ± 0.21 L h-1 bar-1 m-2, at 25 2 °C.
Nanofiltration experiments using the spiked water matrices were conducted at 10 bar
with a system recovery of 0.03% (v/v), defined as Qp/Qf (permeate flow rate/feed
flow rate). The temperature in the cross-flow unit was controlled at 25 2°C using a
thermostatic bath. The retentate was continuously recirculated to the feed vessel
during filtration while the permeate was collected in a different vessel for analysis.
Pesticides and hormones were grouped and spiked in the surface water and
groundwater matrices according to their common analytical methods. The
concentrations of the compounds in the feed solutions were as low as possible to
mimic their levels in the environment, but set according to the detection limits of the

90
respective analytical methods. Solutions containing pentachlorophenol (75 g L-1),
solutions containing a mixture of atrazine and alachlor (150 g L-1 each), and solutions
containing a mixture of all the selected hormones (150 g L-1 each) were prepared
and individually assessed. The compounds were spiked in the water matrices using
stock solutions prepared in methanol at very high concentrations to minimise the
volume of methanol present in the water solutions. The percentage of methanol
present in the water samples was always lower than 0.03% (v/v). Even though the
concentrations used are slightly higher than the reported levels in the water sources,
significant differences in their removal at these concentrations comparatively to the
occurrence concentrations are not expected. Schäfer et al. (2003) studied the
rejection of estrone at a range of concentrations between 1 and 1000 ng L-1 and
concluded that the differences in the rejection of this molecule are not significant at
different concentrations. Moreover, another study addressing the rejection of
pesticides using higher concentrations ranging between 100 and 500 g L-1 (Van der
Bruggen et al. 1998) also support these results.
Feed solutions were stored in amber bottles during all nanofiltration experiments to
avoid possible degradation of the compounds due to light absorption. The
nanofiltration experiments that assessed the removal of pentachlorophenol and
hormones (3.0-3.5 L) were conducted during approximately 44-67 h, while the
solutions containing atrazine and alachlor (approximately 4.5 L) were filtered during
approximately 93h. The volume of feed solution filtered varied according to the
permeate volume needed for analysis, since the analytical methods were different for
the different compounds (as described in Appendix A.1).
Since nanofiltration experiments were long, controls were monitored in order to
evaluate possible losses of the organic compounds due to degradation, evaporation,
or adsorption to the vessels walls that could lead to an overestimation of
nanofiltration efficiency. A volume of 100 mL of the feed solutions were used as

Chapter 3
91
control. In the beginning of each experiment, half of this volume (initial control) was
taken to an amber flask and was immediately acidified to pH 2-3 with sulphuric acid
to prevent the degradation of organic compounds that may occur due to the presence
of microorganisms in the water sources. This solution was then stored at 5 ± 3 °C until
analysis. The remaining 50 mL (final control) were transferred to another amber flask
and kept during the nanofiltration procedure at the same experimental conditions as
the nanofiltration solution in terms of temperature and light exposure: in the same
thermostatic bath and in the dark. The final control was only acidified with sulphuric
acid at the end of the filtration process and was then also stored at 5 ± 3 °C until
analysis. Differences in the concentration of the micropollutants in the beginning and
in the end of the experiments were not very significant; the percent changes obtained
were always below 8% for all the compounds except progesterone (below 13%).
An additional control experiment was conducted to evaluate the potential loss of the
compounds due to their adsorption to the system tubing and feed vessel. This
experiment consisted in the circulation of a solution similar to the feed in the system,
under identical experimental conditions as nanofiltration, but in the absence of a
membrane. The percent change observed in the concentration of all the pesticides
and hormones except progesterone and alachlor was below 9%. For alachlor and
progesterone, a percent change of 14 and 34% was obtained, respectively, showing
that these compounds (especially progesterone) may be retained in the system. The
percent change obtained for progesterone in this control sample is high and similar to
the percent change obtained for the control performed during the static adsorption
experiments (section 3.2.2.2). The percent adsorption calculation for this compound
was therefore excluded from the Results and Discussion section.
After nanofiltration, samples of feed, permeate, and retentate were acidified at pH 2-
3 with sulphuric acid and stored in brown glass bottles at 5 ± 3 °C prior to analysis of
the target pesticides and hormones, to avoid the degradation of the compounds. A

92
fraction of permeate was not acidified and was characterised in terms of the
previously described organic and inorganic parameters. The pH of the samples was
measured before and after acidification.
The apparent rejection (Rapp) of the selected compounds was determined using
Equation 3.1.
f
papp
C
C1100(%)R (3.1)
where pC and fC are the concentrations of a given compound in the permeate and
feed, respectively.
The percentage of rejection due to adsorption on the membrane (A) was determined
using Equation 3.2:
ff
rrpp
VC
VCVC1100A(%) (3.2)
where pC , rC , and fC are the concentration of a given compound in the permeate,
retentate, and feed, respectively, whereas pV , rV , and fV are the volume of
permeate, retentate, and feed, respectively.
3.2.3 Analytical Methods
3.2.3.1 Characterisation of natural water matrices
The natural water matrices were characterised in terms of pH, TOC, turbidity,
alkalinity, conductivity, total hardness, and several ionic components (chloride,

Chapter 3
93
sulphate, nitrate, magnesium, sodium, calcium, and potassium). The pH was
determined by an electrometric method (Standard Method 4500-H+B 1995), total
organic carbon by persulfate-ultraviolet oxidation (EN1484 1997), turbidity by a
nephelometric method (NPEN27027 1997), alkalinity by a titration method (Standard
Method 2320B 1995), conductivity by conductimetry (Standard Method 2510-B
1995), and total hardness by a calculation method (Standard Method 2340-B 1995).
The concentration of the ions was determined by ionic chromatography (chloride and
sulphate), molecular absorption spectrometry (nitrate), as well as digestion and
inductively coupled plasma spectroscopy (magnesium, sodium, calcium, and
potassium).
3.2.3.2 Detection and quantification of target micropollutants
Analytical methods used to determine the concentrations of the studied organic
micropollutants varied according to the concentrations of the analytes in the water
samples. Therefore, the concentration of the hormones and pesticides during the
experiments of adsorption under static conditions were followed by direct HPLC
injection while the samples from nanofiltration experiments were subject to
concentration prior to analysis due to the lower concentrations expected in the
permeate samples. Briefly, samples from nanofiltration containing atrazine and
alachlor were concentrated by solid phase extraction (SPE) and analysed by gas
chromatography (GC) with mass spectrometry (MS) detection; samples containing the
analyte pentachlorophenol were concentrated by microextraction and analysed by GC
with electron capture detection; samples containing the hormones were
concentrated by SPE and analysed by ultra-high-speed liquid chromatography (UPLC).
A detailed description of the analytical methods used is provided in Appendix A.1.

94
3.3 RESULTS AND DISCUSSION
The organic micropollutants selected for this study present very different structures
and physico-chemical properties such as molecular weight, log Kow, water solubility
(Ws), dipole moment (), and pKa that are detailed in Table 3.1.
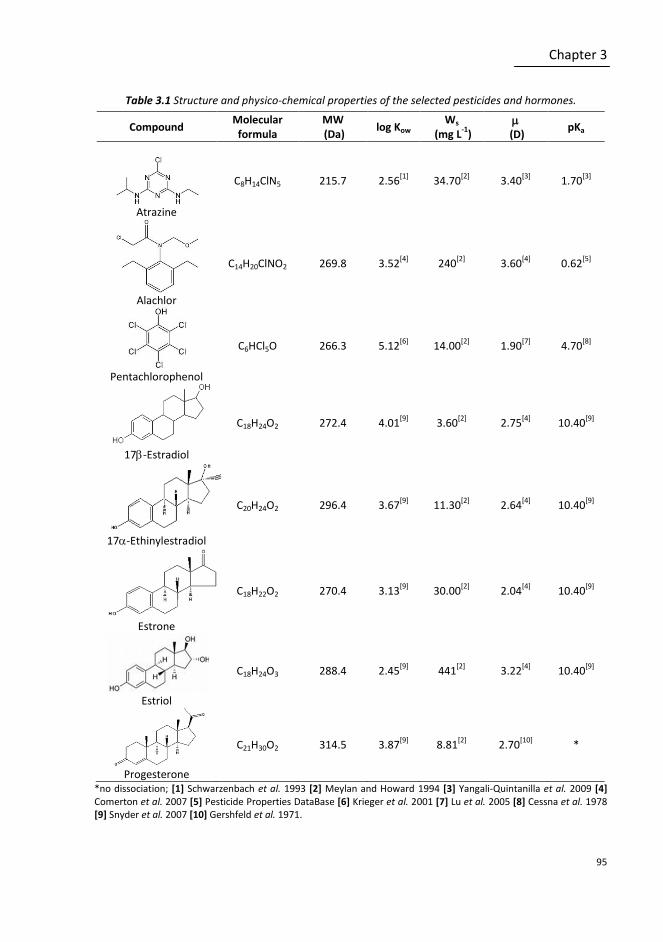
Chapter 3
95
Table 3.1 Structure and physico-chemical properties of the selected pesticides and hormones.
*no dissociation; [1] Schwarzenbach et al. 1993 [2] Meylan and Howard 1994 [3] Yangali-Quintanilla et al. 2009 [4] Comerton et al. 2007 [5] Pesticide Properties DataBase [6] Krieger et al. 2001 [7] Lu et al. 2005 [8] Cessna et al. 1978 [9] Snyder et al. 2007 [10] Gershfeld et al. 1971.
Compound Molecular
formula MW (Da)
log Kow Ws
(mg L-1
)
(D) pKa
Atrazine
C8H14ClN5 215.7
2.56[1]
34.70[2]
3.40[3]
1.70[3]
Alachlor
C14H20ClNO2 269.8 3.52[4]
240[2]
3.60[4]
0.62[5]
Pentachlorophenol
C6HCl5O 266.3 5.12[6]
14.00[2]
1.90[7]
4.70[8]
17-Estradiol
C18H24O2 272.4
4.01[9]
3.60[2]
2.75[4]
10.40
[9]
17-Ethinylestradiol
C20H24O2 296.4
3.67[9]
11.30[2]
2.64[4]
10.40
[9]
Estrone
C18H22O2 270.4
3.13[9]
30.00[2]
2.04[4]
10.40
[9]
Estriol
C18H24O3 288.4
2.45[9]
441[2]
3.22[4]
10.40
[9]
Progesterone
C21H30O2 314.5
3.87[9]
8.81[2]
2.70[10]
*
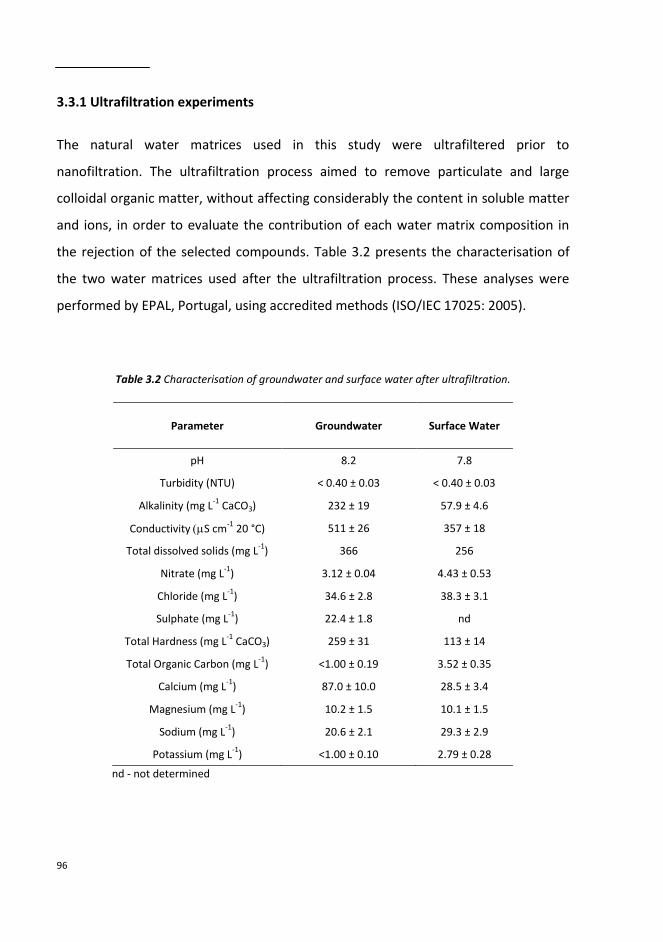
96
3.3.1 Ultrafiltration experiments
The natural water matrices used in this study were ultrafiltered prior to
nanofiltration. The ultrafiltration process aimed to remove particulate and large
colloidal organic matter, without affecting considerably the content in soluble matter
and ions, in order to evaluate the contribution of each water matrix composition in
the rejection of the selected compounds. Table 3.2 presents the characterisation of
the two water matrices used after the ultrafiltration process. These analyses were
performed by EPAL, Portugal, using accredited methods (ISO/IEC 17025: 2005).
Table 3.2 Characterisation of groundwater and surface water after ultrafiltration.
Parameter Groundwater Surface Water
pH 8.2 7.8
Turbidity (NTU) < 0.40 ± 0.03 < 0.40 ± 0.03
Alkalinity (mg L-1
CaCO3) 232 ± 19 57.9 ± 4.6
Conductivity S cm-1
20 °C) 511 ± 26 357 ± 18
Total dissolved solids (mg L-1
) 366 256
Nitrate (mg L-1
) 3.12 ± 0.04 4.43 ± 0.53
Chloride (mg L-1
) 34.6 ± 2.8 38.3 ± 3.1
Sulphate (mg L-1
) 22.4 ± 1.8 nd
Total Hardness (mg L-1
CaCO3) 259 ± 31 113 ± 14
Total Organic Carbon (mg L-1
) <1.00 ± 0.19 3.52 ± 0.35
Calcium (mg L-1
) 87.0 ± 10.0 28.5 ± 3.4
Magnesium (mg L-1
) 10.2 ± 1.5 10.1 ± 1.5
Sodium (mg L-1
) 20.6 ± 2.1 29.3 ± 2.9
Potassium (mg L-1
) <1.00 ± 0.10 2.79 ± 0.28
nd - not determined

Chapter 3
97
The two natural water matrices were very different in terms of organic and inorganic
composition. Groundwater presented the higher levels of alkalinity, conductivity, total
dissolved solids, and total hardness while surface water showed higher turbidity and
TOC. After ultrafiltration, considerable differences were not detected in the
groundwater matrix composition and only turbidity decreased in the surface water,
which was the aim of the ultrafiltration process. The considerable decrease of
turbidity in the surface water (from 2.6 NTU to levels below the detection limit of 0.4
NTU), without affecting the levels of TOC, demonstrates that the natural organic
matter present in this matrix was maintained as expected. It is also important to
mention that the concentration of the ionic species determined in the water sources
studied was not affected by this ultrafiltration step. This approach allows the study to
focus on the effect of the water composition and removes particles and colloids with
high dimensions that may influence the efficiency of water treatment.
The conventional treatment of surface water in water treatment utilities often
includes coagulation, flocculation, sedimentation, and sand filtration. After
ultrafiltration, the surface water matrix presented an overall composition similar to
the composition of the water obtained after conventional sedimentation and sand
filtration processes (results not shown). Indeed, very low percent differences were
obtained when the ultrafiltered surface water was compared with the water obtained
after sedimentation (0.03-0.41%) and sand filtration (0.04-1.56%), in terms of several
water quality indicator parameters (turbidity, conductivity, total hardness, total
organic carbon, nitrate, calcium, magnesium, sodium, and potassium).
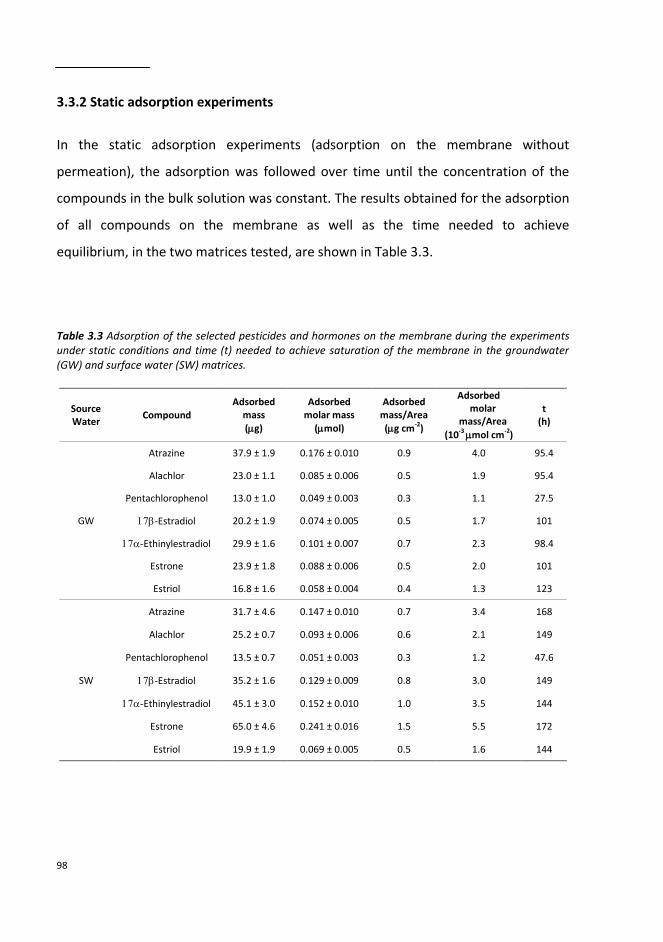
98
3.3.2 Static adsorption experiments
In the static adsorption experiments (adsorption on the membrane without
permeation), the adsorption was followed over time until the concentration of the
compounds in the bulk solution was constant. The results obtained for the adsorption
of all compounds on the membrane as well as the time needed to achieve
equilibrium, in the two matrices tested, are shown in Table 3.3.
Table 3.3 Adsorption of the selected pesticides and hormones on the membrane during the experiments under static conditions and time (t) needed to achieve saturation of the membrane in the groundwater (GW) and surface water (SW) matrices.
Source Water
Compound Adsorbed
mass
(g)
Adsorbed molar mass
(mol)
Adsorbed mass/Area
(g cm-2)
Adsorbed molar
mass/Area
(10-3 mol cm-2)
t (h)
GW
Atrazine 37.9 ± 1.9 0.176 ± 0.010 0.9 4.0 95.4
Alachlor 23.0 ± 1.1 0.085 ± 0.006 0.5 1.9 95.4
Pentachlorophenol 13.0 ± 1.0 0.049 ± 0.003 0.3 1.1 27.5
-Estradiol 20.2 ± 1.9 0.074 ± 0.005 0.5 1.7 101
-Ethinylestradiol 29.9 ± 1.6 0.101 ± 0.007 0.7 2.3 98.4
Estrone 23.9 ± 1.8 0.088 ± 0.006 0.5 2.0 101
Estriol 16.8 ± 1.6 0.058 ± 0.004 0.4 1.3 123
SW
Atrazine 31.7 ± 4.6 0.147 ± 0.010 0.7 3.4 168
Alachlor 25.2 ± 0.7 0.093 ± 0.006 0.6 2.1 149
Pentachlorophenol 13.5 ± 0.7 0.051 ± 0.003 0.3 1.2 47.6
-Estradiol 35.2 ± 1.6 0.129 ± 0.009 0.8 3.0 149
-Ethinylestradiol 45.1 ± 3.0 0.152 ± 0.010 1.0 3.5 144
Estrone 65.0 ± 4.6 0.241 ± 0.016 1.5 5.5 172
Estriol 19.9 ± 1.9 0.069 ± 0.005 0.5 1.6 144

Chapter 3
99
The adsorption behaviour of the organic compounds was different in terms of the
adsorbed mass and the time needed to achieve equilibrium. However, in general, the
adsorbed mass increased with the time needed to achieve equilibrium and the time
needed to achieve equilibrium increased with the solubility of the target compounds.
As expected, the most hydrophobic compounds (with higher log Kow values and lower
solubility) showed higher affinity to the membrane and achieved the equilibrium
concentrations sooner. As a general trend, the mass adsorbed decreased with the
decrease of log Kow, for all the target compounds except pentachlorophenol and
atrazine.
Differences were obtained in the adsorption of the compounds on the membrane
under static conditions in groundwater and surface water. Generally, the time needed
to achieve equilibrium as well as the level of adsorption of the compounds on the
membrane was higher in the surface water matrix (Table 3.3). The fact that the
adsorption equilibrium took longer in the surface water may be related to the
competition between the selected compounds and the natural organic matter
present in this matrix for the membrane adsorption sites or due to possible
interactions between the natural organic matter and the target analytes. Comerton et
al. (2007) also observed differences in the adsorption of several organic compounds
(including alachlor, estriol, 17-estradiol, 17-ethinylestradiol, and estrone) in
different water matrices: adsorption was generally higher in a surface water matrix
comparatively to milli-Q water. In that study a correlation was also found in certain
cases between adsorption to the membrane and the log Kow. However, the adsorption
of the organic compounds on different membranes (UE10, NF270, TS80, X20) was
different depending on the membrane used, which supports the idea that other
properties and interactions between the compounds and the membrane should also
be considered. In fact, as previously reported in an earlier study of Schäfer et al.
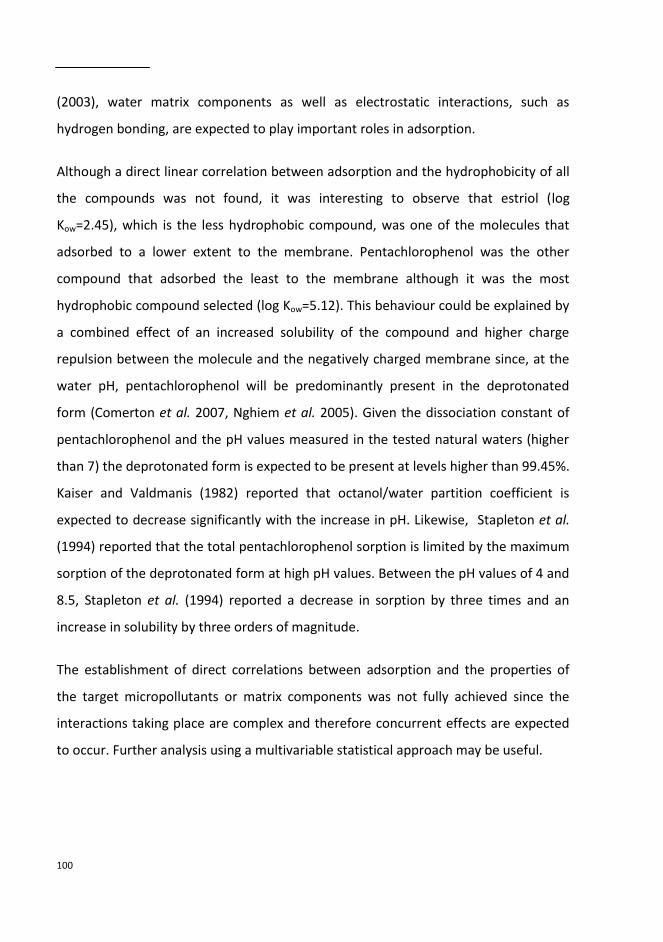
100
(2003), water matrix components as well as electrostatic interactions, such as
hydrogen bonding, are expected to play important roles in adsorption.
Although a direct linear correlation between adsorption and the hydrophobicity of all
the compounds was not found, it was interesting to observe that estriol (log
Kow=2.45), which is the less hydrophobic compound, was one of the molecules that
adsorbed to a lower extent to the membrane. Pentachlorophenol was the other
compound that adsorbed the least to the membrane although it was the most
hydrophobic compound selected (log Kow=5.12). This behaviour could be explained by
a combined effect of an increased solubility of the compound and higher charge
repulsion between the molecule and the negatively charged membrane since, at the
water pH, pentachlorophenol will be predominantly present in the deprotonated
form (Comerton et al. 2007, Nghiem et al. 2005). Given the dissociation constant of
pentachlorophenol and the pH values measured in the tested natural waters (higher
than 7) the deprotonated form is expected to be present at levels higher than 99.45%.
Kaiser and Valdmanis (1982) reported that octanol/water partition coefficient is
expected to decrease significantly with the increase in pH. Likewise, Stapleton et al.
(1994) reported that the total pentachlorophenol sorption is limited by the maximum
sorption of the deprotonated form at high pH values. Between the pH values of 4 and
8.5, Stapleton et al. (1994) reported a decrease in sorption by three times and an
increase in solubility by three orders of magnitude.
The establishment of direct correlations between adsorption and the properties of
the target micropollutants or matrix components was not fully achieved since the
interactions taking place are complex and therefore concurrent effects are expected
to occur. Further analysis using a multivariable statistical approach may be useful.
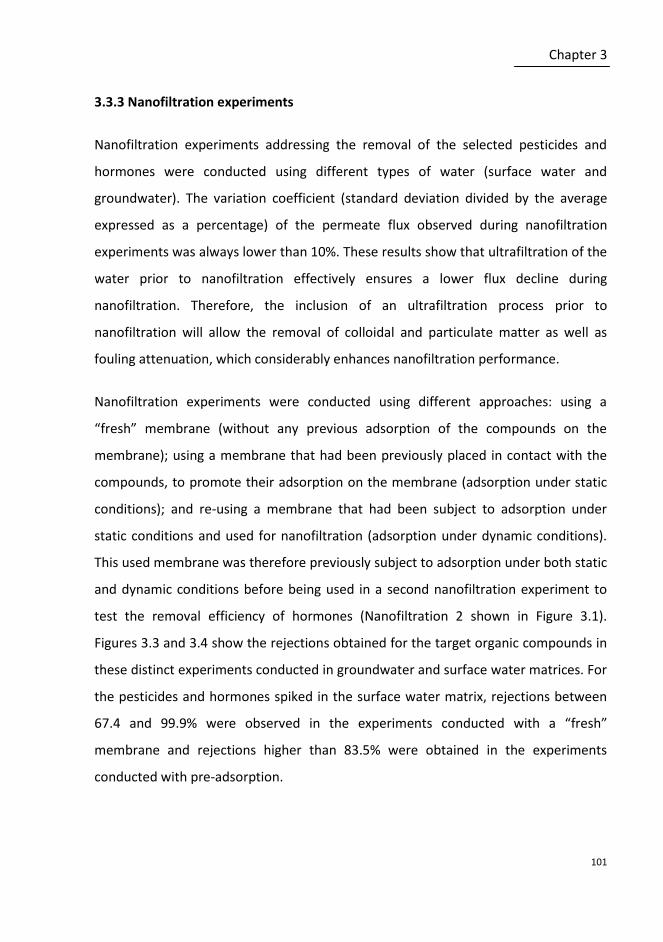
Chapter 3
101
3.3.3 Nanofiltration experiments
Nanofiltration experiments addressing the removal of the selected pesticides and
hormones were conducted using different types of water (surface water and
groundwater). The variation coefficient (standard deviation divided by the average
expressed as a percentage) of the permeate flux observed during nanofiltration
experiments was always lower than 10%. These results show that ultrafiltration of the
water prior to nanofiltration effectively ensures a lower flux decline during
nanofiltration. Therefore, the inclusion of an ultrafiltration process prior to
nanofiltration will allow the removal of colloidal and particulate matter as well as
fouling attenuation, which considerably enhances nanofiltration performance.
Nanofiltration experiments were conducted using different approaches: using a
“fresh” membrane (without any previous adsorption of the compounds on the
membrane); using a membrane that had been previously placed in contact with the
compounds, to promote their adsorption on the membrane (adsorption under static
conditions); and re-using a membrane that had been subject to adsorption under
static conditions and used for nanofiltration (adsorption under dynamic conditions).
This used membrane was therefore previously subject to adsorption under both static
and dynamic conditions before being used in a second nanofiltration experiment to
test the removal efficiency of hormones (Nanofiltration 2 shown in Figure 3.1).
Figures 3.3 and 3.4 show the rejections obtained for the target organic compounds in
these distinct experiments conducted in groundwater and surface water matrices. For
the pesticides and hormones spiked in the surface water matrix, rejections between
67.4 and 99.9% were observed in the experiments conducted with a “fresh”
membrane and rejections higher than 83.5% were obtained in the experiments
conducted with pre-adsorption.
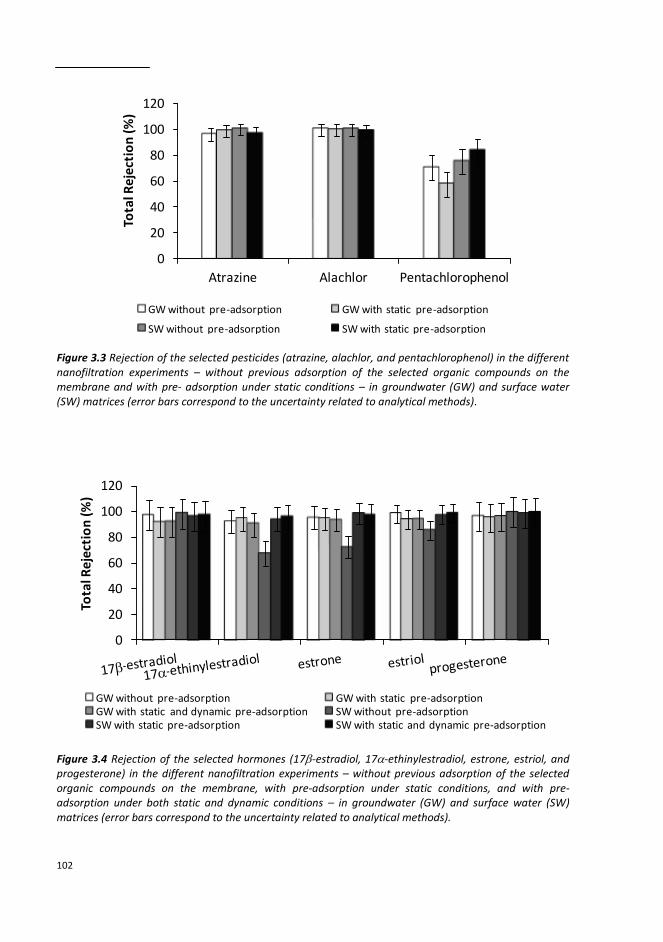
102
Figure 3.3 Rejection of the selected pesticides (atrazine, alachlor, and pentachlorophenol) in the different nanofiltration experiments – without previous adsorption of the selected organic compounds on the membrane and with pre- adsorption under static conditions – in groundwater (GW) and surface water (SW) matrices (error bars correspond to the uncertainty related to analytical methods).
Figure 3.4 Rejection of the selected hormones (17-estradiol, 17-ethinylestradiol, estrone, estriol, and progesterone) in the different nanofiltration experiments – without previous adsorption of the selected organic compounds on the membrane, with pre-adsorption under static conditions, and with pre-adsorption under both static and dynamic conditions – in groundwater (GW) and surface water (SW) matrices (error bars correspond to the uncertainty related to analytical methods).
0
20
40
60
80
100
120
Atrazine Alachlor Pentachlorophenol
Tota
l Re
ject
ion
(%)
GW without pre-adsorption GW with static pre-adsorption
SW without pre-adsorption SW with static pre-adsorption
0
20
40
60
80
100
120
Tota
l Re
ject
ion
(%)
GW without pre-adsorption GW with static pre-adsorptionGW with static and dynamic pre-adsorption SW without pre-adsorptionSW with static pre-adsorption SW with static and dynamic pre-adsorption

Chapter 3
103
Extremely high rejections were obtained for all compounds in the groundwater
(>90%), with the exception of pentachlorophenol. The rejections of
pentachlorophenol obtained in both water matrices tested were generally lower
when compared to the other organic compounds (Figure 3.3). The lower rejection of
pentachlorophenol, as previously observed in another study using a dead-end
filtration system (Sanches et al. 2011), may be explained by the fact that
pentachlorophenol is an ionisable organic compound with a pKa value of 4.7 (Cessna
and Grover 1978) and therefore, its solubility is pH dependent and expected to
increase at pH values higher than the pKa. At pH values of 7 or 8 (the pH of the natural
water matrices), the dominant species change towards the deprotonated form
(Stapleton et al. 1994) and the solubility of this molecule increases, therefore
decreasing its rejection.
The rejection of pentachlorophenol is also dependent on the water matrix
composition, especially in the experiments conducted with pre-adsorption. The
rejections obtained in the groundwater were 70.5 and 57.5% without and with static
pre-adsorption, respectively while for the surface water, percent rejections of 75.4
and 83.5% without and with static pre-adsorption, respectively were observed.
Although the adsorption of this compound on the membrane was important in its
rejection in surface water (58-72% of the total rejection), the adsorption observed in
the groundwater was not very significant (23 and 32% of the total rejection).
Therefore, besides hydrophobic interactions, other rejection mechanisms play an
important role in the rejection of this compound. The ionic composition of the two
water matrices tested is very different: the groundwater matrix presents higher
values of alkalinity, conductivity, total hardness, and calcium concentration (Table
3.2). The ions present in the water may have a “shielding” effect on the ionised
molecule and the membrane surface charge, reducing the electrostatic interactions
between the compound and the negatively charged membrane, leading to the

104
observed decrease in the rejection of pentachlorophenol in the groundwater
relatively to surface water. The decrease in the rejection of dissolved organic carbon
with increasing ionic strength due to a “shielding” effect was also previously discussed
(Schäfer et al. 2002). Furthermore, the ionic “shielding” of the molecules also reduces
the length of the Debye layer of the molecules, which facilitates the breakthrough of
the molecules across the membrane and decreases their rejection (Schäfer et al.
2003, Nyström et al. 1998). In particular, calcium has been reported as an ion that
may influence the rejection of organic compounds due to the “shielding” effect
(Boussahel et al. 2002). Since the concentration of calcium is much higher in the
groundwater matrix (87.0 mg L-1 in the ultrafiltered groundwater and 28.5 mg L-1 in
the ultrafiltered surface water), this ion may have a particular effect in the decrease
of the rejection of pentachlorophenol in groundwater comparatively to the surface
water matrix.
Extremely high rejections (higher than 96.2%) were obtained for atrazine and alachlor
in both water matrices tested (Figure 3.3). The rejection of atrazine was found to be
independent from the water matrix composition, which is in agreement with other
studies using the same and other nanofiltration membranes as well as different types
of natural and synthetic water matrices (Planas et al. 2006, Devitt et al. 1998, Sanches
et al. 2011, Boussahel et al. 2002, Berg et al. 1997).
Table 3.4 shows the percent adsorption of the selected pesticides and hormones on
the membrane during nanofiltration under different experimental conditions in terms
of membrane pre-adsorption: without pre-adsorption, with static pre-adsorption, and
with both static and dynamic pre-adsorption. Very high adsorption percentages were
obtained for atrazine (73.3-96.9%) and alachlor (54.5-98.8%) in nanofiltration
experiments, showing that hydrophobic interactions have an important impact on the
rejection of these compounds.
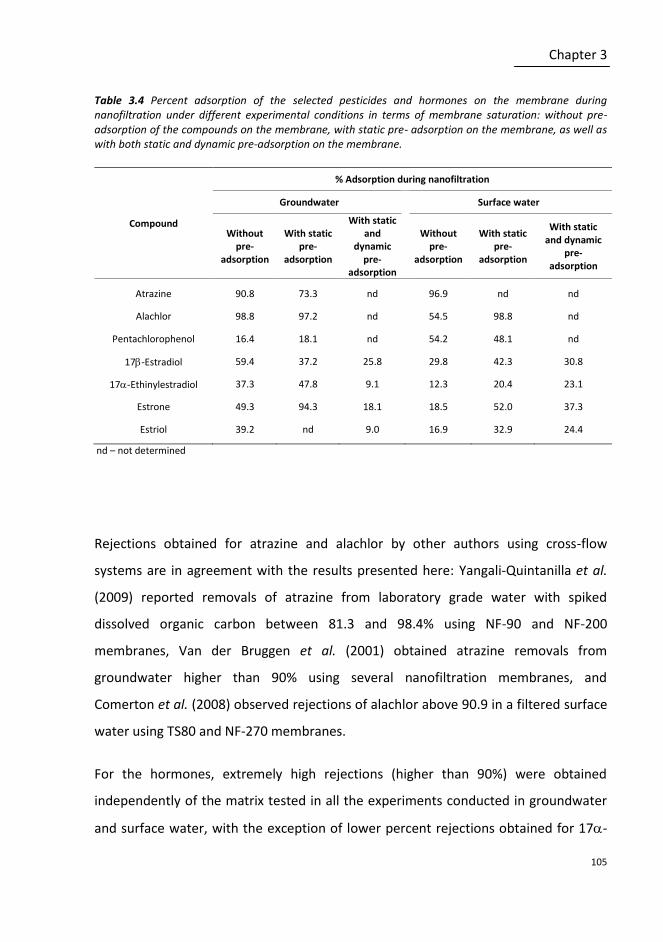
Chapter 3
105
Table 3.4 Percent adsorption of the selected pesticides and hormones on the membrane during nanofiltration under different experimental conditions in terms of membrane saturation: without pre-adsorption of the compounds on the membrane, with static pre- adsorption on the membrane, as well as with both static and dynamic pre-adsorption on the membrane.
Compound
% Adsorption during nanofiltration
Groundwater Surface water
Without pre-
adsorption
With static pre-
adsorption
With static and
dynamic pre-
adsorption
Without pre-
adsorption
With static pre-
adsorption
With static and dynamic
pre- adsorption
Atrazine 90.8 73.3 nd 96.9 nd nd
Alachlor 98.8 97.2 nd 54.5 98.8 nd
Pentachlorophenol 16.4 18.1 nd 54.2 48.1 nd
17-Estradiol 59.4 37.2 25.8 29.8 42.3 30.8
17-Ethinylestradiol 37.3 47.8 9.1 12.3 20.4 23.1
Estrone 49.3 94.3 18.1 18.5 52.0 37.3
Estriol 39.2 nd 9.0 16.9 32.9 24.4
Rejections obtained for atrazine and alachlor by other authors using cross-flow
systems are in agreement with the results presented here: Yangali-Quintanilla et al.
(2009) reported removals of atrazine from laboratory grade water with spiked
dissolved organic carbon between 81.3 and 98.4% using NF-90 and NF-200
membranes, Van der Bruggen et al. (2001) obtained atrazine removals from
groundwater higher than 90% using several nanofiltration membranes, and
Comerton et al. (2008) observed rejections of alachlor above 90.9 in a filtered surface
water using TS80 and NF-270 membranes.
For the hormones, extremely high rejections (higher than 90%) were obtained
independently of the matrix tested in all the experiments conducted in groundwater
and surface water, with the exception of lower percent rejections obtained for 17-
nd – not determined

106
ethinylestradiol, estrone, and estriol, (67.4, 72.4, and 85.4% respectively) in the
experiments conducted in surface water without pre-adsorption (Figure 3.4). These
results are in agreement with previously reported rejections for the selected
hormones with other membranes (Comerton et al. 2008, Nghiem et al. 2004).
Most of the observed rejections of the hormones due to adsorption effects were
lower than 52% (Table 3.4), showing that these effects are important mechanisms of
rejection but are not the solely mechanisms. Percent adsorption values are not shown
for progesterone in Table 3.4 since this molecule showed to be considerably retained
(34%) in the system in the control samples (as mentioned in the Materials and
Methods section). Since the water matrices pH (7-9) is lower than the pKa of the
hormones (10.4), these compounds are in the undissociated form and therefore,
electrostatic interactions between the hormones and the membrane are not likely to
occur. Adsorption effects and size exclusion are therefore expected to govern the
rejection of these compounds since the selected hormones present similar and high
molecular weights. Adsorption interactions take place since these are hydrophobic
compounds (high log Kow) and the structure of the hormones comprises hydroxyl and
carbonyl groups that may form hydrogen bonding between the oxygen atoms of the
molecule and the membrane polymer (Schäfer et al. 2003, Nghiem et al. 2002b, Van
der Bruggen et al. 2008). Adsorption values lower than 50% obtained for estrone,
estriol, 17-estradiol, and 17-ethinylestradiol by other authors (Dudziak and Bodzek
2009) concur with the results obtained in this study.
Even though the properties of the target compounds (log Kow, solubility, molecular
weight, and pKa) and water characteristics (alkalinity, total hardness, and
conductivity) have been related with the removal of the selected compounds, a full
understanding of the individual effects on adsorption was not achieved. This fact is
related with the complexity of the real waters and the consequent existence of
combined removal effects, as previously discussed for the adsorption of the target
Chapter 3
107
micropollutants under static conditions. As mentioned above, the development of
robust rejection models may require the use of a multivariable statistical approach.
Table 3.5 compares the natural water matrices composition in terms of several water
quality indicator parameters, pesticides, and hormones before and after
nanofiltration, shows their rejection values, and reports the regulated parametric
values (Directive 98/83/EC). High percent rejection values were obtained for all the
parameters except chloride, sodium, potassium, and nitrate. These are monovalent
ions and were therefore expected to be less retained by nanofiltration (Table 3.5 and
Figure 3.5).
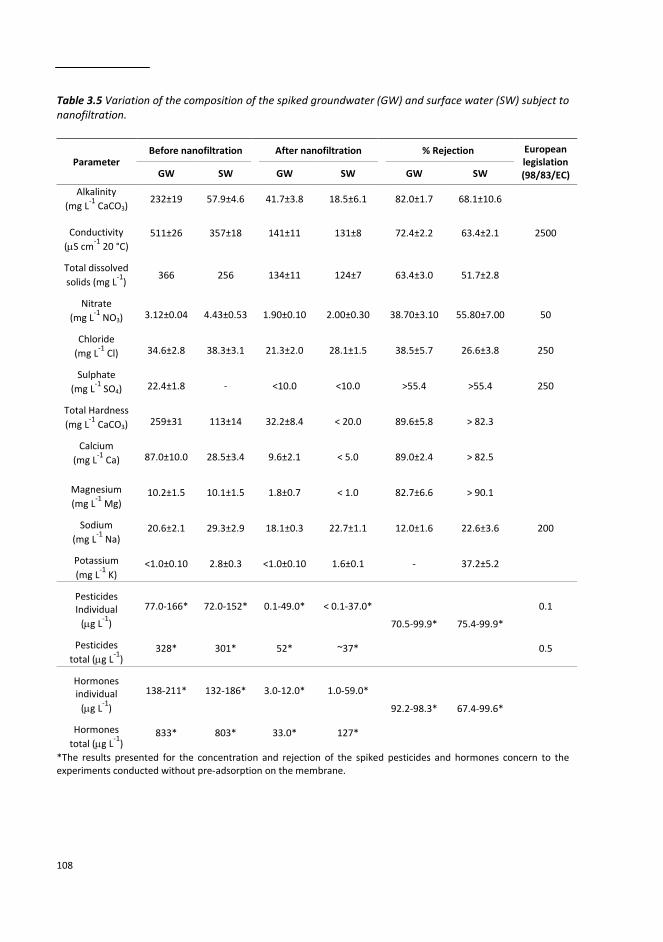
108
Table 3.5 Variation of the composition of the spiked groundwater (GW) and surface water (SW) subject to nanofiltration.
*The results presented for the concentration and rejection of the spiked pesticides and hormones concern to the experiments conducted without pre-adsorption on the membrane.
Parameter Before nanofiltration After nanofiltration % Rejection European
legislation (98/83/EC) GW SW GW SW GW SW
Alkalinity
(mg L-1
CaCO3) 232±19 57.9±4.6 41.7±3.8 18.5±6.1 82.0±1.7 68.1±10.6
Conductivity
(S cm-1
20 °C)
511±26 357±18 141±11 131±8 72.4±2.2 63.4±2.1 2500
Total dissolved
solids (mg L-1
) 366 256 134±11 124±7 63.4±3.0 51.7±2.8
Nitrate
(mg L-1
NO3) 3.12±0.04 4.43±0.53 1.90±0.10 2.00±0.30 38.70±3.10 55.80±7.00 50
Chloride
(mg L-1
Cl) 34.6±2.8 38.3±3.1 21.3±2.0 28.1±1.5 38.5±5.7 26.6±3.8 250
Sulphate
(mg L-1
SO4) 22.4±1.8 - <10.0 <10.0 >55.4 >55.4 250
Total Hardness
(mg L-1
CaCO3) 259±31 113±14 32.2±8.4 < 20.0 89.6±5.8 > 82.3
Calcium
(mg L-1
Ca) 87.0±10.0 28.5±3.4 9.6±2.1 < 5.0 89.0±2.4 > 82.5
Magnesium
(mg L-1
Mg) 10.2±1.5 10.1±1.5 1.8±0.7 < 1.0 82.7±6.6 > 90.1
Sodium
(mg L-1
Na) 20.6±2.1 29.3±2.9 18.1±0.3 22.7±1.1 12.0±1.6 22.6±3.6 200
Potassium
(mg L-1
K) <1.0±0.10 2.8±0.3 <1.0±0.10 1.6±0.1 - 37.2±5.2
Pesticides Individual
(g L-1
)
77.0-166* 72.0-152* 0.1-49.0* < 0.1-37.0*
70.5-99.9* 75.4-99.9*
0.1
Pesticides
total (g L-1
) 328* 301* 52* ~37* 0.5
Hormones individual
(g L-1
)
138-211* 132-186* 3.0-12.0* 1.0-59.0*
92.2-98.3* 67.4-99.6*
Hormones
total (g L-1
) 833* 803* 33.0* 127*

Chapter 3
109
Figure 3.5 Percent rejection of inorganic components of the natural water matrices during nanofiltration experiments (error bars correspond to minimum and maximum values obtained; error bars are not provided when the rejection of the components leaded to concentrations below detection limits).
Even though slightly lower rejection values were often obtained in the surface water
matrix, very similar rejection results were observed in both matrices. All physico -
chemical parameters analysed were found to be present in the natural waters at
concentrations below the legislated values (Tables 3.2 and 3.5). The selected
compounds were spiked at levels slightly higher than the occurrence levels previously
mentioned (Planas et al. 2006, Field et al. 2003). Therefore, it was possible to obtain
these compounds at concentrations above the legislated values in the permeate even
when high removals were obtained. Taking into account the removal percentages
obtained, if the pesticides are present in the water at reported occurrence levels, we
can expect to attain nanofiltered permeate concentrations in the range of 0.01-3.84
g L-1. Compliance with legislated values would therefore be ensured for atrazine and
alachlor but not for pentachlorophenol, since lower rejection values were obtained
for this pesticide (Table 3.5 and Figure 3.3) and the legislated value is 0.1 g L-1
(Directive 98/83/EC).
0
20
40
60
80
100
% R
eje
ctio
n
Groundwater
Surface water
110
Since it was not possible to perform nanofiltration experiments during several
months, to mimic real operation conditions in water treatment facilities, an attempt
to mimic saturation conditions that are achieved during this operation was performed
in this study by conducting nanofiltration experiments after pre-adsorption on the
membrane under both static and dynamic conditions. Figures 3.3 and 3.4 show that
significant differences were not obtained in the total rejection of the selected
pesticides and hormones between the experiments carried out with and without pre-
adsorption of the compounds on the membrane, with the exception of the hormones
17-ethinylestradiol, estrone, and estriol. For these hormones, lower rejections were
obtained in the experiments carried out without pre-adsorption on the membrane
when compared to the experiments carried out with pre-adsorption in surface water.
These three hormones are the less hydrophobic among the five hormones addressed
in this study and therefore present higher solubility and are expected to adsorb to a
lesser extent to the membrane and natural organic matter (Schäfer et al. 2010), which
could explain the lower rejection observed in the surface water matrix.
Even though the experiments in this study were relatively long (44-93 h), the percent
rejections obtained remained very high and similar, or even increased, in the
nanofiltration assays conducted after static and dynamic adsorption (Figures 3.3 and
3.4). Therefore, results suggest that the rejection of the selected pesticides and
hormones may not be considerably changed in a long term operation and that the
membrane performance is not likely to be noticeably affected. Although a decrease in
the rejection of organic compounds has been reported in previous studies, due to the
decrease of their adsorption on the membrane surface and pores after achieving
membrane saturation conditions within 10 to 96 h of operation (Nghiem et al. 2004,
Yangali-Quintanilla et al. 2009, Kimura et al. 2003, Chang et al. 2002), studies
conducted by Bellona and Drewes (2007) and Yangali-Quintanilla et al. (2009) concur
with our findings.

Chapter 3
111
The results obtained in Table 3.4 show that static pre-adsorption doesn’t seem to
achieve saturation since, for many of the target hormones, there was still an
additional membrane adsorption effect, observed in the nanofiltration experiments
conducted after pre-adsorption. Even though static adsorption experiments were
conducted until a constant concentration was obtained for all the target analytes in
the solution (which took 27.5-168.4 h), the membranes obtained were still able to
continue adsorbing the target compounds spiked in fresh solutions in the
nanofiltration experiments. This observation may be explained by the fact that
dynamic adsorption is likely to allow the organic compounds to access to additional
membrane adsorption sites that were not easily accessed during pre-adsorption
under static conditions.
In the dynamic assays conducted after nanofiltration preceded by static pre-
adsorption (referred as Nanofiltration 2 in Figure 3.1), the additional adsorption on
the membrane was found to be considerably lower comparatively to the additional
adsorption obtained during the nanofiltration after static pre-adsorption (referred as
Nanofiltration in Figure 3.1 - I). This fact may be explained by the possible partial
membrane site saturation already achieved during static pre-adsorption. However,
the total percent rejection remained extremely high and independent of the water
matrix, showing that other rejection mechanisms besides adsorption may also play an
important role. As previously mentioned, size exclusion is likely to be important for
hormones rejection since these molecules have molecular weights very similar to the
top value of the MWCO range of the membrane used (150-300 Da).

112
3.4 CONCLUSIONS
Ultrafiltration proved to be a suitable process to remove particles with high
dimensions without affecting the concentration of ion species and soluble matter
present in the water matrices allowing the study to focus on these components. This
process will also decrease flux decline and fouling problems often associated with
nanofiltration of waters with high turbidity.
Nanofiltration proved to be extremely efficient to remove all the priority pesticides
and hormones selected, except pentachlorophenol, from different natural water
sources with very different compositions (ultrafiltered surface water and
groundwater) as well as several water quality parameters. For all the target analytes,
size exclusion and hydrophobic interactions were found to have a very important role
in rejection. The percent rejections obtained for all the water quality parameters,
hormones, and pesticides tested except pentachlorophenol were found to be
independent of the water matrix composition. Besides the deprotonation of this
molecule at the water pH and its hydrophobic interactions with the membrane, the
higher alkalinity, conductivity, and total hardness of the groundwater may decrease
the removal of pentachlorophenol in this water matrix due to charge screening
effects. Even though the adsorption of the organic compounds was attributed to
some characteristics of the compounds and water matrices, a full comprehension was
not attained since the real water matrices are very complex and concurrent effects
still exist despite the methodology followed. Since this deterministic approach doesn’t
allow a full understanding of the correlations between the variables analysed and the
adsorption of the target micropollutants, a multivariable statistical analysis could be
performed in future studies to assess the existence of simultaneous effects on the
removal of the target compounds and explain the complex relationships affecting the
mechanisms of rejection of the xenobiotics.

Chapter 3
113
The efficiency of nanofiltration to remove the micropollutants of interest under
membrane saturation conditions was also assessed. Even though it seems that
saturation was not fully accomplished when pre-adsorption was performed under
static conditions, results suggest that membrane efficiency with and without pre-
adsorption on the membrane is not likely to be considerably different. The high
efficiency of nanofiltration to remove the selected micropollutants under extended
adsorption conditions suggests that nanofiltration is likely to be very efficient to
produce high quality water under long term operations in water treatment utilities.
ACKNOWLEDGEMENTS
Financial support from Fundação para a Ciência e a Tecnologia, through the grants
PTDC/AMB/66024/2006 and PEst-OE/EQB/LA0004/2011 as well as the fellowships
BPD/26990/2006 and BD/72244/2010, is gratefully acknowledged.
The authors thank the EPAL team that collected the water samples. Sampling and
organic compounds analyses had the financial support of EPAL.
REFERENCES
Bellona C, Drewes JE, Xu P and Amy G (2004) Factors affecting the rejection of organic solutes during NF/RO treatment - A literature review. Water Res 38: 2795-2809.
Bellona C, Drewes JE (2007) Viability of a low-pressure nanofilter in treating recycled water for water reuse applications: A pilot-scale study. Water Res 41: 3948-3958.
Berg P, Hagmeyer G, Gimbel R (1997) Removal of pesticides and other micropollutants by nanofiltration. Desalination 113: 205-208.
Boussahel R, Montiel A, Baudu M (2002) Effects of organic and inorganic matter on pesticide rejection by nanofiltration. Desalination 145: 109-114.
Cessna AJ, Grover R (1978) Spectrophotometric determination of dissociation-constants of selected acidic herbicides. J Agr Food Chem 26: 289-292.
114
Chang S, Waite TD, Schäfer AI, Fane AG (2002) Adsorption of trace steroid estrogens to hydrophobic hollow fibre membranes. Desalination 146: 381-386.
Comerton AM, Andrews RC, Bagley DM, Yang P (2007) Membrane adsorption of endocrine disrupting compounds and pharmaceutically active compounds. J Membrane Sci 303: 267-277.
Comerton AM, Andrews RC, Bagley DM, Hao CY (2008) The rejection of endocrine disrupting and pharmaceutically active compounds by NF and RO membranes as a function of compound a water matrix properties. J Membrane Sci 313: 323-335.
Decision 2455/2001/EC of the European Parliament and of the Council of 20 November 2001 establishing the list of priority substances in the field of water policy and amending Directive 2000/60/EC, Official Journal of the European Communities, L 331/1 (2001).
Devitt EC, Ducellier F, Cote P, Wiesner MR (1998) Effects of natural organic matter and the raw water matrix on the rejection of atrazine by pressure-driven membranes. Water Res 32: 2563-2568.
Directive 98/83/EC of 3 November 1998 on the quality of the water intended for human consumption. Official Journal of the European Communities, L 330/32 (1998).
Dudziak M, Bodzek M (2009) Selected factors affecting the elimination of hormones from water using nanofiltration. Desalination 240: 236-243.
EN 1484: 1997. Water Analysis - Guidelines for the determination of total organic carbon (TOC) and dissolved organic carbon (DOC). The European Committee for Standardisation, Brussels, pp. 14 (1997).
Field, JA, Reed, RL, Sawyer, TE, Griffith, SM and Wigington, PJ (2003) Diuron occurrence and distribution in soil and surface and ground water associated with grass seed production. J Environ Qual 32: 171-179.
Gershfeld NL, Muramatsu M (1971) The interaction between steroid hormones nad lipid monolayers on water. J Gen Physiol 58: 650-666.
ISO/IEC 17025: 2005. General requirements for the competence of testing and calibration laboratories. International Organisation for Standardisation (2005).
Jardim WF, Montagner CC, Pescara IC, Umbuzeiro GA, Di Dea Bergamasco AM, Eldridge ML, Sodré FF (2012) An integrated approach to evaluate emerging contaminants in drinking water. Sep Purif Technol 84: 3-8.
Johnson AC, Sumpter JP (2001) Removal of endocrine-disrupting chemicals in activated sludge treatment works. Environ Sci Technol 35: 4697-4703.
Kaiser KLE, Valdmanis I (1982) Apparent octanol/water partition coefficients of pentachlorophenol as a function of pH. Can J Chemistry 60: 2104-2106.
Kimura K, Amy G, Drewes J, Watanabe Y (2003) Adsorption of hydrophobic compounds onto NF/RO membranes: An artifact leading to overestimation of rejection. J Membrane Sci 221: 89-101.
Kolodziej EP, Harter T, Sedlak DL (2004) Dairy wastewater, aquaculture, and spawning fish as sources of steroid hormones in the aquatic environment. Environ Sci Technol 38: 6377-6384.
Krieger R, Doull J, Ecobichon D, Gammon D, Hodgson E, Reiter L, Ross J, Handbook of Pesticides Toxicology: Principles. Elsevier Science, USA (2001).
Lu GH, Wang C, Yuan X, Lang PZ (2005) Quantitative structure-activity relationships for the toxicity of substituted benzenes to Cyprinus carpio. Biomed Environ Sci 18: 53-57.

Chapter 3
115
Meylan WM, Howard PH, Validation of water solubility estimation methods using log Kow for application in PCGEMS & EPI. Syracuse Research Corporation, Environmental Science Center, NY (1994).
Nghiem LD, Schäfer AI, Waite TD (2002a) Adsorption of estrone on nanofiltration and reverse osmosis membranes in water and wastewater treatment. Water Sci Technol 46: 265-272.
Nghiem LD, Schäfer AI, Waite TD (2002b) Adsorptive interactions between membranes and trace contaminants. Desalination 147: 269-274.
Nghiem L, Schäfer A, Elimelech M (2004) Removal of natural hormones by nanofiltration membranes: Measurement, modelling, and mechanisms. Environ Sci Technol 38: 1888-1896.
Nghiem L, Schäfer A, Elimelech M (2005) Pharmaceutical retention mechanisms by nanofiltration membranes. Environ Sci Technol 39: 7698-7705.
NP EN 27027: 1994. Water Quality: Determination of turbidity (1st
ed.). The European Committee for Standardisation, Brussels, pp. 6 (1994).
Nyström M, Aimar P, Luque S, Kulovaara M, Metsamuuronen S (1998) Fractionation of model proteins using their physiochemical properties. Colloid Surface A 138: 185-205.
Pesticide Properties DataBase, Agriculture & Environment Research Unit (AERU). Available online: http://sitem.herts.ac.uk/aeru/ppdb/en/17.htm; Last accessed: September 8, 2010.
Planas C, Puig A, Rivera J, Caixach J (2006) Analysis of pesticides and metabolites in Spanish surface waters by isotope dilution gas chromatography/mass spectrometry with previous automated solid-phase extraction - Estimation of the uncertainty of the analytical results. J Chromatogr A 1131: 242-252.
Routledge EJ, Sheahan D, Desbrow C, Brighty GC, Waldock M, Sumpter JP (1998) Identification of estrogenic chemicals in STW effluent 2 In vivo responses in trout and roach. Environ Sci Technol 32: 1559-1565.
Sanches S, Penetra A, Granado C, Cardoso VV, Ferreira E, Benoliel MJ, Barreto Crespo MT, Pereira VJ, Crespo JG (2011) Removal of pesticides and polycyclic aromatic hydrocarbons from different drinking water sources by nanofiltration. Desalin Water Treat 27: 141-149.
Schäfer A, Mauch R, Waite T, Fane A (2002) Charge effects in the fractionation of natural organics using ultrafiltration. Environ Sci Technol 36: 2572-2580.
Schäfer A, Nghiem L, Waite T (2003) Removal of the natural hormone estrone from aqueous solutions using nanofiltration and reverse osmosis. Environ Sci Technol 37: 182-188.
Schäfer AI, Nghiem LD, Meier A, Neale PA (2010) Impact of organic matrix compounds on the retention of steroid hormone estrone by a 'loose' nanofiltration membrane. Sep Purif Technol 73: 179-187.
Schwarzenbach RP, Gschwend PM, Imboden DM, In Environmental Organic Chemistry. John Wiley & Sons, Inc, New York (1993).
Snyder SA, Keith TL, Verbrugge DA, Snyder EM, Gross TS, Kannan K, Giesy JP (1999) Analytical methods for detection of selected estrogenic compounds in aqueous mixtures. Environ Sci Technol 33: 2814-2820.
Snyder SA, Adham S, Redding AM, Cannon FS, DeCarolis J, Oppenheimer J, Wert E, Yoon Y (2007) Role of membranes and activated carbon in the removal of endocrine disruptors and pharmaceuticals. Desalination 202: 156-181.
Standard Method 2320B. Titration method, in: Standard methods for the examination of water and wastewater. American Water Works Association, Washington DC (1995).
116
Standard Method 2340-B. Hardness by calculation, in: Standard methods for the examination of water and wastewater. American Water Works Association, Washington DC (1995).
Standard Method 2510-B. Conductimetry method, in: Standard methods for the examination of water and wastewater. American Water Works Association, Washington DC (1995).
Standard Method 4500-H+B. Electrometric method, in: Standard methods for the examination of water and wastewater. American Water Works Association, Washington DC (1995).
Stapleton M, Sparks D, Dentel S (1994) Sorption of entachlorophenol to HDTMA-CLAY as a function of ionic-strength and pH. Environ Sci Technol 28: 2330-2335.
Ternes TA, Stumpf M, Mueller J, Haberer K, Wilken RD, Servos M (1999a) Behaviour and occurrence of estrogens in municipal sewage treatment plants - I Investigations in Germany, Canada and Brazil. Sci Total Environ 225: 81-90.
Ternes TA, Kreckel P, Mueller J (1999b) Behaviour and occurrence of estrogens in municipal sewage treatment plants - II Aerobic batch experiments with activated sludge. Sci Total Environ 225: 91-99.
Van der Bruggen B, Schaep J, Maes W, Wilms D, Vandecasteele C (1998) Nanofiltration as a treatment method for the removal of pesticides from ground waters. Desalination 117: 139-147.
Van der Bruggen B, Everaert K, Wilms D, Vandecasteele C (2001) Application of nanofiltration for removal of pesticides, nitrate and hardness from groundwater: Rejection properties and economic evaluation. J Membrane Sci 193: 239-248.
Van der Bruggen B, Vandecasteele C (2003) Removal of pollutants from surface water and groundwater by nanofiltration: overview of possible applications in the drinking water industry. Environ Pollut 122: 435-445.
Van der Bruggen B, Manttari M, Nyström M (2008) Drawbacks of applying nanofiltration and how to avoid them: A review. Sep Purif Technol 63: 251-263.
Yangali-Quintanilla V, Sadmani A, McConville M, Kennedy M, Amy G (2009) Rejection of pharmaceutically active compounds and endocrine disrupting compounds by clean and fouled nanofiltration membranes. Water Res 43: 2349-2362.

CHAPTER 4
Assessment of phenomena underlying the removal of micropollutants during water treatment by nanofiltration
using multivariate statistical analysis

118
Published in: Separation and Purification Technology
Sanches S, Galinha CF, Barreto Crespo MT, Pereira VJ, Crespo JG (2013) Assessment of
phenomena underlying the removal of micropollutants during water treatment by
nanofiltration using multivariate statistical analysis. Sep Purif Technol 118: 377-386.
Sandra Sanches was involved in all the modelling work presented in this chapter. The
Matlab program used to develop multivariate statistical models was implemented by
Cláudia Galinha, who was also closely involved in the development and discussion of
all the models attained towards the establishment of the final models. João Crespo,
Vanessa Pereira, and Teresa Crespo supervised all the work carried out.
Chapter 4
119
CONTENTS
Abstract ............................................................................................................. 120
4.1 Introduction ................................................................................................. 121
4.2 Materials and Methods ................................................................................. 123
4.2.1 Cross-flow nanofiltration experiments .............................................................. 123
4.2.2 Analytical methods ............................................................................................. 123
4.2.3 Development of PLS models............................................................................... 124
4.2.3.1 Description of the parameters used as inputs ........................................ 124
4.2.3.2 Optimisation and selection of the models .............................................. 128
4.3 Results and Discussion .................................................................................. 130
4.3.1 Univariate analysis ............................................................................................. 130
4.3.2 Multivariate statistical analysis .......................................................................... 131
4.3.2.1 Modelling of rejection ............................................................................. 132
4.3.2.2 Modelling of adsorption .......................................................................... 139
4.4 Conclusions .................................................................................................. 144
Acknowledgements ............................................................................................ 146
References ......................................................................................................... 146

120
ABSTRACT
Multivariate statistically-based models were developed for the comprehension of the
phenomena underlying the removal of several micropollutants during drinking water
treatment. Projection to latent structures (PLS) modelling was used to describe the
apparent rejection as well as adsorption using specific descriptors of the molecules
(physico-chemical properties and molecular size parameters), descriptors of the
membrane used and of the water matrices, and operating related conditions.
Multilinear PLS models with good descriptive capability towards rejection were
developed. Alkalinity, molecular size descriptors, molecular weight, molar volume,
and log D were found to be the most relevant contributors for the rejection of the
selected micropollutants, showing the impact of size exclusion and electrostatic
interactions with minor contributions of hydrophobic interactions. The incorporation
of molecular size descriptors demonstrated that the geometry of the molecule is
important to determine rejection when molecules have very different geometry.
Conversely, PLS modelling of adsorption required also the inclusion of quadratic and
interaction terms to achieve good description. Adsorption of the selected compounds
seems to be mainly determined by polar and electrostatic interactions rather than
hydrophobic and may be described by polarisability as well as several specific
interactions. Additionally, the incorporation of molecular size descriptors did not
improve modelling of adsorption, showing that molecular geometry is not so
important to describe this process as for rejection.

Chapter 4
121
4.1 INTRODUCTION
The mechanisms that govern the removal of micropollutants from water during
pressure-driven membrane processes have been thoroughly investigated. Depending
on the physico-chemical properties of the micropollutants as well as membrane and
water characteristics, removal may be attributed to one or several mechanisms.
Adsorption is one of the main mechanisms contributing for the rejection of organic
compounds by nanofiltration, in addition to columbic interactions, hydrogen bonding,
and steric hindrance as revised by Karabelas and Plakas (2011).
Attempts for the comprehension of the phenomena underlying the removal of several
micropollutants by nanofiltration were carried out by establishing correlations
between their rejection or adsorption with specific properties of the molecules.
Yangali-Quintanilla and co-workers (2009) attained good linear correlations of
rejection with molecular weight and molecular size parameters (equivalent width and
molecular width) in a study carried out in pure water spiked with several organic
compounds and dissolved organic carbon. Interesting positive correlations of
rejection with different molecular size parameters were also reported by other
authors using different membranes (Van der Bruggen et al. 1999). In another study
conducted with pure water, adsorption was found to positively correlate well with the
logarithm of the octanol-water partition coefficient while rejection showed poor
correlation (Kiso et al. 2001). Other parameters such as the charge of the molecule,
polarity (dipole moment), and acid dissociation constant are also among the
important factors that impact rejection (Karabelas and Plakas 2011, Van der Bruggen
et al. 1999). Rejection of organic compounds may also vary considerably depending
on the water composition in terms of pH, ionic composition, and presence of natural
organic matter (e.g. Sanches et al. 2011, Salvaterra et al. 2011, Chang et al. 2012,
Zhang et al. 2004). The charge and the molecular weight cut-off are the most relevant
122
characteristics of the membranes that impact the process efficiency (Karabelas and
Plakas 2011).
The experiments in this field were mostly carried out in pure or synthetic waters. This
is the most suitable strategy to unravel the individual impact of specific water
components and molecular properties on the removal of target compounds and has
provided useful information. Nevertheless, this approach is not accurate enough to
describe the removal of micropollutants during drinking water treatment since
complex interactions are expected between the solutes, water components, and
membranes as revised by Karabelas and Plakas (2011). As a result, the establishment
of univariate correlations between the removal of micropollutants in natural waters
and specific parameters is often not conclusive as reported in Chapter 3 (Sanches et
al. 2012). This difficulty is probably related with the occurrence of synergies and
concurrent effects that should be accounted to infer about the parameters that most
impact the process. Another example is the study from Comerton and co-workers
(2008) who reported that the correlation between rejection and log Kow that was
attained in milli-Q water was not observed in surface water. The identification of the
key parameters that determine the removal of micropollutants from natural waters
and the comprehension of the respective complex mechanisms is not straightforward
and needs further assessment.
Multivariate statistical analysis has been successfully applied for monitoring several
key performance parameters of membrane bioreactors for wastewater treatment as
well as to correlate them with specific operating and analytical parameters (Galinha et
al. 2012). The fact that non-mechanistic models may be useful to correlate large sets
of data and unravel relationships between several variables might help to take a step
forward towards the full comprehension of solute rejection in natural matrices.

Chapter 4
123
In the present study, a mathematical approach based on projection to latent
structures was applied to model data from cross-flow nanofiltration experiments
carried out previously (Sanches et al. 2012) to address the removal of pesticides
(atrazine, alachlor, and pentachlorophenol) and hormones (17-estradiol, 17-
ethinylestradiol, estriol, estrone, and progesterone) from natural waters (surface
water and groundwater). The optimisation of multilinear models was conducted to
correlate apparent rejection and adsorption with specific physico-chemical
properties, molecular size parameters, water media, and operating related
parameters. The most important contributors were identified based on the analysis of
the regression coefficients of the optimised models. These models were interpreted
and discussed to infer about the mechanisms involved in rejection and adsorption of
the target micropollutants.
4.2 MATERIALS AND METHODS
4.2.1 Cross-flow nanofiltration experiments
Nanofiltration experiments were carried out in a cross-flow filtration unit using a flat-
sheet Desal 5DK membrane as described in Sanches et al. (2012) and presented in
Chapter 3 of the present thesis.
4.2.2 Analytical methods
The analytical methods applied for the quantification of the target compounds were
described in Sanches et al. (2012) and are presented in Appendix A.1.
124
4.2.3 Development of PLS models
Multivariate statistically-based models were developed to correlate apparent
rejection and adsorption attained during cross-flow nanofiltration experiments with
specific physico-chemical properties and molecular size descriptors of the target
micropollutants as well as water media. Operating conditions were also incorporated
in the model since some important differences are likely to have impacted the
removal of the target micropollutants. PLS was applied to describe apparent rejection
and adsorption (outputs) through multilinear correlations of several parameters
(inputs).
PLS models were implemented in Matlab using the n-way tool box (Andersson and
Bro 2000).
4.2.3.1 Description of the parameters used as inputs
The description of all parameters used as inputs in this study is presented in Table 4.1.
Specific properties of the micropollutants – molecular weight (MW), logarithm of the
octanol-water distribution ratio at pH 7.4 (log D), dipole moment (), inverse of the
logarithm of the acid dissociation constant (pKa), water solubility (Ws), molar volume
(Vm), and polarisability (P) - as well as molecular size and geometry descriptors were
used to develop the models. These descriptors were selected for being pointed out as
key parameters to describe rejection and adsorption based on the literature available
on the field (e.g. Yangali-Quintanilla et al. 2009, Van der Bruggen et al. 1999, Kiso et
al. 2001, Van der Bruggen and Vandecasteele 2001, Comerton et al. 2007, Van der
Bruggen et al. 2001).
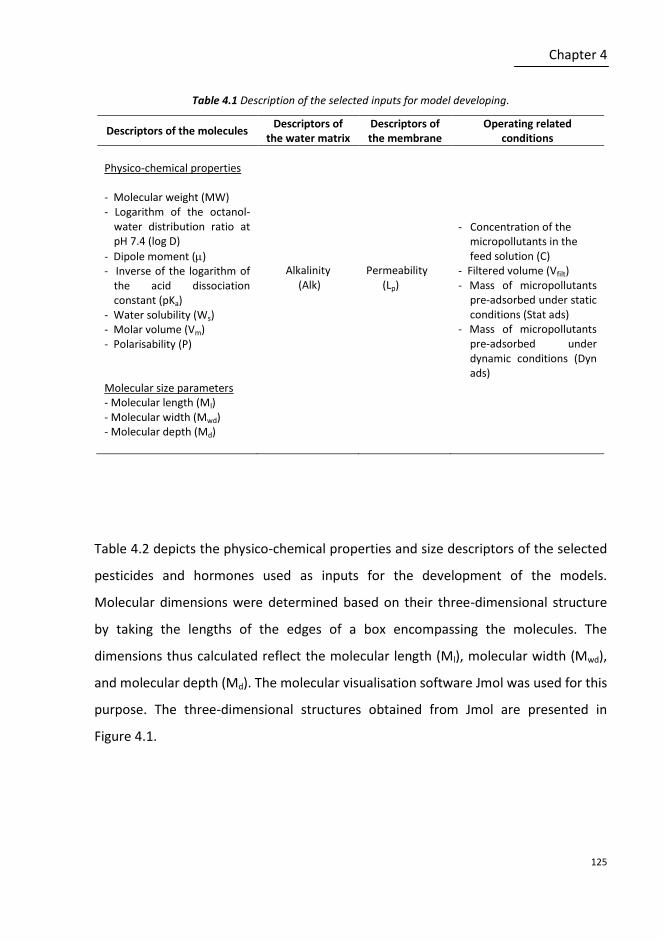
Chapter 4
125
Table 4.1 Description of the selected inputs for model developing.
Descriptors of the molecules Descriptors of
the water matrix Descriptors of the membrane
Operating related conditions
Physico-chemical properties - Molecular weight (MW) - Logarithm of the octanol-
water distribution ratio at pH 7.4 (log D)
- Dipole moment () - Inverse of the logarithm of
the acid dissociation constant (pKa)
- Water solubility (Ws) - Molar volume (Vm) - Polarisability (P) Molecular size parameters - Molecular length (Ml) - Molecular width (Mwd) - Molecular depth (Md)
Alkalinity (Alk)
Permeability (Lp)
- Concentration of the micropollutants in the feed solution (C)
- Filtered volume (Vfilt) - Mass of micropollutants
pre-adsorbed under static conditions (Stat ads)
- Mass of micropollutants pre-adsorbed under dynamic conditions (Dyn ads)
Table 4.2 depicts the physico-chemical properties and size descriptors of the selected
pesticides and hormones used as inputs for the development of the models.
Molecular dimensions were determined based on their three-dimensional structure
by taking the lengths of the edges of a box encompassing the molecules. The
dimensions thus calculated reflect the molecular length (Ml), molecular width (Mwd),
and molecular depth (Md). The molecular visualisation software Jmol was used for this
purpose. The three-dimensional structures obtained from Jmol are presented in
Figure 4.1.
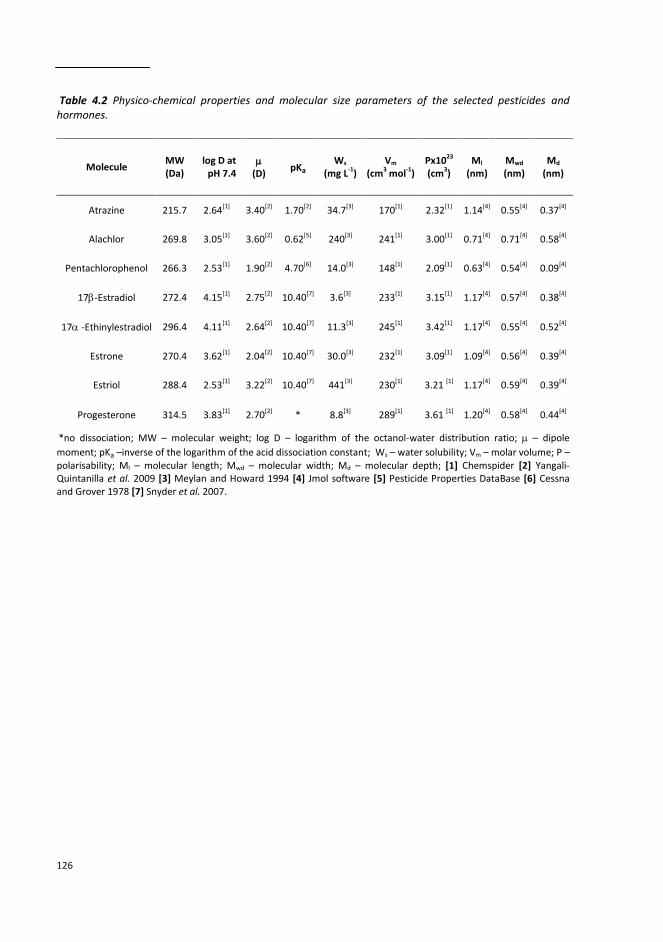
126
Table 4.2 Physico-chemical properties and molecular size parameters of the selected pesticides and hormones.
*no dissociation; MW – molecular weight; log D – logarithm of the octanol-water distribution ratio; – dipole
moment; pKa –inverse of the logarithm of the acid dissociation constant; Ws – water solubility; Vm – molar volume; P – polarisability; Ml – molecular length; Mwd – molecular width; Md – molecular depth; [1] Chemspider [2] Yangali-Quintanilla et al. 2009 [3] Meylan and Howard 1994 [4] Jmol software [5] Pesticide Properties DataBase [6] Cessna and Grover 1978 [7] Snyder et al. 2007.
Molecule MW (Da)
log D at
pH 7.4
(D)
pKa
Ws (mg L-1)
Vm (cm3 mol-1)
Px1023 (cm3)
Ml (nm)
Mwd (nm)
Md (nm)
Atrazine 215.7 2.64[1] 3.40[2] 1.70[2] 34.7[3] 170[1] 2.32[1] 1.14[4] 0.55[4] 0.37[4]
Alachlor 269.8 3.05[1] 3.60[2] 0.62[5] 240[3] 241[1] 3.00[1] 0.71[4] 0.71[4] 0.58[4]
Pentachlorophenol 266.3 2.53[1] 1.90[2] 4.70[6] 14.0[3] 148[1] 2.09[1] 0.63[4] 0.54[4] 0.09[4]
17-Estradiol 272.4 4.15[1] 2.75[2] 10.40[7] 3.6[3] 233[1] 3.15[1] 1.17[4] 0.57[4] 0.38[4]
17 -Ethinylestradiol 296.4 4.11[1] 2.64[2] 10.40[7] 11.3[3] 245[1] 3.42[1] 1.17[4] 0.55[4] 0.52[4]
Estrone 270.4 3.62[1] 2.04[2] 10.40[7] 30.0[3] 232[1] 3.09[1] 1.09[4] 0.56[4] 0.39[4]
Estriol 288.4 2.53[1] 3.22[2] 10.40[7] 441[3] 230[1] 3.21 [1] 1.17[4] 0.59[4] 0.39[4]
Progesterone 314.5 3.83[1] 2.70[2] * 8.8[3] 289[1] 3.61 [1] 1.20[4] 0.58[4] 0.44[4]

Chapter 4
127
Figure 4.1 Molecular structures of the selected pesticides and hormones encompassed in a box used for the determination of measurements that reflect size parameters (grey – carbon; white – hydrogen; green – chloride; red – oxygen; blue – nitrogen) obtained from Jmol software.
Since the present study assessed two different water matrices (ultrafiltered
groundwater and surface water), only one input parameter is required to distinguish
them in PLS modelling. Since the concentration of total organic carbon was under the
detection limit for the groundwater, alkalinity (Alk) was selected over this parameter
as representative of the water matrix (57.9 and 232 mg L-1 CaCO3 in surface water and
groundwater, respectively). Additionally, a previous study from the authors using
pure water, groundwater, spring water, and surface water demonstrated that
alkalinity is likely to play an important role in the rejection of alachlor (Sanches et al.
2011).
Operating related descriptors such as the concentration of the molecules in the feed
solutions (C), filtered volume (Vfilt) as well as the mass of micropollutants pre-
adsorbed under static (Stat ads) and dynamic (Dyn ads) conditions were also used as
inputs since there were differences in these parameters among the experiments
carried out. Concentrations of the organic compounds spiked in the feed solutions
were not the same as mentioned in Chapter 3. Furthermore, the concentrations used
Progesterone
Atrazine Alachlor Pentachlorophenol 17-Estradiol
17-Ethinylestradiol Estrone Estriol

128
for model development were the concentrations determined by the analytical
methods employed. Filtration volumes were also set in accordance with the volumes
required for the analysis of each group of compounds.
Permeability was used as a membrane descriptor since it was different for the
different water matrices assessed and it varied among the different experiments
carried out. The performance of pre-adsorption of the target compounds on some of
the membranes may also have contributed to some observed changes in their
permeability.
All experimental data used in PLS models were previously normalised by subtracting
to each value the average of the experimental data of the respective variable and
dividing by the respective standard deviations. With this procedure all variables are
fed to the model with comparable weights, regardless of the units used for each
variable. The regression coefficients of each model obtained are, therefore,
normalised and can be compared between them.
4.2.3.2 Optimisation and selection of the models
A group of 37 sampling events (observed data) were used for the development of the
models (Appendix A.3). Sampling events were randomly divided into two sets:
training and validation. The training set encompassed 75% of the sampling events and
was used to calibrate the model while the remaining 25% were used to carry out
validation. The same training and validation sets were used to develop the models for
an output to allow direct comparison among the different models.
The selection of the number of latent variables of each PLS regression and model
optimisation were made based on the lowest root mean square error of cross-

Chapter 4
129
validation (RMSECV). This parameter translates the error of the calibration set
established through cross-validation, and was calculated using Equation 4.1:
-
where yi is the experimental value at the i event, ŷi is the predicted value for the i
event using the model obtained with N-i events, and N is the number of sampling
events in the calibration set.
The first approach employed to predict the outputs was the development of simple
multilinear PLS models:
where a, b, and c are the regression coefficients and x1, x2, and x3 are the useful
predictors to describe the modelled output. Whenever this approach was not
accurate enough to describe an output due to the existence of complex non-linear
relationships, interaction and quadratic terms were also introduced as inputs. The
models, thus, obtained reflect the crossed interferences between inputs as follows:
Three different mathematical approaches were used to select useful inputs: iterative
stepwise elimination (ISE) (Boggia et al. 1997), stepwise elimination (Ryan 1997), and
the Martens uncertainty test (Forina et al. 2004) using the jackknife standard
deviations (Duchesne and MacGregor 2001). These methods enabled the elimination
of non-useful inputs for each output, resulting in better prediction with fewer inputs.
However, the different selection methods usually result in models with different
number of inputs. The final models were then selected based not only on the
RMSECV, but also on the root mean square error of prediction (RMSEP), training and
(4.1)
(4.2)
(4.3)

130
validation determination coefficients, and the slopes of the fitting between observed
and predicted data for the training and validation sets.
4.3 RESULTS AND DISCUSSION
4.3.1 Univariate analysis
The establishment of univariate correlations between the removal of micropollutants
in natural waters and specific parameters is often not conclusive. Nevertheless, an
attempt to establish simple univariated correlations between specific descriptors and
apparent rejection or adsorption was carried out prior to multivariate analysis. The
selection of the descriptors to establish these correlations was based on correlations
obtained by other authors (Yangali-Quintanilla et al. 2009, Van der Bruggen et al.
1999, Kiso et al. 2001). As an example, Figure 4.2 depicts the variation of rejection
with molecular weight (Figure 4.2a), dipole moment (Figure 4.2b), and molar volume
(Figure 4.2c) as well as the variation of adsorption with log D (Figure 4.2d), in the
experiments conducted without pre-adsorption in groundwater.
A correlation between apparent rejection or adsorption data and the selected
descriptors cannot be established undoubtedly. Univariate analysis is, therefore, not
sufficient to describe these variables probably due to the existence of complex
interactions. To unravel these complex relationships, multivariate statistically-based
models were developed as discussed below.

Chapter 4
131
Figure 4.2 Univariated correlations between rejection and (a) molecular weight, (b) dipole moment, and (c) molar volume as well as (d) between adsorption and log D. Experimental data present in the plots were obtained for nanofiltration of groundwater spiked with the selected micropollutants carried out without pre-adsorption.
4.3.2 Multivariate statistical analysis
Besides its potential as a predictive tool, PLS modelling can be used to understand the
relationships between the outputs and the respective input descriptors. In the
present study, PLS models were developed aiming at the identification of the
significant parameters that correlate with apparent rejection and adsorption.
Several PLS models were developed for each output. Optimisation was carried out
aiming at selection of the relevant inputs and to simplify the interpretation of the
correlations attained. The selected models as well as the regression coefficients of the
60
70
80
90
100
200 240 280 320 360
Ap
par
en
t R
eje
ctio
n (%
)
Molecular Weight (Da)
60
70
80
90
100
0 1 2 3 4
Ap
par
en
t R
eje
ctio
n (%
)
Dipole Moment (D)
60
70
80
90
100
0 100 200 300 400
Ap
par
en
t R
eje
ctio
n (%
)
Molar Volume (cm3/mol)
0
20
40
60
80
100
0 2 4 6
Ad
sorp
tio
n (%
)
Log D
(a) (b)
(c) (d)

132
model inputs (contribution of the relevant inputs to the model) are depicted in the
next sections. A detailed discussion about the relationships between the outputs and
the corresponding descriptors established by the models is also provided.
4.3.2.1 Modelling of rejection
Figure 4.3 illustrates the optimised models obtained to describe apparent rejection
where observed data is plotted versus modelled predictions (Figures 4.3a, c, and e).
Regression coefficients relative to the inputs are also depicted for each model as bars
(Figures 4.3b, d, and f) and correspond to regression coefficients of Equation 4.2.
Comparison of regression coefficients values is possible since they were obtained
from normalised data.
The first approach to model rejection (model 1) consisted in the development of a
simple multilinear PLS model using as initial inputs the water matrix descriptor, all
operating related conditions, permeability, and all physico-chemical properties
depicted in Table 4.2 (Figures 4.3a and b). The optimised model requires six of these
inputs to describe apparent rejection (water alkalinity, molecular weight, dipole
moment, molar volume, polarisability, and filtered volume). Despite the model
obtained resulted in an overall good description of apparent rejection, some of the
lowest points modelled have high deviations (Fig. 3a). Therefore, an attempt to
improve the prediction of these points was made through the incorporation of
molecular geometric descriptors (length, width, and depth) as model inputs (model
2).

Chapter 4
133
50
70
90
110
50 70 90 110
Ob
serv
ed
(% A
pp
are
nt
Re
ject
ion
)
Predicted (% Apparent Rejection)
TrainingValidation
-1.5
-1.0
-0.5
0.0
0.5
1.0
Alk
MW μ
Vm P
Vfi
lt
50
70
90
110
50 70 90 110
Ob
serv
ed
(% A
pp
are
nt
Re
ject
ion
)
Predicted (% Apparent Rejection)
TrainingValidation
-1.5
-1.0
-0.5
0.0
0.5
1.0
Alk
MW
log
D
Vm C
Ml
Mw
d
Md
Model 1:
RMSEP=1.9 % rejection RMSECV=4.9 % rejection Training: R
2=0.88; slope= 1.00 Validation: R
2=0.95; slope=0.90
(a) (b)
(c) (d)
RMSEP= 1.6 % rejection RMSECV=5.1 % rejection Training: R
2=0.84; slope=1.00 Validation: R
2=0.98; slope=1.00
Model 2:

134
Figure 4.3 Optimised multilinear models developed by PLS to predict apparent rejection and the respective normalised regression coefficients related to the relevant inputs: model 1 (a and b) was obtained using all observed data without including molecular size parameters; model 2 (c and d) was obtained using all observed data and molecular size parameters; model 3 (e and f) was obtained by excluding observations associated with pentachlorophenol without using molecular size parameters. RMSEP, RMSECV, R
2 values, and slopes of training and validation sets are provided for each model. Alk –
alkalinity; MW – molecular weight; – dipole moment; Vm – molar volume; P – polarisability; Vfilt – filtered volume; log D – logarithm of the octanol-water distribution ratio at pH 7.4; C – concentration; Ml – molecular length; Mwd – molecular width; Md – molecular depth; pKa – inverse of the logarithm of the acid dissociation constant; Dyn ads – mass of micropollutants pre-adsorbed under dynamic conditions.
Even though the model obtained using molecular size parameters presents a slightly
higher RMSEP (1.9%), comparatively to the first model (1.6%), the RMSECV was
slightly improved from 5.1 to 4.9%, and the fitting of observed and predicted data in
the two models is quite similar (Figures 4.3a and c), as demonstrated by R2
coefficients of training (0.84 vs 0.88) and validation (0.98 vs 0.95). However, the
introduction of geometry descriptors as initial inputs in PLS modelling led to the
elimination of some relevant predictors selected in model 1 (dipole moment,
polarisability, and filtered volume) and to the incorporation of the three molecular
size parameters (Figures 4.3b and d), showing the relevance of size parameters as
85
90
95
100
105
85 90 95 100 105
Ob
serv
ed
(%
Ap
par
en
t R
eje
ctio
n)
Predicted (% Apparent Rejection)
TrainingValidation -1.5
-1.0
-0.5
0.0
0.5
1.0
Alk
MW
log
D
pK
a
Vm C
Vfi
lt
Dyn
ad
s
RMSEP= 1.4 % rejection RMSECV=1.9 % rejection Training: R
2=0.70; slope=0.99 Validation: R
2=0.86; slope=1.16
(f) (e)
Model 3:

Chapter 4
135
rejection descriptors over other parameters. Elimination of dipole moment and
polarisability occurs because these descriptors enclose information that is already
captured by molecular size parameters. Although dipole moment and polarisability
may capture geometry related information, they do not capture all the variance that
is captured by molecular size parameters.
Molecular length (Ml) and molecular depth (Md) are the size parameters that most
impacted rejection since significant differences are observed for these parameters
among the selected molecules (Table 4.2 and Figure 4.1). In model 2, Log D and the
concentration of the micropollutant in the feed solution, were also selected as
relevant descriptors of apparent rejection. In the presence of the molecular size
descriptors, log D and concentration appear to replace, respectively, the information
relative to physico-chemical properties and operating related conditions previously
provided by , P, and Vfilt in model 1.
Since the experimental rejections obtained for pentachlorophenol (57.5-83.5%) were
systematically lower comparatively to the other compounds (>90%), a model
excluding the experimental observations attained for this molecule was developed
(model 3) using the inputs described in Table 4.1, including and excluding molecular
size parameters. This model was attained among several models generated through
the establishment of different combinations of the inputs that were found relevant
throughout the optimisation process. The best model was obtained without using
molecular size descriptors as inputs (Figures 4.3e and f). The very different geometry
of pentachlorophenol, relatively to the geometry of the other molecules addressed in
this study, may explain the fact that molecular size descriptors were not found
relevant inputs in this new model in opposition to model 2. As illustrated in Figure 4.1
and Table 4.2, this molecule is smaller and more plane than the others. To describe its
removal, molecular depth is likely to assume particular significance since this size
parameter is considerably lower for this molecule. Molecular size parameters such as

136
the molecular length and molecular depth are considered important predictors in
model 2 since they enclose information necessary to describe the removal of
pentachlorophenol during nanofiltration. Furthermore, molecular size parameters are
not essential to describe the rejection of the remaining molecules addressed, as
suggested by the comparison of models 2 and 3, because of their more similar
geometry. Pentachlorophenol is likely to break through the free volume of the
membrane polymer more easily than the other molecules due to its smaller size and
geometry, highlighting the importance of size exclusion mechanisms.
In model 1 both polarisability and dipole moment have a positive effect upon
rejection when geometry is not accounted (Figure 4.3b). Polarisability is the ability for
a molecule to be polarised and may be defined as a proportionality factor between
induced dipole moment and the electrical field. The fact that polarisability was found
to be a useful predictor of rejection, in addition to dipole moment, suggests the
existence of a local electrostatic environment near the membrane surface that should
be taken into consideration. For molecules with higher dipole moment, the solute
dipole moment may orient towards the membrane surface, so that the side of the
dipole with the opposite charge is closer to the membrane surface. As the dipole is
directed towards the membrane, its penetration into the membrane structure is
facilitated for polar molecules comparatively to non-polar with similar size, leading to
a lower rejection of more polarised molecules (Van der Bruggen et al. 1999).
Nevertheless, positive correlations were found between dipole moment/polarisability
and rejection. Since dipole moment and polarisability were not selected in model 2
and 3, their presence in model 1 is probably an attempt to explain the lowest
rejections of pentachlorophenol relatively to the other micropollutants since its
polarisability (2.09x10⁻²³ cm3) and dipole moment (1.90 D) are the lowest among all
the molecules addressed (>2.32x10⁻²³ cm3 and >2.04 D). The comparison of all models
attained demonstrates that molecular size parameters are more relevant to describe

Chapter 4
137
the rejection of the micropollutants when the geometry of the compounds is
significantly different between them. However, in the absence of major geometric
differences other descriptors (polarisability and dipole moment) are preferred to
describe the rejection.
As illustrated in Figure 4.3d, besides geometric descriptors, alkalinity, molecular
weight, log D, molar volume, and concentration are also relevant for the description
of rejection according with model 2. The negative correlation found between
alkalinity and rejection in the present study corroborates data from a previous study
from the authors (Sanches et al. 2011) in which it was proposed that ionic species
pr s nt n th w t r m “sh l ” th solut s n th m m r n sur h rg
Electrostatic interactions between the organic compounds and the negatively charged
membrane may be therefore reduced, ultimately leading to a decreased rejection.
The presence of ionic compounds in solution may also contribute to facilitate the
breakthrough of the target solute molecules across the membrane by reducing the
length of their Debye double layer.
The negative correlation of rejection with molecular weight (found in the three
models – 1, 2 and 3) is apparently unexpected, since a positive correlation is usually
reported in literature (Karabelas and Plakas 2011). Although molecular weight is a
useful indicator of rejection, the combination of molecular size parameters is pointed
out as better predictor of steric hindrance effects upon the rejection of molecules by
nanofiltration membranes. Molecules with similar molecular weights do not
necessarily have larger molecular dimensions, as demonstrated by comparing the
molecular weight and molecular size parameters of pentachlorophenol and the other
micropollutants (Table 4.2). In the present study, molecular weight was selected as
one of the most relevant parameters to describe apparent rejection, however, the
molar volume was also found to be a relevant descriptor. In fact, molar volume is a
more reliable measure of molecular size than molecular weight, has a similar weight

138
as input parameter in all models (models 1, 2 and 3), and it correlates positively with
rejection, as expected. These two parameters may therefore account together the
size of the molecule in the optimised models.
Models 2 and 3 also negatively correlate apparent rejection with log D (Figures 4.3d
and f). Even though log D is a useful indicator of adsorption interactions between the
molecules and membranes, it may also impact rejection. The explanation following
this correlation is that molecules with higher log D values are usually more
concentrated at the membrane surface and when adsorption equilibrium is achieved,
molecules are more prone to diffuse across the membrane, leading to a decrease in
rejection (Kimura et al. 2003).
pKa was only found to be a relevant descriptor of rejection in model 3 (Figure 4.3f).
The negative correlation found between pKa and rejection is supported by the
dissociation state of the molecules with lower pKa at the pH of the natural waters (7.8
and 8.2 for surface water and groundwater, respectively). Thus, repulsive electrostatic
interactions between dissociated molecules and the negatively charged membranes
are expected to occur, leading to enhanced rejections.
The micropollutant concentration was also found to correlate positively with the
apparent rejection in models 2 and 3 with a minor contribution in model 2 (Figures
4.3d and f). Although the compounds were not spiked at the exactly same
concentration in water matrices, a similar concentration was always applied in all
experiments for a given compound (as explained in Chapter 3). In model 2, this input
may, therefore, not only reflect the variability of concentration of the compounds
present but also the significantly different concentration of pentachlorophenol. Its
interpretation is, therefore, not straightforward.
Besides micropollutants concentration, the filtered volume and dynamic pre-
adsorption are the only operating related conditions also relevant to describe
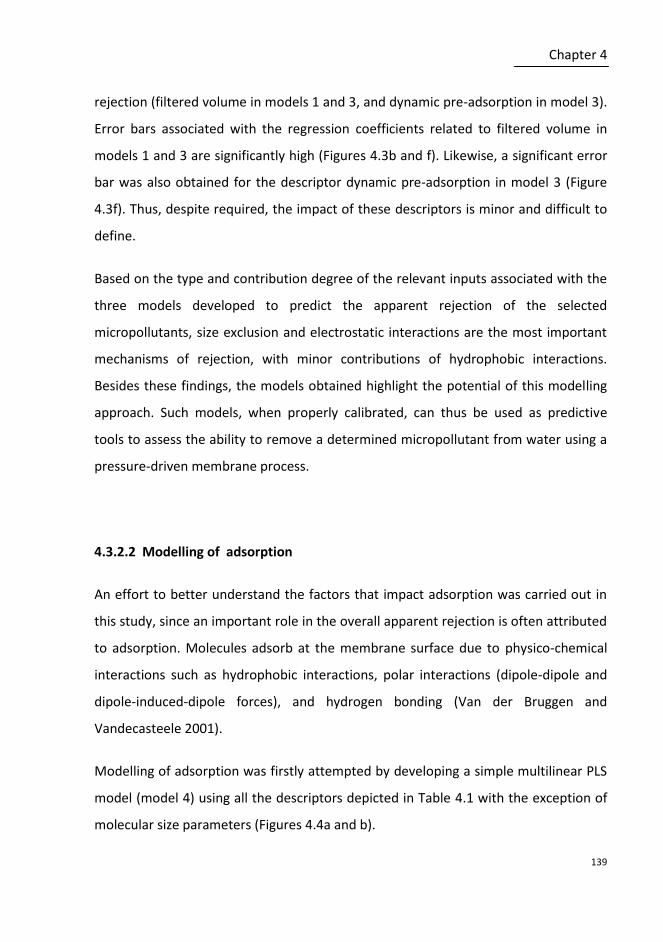
Chapter 4
139
rejection (filtered volume in models 1 and 3, and dynamic pre-adsorption in model 3).
Error bars associated with the regression coefficients related to filtered volume in
models 1 and 3 are significantly high (Figures 4.3b and f). Likewise, a significant error
bar was also obtained for the descriptor dynamic pre-adsorption in model 3 (Figure
4.3f). Thus, despite required, the impact of these descriptors is minor and difficult to
define.
Based on the type and contribution degree of the relevant inputs associated with the
three models developed to predict the apparent rejection of the selected
micropollutants, size exclusion and electrostatic interactions are the most important
mechanisms of rejection, with minor contributions of hydrophobic interactions.
Besides these findings, the models obtained highlight the potential of this modelling
approach. Such models, when properly calibrated, can thus be used as predictive
tools to assess the ability to remove a determined micropollutant from water using a
pressure-driven membrane process.
4.3.2.2 Modelling of adsorption
An effort to better understand the factors that impact adsorption was carried out in
this study, since an important role in the overall apparent rejection is often attributed
to adsorption. Molecules adsorb at the membrane surface due to physico-chemical
interactions such as hydrophobic interactions, polar interactions (dipole-dipole and
dipole-induced-dipole forces), and hydrogen bonding (Van der Bruggen and
Vandecasteele 2001).
Modelling of adsorption was firstly attempted by developing a simple multilinear PLS
model (model 4) using all the descriptors depicted in Table 4.1 with the exception of
molecular size parameters (Figures 4.4a and b).

140
0
20
40
60
80
100
120
0 20 40 60 80 100 120
Ob
serv
ed
(% A
dso
rpti
on
)
Predicted (% Adsorption)
TrainingValidation
0.0
0.2
0.4
0.6
0.8
1.0
1.2
Vfi
lt
Stat
ad
s
0
20
40
60
80
100
120
0 20 40 60 80 100 120
Ob
serv
ed
(% A
dso
rpti
on
)
Predicted (% Adsorption)
Training
Validation
-1.00
-0.75
-0.50
-0.25
0.00
0.25
0.50
P
Alk
x V
m
Alk
x D
yn a
ds
µ x
pK
a
tfilt
x D
yn a
ds
RMSEP= 14.8 % adsorption RMSECV=17.4 % adsorption Training: R
2=0.67; slope=0.99 Validation: R
2=0.71; slope=0.93
RMSEP= 8.9 % adsorption RMSECV=13.6 % adsorption Training: R
2=0.84; slope=1.00 Validation: R
2=0.89; slope=1.02
(a) (b)
(c) (d)
Model 4:
Model 5:
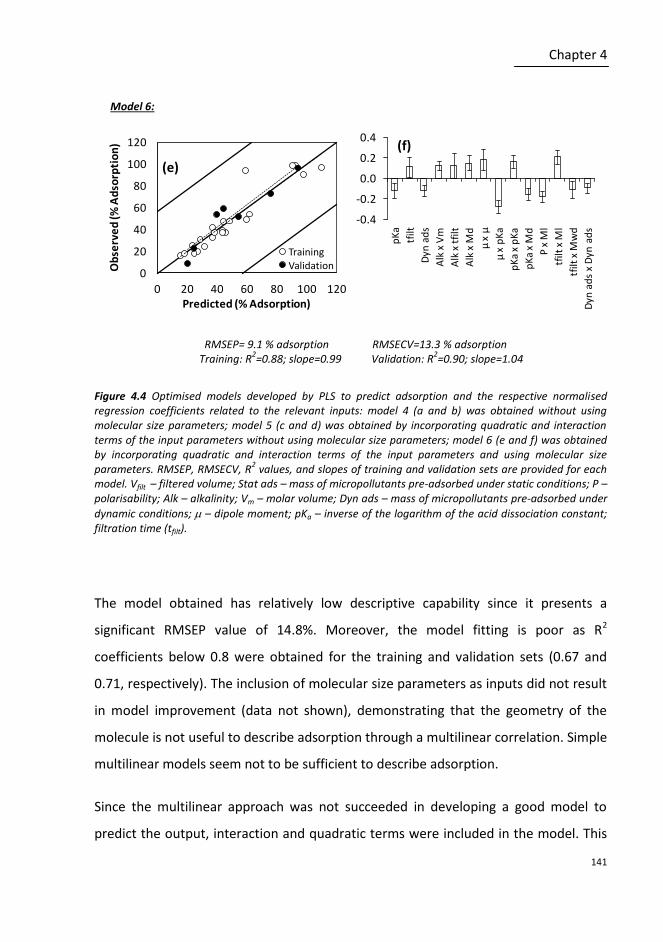
Chapter 4
141
Figure 4.4 Optimised models developed by PLS to predict adsorption and the respective normalised regression coefficients related to the relevant inputs: model 4 (a and b) was obtained without using molecular size parameters; model 5 (c and d) was obtained by incorporating quadratic and interaction terms of the input parameters without using molecular size parameters; model 6 (e and f) was obtained by incorporating quadratic and interaction terms of the input parameters and using molecular size parameters. RMSEP, RMSECV, R
2 values, and slopes of training and validation sets are provided for each
model. Vfilt – filtered volume; Stat ads – mass of micropollutants pre-adsorbed under static conditions; P – polarisability; Alk – alkalinity; Vm – molar volume; Dyn ads – mass of micropollutants pre-adsorbed under
dynamic conditions; – dipole moment; pKa – inverse of the logarithm of the acid dissociation constant; filtration time (tfilt).
The model obtained has relatively low descriptive capability since it presents a
significant RMSEP value of 14.8%. Moreover, the model fitting is poor as R2
coefficients below 0.8 were obtained for the training and validation sets (0.67 and
0.71, respectively). The inclusion of molecular size parameters as inputs did not result
in model improvement (data not shown), demonstrating that the geometry of the
molecule is not useful to describe adsorption through a multilinear correlation. Simple
multilinear models seem not to be sufficient to describe adsorption.
Since the multilinear approach was not succeeded in developing a good model to
predict the output, interaction and quadratic terms were included in the model. This
0
20
40
60
80
100
120
0 20 40 60 80 100 120
Ob
serv
ed
(% A
dso
rpti
on
)
Predicted (% Adsorption)
TrainingValidation
-0.4
-0.2
0.0
0.2
0.4
pK
a
tfilt
Dyn
ad
s
Alk
x V
m
Alk
x t
filt
Alk
x M
d
µ x
µ
µ x
pK
a
pK
a x
pK
a
pK
a x
Md
P x
Ml
tfilt
x M
l
tfilt
x M
wd
Dyn
ad
s x
Dyn
ad
s
RMSEP= 9.1 % adsorption RMSECV=13.3 % adsorption Training: R
2=0.88; slope=0.99 Validation: R
2=0.90; slope=1.04
(e)
(f)
Model 6:
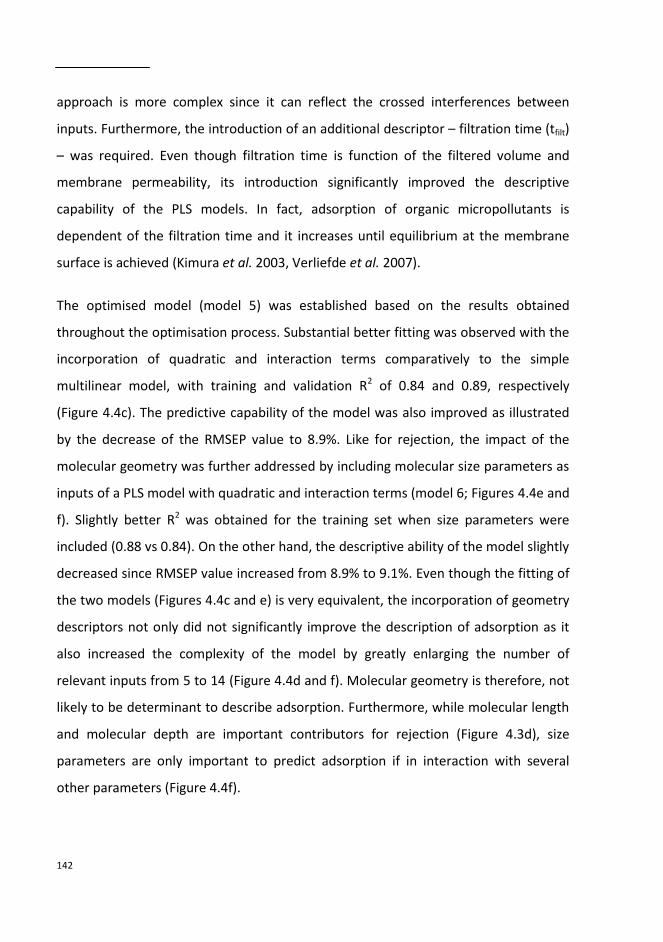
142
approach is more complex since it can reflect the crossed interferences between
inputs. Furthermore, the introduction of an additional descriptor – filtration time (tfilt)
– was required. Even though filtration time is function of the filtered volume and
membrane permeability, its introduction significantly improved the descriptive
capability of the PLS models. In fact, adsorption of organic micropollutants is
dependent of the filtration time and it increases until equilibrium at the membrane
surface is achieved (Kimura et al. 2003, Verliefde et al. 2007).
The optimised model (model 5) was established based on the results obtained
throughout the optimisation process. Substantial better fitting was observed with the
incorporation of quadratic and interaction terms comparatively to the simple
multilinear model, with training and validation R2 of 0.84 and 0.89, respectively
(Figure 4.4c). The predictive capability of the model was also improved as illustrated
by the decrease of the RMSEP value to 8.9%. Like for rejection, the impact of the
molecular geometry was further addressed by including molecular size parameters as
inputs of a PLS model with quadratic and interaction terms (model 6; Figures 4.4e and
f). Slightly better R2 was obtained for the training set when size parameters were
included (0.88 vs 0.84). On the other hand, the descriptive ability of the model slightly
decreased since RMSEP value increased from 8.9% to 9.1%. Even though the fitting of
the two models (Figures 4.4c and e) is very equivalent, the incorporation of geometry
descriptors not only did not significantly improve the description of adsorption as it
also increased the complexity of the model by greatly enlarging the number of
relevant inputs from 5 to 14 (Figure 4.4d and f). Molecular geometry is therefore, not
likely to be determinant to describe adsorption. Furthermore, while molecular length
and molecular depth are important contributors for rejection (Figure 4.3d), size
parameters are only important to predict adsorption if in interaction with several
other parameters (Figure 4.4f).

Chapter 4
143
Model 5 is therefore a good model to describe adsorption using only 5 relevant
inputs: polarisability, alkalinity x molar volume, alkalinity x dynamic pre-adsorption,
dipole moment x pKa, and filtration time x dynamic pre- adsorption. It is noteworthy
that two parameters (alkalinity and dynamic adsorption) contribute to adsorption by
interacting with more than one parameter, highlighting the complexity of the
relationships between the inputs.
Among the relevant descriptors of model 5, only polarisability correlates linearly with
adsorption. Following the previous discussion about the correlation between this
descriptor and rejection, adsorption of organic compounds on charged membranes is
often favoured by a high polarisability or polarity due to minimisation of repulsive
interactions between the solutes and the charged membrane (e.g. Van der Bruggen
and Vandecasteele 2001). Nevertheless, a negative correlation was found between
adsorption and polarisability. Table 4.2 shows that hormones, which adsorbed less on
the membrane, are more polarised than pesticides. The model might, therefore, be
taking this relation into consideration. Inferring about this correlation must be
carefully done.
The effect of polarity is also accounted in the most relevant correlation of the model
that was established between adsorption and the combined effects of dipole moment
and pKa (Figure 4.4d). pKa was expected to impact adsorption since it determines the
level of dissociation of the molecules, that in turn influences the electrostatic
interactions taking place between them and the negatively charged membrane.
Following the previous discussion related with the effect of alkalinity upon rejection,
repulsive interactions between the molecules and the negatively charged membrane
may also influence adsorption. Additionally, other characteristics of water matrices,
such as the natural organic content may also be determinant in the adsorption of
micropollutants to the membrane.
144
Dynamic pre-adsorption was expected to influence the adsorption of the compounds
since adsorption has already occurred at some extent on the membrane surface and
pores. The establishment of two correlations including dynamic pre-adsorption and
none including static pre-adsorption probably relies on the much higher adsorption
observed under dynamic conditions. Dynamic conditions are likely to allow the
molecules to access additional membrane adsorption sites that were not easily
accessed under static conditions.
Although adsorption is often associated with hydrophobic-hydrophobic interactions,
the most representative parameter of this kind of interactions - log D - was
systematically considered not essential to predict adsorption throughout model
optimisation. For the selected organic compounds, polar and electrostatic
interactions are the predominant physico-chemical interactions leading to adsorption.
4.4 CONCLUSIONS
The models obtained have good descriptive capability and contributed for an overall
comprehension of rejection and adsorption mechanisms of the micropollutants
selected in the present study. Size exclusion and electrostatic interactions with minor
contributions of hydrophobic interactions are important rejection mechanisms.
Molecular geometry is very important to describe rejection when molecules have very
different geometry. Alkalinity, molecular weight, log D, and molar volume are also
among the most relevant contributors for rejection. Conversely, molecular geometry
is not essential to describe adsorption. Hence, adsorption occurs mainly through polar
and electrostatic interactions rather than hydrophobic and it is determined by
polarisability as well as several specific interactions.

Chapter 4
145
The correlations established between the outputs and the useful predictors of the
models developed corroborate the hypotheses initially formulated that synergies and
concurrent effects might effectively impact the removal of the selected
micropollutants during nanofiltration.
Since the models developed were calibrated with a limited number of compounds,
experimental conditions, and low variation of rejection/adsorption values,
generalised conclusions from the present work should be taken with care. The
mathematical approach used proved to be suitable to disclose relationships between
the predictors and the outputs studied. This multivariate data analysis showed, then,
to have the potential to be further applied in the prediction of nanofiltration
performance for the removal of micropollutants from water. This mathematical
approach may be either applied to study other specific processes, within limited
experimental conditions, or be applied to a larger set of data, to highlight the general
mechanisms and process conditions involved in the removal of target compounds
(aiming process optimisation).
The extension of the application range of the models obtained can be further
conducted using data from the nanofiltration of other molecules with different
physico-chemical properties and geometry. More comprehensive models may also be
accomplished by the inclusion of data obtained using other membrane types as well
as by assessing other natural waters. The assessment of other water matrices would
allow the establishment of correlations between more than one relevant water
component and rejection/adsorption, namely natural organic matter and total
hardness.
146
ACKNOWLEDGEMENTS
Financial support from Fundação para a Ciência e a Tecnologia - through the project
PTDC/AMB/66024/2006, the grant PEst-OE/EQB/LA0004/2011, and the fellowships
BPD/26990/2006 and BD/72244/2010 is gratefully acknowledged.
REFERENCES
Andersson CA, Bro R (2000) The N-way toolbox for MATLAB, Chemometr Intell Lab 52: 1-4.
Boggia R, Forina M, Fossa P, Mosti L (1997) Chemometric study and validation strategies in the structure-activity relationships of new cardiotonic agents. Quant Struct-Act Rel 16: 201-213.
Cessna AJ, Grover R (1978) Spectrophotometric determination of dissociation-constants of selected acidic herbicides. J Agr Food Chem 26: 289-292.
Chang EE, Chang Y-C, Liang C-H, Huang C-P, Chiang P-C (2012) Identifying the rejection mechanism for nanofiltration membranes fouled by humic acid and calcium ions exemplified by acetaminophen, sulfamethoxazole, and triclosan. J Hazard Mater 221–222: 19-27.
ChemSpider: The free chemical database. Available online http://www.chemspider.com/. Last accessed: December 2012.
Comerton AM, Andrews RC, Bagley DM, Yang P (2007) Membrane adsorption of endocrine disrupting compounds and pharmaceutically active compounds. J Membrane Sci 303: 267-277.
Comerton AM, Andrews RC, Bagley DM, Hao CY (2008) The rejection of endocrine disrupting and pharmaceutically active compounds by NF and RO membranes as a function of compound a water matrix properties. J Membrane Sci 313: 323-335.
Duchesne C, MacGregor JF (2001) Jackknife and bootstrap methods in the identification of dynamic models. J Process Contr 11: 553-564.
Forina M, Lanteri S, Oliveros MCC, Millan CP (2004) Selection of useful predictors in multivariate calibration. Anal Bioanal Chem 380: 397-418.
Galinha CF, Carvalho G, Portugal CAM, Guglielmi G, Reis MAM, Crespo JG (2012) Multivariate statistically-based modelling of a membrane bioreactor for wastewater treatment using 2D fluorescence monitoring data. Water Res 46: 3623-3636.
Jmol: an open-source Java viewer for chemical structures in 3D. Available online: http://jmol.sourceforge.net/.
Karabelas A, Plakas K, Membrane treatment of potable water for pesticides removal, In: Soloneski S and Larramendy ML (Eds.), Herbicides, theory and applications. InTech, pp. 370-408 (2011). Available online: http://www.intechopen.com/books/herbicides-theory-and-applications/membrane-treatment-of-potable-water-for-pesticides-removal.

Chapter 4
147
Kimura K, Amy G, Drewes J, Watanabe Y (2003) Adsorption of hydrophobic compounds onto NF/RO membranes: an artifact leading to overestimation of rejection. J Membrane Sci 221: 89-101.
Kiso Y, Sugiura Y, Kitao T, Nishimura K (2001) Effects of hydrophobicity and molecular size on rejection of aromatic pesticides with nanofiltration membranes. J Membrane Sci 192: 1-10.
Meylan WM, Howard PH, Validation of water solubility estimation methods using log Kow for application in PCGEMS & EPI. Syracuse Research Corporation, Environmental Science Center, NY (1994).
Pesticide Properties DataBase, Agriculture & Environment Reasearch Unit (AERU). Available online: http://sitem.herts.ac.uk/aeru/footprint/. Last accessed: September 8, 2010.
Ryan TP, Modern regression methods. John Wiley & Sons, Inc, New York (1997).
Salvaterra AF, Sarmento G, Minhalma M, de Pinho MN (2011) Nanofiltration of surface water for the removal of endocrine disruptors. Desalin Water Treat 35: 54-61.
Sanches S, Penetra A, Granado C, Cardoso VV, Ferreira E, Benoliel MJ, Barreto Crespo MT, Pereira VJ, Crespo JG (2011) Removal of pesticides and polycyclic aromatic hydrocarbons from different drinking water sources by nanofiltration. Desalin Water Treat 27: 141-149.
Sanches S, Penetra A, Rodrigues A, Ferreira E, Cardoso VV, Benoliel MJ, Barreto Crespo MT, Pereira VJ, Cresp, JG (2012) Nanofiltration of hormones and pesticides in different real drinking water sources. Sep Purif Technol 94: 44-53.
Snyder SA, Adham S, Redding AM, Cannon FS, DeCarolis J, Oppenheimer J, Wert EC, Yoon Y (2007) Role of membranes and activated carbon in the removal of endocrine disruptors and pharmaceuticals. Desalination 202: 156-181.
Van der Bruggen B, Schaep J, Wilms D, Vandecasteele C (1999) Influence of molecular size, polarity and charge on the retention of organic molecules by nanofiltration. J Membrane Sci 156: 29-41.
Van der Bruggen B, Everaert K, Wilms D, Vandecasteele C (2001) Application of nanofiltration for removal of pesticides, nitrate and hardness from ground water: Rejection properties and economic evaluation. J Membrane Sci 193: 239-248.
Van der Bruggen B, Vandecasteele C (2001) Flux decline during nanofiltration of organic components in aqueous solution. Environ Sci Technol 35: 3535-3540.
Verliefde ARD, Heijman SGJ, Cornelissen ER, Amy G, Van der Bruggen B, van Dijk JC (2007) Influence of electrostatic interactions on the rejection with NF and assessment of the removal efficiency during NF/GAC treatment of pharmaceutically active compounds in surface water. Water Res 41: 3227-3240.
Yangali-Quintanilla V, Sadmani A, McConville M, Kennedy M, Amy G (2009) Rejection of pharmaceutically active compounds and endocrine disrupting compounds by clean and fouled nanofiltration membranes. Water Res 43: 2349-2362.
Zhang Y, Van der Bruggen B, Chen GX, Braeken L, Vandecasteele C (2004) Removal of pesticides by nanofiltration: Effect of the water matrix. Sep Purif Technol 38: 163-172.

148

CHAPTER 5
Removal of pesticides and hormones from water combining low pressure UV photolysis with nanofiltration

150
Adapted from:
Sanches S, Penetra A, Rodrigues A, Cardoso VV, Ferreira E, Benoliel MJ, Barreto
Crespo MT, Crespo JG, Pereira VJ (2013) Removal of pesticides from water combining
low pressure UV photolysis with nanofiltration. Sep Purif Technol 115: 73-82.
and
Sanches S, Rodrigues A, Cardoso VV, Ferreira E, Benoliel MJ, Barreto Crespo MT,
Crespo JG, Pereira VJ (2013). Combination of UV photolysis and nanofiltration to
overcome their drawbacks and remove endocrine disrupting compounds from a
drinking water source. Re-submitted after revision to Desalination.
Sandra Sanches was involved in all the experimental work presented in this chapter,
except for: 1) the quantification of the target pesticides and hormones in the samples
from permeate of nanofiltration and combined treatment experiments that was
performed by Ana Penetra and Alexandre Rodrigues at Laboratório Central of EPAL,
Portugal, under the direction of Vitor Cardoso, Elisabete Ferreira, and Maria João
Benoliel; 2) identification of UV by-products generated that was carried out by
Vanessa Pereira and Vitor Cardoso. Vanessa Pereira, João Crespo, and Teresa Crespo
supervised all the experimental work carried out.

Chapter 5
151
CONTENTS
Abstract ............................................................................................................. 152
5.1 Introduction ................................................................................................. 153
5.2 Materials and Methods ................................................................................. 155
5.2.1 Chemical reagents .............................................................................................. 155
5.2.2 Natural water matrix .......................................................................................... 156
5.2.3 Experimental setup ............................................................................................ 156
5.2.4 UV photolysis ...................................................................................................... 158
5.2.5 Nanofiltration ..................................................................................................... 159
5.2.6 Integration of UV photolysis/TiO2 photocatalysis and nanofiltration ................ 160
5.2.7 Analytical methods ............................................................................................. 161
5.2.8 Yeast estrogen screen assay ............................................................................... 162
5.3 Results and Discussion .................................................................................. 163
5.3.1 UV photolysis ...................................................................................................... 163
5.3.2 Nanofiltration ..................................................................................................... 169
5.3.3 Integration of UV photolysis/TiO2 photocatalysis and nanofiltration ................ 172
5.3.3.1 Experiments carried out with total recirculation without feed solution
addition ................................................................................................ 172
5.3.3.2 Experiment carried out with total recirculation at constant volume with
repeated addition of feed solution ...................................................... 177
5.3.4 Comparison of the different treatment technologies ........................................ 183
5.4 Conclusions .................................................................................................. 184
Acknowledgements ............................................................................................ 185
References ......................................................................................................... 185
152
ABSTRACT
A sequential water treatment combining UV photolysis with nanofiltration was
evaluated to remove several pesticides (atrazine, isoproturon, diuron, alachlor, and
chlorfenvinphos) and hormones (17-estradiol, 17-ethinylestradiol, estrone, estriol,
and progesterone) as well as the respective estrogenic activity. Generally, the
individual processes were found to efficiently remove the target compounds. The
combined treatment was able to remove the target compounds (removals higher
than 85.1%) as well as the respective endocrine disrupting activity from the water
containing a mixture of pesticides (64.4-93.8%) and hormones (95.4-99.6%) after 6 h
of treatment. The ability of this treatment to overcome the drawbacks associated
with the individual processes (production of a concentrated retentate and formation
of toxic by-products) was also assessed. The retentate produced by the nanofiltration
unit when operated in the integrated process was much less concentrated, suggesting
that the combined treatment might effectively reduce the need to further
treat/dispose the retentate. The concentration of the by-products formed and the
estrogenic activity of the nanofiltration permeate was found to be always very low
during the treatment, showing that the by-products formed during photolysis were
generally efficiently retained by the nanofiltration process. The combination of direct
LP/UV photolysis with nanofiltration is promising for a drinking water utility that
needs to cope with sudden punctual discharges or deterioration of the water quality
and wants to decrease the levels of chemicals in the nanofiltration retentate.

Chapter 5
153
5.1 INTRODUCTION
The presence of pesticides and hormones in drinking water sources has recently
attracted much attention. Several pesticides like atrazine, isoproturon, diuron,
alachlor, and chlorfenvinphos, which occur in surface water and groundwater at 0.27-
9950 ng L-1 (Cabeza et al. 2012, Postigo et al. 2010), are characterised by their
negative impact in the environment given their toxicity, persistence, and potential of
bioaccumulation. The hormones 17-estradiol, 17-ethinylestradiol, estrone, estriol,
and progesterone, also highly impact the aquatic ecosystem due to their exceptional
endocrine disrupting capabilities (Johnson and Sumpter 2001, Kolodziej et al. 2004,
Ternes et al. 1999), even at concentrations below their occurrence levels in drinking
water sources (0.07-180 ng L-1) (Chang et al. 2008, Zhou et al. 2011). Endocrine
disrupting activity has been also reported for pesticides such as atrazine and alachlor
(Danzo 1997, Wilson et al. 1996). The increasing evidence of their impact and their
detection in treated waters (McInnis 2010, Rodriguez-Mozaz et al. 2004, Kuster et al.
2008) demands the development of new technologies that allow utilities to provide
high quality water.
UV photolysis and titanium dioxide photocatalysis as well as nanofiltration have been
pointed out as alternative effective processes for the removal of a wide range of
organic micropollutants including several pesticides and hormones (Braeken and Van
der Bruggen 2009, Dudziak and Bodzek 2009, Leech et al. 2009, Pereira et al. 2012,
Sanches et al. 2010, Sanches et al. 2012, Zhang et al. 2007). Although promising for
water treatment applications, these processes present specific well known
drawbacks. The partial oxidation of the micropollutants during UV processes may lead
to the formation of oxidation products with higher toxicity than the parent
compounds, as previously reported during the direct photolysis of carbamazepine
using a medium pressure lamp (Donner et al. 2013). By-products of carbamazepine,
acridine and acridone, were found to be more toxic than carbamazepine, using

154
several toxicological approaches. In addition, the scaling up of technologies using TiO2
is limited due to the need to remove the photocatalyst from the treated water. The
limitations associated with the application of pressure-driven membrane processes
include the occurrence of fouling as well as the production of a retentate highly
concentrated in suspended and dissolved constituents that requires additional
treatment and/or disposal. Thus, operation costs associated with the
treatment/disposal of retentate as well as frequent membrane cleanings and
replacement are noteworthy (Braeken et al. 2006).
The integration of UV photolysis/TiO2 photocatalysis and nanofiltration might
attenuate these drawbacks. Nanofiltration is expected to retain the selected
micropollutants, UV photolysis by-products, and TiO2 nanoparticles while UV
photolysis is likely to allow the production of a less concentrated retentate.
Nanofiltration followed by direct and indirect photolysis (using hydrogen peroxide)
were previously tested using batch laboratory scale reactors and proved to be
extremely efficient to remove hormones from a surface water matrix (Pereira et al.
2012). Some configurations combining a TiO2 oxidation pre-treatment with
membrane filtration have been proposed (Benotti et al. 2009, Bosc et al. 2005, Djafer
et al. 2010, Le-Clech et al. 2006, Ma et al. 2010, Molinari et al. 2008, Molinari et al.
2002, Molinari et al. 2006). Even though many studies reported that the integration of
these processes is promising, the removal of the micropollutants was mainly achieved
by the oxidation step since the membranes tested were not suitable for their
retention in many cases (Molinari et al. 2008, Molinari et al. 2006). Other
membranes, in particular nanofiltration membranes, should therefore be evaluated.
The incomplete mineralisation of organic micropollutants during UV photolysis
(Malato et al. 2003, Molinari et al. 2007) suggests that it is important to address the
formation of intermediate compounds and understand if these compounds may also
Chapter 5
155
be retained in the filtration step. Although an efficient removal of the parent
compounds may be achieved, permeate toxicity may increase as a result of the
possible breakthrough of potentially toxic by-products (Escher and Fenner 2011, Rizzo
2011). Therefore, the ability of integrated processes to reduce the water toxicity
requires further evaluation in particular, in natural water matrices.
This study aims to address the efficiency of a two-stage integrated system that
combines UV direct photolysis and TiO2 photocatalysis with nanofiltration to remove
several pesticides (atrazine, isoproturon, diuron, alachlor, and chlorfenvinphos) and
hormones (17-estradiol, 17-ethinylestradiol, estrone, estriol, and progesterone)
from surface water collected after the sedimentation process in a water treatment
utility. The processes take place sequentially: UV photolysis of the target
micropollutants is followed by nanofiltration occurring in the absence of irradiation.
The potential of this integrated process to decrease the estrogenic activity of the
water is also evaluated through the identification of the UV photolysis by-products
formed and the determination of their overall estrogenic activity using the YES assay.
5.2 MATERIALS AND METHODS
5.2.1 Chemical reagents
The pesticides and hormones as well as the aminoacids and salts used in the YES assay
were purchased as solids of the highest grade commercially available (Sigma Aldrich,
Germany).
Sabouraud dextrose agar (Oxoid, UK) supplemented with chloramphenicol (Oxoid, UK)
was used to prepare the yeast culture media.
156
Titanium dioxide Degussa® P25, a mixture of 70% anatase and 30% rutile, with an
average particle size of 20 nm and a reactive surface area of 35-65 m2 g-1 (Evonik
Degussa, Germany) was used in the photocatalytic experiments.
High performance liquid chromatography grade methanol and acetonitrile (Fisher,
UK) was used for the chromatographic analysis of the pesticides and hormones as
well as for the preparation of stock solutions. Milli-Q water used in the
chromatographic analysis was produced by a Milli-Q water system (Millipore, CA,
USA).
5.2.2 Natural water matrix
The water matrix was supplied by the water utility Empresa Portuguesa das Águas
Livres, S.A. that treats and supplies drinking water to approximately 2.8 million people
in the region of Lisbon, Portugal. Surface water from the abstraction zone of Tagus
River in Valada do Ribatejo was collected after the sedimentation process in 10 L
jerricans and stored at 4 ± 3 °C until used. The micropollutants targeted in this study
were not detected in the water collected for this study.
All the experiments performed were carried out at a pH value of 7.8, without any pH
adjustment. Molinari et al. (2008) reported that the optimum pH for the degradation
of organic compounds by TiO2 photocatalysis is 7.0 ± 3.0.
5.2.3 Experimental setup
The experiments were performed in a laboratory scale unit shown schematically in
Figure 5.1.

Chapter 5
157
Figure 5.1 Schematic representation of the experimental setup.
This unit is equipped with a feed vessel, a recirculation magnetic drive pump (model
MD-15RV, IWAKI, Massachusetts, USA), a Puro-Tap UV reactor with a low pressure
mercury lamp that emits primarily monochromatic light at 254 nm (PURO, Italy), an
high pressure diaphragm pump (Hydra-Cell model D/G-03-X, Wanner Engineering,
USA), and a membrane unit equipped with a spiral-wound Desal 5DK membrane
(model DK2540F1073, GE Water & Process Technologies, USA). The nanofiltration
filter element presented 1.27 mm spacers, an active area of 1.6 m2, a water
permeability of 5.0 ± 0.2 L h-1 bar-1 m-2, and an MgSO4 average rejection of 98%. The
maximum operating pressure of the membrane module is 41 bar. A transmitter (8864,
Trafag, Switzerland) was placed upstream the membrane unit to measure the
pressure and temperature of the water circulating in the system. The pressure was
adjusted on the retentate side with a brass ball valve. The temperature of the feed
water was controlled at 25 2 °C using a temperature control unit equipped with a
stainless steel heat exchanger coil that was submerged into the feed reservoir.
Stirring was provided to the feed solution during the experiments to ensure the
homogeneity of the solution and to avoid TiO2 deposition. The tubing of the system
was made of polyvinylidene difluoride to minimise the adsorption of the organic
compounds.
Feed Vessel
Sampling Point
Feed PumpHigh Pressure Pump
UV Reactor
Permeate
Retentate
Treated Water from UV
PT
Membrane Unit
Temperature Control Unit
Stirrer

158
This unit was designed to allow to carry out different studies: degradation of the
selected compounds by UV photolysis/TiO2 photocatalysis (using only the UV lamp),
removal by nanofiltration (using only the membrane module), and integration of both
processes (using the UV reactor followed by nanofiltration).
5.2.4 UV photolysis
LP/UV direct photolysis and TiO2 photocatalysis experiments were performed to
assess the degradation of the selected organic compounds over time. Surface water
collected after sedimentation (2 L) was spiked with a mixture of the selected
pesticides or hormones to achieve a concentration of approximately 500 g L-1. Even
though the target compounds occur in the aquatic environment at ng L-1 to low g L-1
range (see Tables 1.1 and 1.2 in Chapter 1), higher levels were spiked in the feed
water used in these and the other experiments described in this chapter. These higher
levels enabled to follow the degradation of the compounds by HPLC direct injection
and to identify some UV by-products formed, since the detection limits of the
methods (see section 5.2.7) could prevent the follow-up of the pesticides and
hormones degradation if the compounds were spiked at their occurrence levels.
The UV lamp was turned on approximately 30 min before the assays to stabilise the
radiation intensity while laboratory grade water was recirculated through the UV
system. The water solutions containing the mixture of pesticides or the mixture of
hormones were then totally recirculated through the UV reactor during
approximately 3-7 h in the absence (direct photolysis) and presence of 50 mg L-1 TiO2
(optimum TiO2 concentration; data not shown). Samples (2 mL) were taken at regular
time intervals during the assays, filtered with 0.2 m filters made of regenerated
cellulose (Whatman, USA) to remove TiO2 particles, and analysed by HPLC to
determine the percent degradation of the compounds. These filters were selected
Chapter 5
159
among several filters evaluated since they are able to minimise the adsorption of the
selected compounds onto the filter material, with percent adsorptions lower than
12.1% (0.3% for atrazine, 5.0% for isoproturon, 3.0% for diuron, 8.0% for alachlor,
11.0% for chlorfenvinphos, 6.5% for 17-estradiol, 12.1% for 17-ethinylestradiol,
6.3% for estrone, 4.9% for estriol, and 8.1% for progesterone).
The UV fluence provided by the UV lamp was determined by using the data obtained
for atrazine since this compound is often used for actinometry purposes. Besides the
concentration of atrazine before and after LP/UV photolysis in this study, the fluence-
based direct photolysis rate constant provided in Chapter 1, obtained using a well
defined collimated beam batch reactor (Sanches et al. 2010), was also used for the UV
fluence determination. The UV fluence determined for the LP/UV lamp was
approximately 465mJ cm-2.
Control experiments were performed to assess the loss of the organic compounds
due to degradation or adsorption on the system. These experiments were conducted
under the exact same conditions as the direct photolysis and photocatalysis assays
with the exception of the fact that the UV lamp was turned off. Samples were also
taken over time and analysed by HPLC. A concentration decline lower than 12% was
determined for atrazine, isoproturon, diuron, 17-estradiol, and estriol while
decreases of 34, 39, 22, 21, and 59% were obtained for alachlor, chlorfenvinphos,
17-ethinylestradiol, estrone, and progesterone, respectively. These values were
used to correct the degradations attained during photolysis assays.
5.2.5 Nanofiltration
Nanofiltration experiments were conducted with total recirculation of permeate and
retentate to simulate an extended exposure of the membrane to a water stream

160
containing the target micropollutants. Much larger volumes of feed solutions would
be needed to follow the removal of the compounds over time in the absence of total
recirculation since the dead volume of the system is approximately 800 mL.
Furthermore, a considerable quantity of the selected organic compounds would
therefore be needed, which is unaffordable.
Surface water collected after the sedimentation process (5 L) was spiked with the
appropriate volume of a mixture of pesticides or a mixture of hormones to achieve a
concentration of approximately 500 g L-1. These solutions were recirculated in the
nanofiltration system with a by-pass to the UV system at 0.2 m3 h-1 and 10 bar during
6 hours. The volume of feed was maintained constant after each sampling through
the addition of fresh solution to the feed vessel.
Samples of feed, permeate, and retentate were taken throughout the experiments
and acidified to prevent degradation of the organic compounds until analysis to
determine the concentration of the target pesticides and hormones.
5.2.6 Integration of UV photolysis/TiO2 photocatalysis and nanofiltration
This configuration was evaluated under different experimental conditions that were
set to mimic the real conditions in water treatment utilities. Two different strategies
were followed to evaluate the potential of the integrated sequential process to cope
with different loadings of micropollutants throughout the treatment: 1 - total
recirculation without the addition of fresh feed solution during the experimental
study and; 2 - total recirculation at constant volume with the repeated addition of
fresh feed solution for replenishment of the volumes of samples extracted at different
experimental times. The experiments were conducted with total recirculation of
Chapter 5
161
permeate and retentate, for the same reasons detailed in section 5.2.5 for
nanofiltration experiments.
The experiments combining UV photolysis and nanofiltration were conducted in the
absence and presence of 50 mg L-1 suspended TiO2. In both assays, surface water
collected after the sedimentation process (5 L) was spiked with a mixture of the
selected pesticides or a mixture of the selected hormones to achieve a final
concentration of 500 g L-1. In the UV reactor, the degradation of the target
compounds took place due to LP/UV irradiation at atmospheric pressure. In the
membrane unit, nanofiltration was performed at 10 bar in the absence of irradiation.
Operation was carried out in sequential steps (reaction, filtration, recirculation)
during 6 h. Samples of feed, permeate, and retentate were taken at regular intervals
to follow the removal of the selected compounds and identify UV photolysis by-
products formed as well as to evaluate the variation of the relative estrogenic activity
of the water using the YES assay (described in section 5.2.8).
5.2.7 Analytical methods
Different analytical methods were used according with the different micropollutants
and their concentrations in the samples. The concentration of the mixture of
pesticides and the mixture of hormones in the samples of feed and retentate was
followed by direct HPLC injection. The detection limits achieved by direct injection of
the target compounds are the following: 5 g L-1 (estriol and atrazine), 12.5 g L-1
(diuron and chlorfenvinphos), 20 g L-1 (isoproturon), 25 g L-1 (estrone and
progesterone), 50 g L-1 (alachlor and 17-estradiol), and 100 g L-1 (17-
ethinylestradiol).
162
Analytical methodologies that include a previous concentration step were employed
to monitor the concentration of the target analytes in the permeate due to the low
concentrations expected (below the detection limits mentioned above) and to
evaluate the formation of UV by-products. Briefly, atrazine, alachlor, and
chlorfenvinphos were concentrated by solid phase extraction and analysed by gas
chromatography with mass spectrometry detection while the analytes diuron and
isoproturon were concentrated by SPE and analysed by HPLC-MS/MS. Solid-phase
extraction was also carried out prior to quantification of hormones by UPLC-MS/MS.
The uncertainties related with the methodologies comprising a concentration step are
the following: 9.5% (atrazine), 18.3% (isoproturon), 17.9% (diuron), 9.8% (alachlor),
13.4% (chlorfenvinphos), 23.1% (17-estradiol), 18.7% (17-ethinylestradiol), 17.2%
(estrone), 14.7% (estriol), and 22.5% (progesterone).
A detailed description of the analytical methods employed to quantify the target
compounds (by direct injection and after concentration) and identify the by-products
formed is provided in Appendix A.1.
5.2.8 Yeast estrogen screen assay
A YES assay using a human estrogen receptor transfected Saccharomyces cerevisiae
strain was performed to evaluate the variation of the relative estrogenic activity of
the permeate and retentate samples from the integrated process throughout the
experiments. The human estrogen receptor transfected Saccharomyces cerevisiae
employed in the YES assay was used under agreement with Professor J. P. Sumpter at
Brunel University, UK. This assay was conducted according to the procedure described
by Routledge and Sumpter (1996) and specific modifications introduced by Stanford
and Weinberg (2010). A detailed description is provided in Appendix A.4.

Chapter 5
163
In this assay, 17-estradiol is used as a reference in terms of estrogenic activity
response. The concentrations of 17-estradiol and samples tested that induce 50% of
the maximum response (EC50) were determined and used to obtain and compare the
estradiol equivalents (EEQ) of the samples over time. Estradiol equivalents are a
measure of the relative estrogenic activity of the samples and were determined using
Equation 5.1.
Sample50,
Estradiol50,17β
EC
ECquivalentsEstradiolE
(5.1)
5.3 RESULTS AND DISCUSSION
5.3.1 UV photolysis
LP/UV direct photolysis and TiO2 photocatalysis were evaluated for the degradation of
the selected pesticides and hormones. These compounds were addressed as a
mixture of pesticides or as a mixture of hormones since these micropollutants are
present in the water as a cocktail of compounds and concurrent effects may influence
their degradation rates.
Two water matrices with very different compositions were initially tested and
compared in terms of the degradation of the target compounds by direct photolysis –
laboratory grade water and surface water collected after the sedimentation process
in a water treatment utility. Surface water collected after sedimentation was selected
instead of untreated surface water because, at this stage of the treatment, the
suspended, colloidal, and particulate matter that contribute to scavenging of UV light,
membrane fouling, and flux decline were already highly removed (Sanches et al.
2012). The degradation of the pesticides was not generally very influenced by the
164
water matrix while a considerable improvement was observed in laboratory grade
water comparatively with the surface water collected after sedimentation for the
hormones (percent change of 9% for atrazine, 13% for isoproturon, 10% for diuron,
30% for alachlor, 5% for chlorfenvinphos, 52% for 17-estradiol, 77% for 17-
ethinylestradiol, 22% for estrone, 24% estriol, and 33% for progesterone). This
behaviour is probably related with the competition between the target compounds
and resilient natural organic matter constituents for the absorption of the UV
radiation. All the subsequent experiments were conducted in the real water matrix:
surface water collected after sedimentation.
The linearity between TiO2 concentration and its absorbance in the concentration
range of 10 to 1000 mg L-1 was evaluated by UV-vis spectrophotometry (340 nm).
Results (data not shown) showed that there is no linearity between the concentration
of TiO2 and absorbance above 100 mg L-1. Then, the ability to maintain the
concentration of TiO2 constant over time at these levels in the feed vessel and
therefore, in the UV lamp circuit, was addressed by totally recirculating solutions with
TiO2 concentrations of 50 and 100 mg L-1 through the tubes of the system during the
same time of the photolysis experiments (approximately 6 h). Even though the feed
solution was powerfully stirred during all the experiments to avoid deposition of the
catalyst, there was a loss of TiO2 due to adsorption on the system and vessel walls
using both concentrations. Approximately 39% and 60% loss of catalyst was detected
at 50 and 100 mg L-1, respectively. Even though a constant TiO2 concentration is
intended during the experiment to ensure the same catalytic conditions, our results
show that a significant loss of catalyst can be expected. All experiments involving the
use of TiO2 were conducted at 50 mg L-1 to ensure a lower catalyst loss.

Chapter 5
165
The degradation of the compounds was followed over time and time-based pseudo-
first-order rate constants (k't) were determined from the slope of the linear regression
described by Equation 5.2:
tk'
C
ClnCk'
dt
Cdt
0t (5.2)
The rate constants obtained are provided in Table 5.1.
Table 5.1 Time-based pseudo-first order direct and AOP rate constants (k’t) obtained for the selected pesticides and hormones in surface water collected after the sedimentation process and the respective determination coefficients (R
2).
Compound Direct photolysis AOP/TiO2 (50 mg L
-1)
k’t x103 (min
-1)
R
2 k’t x10
3 (min
-1)
R
2
Atrazine 26.8 ± 0.3
0.99 19.3 ± 0.4
0.99
Isoproturon 3.7 ± 0.1
0.99 4.1 ± 0.1
0.99
Diuron 42.0 ± 0.3
0.99 33.3 ± 0.7
0.99
Alachlor 8.0 ± 1.0
0.88 8.9 ± 0.7
0.95
Chlorfenvinphos 41.7 ± 5.5
0.94 11.6 ± 2.4
0.80
17-Estradiol 2.0 ± 0.1
0.94 17.1 ± 0.2
0.99
17-Ethinylestradiol 1.3 ± 0.1
0.95 16.6 ±0.3
0.99
Estrone 24.5 ± 2.8
0.91 33.2 ±0.8
0.99
Estriol 1.9 ± 0.1
0.98 20.1 ± 1.0
0.97
Progesterone 34.7 ± 4.7
0.90 22.7 ± 2.5
0.93
When comparing the time-based pseudo-first order direct and indirect photolysis rate
constants reported in Table 5.1, an increase not very high was observed in the
degradation of isoproturon, alachlor, and estrone using the AOP (percent changes
between 5 and 15%) while for the other pesticides and progesterone, the AOP even
hinder their degradation. Therefore, it may be concluded that there is no significant
166
advantage in using TiO2 to degrade the selected pesticides, as reported in Chapter 2,
for experiments carried out using a batch collimated beam reactor (Sanches et al.
2010). However, the levels of mineralisation achieved in both processes may have
been different. The negligible effect of TiO2 is mainly the result of the very effective
LP/UV direct photolysis decay. Furthermore, TiO2 nanoparticles may compete with
the pesticides by the absorption of the UV radiation and present a hindrance effect.
Conversely, a significant improvement in the degradation of 17-estradiol, 17-
ethinylestradiol, and estriol was observed in the present study by TiO2 photocatalysis.
This improvement (percent change between 79 and 86%) shows that the hydroxyl
radical mediated advanced oxidation becomes the dominant degradation mechanism.
These results are in line with a previous study that compared the photodegradation of
several hormones in a raw surface water by direct photolysis and an H2O2 based AOP
using a batch collimated beam reactor (Pereira et al. 2012). Despite the difference in
the experimental conditions of the two studies, the degradation of 17-estradiol,
17-ethinylestradiol, and estriol was also highly enhanced by the presence of H2O2 in
that study while only a slight increase was obtained for estrone and progesterone. A
considerable improvement in the degradation of these three hormones was also
reported by Rosenfeldt and Linden (2004) in the presence of H2O2 using medium
pressure lamps and by Puma et al. (2010) when UV-A and UV-C lamps were tested.
Figure 5.2 shows the percent degradation attained for the selected pesticides (Figure
5.2a) and hormones (Figure 5.2b) during direct photolysis.

Chapter 5
167
Figure 5.2 Degradation of the selected (a) pesticides and (b) hormones by LP/UV direct photolysis over a 6-7 h experimental period (duplicate injections are provided as error bars; degradations higher than limits of detection are not represented). Horizontal lines in (a) represent % degradations that correspond to the
lowest and highest limits of detection of the target pesticides (5-50 g L-1
); the horizontal line in (b)
correspond to the detection limit for the hormones estrone and progesterone (25 g L-1
).
All pesticides and hormones were analysed over the 6-7 h experimental periods.
Whenever the concentrations of the compounds were below the detection limits of
the analytical methods, the respective degradations (>90% and >95% for the
pesticides and hormones, respectively) were not provided in the plot. Results
obtained illustrate the high efficiency of direct photolysis towards the selected
pesticides since removals higher than 90% were obtained after 2.6 h for all pesticides,
except isoproturon (76% after 6.1 h). Extremely high degradations (>95%) were also
attained for the hormones estrone and progesterone after the first hour of treatment.
Conversely, 17-estradiol, 17-ethinylestradiol, and estriol were poorly degraded by
direct photolysis. These differences might be explained by the decadic molar
absorption coefficient (probability of the selected compounds to absorb UV light at
254 nm) and quantum yield (ratio between the total number of molecules of
compound degraded to the total number of photons absorbed by the solution due to
the compound’s presence) of the selected hormones. Although estrone presents a
low decadic molar absorption coefficient (2215 M-1 cm-1), the highest quantum yields
were determined for this molecule (5.45 mol Einstein-1) and progesterone (2.82 mol
0
20
40
60
80
100
0 1 2 3 4 5 6 7
% D
egr
adat
ion
Time (h)
atrazineisoproturondiuronalachlorchlorfenvinphos
0
20
40
60
80
100
0 1 2 3 4 5 6 7
% D
egr
adat
ion
Time (h)
17β-estradiol17α-ethinylestradiolestroneestriolprogesterone
(b) (a)

168
Einstein-1) relatively to the other hormones (0.06, 0.09, and 0.40 mol Einstein-1 for
17-estradiol, 17-ethinylestradiol, and estriol, respectively) in a previous study
(Pereira et al. 2012).
Isoproturon, that was previously found to be extremely resilient to degradation
(<14%) during batch collimated beam UV photolysis (Sanches et al. 2010), was
degraded more efficiently in the present study. The improvement of the degradation
of isoproturon had been previously predicted, as described in Chapter 1, by modelling
the results obtained in a batch experimental set up if a reactor that allows lower
distances between the UV lamp and the water could be used (Sanches et al. 2010).
Indeed, much lower distances from the UV source are provided by this system
(approximately 0.5 cm vs 29 cm), which results in higher UV fluences. In the present
study, 1 h of circulation in the system corresponds to approximately 2200 mJ cm-2.
Figure 5.3 depicts the degradation of the selected pesticides (Figure 5.3a) and
hormones (Figure 5.3b) during TiO2 photocatalysis.
Figure 5.3 Degradation of the selected (a) pesticides and (b) hormones by TiO2 photocatalysis over a 3-4 h experimental period (50 mg/L TiO2; duplicate injections are provided as error bars; degradations higher than limits of detection are not represented). Horizontal lines in (a) represent % degradations that
correspond to the lowest and highest limits of detection of the target pesticides (5-50 g L-1
); horizontal
lines in (b) correspond to the lowest and highest limits of detection of the target hormones (5-100 g L-1
).
0
20
40
60
80
100
0 1 2 3 4
% D
egr
adat
ion
Time (h)
atrazineisoproturondiuronalachlorchlorfenvinphos 0
20
40
60
80
100
0 1 2 3
% D
egr
adat
ion
Time (h)
17β-estradiol17α-ethinylestradiolestroneestriolprogesterone
(b) (a)
Chapter 5
169
Even though all the compounds were analysed over the 3-4 h experimental period,
only isoproturon was detected throughout all assay. Whenever pesticides and
hormones were not detected because of their concentrations below the detection
limits of the analytical methods employed, the respective degradations (>88% for the
pesticides and >76% for the hormones) were not provided in the plot. Among the
hormones, only estriol and 17-estradiol were still present after 2.5 h of
photocatalysis at concentrations that enabled detection and that correspond to
removals of 95 and 92%, respectively, showing that LP/UV/TiO2 is extremely efficient
to accomplish the degradation of the hormones poorly degraded by direct photolysis.
5.3.2 Nanofiltration
A Desal 5DK membrane was selected for this study since it proved to be extremely
effective for the removal of the pesticides atrazine and alachlor as well as the
hormones addressed in a flat-sheet configuration using a cross-flow membrane unit
(Sanches et al. 2012).
The apparent rejection of the selected compounds was determined taking all
mechanisms that affect the retention of solutes into consideration using Equation 5.3.
0
t
f
p
appC
C1100(%)R (5.3)
where tpC and
0fC are the concentrations of a given compound in the permeate over
time (t) and in the feed solution at t=0, respectively.
Figure 5.4 shows the apparent rejection obtained for all pesticides (Figure 5.4a) and
hormones (Figure 5.4b) over 6 hours of nanofiltration.
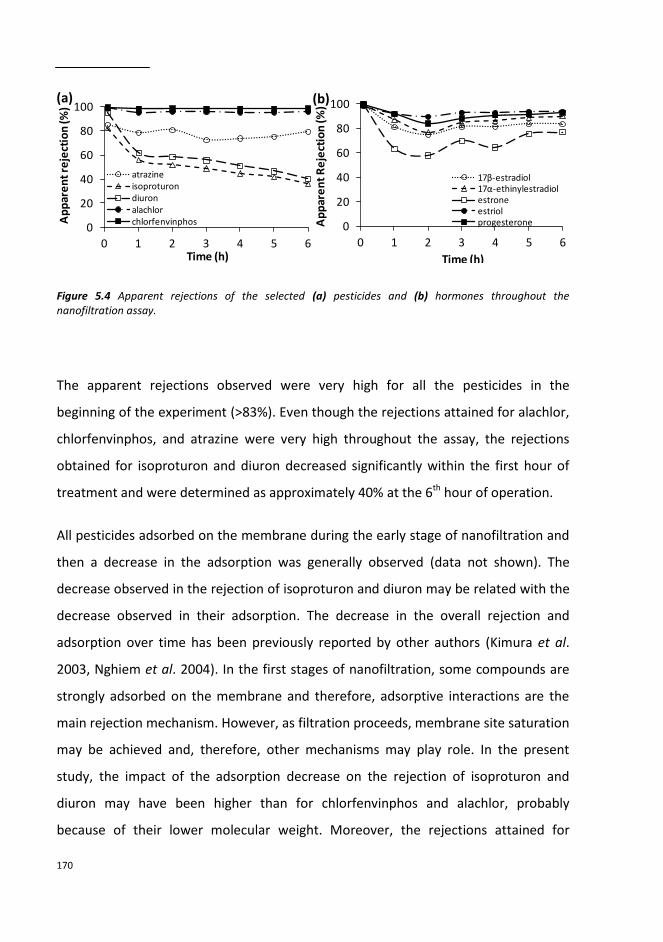
170
Figure 5.4 Apparent rejections of the selected (a) pesticides and (b) hormones throughout the nanofiltration assay.
The apparent rejections observed were very high for all the pesticides in the
beginning of the experiment (>83%). Even though the rejections attained for alachlor,
chlorfenvinphos, and atrazine were very high throughout the assay, the rejections
obtained for isoproturon and diuron decreased significantly within the first hour of
treatment and were determined as approximately 40% at the 6th hour of operation.
All pesticides adsorbed on the membrane during the early stage of nanofiltration and
then a decrease in the adsorption was generally observed (data not shown). The
decrease observed in the rejection of isoproturon and diuron may be related with the
decrease observed in their adsorption. The decrease in the overall rejection and
adsorption over time has been previously reported by other authors (Kimura et al.
2003, Nghiem et al. 2004). In the first stages of nanofiltration, some compounds are
strongly adsorbed on the membrane and therefore, adsorptive interactions are the
main rejection mechanism. However, as filtration proceeds, membrane site saturation
may be achieved and, therefore, other mechanisms may play role. In the present
study, the impact of the adsorption decrease on the rejection of isoproturon and
diuron may have been higher than for chlorfenvinphos and alachlor, probably
because of their lower molecular weight. Moreover, the rejections attained for
0
20
40
60
80
100
0 1 2 3 4 5 6
Ap
par
en
t re
ject
ion
(%)
Time (h)
atrazineisoproturondiuronalachlorchlorfenvinphos 0
20
40
60
80
100
0 1 2 3 4 5 6
Ap
par
en
t R
eje
ctio
n (%
)
Time (h)
17β-estradiol17α-ethinylestradiolestroneestriolprogesterone
(b) (a)

Chapter 5
171
atrazine, isoproturon, and diuron were lower comparatively to alachlor and
chlorfenvinphos, particularly after one hour of operation in the case of diuron and
isoproturon. This behaviour is consistent with the molecular weight of the molecules
since alachlor and chlorfenvinphos present higher molecular weights (269 and 359 Da,
respectively) than isoproturon, atrazine, and diuron (206, 215, and 233 Da,
respectively) and were consequently more rejected by the membrane. Size exclusion
is therefore also an important mechanism for the rejection of the selected pesticides.
The rejections obtained in this study for atrazine and alachlor, particularly alachlor,
are quite similar to those obtained in a previous study using a flat-sheet Desal 5DK
membrane and a cross-flow cell (Sanches et al. 2012).
The rejections obtained for the hormones throughout nanofiltration were often
higher than 77.2%, with the exception of estrone (58.0-99.9%), showing that the
process is also effective to remove these molecules even when they are spiked in
surface water at levels higher than their reported occurrence levels (Figure 5.4b). In
Chapter 3, very high removals of these hormones were also reported (higher than
90.0% and 67.4% in groundwater and surface water, respectively) using the same
membrane in a flat-sheet configuration (Sanches et al. 2012). Generally, removals
attained by Pereira et al. (2012) for the majority of these hormones using a NF-270
membrane also concur with these findings.
As for the pesticides, apparent rejection of hormones after 1 h of operation was
generally higher for the molecules having the highest molecular weights.
Nevertheless, size exclusion mechanisms do not seem to play an important role in the
early stage of the process since very similar and extremely high removals were
obtained for all hormones. Conversely, hydrophobic interactions may play a
significant role in the beginning of the assay, contributing to higher rejections. After 1
hour of treatment, some variation is observed in the rejection of some hormones,
172
particularly estrone, which is probably related with the uncertainties associated with
the analytical methodologies employed for the determination of micropollutants
concentrations.
5.3.3 Integration of UV photolysis/TiO2 photocatalysis and nanofiltration
The integrated process was evaluated in the absence and presence of 50 mg L-1
suspended TiO2. However, the complete deposition of TiO2 on the membrane was
observed within the first five minutes of operation. As a result, the removal of the
target compounds was similar to the one obtained in the absence of the catalyst since
nanoparticles were removed from the reaction environment. Therefore, only the
results obtained in the absence of TiO2 are provided in this chapter.
Since the degradation of 17-estradiol, 17-ethinylestradiol, and estriol is
considerably improved in the presence of TiO2, another configuration combining TiO2
photocatalysis with nanofiltration could be pursued to take advantage of the benefits
of integrating both technologies. An interesting approach could be the irradiation of
TiO2 immobilised on the membrane surface, which would prevent agglomeration of
suspended nanoparticles and their deposition.
5.3.3.1 Experiments carried out with total recirculation without feed solution
addition
Table 5.2 shows the global removal of the target pesticides and hormones throughout
the integrated process without addition of fresh feed solution, reflecting the quality
of the drinking water produced (permeate).
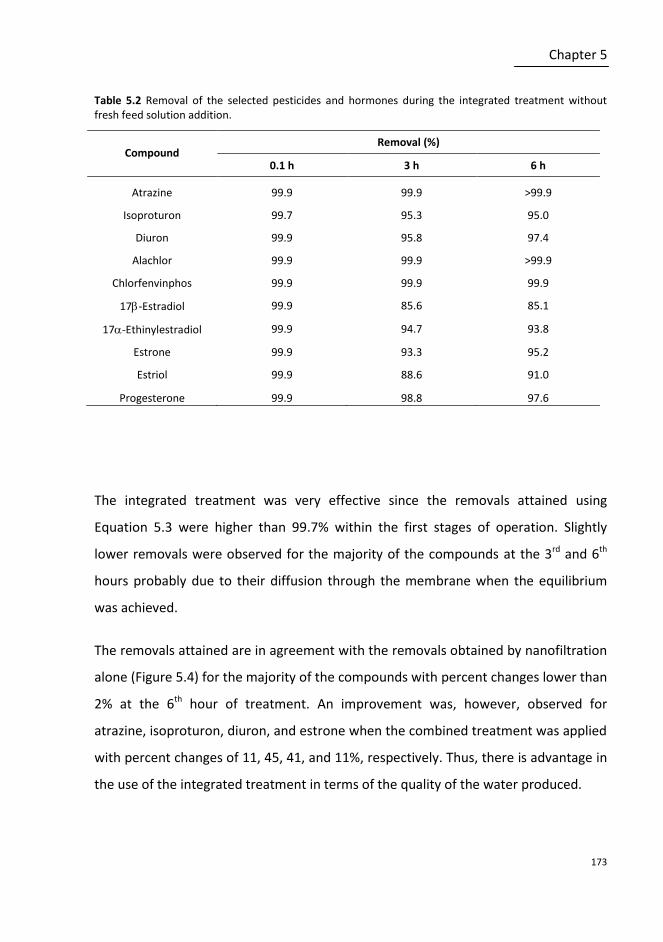
Chapter 5
173
Table 5.2 Removal of the selected pesticides and hormones during the integrated treatment without fresh feed solution addition.
Compound
Removal (%)
0.1 h 3 h 6 h
Atrazine 99.9 99.9 >99.9
Isoproturon 99.7 95.3 95.0
Diuron 99.9 95.8 97.4
Alachlor 99.9 99.9 >99.9
Chlorfenvinphos 99.9 99.9 99.9
17-Estradiol 99.9 85.6 85.1
17-Ethinylestradiol 99.9 94.7 93.8
Estrone 99.9 93.3 95.2
Estriol 99.9 88.6 91.0
Progesterone 99.9 98.8 97.6
The integrated treatment was very effective since the removals attained using
Equation 5.3 were higher than 99.7% within the first stages of operation. Slightly
lower removals were observed for the majority of the compounds at the 3rd and 6th
hours probably due to their diffusion through the membrane when the equilibrium
was achieved.
The removals attained are in agreement with the removals obtained by nanofiltration
alone (Figure 5.4) for the majority of the compounds with percent changes lower than
2% at the 6th hour of treatment. An improvement was, however, observed for
atrazine, isoproturon, diuron, and estrone when the combined treatment was applied
with percent changes of 11, 45, 41, and 11%, respectively. Thus, there is advantage in
the use of the integrated treatment in terms of the quality of the water produced.

174
The potential of this treatment to produce a less concentrated retentate was assessed
by determining the removal of the selected micropollutants from the retentate
(Removalretentate) over time using Equation 5.4.
t0
t
r
rretentate
C
C1100(%)Removal
where tr
C and 0tr
C are the concentrations of a given compound in the retentate over
time (t) and in the beginning of the experiment (t0), respectively.
Figures 5.5a and c depict the removal of the selected pesticides and hormones from
the retentate while Figures 5.5b and d show the removal of the estrogenic activity
throughout the assay carried out without the repeated addition of fresh feed
solution.
(5.4)
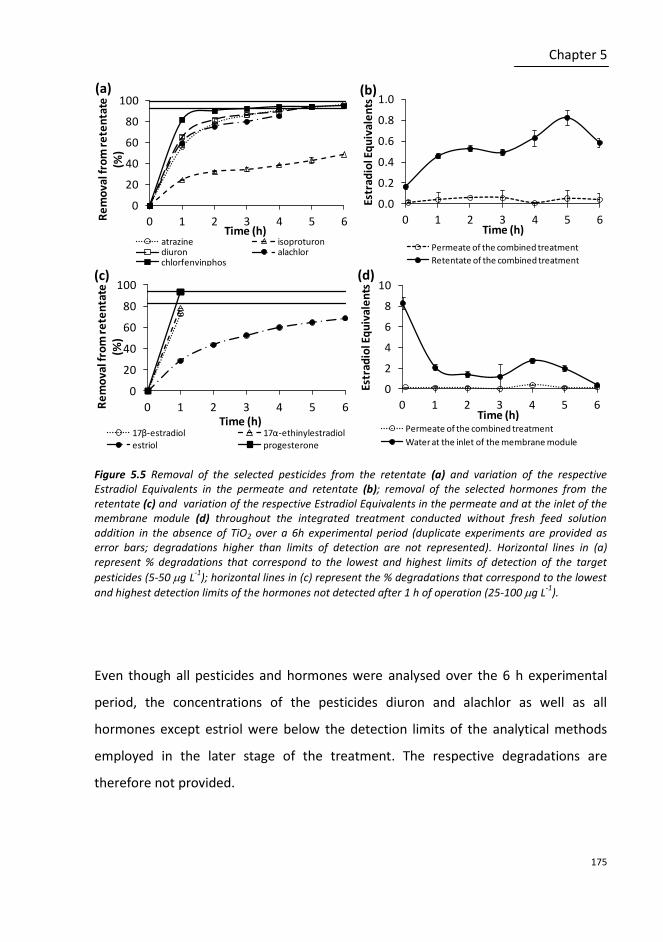
Chapter 5
175
Figure 5.5 Removal of the selected pesticides from the retentate (a) and variation of the respective Estradiol Equivalents in the permeate and retentate (b); removal of the selected hormones from the retentate (c) and variation of the respective Estradiol Equivalents in the permeate and at the inlet of the membrane module (d) throughout the integrated treatment conducted without fresh feed solution addition in the absence of TiO2 over a 6h experimental period (duplicate experiments are provided as error bars; degradations higher than limits of detection are not represented). Horizontal lines in (a) represent % degradations that correspond to the lowest and highest limits of detection of the target
pesticides (5-50 g L-1
); horizontal lines in (c) represent the % degradations that correspond to the lowest
and highest detection limits of the hormones not detected after 1 h of operation (25-100 g L-1
).
Even though all pesticides and hormones were analysed over the 6 h experimental
period, the concentrations of the pesticides diuron and alachlor as well as all
hormones except estriol were below the detection limits of the analytical methods
employed in the later stage of the treatment. The respective degradations are
therefore not provided.
0
20
40
60
80
100
0 1 2 3 4 5 6Re
mo
val f
rom
re
ten
tate
(%
)
Time (h)atrazine isoproturondiuron alachlorchlorfenvinphos
0.0
0.2
0.4
0.6
0.8
1.0
0 1 2 3 4 5 6
Estr
adio
l Eq
uiv
ale
nts
Time (h)
Permeate of the combined treatment
Retentate of the combined treatment
0
20
40
60
80
100
0 1 2 3 4 5 6Re
mo
val f
rom
re
ten
tate
(%
)
Time (h)17β-estradiol 17α-ethinylestradiolestriol progesterone
0
2
4
6
8
10
0 1 2 3 4 5 6
Estr
adio
l Eq
uiv
ale
nts
Time (h)Permeate of the combined treatment
Water at the inlet of the membrane module
(b) (a)
(c) (d)

176
After 6 h of operation, removals from retentate higher than 92% were obtained for all
the pesticides, except isoproturon (49%), which can be attributed to UV degradation
as well as to adsorption on the membrane (Figure 5.5a). Removals from the retentate
higher than 79% were obtained for all the hormones except estriol at the first hour of
treatment (Figure 5.5c). Estriol was still detected in the retentate at the 6th hour with
a removal of 69% while estrone was not detected above the detection limits even at
the sample taken at the 1st hour (removal higher than 92%).
The significant decrease observed in the concentration of the selected pesticides and
hormones in the retentate is very important since it is likely to reduce the need for
additional treatment and disposal procedures of retentate, which costs represent a
major drawback of common filtration processes.
Even though the integrated process was very efficient towards the target compounds
in terms of the quality of the water produced as well as the retentate, the formation
of UV photolysis by-products that may increase the toxicity of the water needs to be
accounted. Although the concentration of the pesticides in the retentate decreased
over the treatment (Figure 5.5a), the relative estrogenic activity of the retentate,
reported as the equivalent concentration of 17-estradiol, increased until the 5th hour
of treatment (Figure 5.5b). This increase is likely to be related with the presence of
estrogenically active transformation compounds generated during UV photolysis that
present higher levels of estrogenicity than the parent compounds. Despite this
increase, a decreasing tendency was observed for the retentate between the 5th and
6th hours. Data obtained suggest that the decrease of the estrogenic activity is
probably only accomplished after several hours due to the production of photolysis
by-products. Even though the relative estrogenic activity determined for the
retentate containing pesticides increased during UV photolysis, the by-products
produced were retained by the membrane since the estrogenic activity of the
permeate was always very low and did not increase throughout the assay.

Chapter 5
177
For the hormones, a noteworthy estrogenic removal of 75% was attained at the inlet
of the membrane within the first hour of treatment (Figure 5.5d). However, a slight
increase was observed between the 3rd and the 4th hours in both permeate and water
at the inlet of the membrane. This increase in the estrogenic activity may be
explained by the formation of estrogenically active transformation compounds. The
simultaneous increase of estrogenic activity in the permeate and in the water at the
inlet of the membrane suggests the breakthrough of by-products at this period, which
should be further addressed. The efficient removal of the endocrine disrupting
activity associated to 17-estradiol and 17-ethinylestradiol during photolysis using
low pressure and media pressure lamps was also previously reported (Rosenfeldt et
al. 2007).
Estradiol equivalents obtained in the permeate from the experiment carried out with
pesticides (0.01-0.06) and hormones (0.04-0.38) were always largely below the
estradiol equivalents determined in the initial feed solutions of pesticides (0.16) and
hormones (8.32) (Figures 5.5 b and d). These results reflect removals of estrogenic
activity of 64.4-93.8% and 95.4-99.6% for the pesticides and hormones, respectively.
The results show that the combined treatment is not only extremely efficient to
accomplish the removal of the target compounds but also the removal of formed by-
products with estrogenic activity.
5.3.3.2 Experiments carried out with total recirculation at constant volume with
repeated addition of feed solution
Similar quality of the permeate was attained in the assays conducted with and
without the repeated addition of feed solution containing the mixture of the
pesticides or the mixture of hormones (data not shown).

178
When repeated addition of feed solution was conducted throughout the assay, the
removal of the selected pesticides and hormones from the retentate was less efficient
(Figures 5.6a and c) comparatively to the previous assay (Figures 5.5a and c).
Figure 5.6 Removal of the selected pesticides from the retentate (a) and variation of the respective Estradiol Equivalents in the permeate and retentate (b); removal of the selected hormones from the retentate (c) and variation of the respective Estradiol Equivalents in the permeate and at the inlet of the membrane module (d) throughout the integrated treatment conducted with the addition of fresh feed solution in the absence of TiO2 over a 6 h experimental period (duplicate experiments are provided as error bars).
This observation was expected due to the accumulation of the non-degraded
compounds. The average hydraulic residence time of the water solution was
0
20
40
60
80
100
0 1 2 3 4 5 6Re
mo
val f
rom
re
ten
tate
(%
)
Time (h)atrazine isoproturondiuron alachlorchlorfenvinphos
0.0
0.5
1.0
1.5
2.0
0 1 2 3 4 5 6
Estr
adio
l Eq
uiv
ale
nts
Time (h)Permeate of the combined treatment
Retentate of the combined treatment
0
20
40
60
80
100
0 1 2 3 4 5 6
Re
mo
val f
rom
re
ten
tate
(%
)
Time (h)17β-estradiol 17α-ethinylestradiolestrone estriolprogesterone
0
2
4
6
8
0 1 2 3 4 5 6
Estr
adio
l Eq
uiv
ale
nts
Time (h)Permeate of the combined treatmentWater at the inlet of the membrane module
(b) (a)
(d) (c)

Chapter 5
179
determined as 2.5 h since this experiment was conducted at a constant volume of 5 L
with the addition of 2 L of fresh feed solution every hour, similarly to a fed-batch
experiment. This hydraulic residence time was found to be short to achieve an
effective degradation and should therefore be increased.
The higher concentration of the target compounds determined in the retentate
during this assay is also reflected in the relative estrogenic activity which is
approximately the double for the pesticides (Figures 5.5b and 5.6b) and eighteen
times higher for the hormones (Figures 5.5d and 5.6d) in the end of the treatment.
The increase of the relative estrogenic levels associated with the pesticides in the
retentate was observed until the 2nd hour of treatment, which is likely to be related
with the formation of UV photolysis by-products since the concentration of all
pesticides except isoproturon decreased in the beginning of the experiment and then
remained fairly constant.
Isoproturon was accumulated in the system since the beginning of the experiment
due to its lower degradation rate constant as previously discussed. Likewise, estriol
was particularly poorly removed among the hormones. A significant decrease of
estradiol equivalents was observed in the water containing the target hormones at
the inlet of the membrane during the initial two hours of treatment (69%). However,
successive increases and decreases of estrogenic activity were observed after this
period (Figure 5.6d) probably because of the combined accumulation of the target
compounds (Figure 5.6c) and the respective photolysis by-products. Even though
higher estradiol equivalents were determined in the permeate throughout the
treatment when feed solution containing the hormones mixture was repeatedly
added (0.04-0.38 versus 0.08-1.16), the removal observed under repeated addition of
feed was still considerably high throughout the assay, above 84% (Figure 5.6d). These
180
data suggest the retention of the estrogenically active transformation compounds
generated by the membrane.
Permeate, retentate, and feed samples collected after 0, 1, 3, and 6 hours of
operation were also analysed using the GC/MS, HPLC/MS, and UPLC-MS/MS methods
detailed in Appendix A.1 to determine the presence of by-products in the
experiments conducted with the repeated addition of feed solution. By-products
generated during the degradation of the hormones were not detected probably due
to their presence at extremely low concentrations that did not enable detection.
Conversely, six major by-products were detected in the retentate collected at times 1,
3, and 6 hours in the experiments conducted with the pesticides. The mass spectra of
these compounds are presented in Appendix A.5 while a summary of the mass
spectra data analysis showing the parent compound, the major daughter ions, their
relative abundance, and proposed structures is shown in Table 5.3.
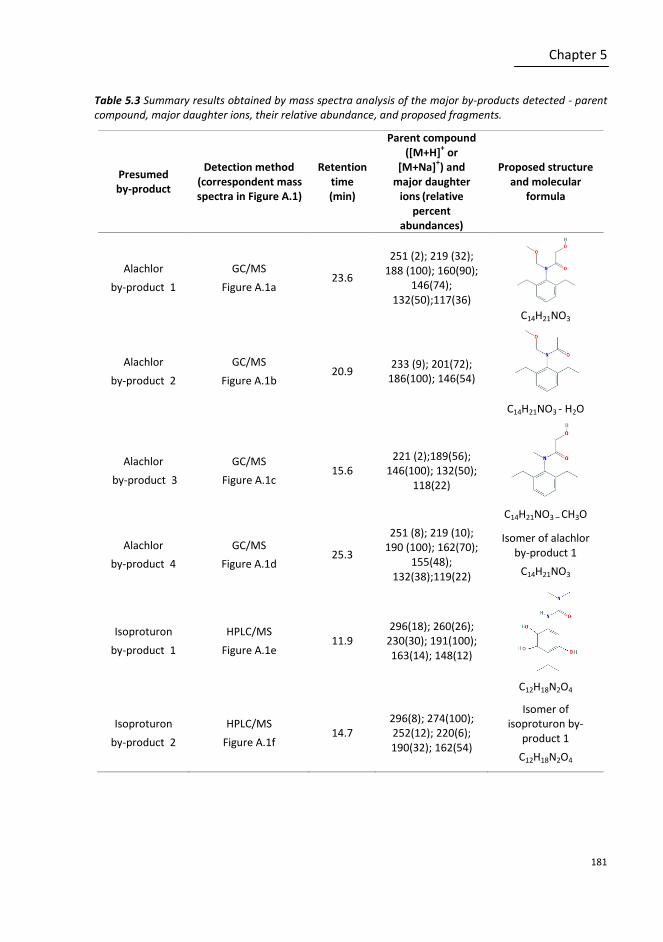
Chapter 5
181
Table 5.3 Summary results obtained by mass spectra analysis of the major by-products detected - parent compound, major daughter ions, their relative abundance, and proposed fragments.
Presumed by-product
Detection method (correspondent mass spectra in Figure A.1)
Retention time (min)
Parent compound ([M+H]
+ or
[M+Na]+) and
major daughter ions
(relative
percent abundances)
Proposed structure and molecular
formula
Alachlor
by-product 1
GC/MS
Figure A.1a 23.6
251 (2); 219 (32); 188 (100); 160(90);
146(74); 132(50);117(36)
C14H21NO3
Alachlor
by-product 2
GC/MS
Figure A.1b 20.9
233 (9); 201(72); 186(100); 146(54)
C14H21NO3 - H2O
Alachlor
by-product 3
GC/MS
Figure A.1c 15.6
221 (2);189(56); 146(100); 132(50);
118(22)
C14H21NO3 – CH3O
Alachlor
by-product 4
GC/MS
Figure A.1d 25.3
251 (8); 219 (10); 190 (100); 162(70);
155(48); 132(38);119(22)
Isomer of alachlor by-product 1
C14H21NO3
Isoproturon
by-product 1
HPLC/MS
Figure A.1e 11.9
296(18); 260(26); 230(30); 191(100); 163(14); 148(12)
C12H18N2O4
Isoproturon
by-product 2
HPLC/MS
Figure A.1f 14.7
296(8); 274(100); 252(12); 220(6); 190(32); 162(54)
Isomer of isoproturon by-
product 1
C12H18N2O4

182
Figure A.2 in Appendix A.5 shows the relative areas of the different by-products
detected in the retentate after 1, 3, and 6 hours of operation. The results obtained
show that the relative area/intensity of all major by-products detected except one
(by-product 1 of isoproturon) increased with operation time. For the isoproturon by-
product with a mass to charge ratio of 296 (isoproturon by-product 1), which was
proposed that could correspond to a tri-hydroxylated isoproturon, the peak area
decreased after 6 h of operation, showing that a considerable decrease of this by-
product can be expected using the applied treatment.
In the permeate samples, isoproturon by-products were not detected and alachlor by-
products were detected at extremely low levels (peak intensity percentage values of 1
to 2%) compared to the retentate samples, showing that the membrane was able to
effectively retain the by-products formed.
Previously, other sequential treatments have been studied combining UV photolysis
with nanofiltration or ultrafiltration membranes (Molinari et al. 2008, Molinari et al.
2006). In many cases, the removal of the compounds was mainly achieved by the
oxidation step since the membranes tested were not suitable for the retention of
several pharmaceuticals as well as the respective by-products. In the present study, a
membrane with lower molecular weight cut-off was applied and both LP/UV
photolysis and nanofiltration were efficient to attain high removals of the selected
compounds. Furthermore, the very low estrogenic activity observed in the permeate
shows that the combined treatment is not only extremely efficient at removing the
parent compounds but also the estrogenically active by-products formed.
The permeate flux measurements throughout experiments indicated that the flux was
fairly constant over time. Starting with a flux of 54 and 48 L h-1 m-2 for the pesticides
and hormones solutions, respectively, variation coefficients of approximately 5%
(solution containing the pesticides) and 8% (solution containing the hormones) were

Chapter 5
183
determined. The degradation of natural organic matter present in the water by LP/UV
radiation is likely to have contributed to minimise fouling and promote a relatively
constant flux. Furthermore, the natural water matrix used presents low
concentrations of particulates and colloidal organic matter that usually contribute to
membrane fouling and consequently to flux decline.
5.3.4 Comparison of the different treatment technologies
LP/UV direct photolysis was extremely efficient to degrade several pesticides and
hormones. Lower effectiveness towards the degradation of isoproturon, 17-
estradiol, 17-ethinylestradiol, and estriol were attained. Nevertheless, TiO2
photocatalysis was able to improve the degradation of the more resilient hormones,
for which removals higher than 76% were achieved by photocatalysis.
UV photolysis was considerably more effective than nanofiltration to remove diuron.
Furthermore, the removal of atrazine, isoproturon, diuron, and estrone (particularly,
isoproturon and diuron) was enhanced during the combined treatment relatively to
nanofiltration alone. Although the combined treatment did not improve the removal
of the other compounds, mainly because of their already high removals, the quality of
the retentate was significantly improved in the combined treatment conducted at
lower loadings of micropollutants throughout the 6 h period (without feed solution
addition). The combined treatment is therefore the most effective treatment
addressed. Similar global removals were attained by the combined treatment, when
assessed at different loadings of micropollutants (with and without the addition of
fresh feed solution), and improved retentate treatment is likely to be achieved
through the increase of the residence time, in the case of higher loadings (with fresh
feed solution addition).

184
5.4 CONCLUSIONS
Even though LP/UV/TiO2 was found to be extremely efficient to achieve degradation
of 17-estradiol, 17-ethinylestradiol, and estriol, when the photocatalysis process
was coupled with nanofiltration, complete deposition of TiO2 on the membrane was
observed within the first five minutes of operation. Future work should focus on other
configurations combining TiO2 photocatalysis with nanofiltration that could take
advantage of the benefits of integrating both technologies.
The combination of UV photolysis and nanofiltration improved the water quality
attained by their individual application in terms of the concentration of atrazine,
isoproturon, diuron, and estrone. Even though the quality of the treated water
obtained by the individual technologies and the integrated treatment is similar for
some of the compounds addressed, the quality of the retentate will be increased in
the integrated treatment when the compounds are present at lower concentrations
(without feed solution addition). Under these conditions, it might be effectively
possible to reduce the need to further treat/dispose the retentate. Nevertheless, the
increment of the hydraulic residence time is recommended to attain the same
removal efficiency at higher loadings of micropollutants.
Generally, the membrane applied was also able to retain the by-products formed
during UV photolysis, highlighting the advantage of combining these two processes to
overcome this photolysis drawback.
Globally, the proposed treatment allows the production of high quality water in terms
of the target micropollutants, formed by-products, and the respective estrogenic
activity, assuring the protection of consumers against their potential deleterious
health effects. The integration of the proposed technologies is also expected to be
advantageous for the removal of other organic compounds. Moreover, its application
could also reduce the doses of disinfectants applied during water treatment, leading
Chapter 5
185
to the decrease of the potential formation of hazardous disinfection by-products in
the treated water.
ACKNOWLEDGEMENTS
We thank Dr. José María Navas and Dr. Beate Escher for the yeast strains used in the
Yeast Estrogen Screen Assay and Dr. Benjamin Stanford for his help implementing the
YES method.
Financial support from Fundação para a Ciência e a Tecnologia - through the project
PTDC/AMB/66024/2006, the grant PEst-OE/EQB/LA0004/2011, and the fellowships
BPD/26990/2006 and BD/72244/2010 is gratefully acknowledged.
Vanessa J. Pereira thanks the Department of Geography and Environmental
Engineering at Johns Hopkins University for hosting her as a Visiting Scholar during
the academic year 2012/2013.
REFERENCES
Benotti MJ, Stanford BD, Wert EC, Snyder SA (2009) Evaluation of a photocatalytic reactor membrane pilot system for the removal of pharmaceuticals and endocrine disrupting compounds from water. Water Res 43: 1513-1522.
Bosc F, Ayral A, Guizard C (2005) Mesoporous anatase coatings for coupling membrane separation and photocatalysed reactions. J Membrane Sci 265: 13-19.
Braeken L, Van der Bruggen B, Vandecasteele C (2006) Flux decline in nanoriltration due to adsorption of dissolved organic compounds: Model prediction of time dependency. J Phys Chem B 110: 2957-2962.
Braeken L, Van der Bruggen B (2009) Feasibility of nanofiltration for the removal of endocrine disrupting compounds. Desalination 240: 127-131.
Cabeza Y, Candela L, Ronen D, Teijon G (2012) Monitoring the occurrence of emerging contaminants in treated wastewater and groundwater between 2008 and 2010. The Baix Llobregat (Barcelona, Spain). J Hazard Mater 239: 32-39.
186
Chang H, Wu S, Hu J, Asami M, Kunikane S (2008) Trace analysis of androgens and progestogens in environmental waters by ultra-performance liquid chromatography-electrospray tandem mass spectrometry. J Chromatogr A 1195: 44-51.
Danzo BJ (1997) Environmental xenobiotics may disrupt normal endocrine function by interfering with the binding of physiological ligands to steroid receptors and binding proteins. Environ Health Persp 105: 294-301.
Djafer L, Ayral A, Ouagued A (2010) Robust synthesis and performance of a titania-based ultrafiltration membrane with photocatalytic properties. Sep Purif Technol 75: 198-203.
Donner E, Kosjek T, Qualmann S, Kusk KO, Heath E, Revitt DM, Ledin A, Andersen HR (2013) Ecotoxicity of carbamazepine and its UV photolysis transformation products. Sci Total Environ 443: 870-876.
Dudziak M, Bodzek M (2009) Selected factors affecting the elimination of hormones from water using nanofiltration. Desalination 240: 236-243.
Escher BI, Fenner K (2011) Recent advances in environmental risk assessment of transformation products. Environ Sci Technol 45: 3835-3847.
Johnson AC, Sumpter JP (2001) Removal of endocrine-disrupting chemicals in activated sludge treatment works. Environ Sci Technol 35: 4697-4703.
Kimura K, Amy G, Drewes J, Watanabe Y (2003) Adsorption of hydrophobic compounds onto NF/RO membranes: An artifact leading to overestimation of rejection. J Membrane Sci 221: 89-101.
Kolodziej EP, Harter T, Sedlak DL (2004) Dairy wastewater, aquaculture, and spawning fish as sources of steroid hormones in the aquatic environment. Environ Sci Technol 38: 6377-6384.
Kuster M, José Lopéz de Alda M, Dolores Hernando M, Petrovic M, Martin-Alonso J, Barceló D (2008) Analysis and occurrence of pharmaceuticals, estrogens, progestogens and polar pesticides in sewage treatment plant effluents, river water and drinking water in the Llobregat river basin (Barcelona, Spain). J Hydrol 358: 112-123.
Le-Clech P, Lee EK, Chen V (2006) Hybrid photocatalysis/membrane treatment for surface waters containing low concentrations of natural organic matters. Water Res 40: 323-330.
Leech DM, Snyder MT, Wetzel RG (2009) Natural organic matter and sunlight accelerate the degradation of 17 beta-estradiol in water. Sci Total Environ 407: 2087-2092.
Ma N, Zhang Y, Quan X, Fan X, Zhao H (2010) Performing a microfiltration integrated with photocatalysis using an Ag-TiO2/HAP/Al2O3 composite membrane for water treatment: Evaluating effectiveness for humic acid removal and anti-fouling properties. Water Res 44: 6104-6114.
Malato S, Caceres J, Fernandez-Alba A, Piedra L, Hernando M, Aguera A, Vial J (2003) Photocatalytic treatment of diuron by solar photocatalysis: Evaluation of main intermediates and toxicity. Environ Sci Technol 37: 2516-2524.
McInnis P, Pesticides in Ontario’s Treated Municipal Drinking Water 1986-2006. Environmental Monitoring and Reporting Branch, Ontario Ministry of the Environment (2010). Available online: http://www.ene.gov.on.ca/environment/en/resources/STD01_078819.html.
Molinari R, Palmisano L, Drioli E, Schiavello M (2002) Studies on various reactor configurations for coupling photocatalysis and membrane processes in water purification. J Membrane Sci 206: 399-415.

Chapter 5
187
Molinari R, Pirillo F, Loddo V, Palmisano L (2006) Heterogeneous photocatalytic degradation of pharmaceuticals in water by using polycrystalline TiO2 and a nanofiltration membrane reactor Catal Today 118: 205-213.
Molinari R, Argurio P, Poerio T, Bonaddio F (2007) Photo assisted fenton in a batch and a membrane reactor for degradation of drugs in water. Sep Sci Technol 42: 1597-1611.
Molinari R, Caruso A, Argurio P, Poerio T (2008) Degradation of the drugs Gemfibrozil and Tamoxifen in pressurised and de-pressurised membrane photoreactors using suspended polycrystalline TiO2 as catalyst. J Membrane Sci 319: 54-63.
Nghiem L, Schäfer A, Elimelech M (2004) Removal of natural hormones by nanofiltration membranes: Measurement, modelling, and mechanisms. Environ Sci Technol 38: 1888-1896.
Pereira VJ, Galinha J, Barreto Crespo MT, Matos CT, Crespo JG (2012) Integration of nanofiltration, UV photolysis, and advanced oxidation processes for the removal of hormones from surface water sources. Sep Purif Technol 95: 89-96.
Postigo C, José Lopéz de Alda M, Barceló D, Ginebreda A, Garrido T, Fraile J. (2010) Analysis and occurrence of selected medium to highly polar pesticides in groundwater of Catalonia (NE Spain): An approach based on on-line solid phase extraction-liquid chromatography-electrospray-tandem mass spectrometry detection. J Hydrol 383: 83-92.
Puma GL, Puddu V, Tsang HK, Gora A, Toepfer B (2010) Photocatalytic oxidation of multicomponent mixtures of estrogens (estrone (El), 17 beta-estradiol (E2), 17 alpha-ethynylestradiol (EE2) and estriol (E3)) under UVA and UVC radiation: Photon absorption, quantum yields and rate constants independent of photon absorption. Appl Catal B-Environ 99: 388-397.
Rizzo L (2011) Bioassays as a tool for evaluating advanced oxidation processes in water and wastewater treatment. Water Res 45: 4311-4340.
Rodriguez-Mozaz S, José López de Alda M, Barceló D (2004) Monitoring of estrogens, pesticides and bisphenol A in natural waters and drinking water treatment plants by solid-phase extraction–liquid chromatography–mass spectrometry. J Chromatogr A 1045: 85-92.
Rosenfeldt EJ, Linden KG (2004) Degradation of endocrine disrupting chemicals bisphenol A, ethinyl estradiol, and estradiol during UV photolysis and advanced oxidation processes. Environ Sci Technol 38: 5476-5483.
Rosenfeldt E, Chen P, Kullman S, Linden K (2007) Destruction of estrogenic activity in water using UV advanced oxidation. Sci Total Environ 377: 105-113.
Routledge EJ, Sumpter JP (1996) Estrogenic activity of surfactants and some of their degradation products assessed using a recombinant yeast screen. Environ Toxicol Chem 15: 241-248.
Sanches S, Barreto Crespo MT, Pereira VJ (2010) Drinking water treatment of priority pesticides using low pressure UV photolysis and advanced oxidation processes. Water Res 44, 1809-1818.
Sanches S, Penetra A, Rodrigues A, Ferreira E, Cardoso VV, Benoliel MJ, Barreto Crespo MT, Pereira VJ, Crespo JG (2012) Nanofiltration of hormones and pesticides in different real drinking water sources. Sep Purif Technol 94: 44-53.
Stanford BD, Weinberg HS (2010) Evaluation of on-site wastewater treatment technology to remove estrogens, nonylphenols, and estrogenic activity from wastewater. Environ Sci Technol 44: 2994-3001.
188
Ternes TA, Stumpf M, Mueller J, Haberer K, Wilken RD, Servos M (1999) Behaviour and occurrence of estrogens in municipal sewage treatment plants - I. Investigations in Germany, Canada and Brazil. Sci Total Environ 225: 81-90.
Wilson AGE, Thake DC, Heydens WE, Brewster DW, Hotz KJ (1996) Mode of action of thyroid tumor formation in the male Long-Evans rat administered high doses of alachlor. Fundam Appl Toxicol 33: 16-23.
Zhang Y, Zhou JL, Ning B (2007) Photodegradation of estrone and 17 beta-estradiol in water. Water Res 41: 19-26.
Zhou X, Lian Z, Wang J, Tan L, Zhao Z (2011) Distribution of estrogens along Licun River in Qingdao, China. Procedia Environ Sci 10: 1876-1880.

CHAPTER 6
Discussion and Future work

190
CONTENTS
6.1 Potential of the the individual technologies for drinking water treatment ..... 191
6.1.1 UV photolysis ............................................................................................... 191
6.1.2 Nanofiltration .............................................................................................. 192
6.2 Integrated treatment ................................................................................... 194
6.3 Future work ................................................................................................. 196
6.3.1 Further assessment of the proposed integrated treatment ....................... 196
6.3.2 Proposal of a new configuration ................................................................. 196
6.3.3 Economical evaluation ................................................................................ 200
Acknowledgements ........................................................................................... 201
References ........................................................................................................ 201

Chapter 6
191
The main objective of the work presented in this thesis was to address the potential
of combining low pressure UV photolysis/TiO2 photocatalysis with nanofiltration to
treat water containing environmental relevant micropollutants while overcoming
specific drawbacks related with the individual application of these technologies. The
main achievements are highlighted in this section with a particular emphasis on
future developments and perspectives towards the implementation of the proposed
technologies for drinking water treatment, namely the proposal of a new
configuration.
6.1 Potential of the individual technologies for drinking water treatment
6.1.1 UV photolysis
The very efficient LP/UV direct photolysis/TiO2 photocatalysis of several pesticides
and hormones, associated with their proven high potential towards the inactivation of
a wide range of microorganisms (Le Goff et al. 2010, Shin et al. 2009), demonstrates
the suitability of this technology for drinking water treatment. Even though direct
photolysis alone is sufficient to degrade the majority of the compounds addressed,
TiO2 photocatalysis significantly improved the degradation of the hormones 17-
estradiol, 17-ethinylestradiol, and estriol. Moreover, LP/UV radiation is expected to
be also effective to remove the target compounds in the presence of other
micropollutants during water treatment.
The model applied towards the predictions of direct photolysis of the target
pesticides in different water matrices under different experimental conditions
showed good agreement with experimental data attained. Modelling of experimental
data gave insights for the optimisation of operating conditions during the sequential
treatment in terms of TiO2 concentration and distance to the UV source, particularly
192
for the degradation improvement of the most resilient pesticide, isoproturon. The
determination of UV photolysis kinetic parameters (decadic molar absorption
coefficient, the pseudo-first order rate constants, and the second-order rate
constants for reaction of the pesticides with OH radicals) provides drinking water
utilities with useful information for process implementation.
Although many studies report the degradation of organic compounds as function of
time, the ability to compare data obtained using different systems is not possible. In
the present thesis, a significant amount of data is reported as a function of UV
fluence, allowing a standardisation of UV testing as well as providing increased
confidence in the data generated and the ability to compare data obtained using
other lamps/systems in view of process implementation. An important contribution
is, thus, made in terms of the UV fluences that are needed to cope with the target
compounds.
6.1.2 Nanofiltration
Nanofiltration using the membrane Desal 5DK was able to remove the majority of the
target micropollutants very efficiently. It is, however, noteworthy that diuron is better
removed by UV photolysis than by nanofiltration (Chapter 5). Furthermore, the
rejection of the selected pesticides and hormones is not expected to be considerably
changed in a long term operation and membrane performance is not likely to be
noticeably affected. The removals attained for the pesticides atrazine and alachlor as
well for the hormones using the flat-sheet Desal 5DK membrane were generally in line
with those obtained using the same membrane in a spiral-wound configuration. The
differences observed are within the uncertainties of the analytical methods employed
to determine the concentration of the compounds. Furthermore, removal and fouling
development were similar despite the different pre-treatment of the surface water
Chapter 6
193
applied in both studies (ultrafiltered surface water and surface water collected after
conventional sedimentation).
The application of ultrafiltration prior to nanofiltration was an appropriate strategy to
remove particulate and large colloidal organic matter, without affecting the
concentration of ionic species and NOM. Even though an attempt to correlate the
nanofiltration rejection of the micropollutants with relevant parameters (water
composition, physico-chemical properties of the target micropollutants, and
operating conditions) was carried out, the interpretation of experimental data was
not totally satisfactory.
The application of multivariate statistical analysis demonstrated the complexity of the
relationships (synergies and concurrent effects) that impact process efficiency,
highlighting the difficulty of taking conclusions from univariate analysis as first
attempted.
The rejection of the selected pesticides and hormones were found to be determined
by the combination of size exclusion, electrostatic interactions, and hydrophobic
interactions (Chapters 3, 4, and 5). The properties of the molecules that most
contribute for this phenomenon are molecular weight, molar volume, molecular size,
and log D. The geometry of the molecule, given by molecular length, molecular width,
and molecular depth, was found extremely relevant to explain the lower rejections
obtained for pentachlorophenol compared with the other molecules addressed (57.5-
83.5% vs 67.4-99.9%) since the geometry of this molecule is very different. The lower
rejections are more likely to be determined by the molecular geometry of
pentachlorophenol rather than its increased solubility at the pH of the waters as
initially proposed. Multivariate statistics suggested that the characteristics of the
water matrix are also likely to impact rejection, as observed in a previous work
addressing the removal of alachlor and pentachlorophenol during a dead-end

194
filtration (Sanches et al. 2011). Nevertheless, additional clarification regarding the
impact of several specific water components upon micropollutants rejection was not
accomplished. Further assessment should be conducted through the performance of
experiments using other natural waters with different characteristics to increase the
variability of the data set. Adsorption was found important for the removal of several
compounds, particularly atrazine and alachlor. Hydrophobic interactions were
pointed out as the adsorption mechanism in Chapter 3. Even though PLS models
developed (Chapter 4) suggested that polar and electrostatic interactions may have
an important impact on adsorption, hydrophobic interactions may also play a role.
Generalised conclusions from the models developed should, however, be taken with
care since the variability of the experimental data used was not high and the models
were calibrated with a limited number of compounds and experimental conditions.
The application range of the models developed could be further extended through
the inclusion of data obtained for micropollutants with different physico-chemical
properties, other membranes, and other natural waters. An increased variability in
the experimental data set would be therefore expected, enlarging the range of
rejections. The potential of nanofiltration to remove other environmental relevant
micropollutants from water could be then predicted avoiding empirical rejections.
6.2 Integrated treatment
The combination of nanofiltration with direct LP/UV photolysis was able to enhance
the removals obtained by nanofiltration (using the same membrane) for atrazine,
diuron, isoproturon, and estrone while maintaining the removal of the other
micropollutants fairly constant. An improvement of the water quality in terms of the
removal of isoproturon was also observed using the combined treatment relatively to
UV processes since this compound was found to be very resilient to UV degradation.

Chapter 6
195
Besides the potential to produce high quality water in terms of the target
micropollutants and endocrine disrupting activity, data herein presented
demonstrates that the combined treatment is able to attenuate the drawbacks
related with the individual processes.
The effective removal of the target micropollutants from the retentate as well as the
extremely high reduction of the respective endocrine disrupting activity (particularly
in the case of the hormones) demonstrates that the need to treat/dispose the
nanofiltration retentate and the respective costs are potentially highly reduced.
Higher residence times are, however, needed for a continuous loading of high
concentrations of the target pesticides and hormones, which is a less probable
scenario. Furthermore, the concentrations applied in this study were higher than the
occurrence concentrations and, therefore, UV direct photolysis/TiO2 photocatalysis
might be expected to be even more effective under real conditions.
Further significant economical benefits in terms of operating costs related with
energy consumption and membrane cleaning/replacement are also expected since
very low fouling was observed during the combined treatment (5-8% of flux decline).
The fouling development control is likely to be related with the UV degradation of
organic matter. This feature is particularly important for the treatment of waters
containing high concentrations of NOM like surface waters.
UV by-products from the degradation of alachlor and isoproturon were identified in
the samples taken from the retentate of the integrated treatment. These molecules
were successfully retained by the membrane or were present at very low
concentrations since their detection in the treated water was not achieved. The low
concentration of the by-products formed and estrogenic activity of the treated water
throughout the treatment showed that the photolysis by-products formed were

196
generally efficiently retained by the nanofiltration process. These results highlight the
advantage of the multi-barrier approach comparatively with UV photolysis alone.
6.3 Future work
6.3.1 Further assessment of the proposed integrated treatment
Besides the UV by-products identified during the combined process, many others may
have been generated at extremely low levels that did not enable detection. Further
research should be carried out at higher concentrations to achieve detection of such
compounds. Although the endocrine disrupting activity of the treated water was
found to be very low, other toxicological methodologies could be further applied to
determine different toxicological effects. As an example, the Ames test provides
information related with mutagenicity potential.
The combined treatment was assessed at concentrations that are higher than the
occurrence concentrations of the selected micropollutants in the aqueous
environment. The reasons supporting this strategy, which was also applied for the
assessment of the individual processes, were largely discussed in Chapters 3 and 5. It
would be interesting to evaluate the combined treatment at the pilot-scale and at
occurrence levels for further process validation. Much larger volumes of water could
then be processed in a continuous mode.
6.3.2 Proposal of a new configuration
Even though the removal of the pesticides and the hormones estrone and
progesterone was not considerably improved by TiO2 photocatalysis, a significant

Chapter 6
197
improvement in the removal of 17-estradiol, 17-ethinylestradiol, and estriol was
demonstrated. To take advantage of TiO2 photocatalytic properties and avoid the
deposition of the suspended catalyst, another configuration in which TiO2 is
immobilised on the top surface of a nanofiltration membrane, forming a reactive thin
film, could be developed and evaluated. In this case, photocatalysis would take place
through membrane irradiation.
Magnetron sputtering is a well established physical vapour deposition technique. It
became the number one choice for the deposition of a wide range of industrially
relevant coatings, namely TiO2 coatings, in a variety of surfaces due to its ability to
produce high-purity and high-quality well-adhered functional films at large surface
areas (Kelly and Bradley 2009, Ehiasarian 2010). The application of this technique for
the introduction of a built-in oxidative functionality on filtration membranes could be
a suitable alternative to traditional techniques that often lead to low film stability (Su
et al. 2012, Madaeni et al. 2011) and low homogeneity distribution (Madaeni et al.
2011). Indeed, homogeneous TiO2 thin films were recently developed on the surface
of a commercial ceramic membrane from Fraunhofer, composed of aluminium oxide
and non reactive titanium dioxide, by pulsed direct current (DC) reactive magnetron
sputtering. Different conditions in terms of distance to the target, current intensity,
and immobilisation time were applied (Figure 6.1). The scanning electron microscopy
images presented in Figure 6.1 were obtained by Clarisse Nunes from Laboratório
Nacional de Energia e Geologia in the context of a collaboration established in the
scope of this thesis and its future development.

198
Figure 6.1 Scanning electron microscopy images of the top view (Figures (a) and (b)) and cross section (Figures (c) and (d)) of the TiO2 thin films obtained on the surface of a commercial ceramic membrane by pulsed DC reactive magnetron sputtering. The following sputtering conditions were applied to obtain the film depicted in Figures (a) and (c): distance to the target – 9 cm, immobilisation time – 8 h, current intensity – 0.7 A, pressure – 1.2x10
-2 mbar and argon:oxygen ratio – 2:1. To obtain the film depicted in
Figures (b) and (d), the following conditions were applied: distance to the target – 15 cm, immobilisation time – 11.5 h, current intensity – 1 A, pressure – 1.2x10
-2 mbar and argon:oxygen ratio – 2:1.
Although well defined vertically aligned TiO2 nanostructured columns and a similar
thin film thickness (approximately 1 m) were obtained with both condition sets,
different thin films morphologies were observed, depending on the sputtering
conditions applied. Lower width nanocolumns were generally observed in the TiO2
film obtained applying higher distance to the target, deposition time, and current
intensity (38-119 nm vs 118-222 nm). The permselectivity properties of the coated
(a) (b)
(c) (d)
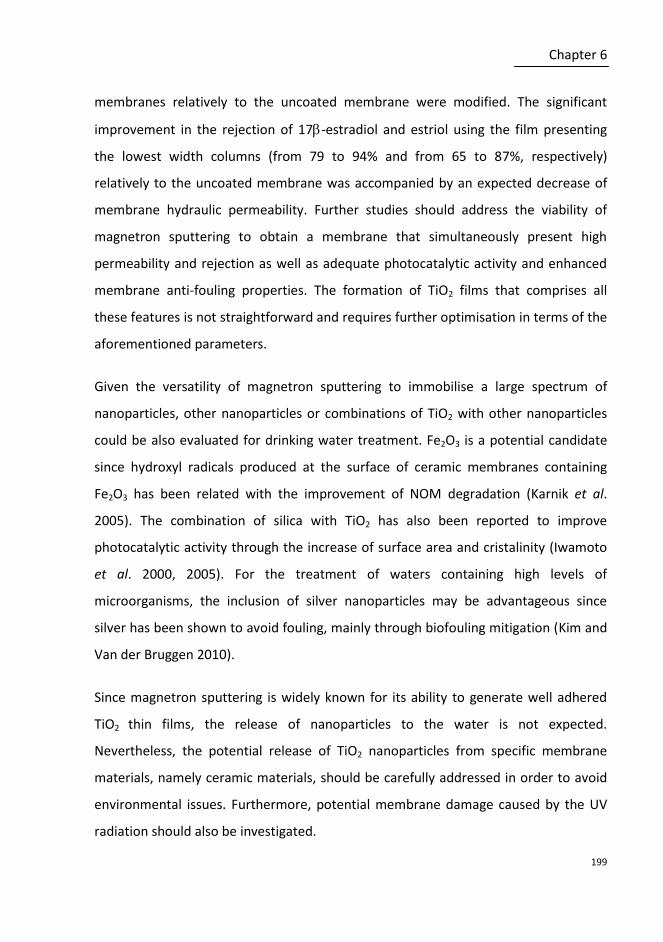
Chapter 6
199
membranes relatively to the uncoated membrane were modified. The significant
improvement in the rejection of 17-estradiol and estriol using the film presenting
the lowest width columns (from 79 to 94% and from 65 to 87%, respectively)
relatively to the uncoated membrane was accompanied by an expected decrease of
membrane hydraulic permeability. Further studies should address the viability of
magnetron sputtering to obtain a membrane that simultaneously present high
permeability and rejection as well as adequate photocatalytic activity and enhanced
membrane anti-fouling properties. The formation of TiO2 films that comprises all
these features is not straightforward and requires further optimisation in terms of the
aforementioned parameters.
Given the versatility of magnetron sputtering to immobilise a large spectrum of
nanoparticles, other nanoparticles or combinations of TiO2 with other nanoparticles
could be also evaluated for drinking water treatment. Fe2O3 is a potential candidate
since hydroxyl radicals produced at the surface of ceramic membranes containing
Fe2O3 has been related with the improvement of NOM degradation (Karnik et al.
2005). The combination of silica with TiO2 has also been reported to improve
photocatalytic activity through the increase of surface area and cristalinity (Iwamoto
et al. 2000, 2005). For the treatment of waters containing high levels of
microorganisms, the inclusion of silver nanoparticles may be advantageous since
silver has been shown to avoid fouling, mainly through biofouling mitigation (Kim and
Van der Bruggen 2010).
Since magnetron sputtering is widely known for its ability to generate well adhered
TiO2 thin films, the release of nanoparticles to the water is not expected.
Nevertheless, the potential release of TiO2 nanoparticles from specific membrane
materials, namely ceramic materials, should be carefully addressed in order to avoid
environmental issues. Furthermore, potential membrane damage caused by the UV
radiation should also be investigated.

200
Despite the proven benefits of TiO2 for the degradation of some micropollutants and
improved membrane performance, the impact of TiO2 nanoparticles should also be
determined from the eco(toxicological) point of view. Although the absence of
toxicity of TiO2 has been widely pointed out as one of the most relevant
characteristics supporting its application for water treatment (Doll and Frimmel
2005), evidence of toxic effects of these engineered nanoparticles on model
organisms has recently emerged (e.g. Wang et al. 2013, Battin et al. 2009).
Implications of TiO2 for the functioning and health of ecosystems needs, therefore,
further assessment prior to its application for drinking water treatment.
If proven stable and non toxic, these films could be produced on large membrane
surfaces to be implemented in water treatment utilities. Furthermore, plant footprint
could be significantly reduced comparatively to the sequential treatment.
6.3.3 Economical evaluation
The implementation of UV treatment for both inactivation and micropollutants
degradation is likely to increase the costs associated with UV inactivation since much
higher UV fluences must be provided to achieve effective degradation (>1500 mJ cm-2
vs 200 mJ cm-2). Conversely, operating costs related with fouling development and
treatment/disposal of retentate are expected to considerably decrease through the
application of the integrated treatment. Furthermore, it is noteworthy that a
considerable improvement of water quality is expected due to micropollutants
removal and the reduction of chlorination by-products produced through the
decrease of chlorine doses needed to achieve effective disinfection. An economical
evaluation should be carried out to address the implementation viability of the
integrated treatment addressed in this thesis. Moreover, the comparison of the costs
and scientific advantages associated with this integrated process and the integrated
Chapter 6
201
process proposed in section 6.3.2 would be interesting to determine the best multi-
barrier treatment.
Even though economic aspects are often barriers for the implementation of
technologies by water producers, attention must be given to the trade-off between
costs and benefits in terms of the quality of the water produced.
ACKNOWLEDGEMENTS
The support of Dr. Clarisse Nunes from Laboratório Nacional de Energia e Geologia
with the development of the coated membranes by DC reactive magnetron sputtering
as well as the fruitful discussions is gratefully acknowledged.
REFERENCES
Battin TJ, Kammer FVD, Weilhartner A, Ottofuelling S, Hofmann T (2009) Nanostructures TiO2: Transport behaviour and effects on aquatic microbial communities under environmental conditions. Environ Sci Tecnol 43: 8098-8104.
Doll TE, Frimmel FH (2005) Removal of selected persistent organic pollutants by heterogeneous photocatalysis in water. Catal Today 101: 195-202.
Ehiasarian AP (2010) High-power impulse magnetron sputtering and its applications. Pure Appl Chem 82: 1247-1258.
Iwamoto S, Tanakulrungsank W, Inoue M, Kagawa K, Praserthdam P (2000) Synthesis of large-surface area silica-modified titania ultrafine particles by the glycothermal method. J Mater Sci Lett 19: 1439-1443.
Iwamoto S, Inoue M, Yoshida H, Tanaka T, Kagawa K (2005) XANES and XPS study of silica-modified titanias prepared by the glycothermal method. Chem Mater 17: 650-655.
Karnik BS, Davies SH, Baumann MJ, Masten SJ (2005) Fabrication of catalytic membranes for the treatment of drinking water using combined ozonation and ultrafiltration. Environ Sci Technol 39: 7656-7661.
Kelly PJ, Bradley JW (2009) Pulsed magnetron sputtering - Process overview and applications. J Optoelectron Adv M 11: 1101-1107.
202
Kim J, Van der Bruggen B (2010) The use of nanoparticles in polymeric and ceramic membrane structures: Review of manufacturing procedures and performance improvement for water treatment. Environ Pollut 158: 2335-2349.
Le Goff L, Khaldi S, Favennec L, Nauleau F, Meneceur P, Perot J, Ballet JJ, Gargala G (2010) Evaluation of water treatment plant UV reactor efficiency against Cryptosporidium parvum oocyst infectivity in immunocompetent suckling mice. J Appl Microbiol 108: 1060-1065.
Madaeni SS, Zinadini S, Vatanpour V (2011) A new approach to improve antifouling property of PVDF membrane using in situ polymerization of PAA functionalized TiO2 nanoparticles. J Membrane Sci 380: 155-162.
Sanches S, Penetra A, Granado C, Cardoso VV, Ferreira E, Benoliel MJ, Barreto Crespo MT, Pereira VJ, Crespo JG (2011) Removal of pesticides and polycyclic aromatic hydrocarbons from different drinking water sources by nanofiltration. Desalin Water Treat 27: 141-149.
Shin GA, Linden KG, Faubert G (2009) Inactivation of Giardia lamblia cysts by polychromatic UV. Lett Appl Microbiol 48: 790-792.
Su Y-C, Huang C, Pan JR, Hsieh W-P, Chu M-C (2012) Fouling mitigation by TiO2 composite membrane in membrane bioreactors. J Environ Eng-ASCE 138: 344-350.
Wang Y, Chen Z, Ba T, Pu J, Chen T, Song Y, Gu Y, Qian Q, Xu Y, Xiang K, Wang H, Jia G (2013) Susceptibility of young and adult rats to the oral toxicity of titanium dioxide nanoparticles. Small 9: 1742-1752.
APPENDICES

204
CONTENTS
A.1 Analytical methods ...................................................................................... 205
A.1.1 Direct HPLC injection of pesticides and hormones ........................................... 205
A.1.2 Concentration and analysis of pesticides and hormones ................................. 207
A.1.2.1 Pesticides ............................................................................................. 207
A.1.2.2 Hormones ............................................................................................. 210
A.1.3 Analysis of by-products ..................................................................................... 211
A.2 LP/UV photolysis ......................................................................................... 212
A.2.1 Characterisation of water matrices ................................................................... 212
A.2.2 Time-based rate constants ................................................................................ 213
A.2.3 Modelling........................................................................................................... 214
A.3 Sampling events used for multivariate statistical analysis ............................. 217
A.4 Yeast estrogen screen assay ......................................................................... 219
A.5 By-products detected during the integrated treatment ................................. 220
References ........................................................................................................ 225

Appendices
205
A.1 Analytical methods
A.1.1 Direct HPLC injection of pesticides and hormones
Samples from the batch LP/UV photolysis experiments (described in Chapter 2) were
analysed by HPLC using a Waters system equipped with ultraviolet and fluorescence
detectors (Waters Chromatography, Milford, MA, USA) and a Luna 5 m C18(2) 100 A
(150 x 3.0 mm) column (Phenomenex Inc., Torrance, CA, USA). The analytical methods
employed are described in Table A.1.
Table A.1 HPLC methods used for the detection of the pesticides atrazine (ATR), isoproturon (ISO), diuron (DIU), alachlor (ALA), pentachlorophenol (PCP), and chlorfenvinphos (CFVP) as well as para-chlorobenzoic acid (pCBA) in the direct photolysis and AOPs experiments.
*used for the analysis of the compounds in direct photolysis and AOPs experiments; **acidic milli-Q
water (containing 10 mM phosphoric acid); UV ultraviolet wavelength; H2O milli-Q water.
Type of photolysis
experiment Compound
Mobile phase composition (%)
Injection volume
(L)
Flow rate (mL min
-1)
UV (nm)
Direct photolysis
DIU 50 ACN/50 H2O 20 1.0 240
ISO 50 ACN/50 H2O 20 1.0 240
ATR 50 ACN/50 H2O * 50 1.0 240
ALA 70 ACN/30 H2O * 50 1.0 220
CFVP 70 ACN/30 H2O 20 1.0 258
PCP 85 ACN/15 H2O ** 50 0.4 230
pCBA 65 ACN/35 H2O ** 20 0.5 240
AOPs
DIU + pCBA 55 MeOH/45 H2O ** 10 0.7 238
ISO + pCBA 47 MeOH/53 H2O ** 10 1.0 238
CFVP + pCBA 65 MeOH/35 H2O ** 50 1.0 238
PCP + pCBA
0-3min: 68 MeOH/32 H2O **
3.5-13min: 90 MeOH/10 H2O ** 13.5-15min: 68 MeOH/32 H2O **
30 1.0 238
Mixture
0-5min: 38 ACN/62 H2O 19min: 47 ACN/53 H2O
20-24min: 75 ACN/25 H2O 26-36min: 38 ACN/62 H2O
50 0.5 220

206
Samples containing the selected pesticides or hormones from pre-adsorption
experiments preceding nanofiltration assays (described in Chapter 3) were analysed
using the chromatographic system aforementioned under the conditions described in
Table A.2.
Table A.2 HPLC methods used for the detection of pesticides and hormones in the direct HPLC analysis of samples from pre-adsorption experiments preceding nanofiltration assays.
Compound Mobile phase composition
(%)
T (⁰C)
Flow rate (mL min-1)
HPLC/UV
UV (nm)
HPLC/FL Detection limit*
(g L-1) em
(nm) exc
(nm)
Atrazine Alachlor
70 ACN/30 H2O
34 0.8 220 - -
50
100
Pentachlorophenol
85 MeOH/15 H2O containing 10 mM
phosphoric acid
34 0.8 220 - - 25
17-Estradiol
17-Ethinylestradiol Estriol
Estrone Progesterone
0-6min: 40 ACN/60 H2O 9-20min: 62 ACN/38 H2O
23-30min: 40 ACN/60 H2O 35 1.0 220 300 217
50 100 100 25 25
*direct injection; T temperature; ACN acetonitrile; MeOH methanol; H2O milli-Q water; UV ultraviolet; FL
fluorescence; ememissionwavelength; excexcitationwavelength; UV ultraviolet wavelength; Volume of
injection: 50L.
Samples from LP/UV photolysis experiments as well as feed, retentate, and control
samples from nanofiltration and the combined treatment experiments (described in
Chapter 5) were analysed by HPLC using a Waters system (Alliance e2695 Separations
Module), equipped with a photodiode array detector (2998, Waters Chromatography,
Milford, MA, USA), a Multi Fluorescence detector (2475, Waters Chromatography,
Milford, MA, USA), and a Luna 5 m C18(2) 100 A (150 x 3.0 mm) column
(Phenomenex Inc., Torrance, CA, USA). The analytical methods employed are
described in Table A.3.

Appendices
207
Table A.3 HPLC methods used for the detection of the selected pesticides and hormones in the direct HPLC analysis of samples from the LP/UV photolysis experiments as well as feed, retentate, and control samples from nanofiltration and combined treatment experiments.
Compound Mobile phase composition
(%) T
(⁰C) Flow rate (mL min-1)
HPLC/UV
UV (nm)
HPLC/FL Detection limit*
(g L-1) em
(nm) exc
(nm)
Atrazine
Isoproturon Diuron
Alachlor Chlorfenvinphos
0-11min: 55 MeOH/45 H2O 12.5-9min: 77 MeOH/23 H2O 21-28min: 55 MeOH /45 H2O
25 0.5 220 240 250
- -
5 20
12.5 50
12.5
17-Estradiol
17-Ethinylestradiol Estriol
Estrone Progesterone
0-6min: 40ACN/60H2O 6.5-9.5: 65ACN/35H2O
10.5-15min: 40ACN/60H2O 35 1.0 220 300 217
50 100
5 25 25
*direct injection; T temperature; ACN acetonitrile; MeOH methanol; H2O milli-Q water; UV ultraviolet; FL
fluorescence; ememissionwavelength; excexcitationwavelength; UV ultraviolet wavelength; volume of
injection: 50L.
A.1.2 Concentration and analysis of pesticides and hormones
Concentration of pesticides and hormones prior to analysis was carried out for the
permeate samples from nanofiltration (Chapters 3 and 5) and combined treatment
experiments (Chapter 5). The same analytical methods were also used to determine
the concentration of pesticides and hormones in the feed, retentate, and control
samples of nanofiltration experiments described in Chapter 3. These analyses were
carried out by EPAL in the context of a collaboration established in the scope of this
thesis and the analytical methodologies applied are described below.
A.1.2.1 Pesticides
Solid phase extraction using an Autotrace workstation system (Caliper Life Sciences,
UK) and Waters OASIS HLB cartridges (6 mL, 200 mg) were used to concentrate

208
atrazine, alachlor, and chlorfenvinphos. The conditioning step was carried out with 6
mL of a mixture of n-hexane/dichloromethane (1:1) and 6 mL of methanol, followed
by 3 mL of water at a flow rate of 10 mL min-1. 500 mL samples were processed at 30
mL min-1 and the elution step was conducted with 6 mL of n-hexane/dichloromethane
(1:1) at 10 mL min-1. The detection of these analytes was accomplished by gas
chromatography with mass spectrometry in selected ion monitoring mode using a HP-
5MS column with 60 m x 0.25 mm x 0.25 m (Agilent Technologies, CA, US). In the
chromatographic analysis, the oven temperature programme starts with 30 °C, which
is held during 1 min. A heating rate of 50 °C min-1 is performed from 30 to 170 °C and
then, 170 °C is held during 1 min. The following heating rate of 1 °C min-1 from 170 to
190 °C is performed and the temperature of 190 °C is held for 3 min. The last heating
rate is 50 °C min-1 from 190 °C to 250 °C, which is held during 10 min. The detection
limits of this method are 0.06 g L-1 (atrazine and chlorfenvinphos) and 0.07 g L-1
(alachlor).
The chromatographic analysis of diuron and isoproturon was conducted using a
Waters Alliance 2795 Separations Module HPLC, equipped with a quaternary pump,
an automatic injector, a thermostatic column compartment, and an Atlantis dC18 (2.1
x 150 mm, 5 m) column from Waters. Gradient conditions were used to analyse
diuron and isoproturon: 10% methanol/90% water with 5 mM ammonium acetate (0
min); 90% methanol/10% water with 5 mM ammonium acetate (15-25 min); 10%
methanol/90% water with 5 mM ammonium acetate (25.1-30 min). The flow rate of
mobile phases was 0.3 mL min-1, the oven temperature was set at 30 °C, and an
injection volume of 20 L was used in the analysis. A mass spectrometer Quattro
micro API triple quadrupole, equipped with a Z-spray electrospray ionisation source
was used. Electrospray ionisation source operating conditions were set using a
capillary voltage of 3.5 kV, a source temperature of 150 °C, an extractor voltage of 2.0

Appendices
209
V, desolvation temperature and gas flow of 300 °C and 850 L h-1, respectively, a RF
lens of 0.5 V, and a cone gas flow of 50 L h-1.
Table A.4 shows the monitoring conditions used for the detection of isoproturon and
diuron.
Table A.4 Monitoring conditions – Multiple Reaction Monitoring (MRM) used in the detection of isoproturon and diuron.
Pesticide Ionisation
mode Precursor
ion
Cone Voltage
(V)
Product ion quantification
( MRM1 )
Collision energy
(eV)
Product ion qualification
( MRM2 )
Collision energy
(eV)
Isoproturon ES + 207.3 26 71.5 17 165.2 14
Diuron ES + 233.2 28 71.5 16 159.8 25
Nitrogen was used as nebulising, desolvation, and cone gas while argon was used as
collision gas with a pressure of 2.83x10⁻³ mbar. The detection limit of the method for
diuron and isoproturon is 0.045 g L-1.
For the detection of pentachlorophenol, 10 L of chloride acid (15%) and 2 g of
sodium chloride were added to the samples prior to the concentration by solid phase
microextraction using 85 m polyacrilate fibre. Gas chromatography with electron
capture detection was used for the analysis of pentachlorophenol, using a HP-5MS
column with 30 m x 0.32 mm x 0.25 m (Agilent Technologies, CA, US). The
temperature programme starts with a period of 5 min at 40 °C, followed by a heating
rate of 5 °C min-1 until 210 °C, which is held during 3 min. The detection limit of this
method is 0.1 g L-1.

210
A.1.2.2 Hormones
Hormones were concentrated by solid-phase extraction and analysed by Ultra
performance liquid chromatography. The solid-phase extraction procedure was
conducted using the Autotrace workstation system and Waters Oasis HLB cartridges
(6 mL, 200 mg). The conditioning step was performed with 6 mL of a mixture of
methanol and acetone (3:2), followed by 3 mL of methanol and 3 mL of ultra-pure
water at a flow rate of 10 mL min-1. Then, 500 mL samples were loaded at a flow rate
of 30 mL min-1. In the elution step, 6 mL of the same mixture of solvents applied in the
activation step were used. The final extract was concentrated to a volume of 0.5 mL
using a Turbovap evaporation system (Zymark, USA) with a nitrogen stream at 0.2 bar
and at a temperature of approximately 35 °C. The chromatographic analysis of the
hormones was conducted using an Ultra performance liquid chromatography Acquity
System (Waters) and an Acquity BEH C18 (2.1 x 50 mm, 1.7 m) column from Waters.
Gradient conditions were used to analyse the hormones: 30% methanol/70% water
with 0.05% ammonia (starting at 0min); 95% methanol/5% water with 0.05%
ammonia (3-4.2 min); 30% methanol/70% water with 0.05% ammonia (5-6 min). The
flow rate of mobile phases was 0.5 mL min-1, the oven temperature was set at 40 °C,
and an injection volume of 20 L was used in the analysis. A mass spectrometer triple
quadrupole Acquity TQD, equipped with a Z-spray electrospray ionisation source was
used. Electrospray ionisation source operating conditions were set using a capillary
voltage of 3.0 kV, a source temperature of 150 °C, an extractor voltage of 2.0 V,
desolvation temperature and gas flow of 500 °C and 900 L h-1, respectively, a RF lens
of 0.1 V, and a cone gas flow of 20 L h-1. Table A.5 shows the mass spectrometry
conditions used for the detection of the selected hormones. The detection limit of the
method for all the selected hormones is 0.05 g L-1.

Appendices
211
Table A.5 Optimised mass spectrometry conditions used for the detection of the target hormones.
MRM Multiple Reaction Monitoring; m/z mass to charge ratio.
A.1.3 Analysis of by-products
A concentration step prior to the identification of by-products from the degradation
of atrazine, alachlor, and chlorfenvinphos was carried out under the same conditions
previously described for the concentration of the parent compounds (Appendix
A1.2.1). The identification of these by-products was carried out in full scan mode (50
to 500 m/z) using a gas chromatographer equipped with a quadropole mass
spectrometer in electronic impact ionisation mode. The injection was performed at
splitless mode with an injector temperature of 250 °C, a split flux of 25 mL min-1, and
a splitless time of 1.5 min. Helium was used as carrier gas with a constant flux of 1.0
mL min-1. The oven temperature programme starts with 40 °C, which is held during 1
minute. A heating rate of 50 °C min-1 is performed from 40 to 170 °C and then, 170 °C
is held during 1 min. The following heating rate of 1 °C min-1 from 170 to 190 °C is
performed and the temperature of 190 °C is held for 3 min. The last heating rate is 50
°C min-1 from 190 °C to 250 °C, which is held during 20 min.
A Waters Alliance 2795 Separations Module HPLC with a mass spectrometer Quattro
micro API triple quadrupole equipped with a Z-spray electrospray ionisation source
Hormones Time (min)
Cone voltage (V)
MRM transition (m/z)
precursor ion → product ion
Collision energy
(eV)
Dwell time (s)
17-Estradiol 1.97–2.50 MRM1 MRM2
65 (ES-) 65 (ES-)
271.4 → 145.3 271.4 → 143.0
40 65
0.025
17-Ethinylestradiol 1.97–2.50 MRM1 MRM2
50 (ES-) 50 (ES-)
295.4 → 145.0 295.4 → 159.0
39 34
0.025
Estrone 1.97– 2.50 MRM1 MRM2
60 (ES-) 60 (ES-)
269.3 → 145.2 269.3 → 143.0
40 55
0.025
Estriol 0.00–1.70 MRM1 MRM2
60 (ES-) 60 (ES-)
287.4 → 145.4 287.4 → 171.3
40 35
0.078
Progesterone 2.40–2.80 MRM1 MRM2
50 (ES+) 50 (ES+)
315.4 → 96.9 315.4 → 108.9
20 25
0.025
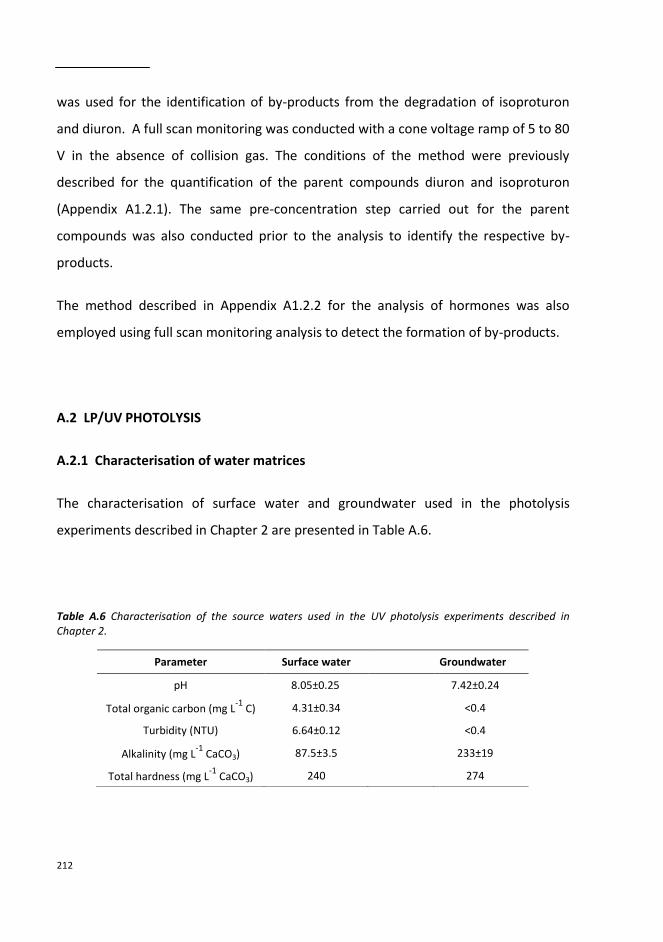
212
was used for the identification of by-products from the degradation of isoproturon
and diuron. A full scan monitoring was conducted with a cone voltage ramp of 5 to 80
V in the absence of collision gas. The conditions of the method were previously
described for the quantification of the parent compounds diuron and isoproturon
(Appendix A1.2.1). The same pre-concentration step carried out for the parent
compounds was also conducted prior to the analysis to identify the respective by-
products.
The method described in Appendix A1.2.2 for the analysis of hormones was also
employed using full scan monitoring analysis to detect the formation of by-products.
A.2 LP/UV PHOTOLYSIS
A.2.1 Characterisation of water matrices
The characterisation of surface water and groundwater used in the photolysis
experiments described in Chapter 2 are presented in Table A.6.
Table A.6 Characterisation of the source waters used in the UV photolysis experiments described in Chapter 2.
Parameter Surface water Groundwater
pH 8.05±0.25 7.42±0.24
Total organic carbon (mg L-1
C) 4.31±0.34 <0.4
Turbidity (NTU) 6.64±0.12 <0.4
Alkalinity (mg L-1
CaCO3) 87.5±3.5 233±19
Total hardness (mg L-1
CaCO3) 240 274
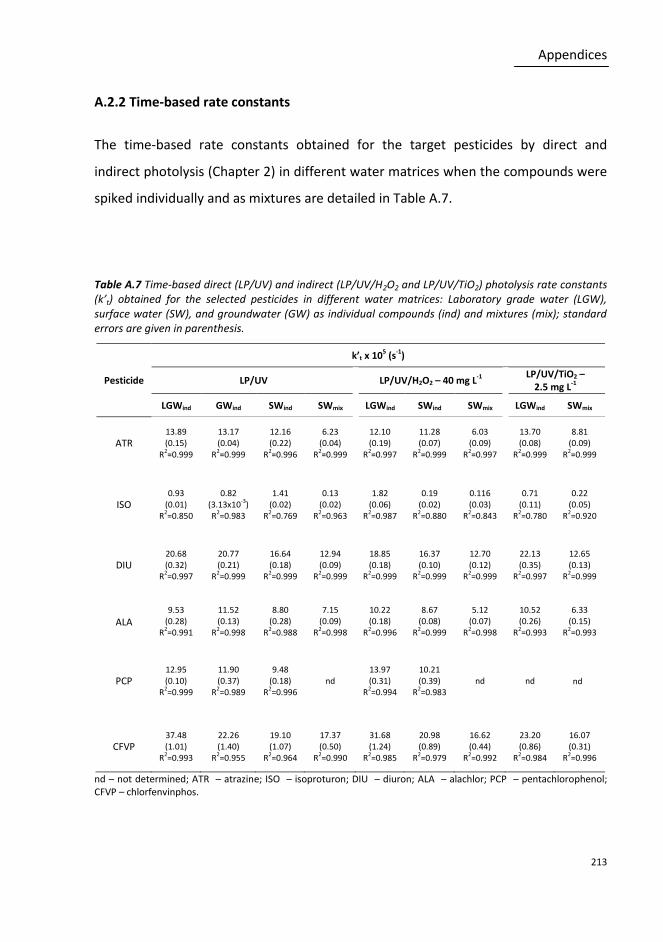
Appendices
213
A.2.2 Time-based rate constants
The time-based rate constants obtained for the target pesticides by direct and
indirect photolysis (Chapter 2) in different water matrices when the compounds were
spiked individually and as mixtures are detailed in Table A.7.
Table A.7 Time-based direct (LP/UV) and indirect (LP/UV/H2O2 and LP/UV/TiO2) photolysis rate constants (k’t) obtained for the selected pesticides in different water matrices: Laboratory grade water (LGW), surface water (SW), and groundwater (GW) as individual compounds (ind) and mixtures (mix); standard errors are given in parenthesis.
Pesticide
k’t x 105 (s-1)
LP/UV LP/UV/H2O2 – 40 mg L-1 LP/UV/TiO2 –
2.5 mg L-1
LGWind GWind SWind SWmix LGWind SWind SWmix LGWind SWmix
ATR 13.89 (0.15)
R2=0.999
13.17 (0.04)
R2=0.999
12.16 (0.22)
R2=0.996
6.23 (0.04)
R2=0.999
12.10 (0.19)
R2=0.997
11.28 (0.07)
R2=0.999
6.03 (0.09)
R2=0.997
13.70 (0.08)
R2=0.999
8.81 (0.09)
R2=0.999
ISO 0.93
(0.01) R2=0.850
0.82 (3.13x10⁻³) R2=0.983
1.41 (0.02)
R2=0.769
0.13 (0.02)
R2=0.963
1.82 (0.06)
R2=0.987
0.19 (0.02)
R2=0.880
0.116 (0.03)
R2=0.843
0.71 (0.11)
R2=0.780
0.22 (0.05)
R2=0.920
DIU 20.68 (0.32)
R2=0.997
20.77 (0.21)
R2=0.999
16.64 (0.18)
R2=0.999
12.94 (0.09)
R2=0.999
18.85 (0.18)
R2=0.999
16.37 (0.10)
R2=0.999
12.70 (0.12)
R2=0.999
22.13 (0.35)
R2=0.997
12.65 (0.13)
R2=0.999
ALA
9.53
(0.28) R
2=0.991
11.52 (0.13)
R2=0.998
8.80
(0.28) R
2=0.988
7.15
(0.09) R
2=0.998
10.22 (0.18)
R2=0.996
8.67
(0.08) R
2=0.999
5.12
(0.07) R
2=0.998
10.52 (0.26)
R2=0.993
6.33
(0.15) R
2=0.993
PCP 12.95 (0.10)
R2=0.999
11.90 (0.37)
R2=0.989
9.48 (0.18)
R2=0.996
nd 13.97 (0.31)
R2=0.994
10.21 (0.39)
R2=0.983
nd nd
CFVP 37.48 (1.01)
R2=0.993
22.26 (1.40)
R2=0.955
19.10 (1.07)
R2=0.964
17.37 (0.50)
R2=0.990
31.68 (1.24)
R2=0.985
20.98 (0.89)
R2=0.979
16.62 (0.44)
R2=0.992
23.20 (0.86)
R2=0.984
16.07 (0.31)
R2=0.996
nd – not determined; ATR – atrazine; ISO – isoproturon; DIU – diuron; ALA – alachlor; PCP – pentachlorophenol; CFVP – chlorfenvinphos.
nd

214
A.2.3 Modelling
The degradation kinetics of the micropollutants (M) by LP/UV direct photolysis was
modelled according to Equations A.1 to A.4 (Sharpless and Linden 2003,
Schwarzenbach et al. 1993):
a254nm= ε254nm [M] z (A.1)
with a being the absorbance measured at 254 nm, ε the decadic molar absorption
coefficient, [M] the micropollutants concentration (that ranged approximately from
0.3 to 30 M), and z the 1 cm pathlength.
MλKMk'dt
Md
λ
sd
(A.2)
zλa
101λελEλK
zλap
o
s
(A.3)
tk'M
Mlndsk'dx
x
1Mk'
dt
Mdd
0
t
t
d
M
M
d
00
(A.4)
where k'd represents the time-based pseudo-first-order direct rate constant for the
individual pesticides by LP direct photolysis in LGW, which was obtained from the
slope of the linear regression described by Equation A.4. represents the specific
rate of light absorption by the compound; the incident photon irradiance
determined taking into account a radiometer reading as well as petri, reflection,
water, and divergence factors; () the decadic molar absorption coefficient obtained
using Equation A.1; a() the solution absorbance; z the solution depth in the petri
dish (2.1 cm); and the quantum yield. Since LP lamps emit mainly monochromatic
light, all the parameters described above were experimentally obtained at 254 nm.
Appendices
215
The degradation of organic compounds during AOPs is the result of direct and indirect
photolysis, described by Equation A.5.
Mk'k'dt
Mdid (A.5)
with k’i being the pseudo-first-order rate constant for indirect photolysis. This
constant is a function of the second-order reaction rate constant ( OH/Mk ), determined
experimentally using pCBA as a probe compound, and the steady-state concentration
of OH radicals ([•OH]ss) as follows:
ssOH/Mi OHkk' (A.6)
[•OH]ss is a function of the quantum yield for photolysis of H2O2 into two OH radicals,
the sum of the pseudo-first-order rates of reaction of •OH with scavengers (kOH/S; e.g.
HCO3-, CO3
2-, dissolved organic carbon DOC, and H2O2), and all the other parameters
described above in the direct photolysis expressions:
i
iOH/S
22OH
λ
OHa,
ss[S]k
OHλλk
OH22
(A.7)
λ 22OH
zOHλελa
OHpo
OHa,zOHλελa
101λελEλK
22
222O2H
22
22 (A.8)
The pseudo-first-order rates of reaction of OH radicals with scavengers were taken as:
kOH/HCO3- = 8.5 × 10⁶ L mol-1 s-1 (Buxton et al. 1988), kOH/CO3
2- = 3.9 × 10⁸ L mol-1 s-1
(Buxton et al. 1988), kOH/DOC = 2.5 × 10⁴ L mg-1 s-1 (Larson and Zepp 1988), and kOH/H2O2 =
2.7 × 10⁷ L mol-1 s-1 (Buxton et al. 1988). The H2O2 concentration was determined in
each experiment (Klassen et al. 1994) and the DOC concentration of the filtered

216
surface water was 4 mg L-1 C. Bicarbonate and carbonate concentrations were
calculated according to Equation A.9, using the alkalinity and pH values of the filtered
surface water:
Alk = [HCO3-]+2[CO3
2-]+[OH-]-[H+] = (1+22)×[TOTCO3]+[OH-]-[H+] (A.9)
The second-order rate constants for reaction of the pesticides with OH radicals were
determined by competition kinetics using pCBA as a reference compound (Huber et
al. 2003), after rearrangement of Equations A.5 and A.10:
pCBAOHkdt
pCBAdOH/pCBA
(A.10)
After substituting OHdt from Equation A.10 into Equation A.5 and rearranging, the
expressions allow the determination of the second-order rate constants ( OH/Mk ),
using Equation A.11 as the slope of a plot of tkM/Mln 'd0 vs
OH/pCBA0 1/kpCBA/pCBAln , assuming a very fast reaction rate between the OH
radicals and pCBA of 5 × 10⁹ M-1 s-1 (Neta and Dorfman 1968):
OH/pCBA0OH/M
'd
0 k
1
pCBA
pCBAlnktk
M
Mln (A.11)
Before conducting the indirect photolysis experiments, direct photolysis of pCBA was
tested and found negligible.

Appendices
217
A.3 SAMPLING EVENTS USED FOR MULTIVARIATE STATISTICAL ANALYSIS
The sampling events (rejection and adsorption values) used to develop the models
presented in Chapter 4 are depicted in Table A.8.
Table A.8 Rejection and adsorption values used in multivariate statistical analysis.
Description of the experiment
Water matrix Compound Adsorption
(%)
Apparent rejection
(%)
Experiments without pre-adsorption
Groundwater
Atrazine 90.8 96.2
Alachlor 98.8 99.9
Pentachlorophenol 16.4 70.5
17-Estradiol 59.4 97.2
17-Ethinylestradiol 37.3 92.2
Estrone 49.3 95.3
Estriol 39.2 98.3
Progesterone na 96.3
Surface Water
Atrazine 96.9 99.9
Alachlor 54.5 99.9
Pentachlorophenol 54.2 75.4
Experiments with static pre-adsorption
Groundwater
Atrazine 73.3 99.0
Alachlor 97.2 99.8
Pentachlorophenol 18.1 57.5
17-Estradiol 37.2 91.7
17-Ethinylestradiol 47.8 94.3
Estrone 94.3 94.3
Estriol na 93.8
Progesterone na 94.8

218
Table A.8 Rejection and adsorption values used in multivariate statistical analysis (continuation).
Description of the experiment
Water matrix Compound Adsorption
(%)
Apparent rejection
(%)
Experiments with static pre-adsorption Surface Water
Atrazine na 97.1
Alachlor 98.8 98.9
Pentachlorophenol 48.1 83.5
17-Estradiol 42.3 96.3
17-Ethinylestradiol 20.4 93.8
Estrone 52.0 98.7
Estriol 32.9 97.4
Progesterone na 98.6
Experiments with static and dynamic
pre-adsorption
Groundwater
17-Estradiol 25.8 91.9
17-Ethinylestradiol 9.1 90.0
Estrone 18.1 93.1
Estriol 9.0 93.7
Progesterone na 96.0
Surface Water
17-Estradiol 30.8 97
17-Ethinylestradiol 23.1 96.0
Estrone 37.3 97.6
Estriol 24.4 98.6
Progesterone na 99.5
na – not available

Appendices
219
A.4 YEAST ESTROGEN SCREEN ASSAY
The yeast colonies were propagated using a single colony every 3 weeks on plates
containing Sabouraud dextrose agar supplemented with chloramphenicol (60 g L-1 of
agar and 3 mL of chloramphenicol solution 100 mg L-1) to avoid growth of bacteria.
The plates were incubated at 30 °C during 72 to 96 h and then stored at 4 °C. A single
colony of a recent plate was used to inoculate liquid growth medium containing
several salts, aminoacids, glucose, and vitamins. This growth medium was then
incubated at 30 °C in a shaker table (100 rpm) (Innova 2100) placed in a dark room,
during 18 to 24 h, until an optical density at 640 nm of approximately 1 was reached.
Then, the inoculated growth medium (230 L) was added to 96-well microplates
containing the samples or the respective dilutions and the substrate chlorophenol
red--D-galactopyranoside (20 L). 17-estradiol was also plated as a reference
sample and used as a standard reference compound since it presents a very high
endocrine disrupting activity. The 96-well microplates were incubated in the dark at
30 °C in a shaker plate (200 rpm) during 96 h to observe colour development (change
from yellow to red), which is a measure of the estrogenic activity of the sample. The
absorbance of the wells was measured at 562 nm (change of CPRG colour) and 640
nm (turbidity correction) using a microplate spectrophotometer reading. The
corrected absorbance was determined by subtracting the absorbance measured at
640nm to the one measured at 562 nm. Then, the oftware “R” v 2.13.0, created by
Ritz and Streibig, was used to determine the EC50 of 17-estradiol and samples. For
that, the package add-on dose-response-curve was downloaded to the program and
used in combination with comma separated values format files containing the
absorbance data obtained and the respective concentration factors.

220
A.5 BY-PRODUCTS DETECTED DURING THE INTEGRATED TREATMENT
The by-products produced during the integrated treatment experiments (Chapter 5)
were identified based on the respective mass spectra depicted in Figure A.1.
(a)
(b)

Appendices
221
(c)
(d)

222
(e)

Appendices
223
Figure A.1 Mass spectra of major by-products detected.
(f)
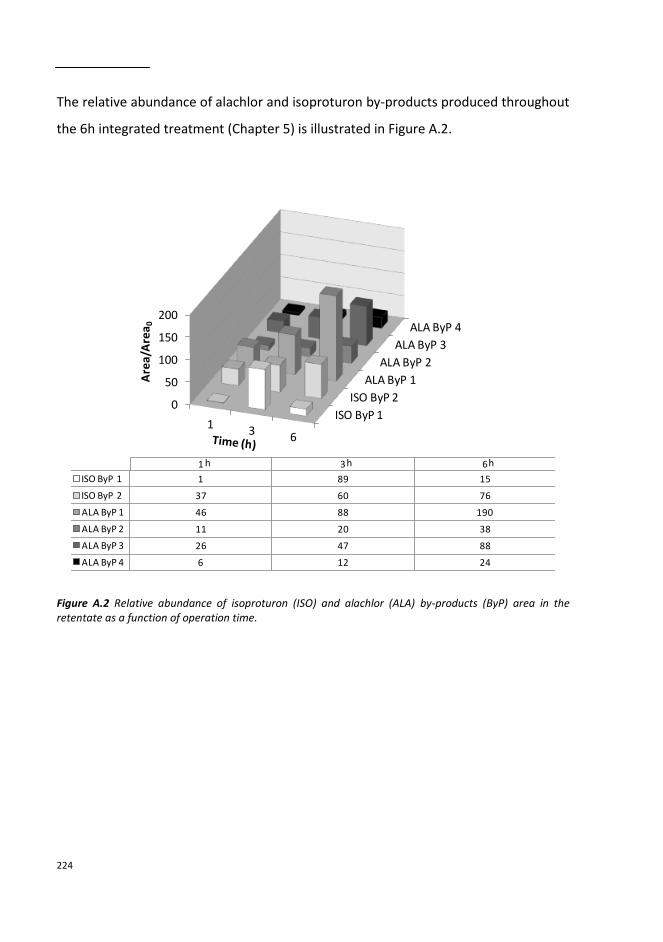
224
The relative abundance of alachlor and isoproturon by-products produced throughout
the 6h integrated treatment (Chapter 5) is illustrated in Figure A.2.
Figure A.2 Relative abundance of isoproturon (ISO) and alachlor (ALA) by-products (ByP) area in the retentate as a function of operation time.
ISO ByP 1
ISO ByP 2
ALA ByP 1
ALA ByP 2
ALA ByP 3
ALA ByP 4
0
50
100
150
200
1 3 6
Are
a/A
rea
0
1 3 6
ISO ByP 1 1 89 15
ISO ByP 2 37 60 76
ALA ByP 1 46 88 190
ALA ByP 2 11 20 38
ALA ByP 3 26 47 88
ALA ByP 4 6 12 24
h h h
Appendices
225
REFERENCES
Buxton GV, Greenstock CL, Helman WP, Ross AB (1988) Critical-review of rate constants for reactions of hydrated electrons, hydrogen-atoms and hydroxyl radicals (OH/O
-) in aqueous-solution. J Phys
Chem Ref Data 17: 513-886.
Huber MM, Canonica S, Park GY, Von Gunten U (2003) Oxidation of pharmaceuticals during ozonation and advanced oxidation processes. Environ Sci Technol 37: 1016-1024.
Klassen NV, Marchington D, McGowan HCE (1994) H2O2 determination by the I-3 method and by KMNO4
titration. Anal Chem 66: 2921-2925.
Larson RA, Zepp RG (1988) Reactivity of the carbonate radical with aniline derivatives. Environ Toxicol Chem 7: 265-274.
Neta P, Dorfman LM (1968) Pulse radiolysis studies XIII rate constants for reaction of hydroxyl radicals with aromatic compounds in aqueous solutions. Adv Chem Ser 81: 222-230.
Schwarzenbach RP, Gschwend PM, Imboden DM, In environmental organic chemistry. John Wiley & Sons, Inc., New York (1993).
Sharpless C, Linden K (2003) Experimental and model comparisons of low- and medium-pressure Hg lamps for the direct and H2O2 assisted UV photodegradation of N-nitrosodimethylamine in simulated drinking water. Environ Sci Technol 37: 1933-1940.

“Patience and perseverance have a magical effect before which difficulties disappear
and obstacles vanish.”
John Quincy Adams (1767 –1848)