integration of mangroves and aquaculture · integration of mangroves and aquaculture j.h. primavera...
TRANSCRIPT

INTEGRATION OF MANGROVES AND AQUACULTURE
J.H. PrimaveraSEAFDEC Aquaculture Department
Tigbauan, Iloilo, Philippines
• Aquaculture
• Mangroves
• Are they compatible?
- Mangrove-Friendly Aquaculture in Asia
- Mangroves as aquaculture filters
- Mud crab culture in mangrove pens
• Mangrove rehabilitation (typhoons, sealevel rise)

ASIAN AQUACULTURE SPECIES/SYSTEMS
Group System Method
Plants: Eucheuma, longlines, rafts, extensiveGracilaria fixed bottom Laminaria
Molluscs: oyster, mussel, rafts, longlines, extensivescallops stakes
Crustaceans: prawns/shrimps, ponds extensive, semi-crabs intensive, intensive
Marine/brackishwater fish: pens, cages, extensive, semi-milkfish, tilapia, ponds intensive, intensivegrouper, snapper
Freshwater fish: tilapia ponds, cages, polyculture,carps, catfish pens intensive

Ecological impacts of aqua-culture (Naylor et al, 2000)

Flow chart of capture and farmed fisheries products from aquatic primary production (in 2001 million metric tons of fish = 48.4 Mmttot.) (Naylor et al, 2000)
AQUACULTURE DEPENDENCE ON WILD FISH SUPPLIES

molluscs (filter feeders)
aquatic plants
crustaceans
freshwater fish (omnivores/ herbivores)
dia-
dromous,
marine fish
2006 Aquaculture Production
(85.9 million mt, US$66.7 billion)
7.3 (20.7)
% Vol. (Value)
6.7 (20.9)
41.6 (34.4)
21.1 (13.9)
23.5 (10.2)
Source: FAO Yearbook 2006

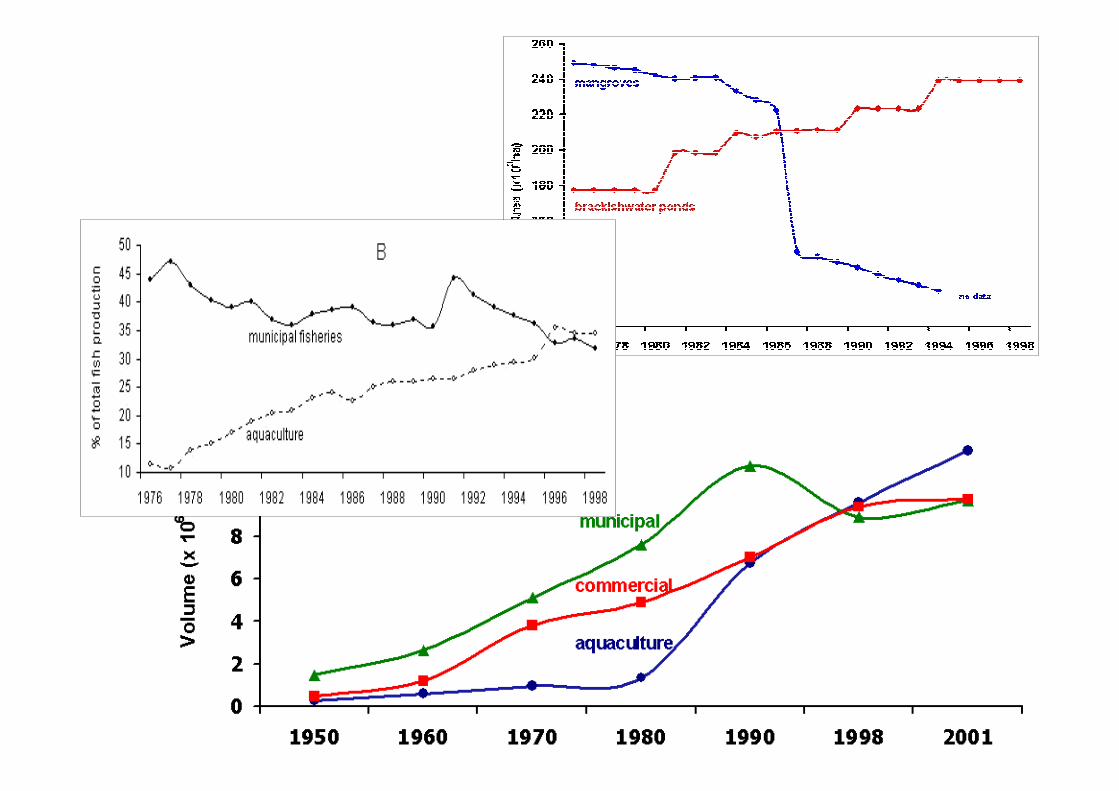
Philippine fisheries production
World Aquaculture Production
1950s: 1 Mmt
2006: 67 Mmt (42% total fisheries prod.)

ENVIRONMENTAL IMPACTS
1) Habitat (mangroves) loss/modification
2) Introduction of exotic species
3) Spread of pests and diseases
4) Salinization of soil and water
5) Dependence on fishmeal
6) Misuse of antibiotics and chemicals
7) Loss of bycatch of wild fry/broodstock
8) Pollution/eutrophication of receiving waters

MANGROVES PONDS
1918: 500,000 ha 1940: 61,000 ha
1994: 120,000 ha 1994: 232,000 ha
MANGROVE: POND RATIO 0.5:1
MANGROVES PONDS
1918: 500,000 ha 1940: 61,000 ha
1994: 120,000 ha 1994: 232,000 ha
MANGROVE: POND RATIO 0.5:1
PHILIPPINES

SE Asia Shrimp ponds
(ha)a Mangroves
(ha)b % Mangrove loss
(30 yr)c,d
Brunei Darussalam -- 17,100 -- Cambodia -- 60,100 --
Indonesia 350,000 4,542,100 32 – 45
Malaysia 4,000 642,400 25 – 32
Myanmar -- 378,600 --
Philippines 60,000 160,700 40 – 80
Thailand 200,000 264,100 50 – 70
Vietnam 200,000 252,400 --
Total 814,000 6,317,500
% world total 65 35
SE ASIAN MANGROVES & SHRIMP CULTURE
GLOBAL (Valiela et al., 2001)
54% - total present area representedin study
2.1% - yearly loss of existing area35% - average loss since 1980s 52% - loss due to shrimp and fish
culture
MANGROVES & SHRIMP
CULTURE IN SOUTHEAST
ASIA
World Total:
16-18 M ha mangroves
1.25 M ha fish/shrimp
ponds
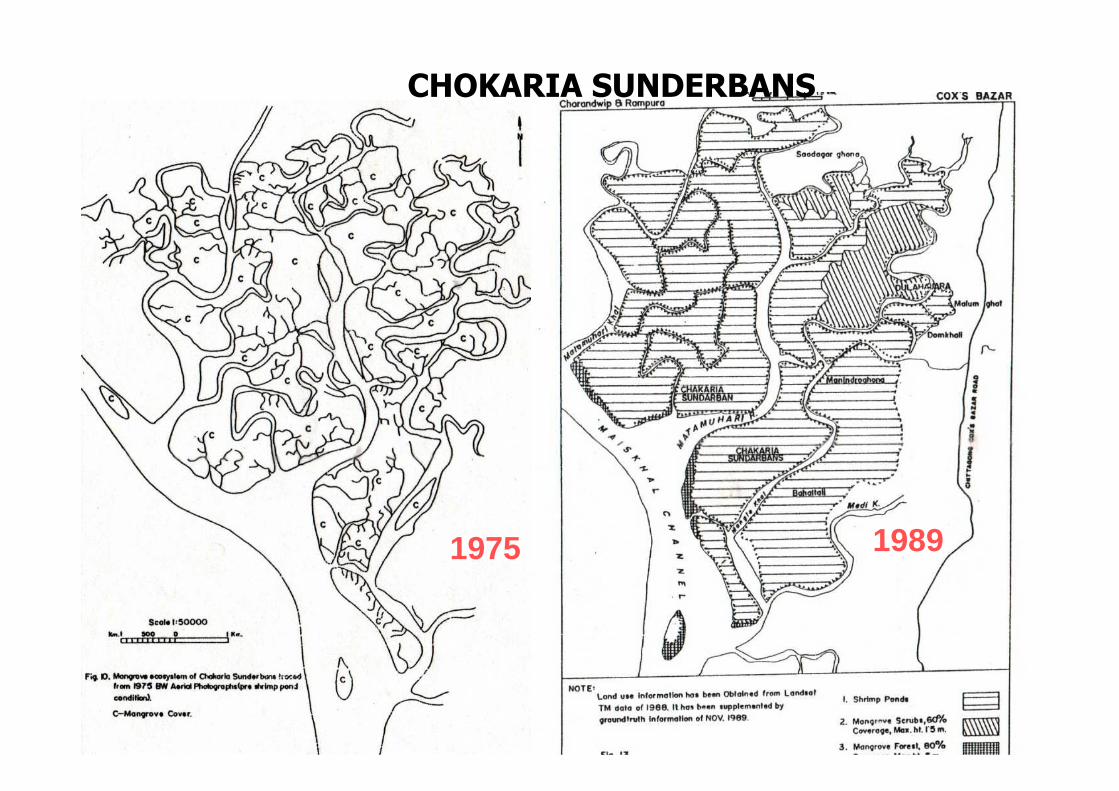
CHOKARIA SUNDERBANS
1975 1989
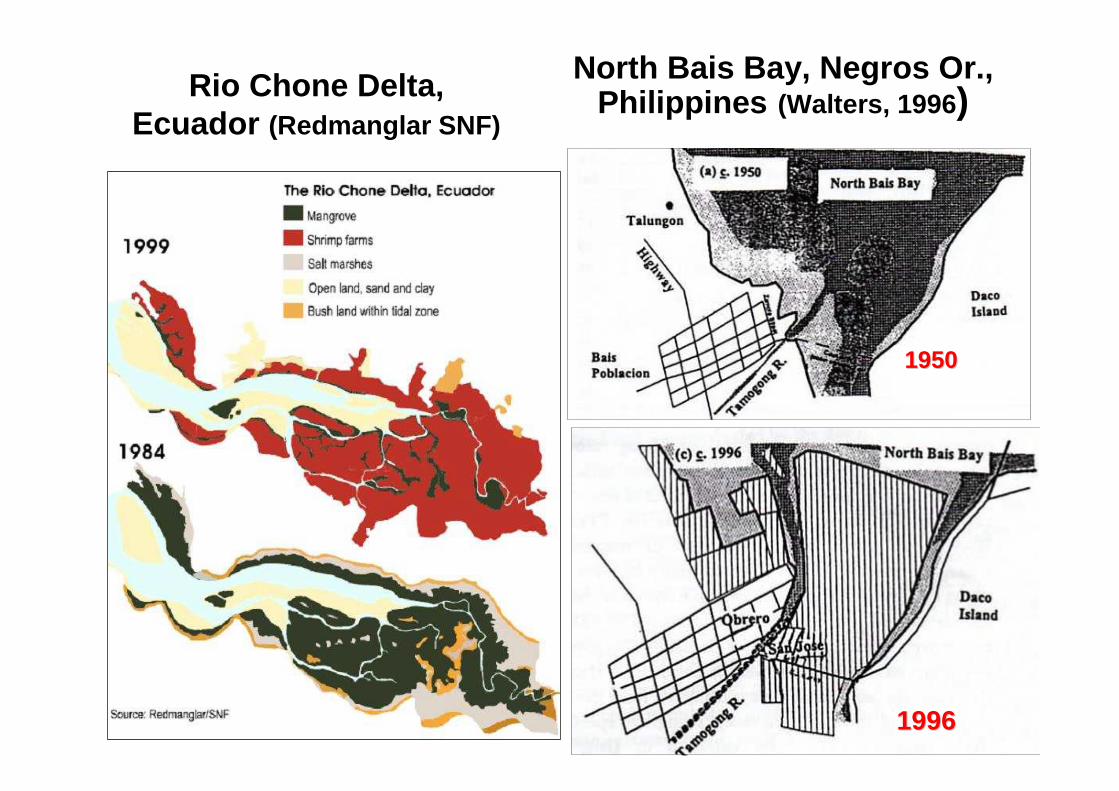
North Bais Bay, Negros Or., Philippines (Walters, 1996 )
19501950
19961996
Rio Chone Delta, Ecuador (Redmanglar SNF)
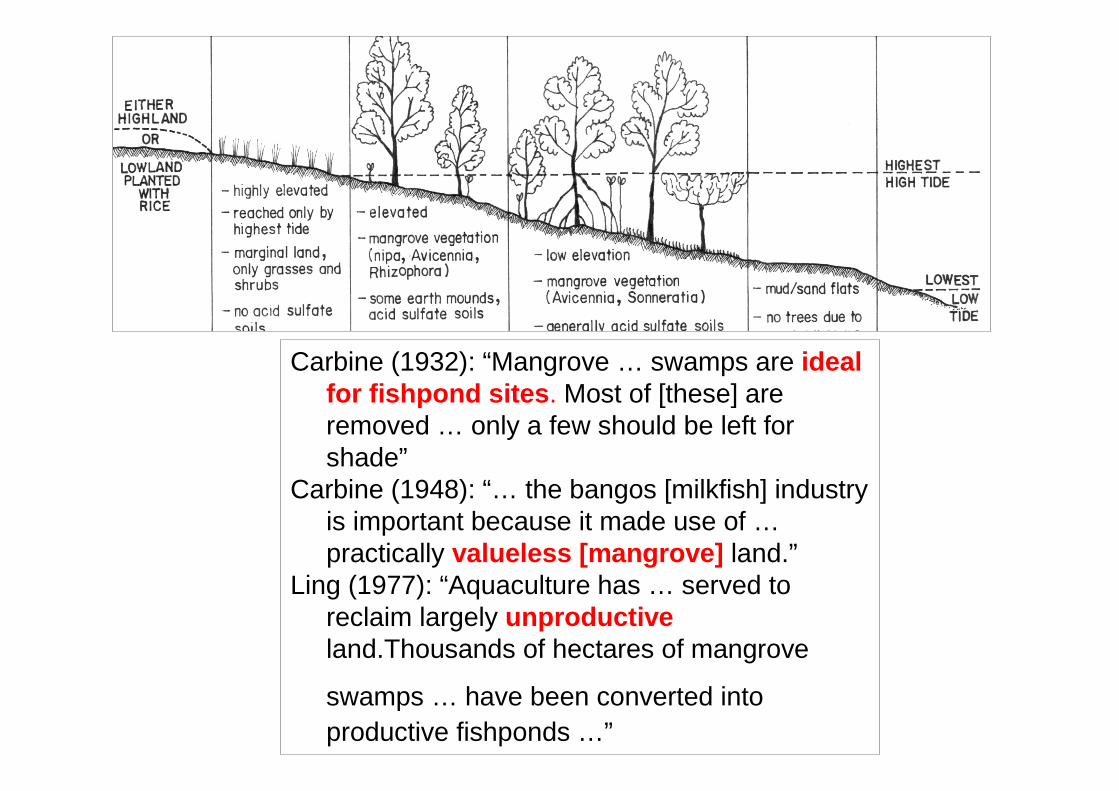
Carbine (1932): “Mangrove … swamps are ideal for fishpond sites . Most of [these] are removed … only a few should be left for shade”
Carbine (1948): “… the bangos [milkfish] industry is important because it made use of …practically valueless [mangrove] land.”
Ling (1977): “Aquaculture has … served to reclaim largely unproductiveland.Thousands of hectares of mangrove
swamps … have been converted intoproductive fishponds …”

BIOGEOGRAPHICAL DISTRIBUTION OF MANGROVES (Duke, 19 94)AND PRAWNS (Chong et al., 1996)
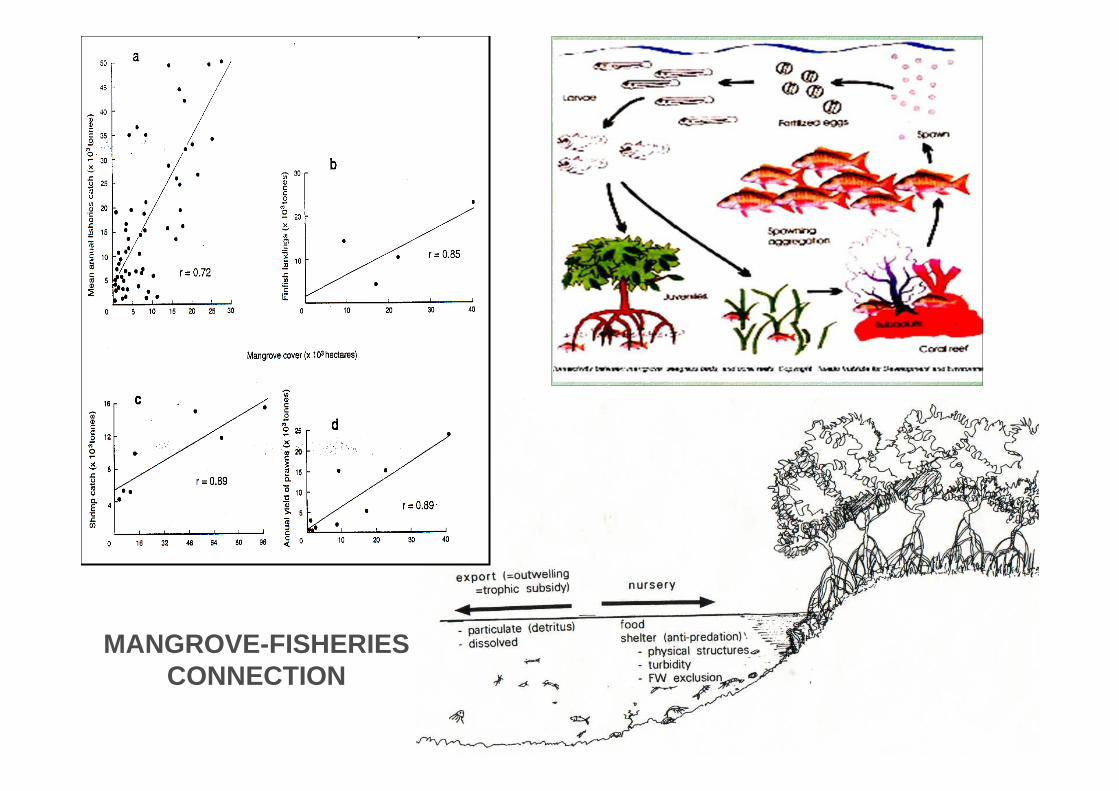
MANGROVE-FISHERIES CONNECTION

1) Technology: traditional – gei wai, tambakstate-driven – silvofisheries, shrimp-mangrove (land conflict), aquasilviculture, crab pens (fish production,
income, conservation)
2) Systems: pond – mixed or separatepen (mudcrab: most lucrative)
3) Aquaculture: species – fish, shrimp, crabseed – tidal vs stockedfeed – natural vs supplementaryproduction - <500 kg/ha/yr (extensive)
4) Mangroves: natural vs plantedRhizophora vs Avicennia/others
5) Flora/fauna diversity: lower in MFA ponds
6) Problems/R&D: mangrove/aquaculture species, pond design, mangrove:pond ratio, raw fish substitutes
SUMMARY

N budget: intensive shrimp pond (Briggs & Funge-Smith, 1994)
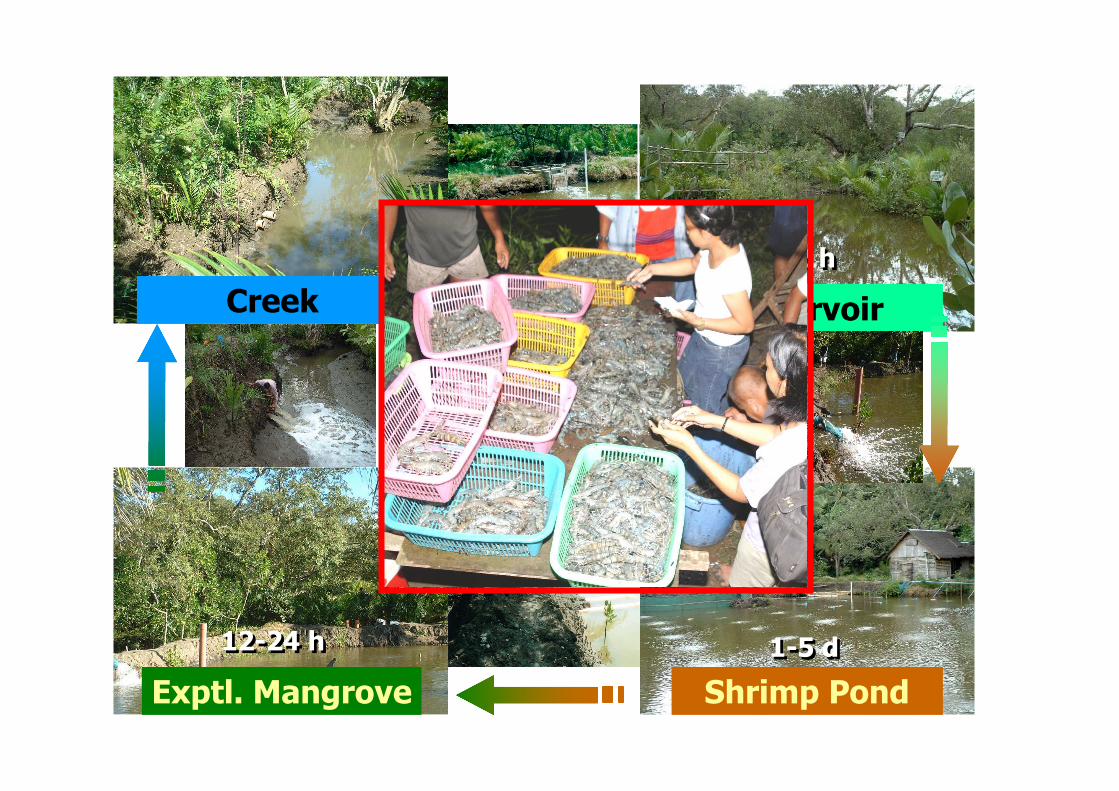
Creek
Exptl. Mangrove
12-24 h12-24 h
Shrimp Pond
1-5 d1-5 d
Reservoir
12 h12 h

Night cycle
Day cycle
Nutrients in effluents drained into natural mangrove stand

Rate × water vol. NH3-N: mg/L/d Vol (L)(see Table 2; Rep 1 0.080 × 70,400 = 5,632.0001 d = 6 h) Rep 2 0.237 × 35,200 = 8,330.667
Mean 0.158 6,981.333 mg NH3-N/d
NO3-N: mg/L/d Vol (L)Rep 1 0.733 × 70,400 = 51,626.667Rep 2 0.233 × 35,200 = 8213.333
Mean 0.483 29,920.333 mg NO3- N/d
Total N removal 6981.333 mg NH3-N/d + 29920.000 mg NO3-N/d 36,901.333 mg tot. N/d
36901.333 mg tot. N/d÷ 320 m2 Impounded Mangrove
115.317 mg tot. N/m2 mng/d
N removal from (SP) effluents drained into Impounded Mangrove

35% pond N loss thru water ex (Briggs & F.S./94)
115.3 mg N/m2 mng/d
0.35 N loss
329 mg (0.329 g)
tot. pond N/m2 mng/d=
60 g (6%) N kg-1 feed(I. Borlongan, pers. com)
0.329 g tot. N/m2 mng/d
60 g N/kg feed
0.0055 kg feed/m2 mng/d=
=4% shrimp biomass feed rate
55 kg feed/ha mng/d
0.04 kg feed/kg shrimp/d1,375 kg shrimp/ha mng
ABW = 1,375 kg @ 20 g = 68,750 pcs/ha(harvest) @ 30 g = 45,833 pcs/ha
S.D. (m2) ha mng: per ha pond
10 1.45 – 2.1830 4.36 – 6.54
N removal from Shrimp Pond effluents by Mangrove
Rate × water vol. 0.158 NH3-N mg/L/d = 6,981 mg NH3-N/d(1 d = 6 h) 0.483 NO3-N mg/L/d = 29,920 mg NO3- N/dImpounded Mangrove (area) 36,902 mg tot. N/d ÷ 320 m2
= 115.3 mg tot. N/m2 mng/d
55 kg feed/ha mng/d
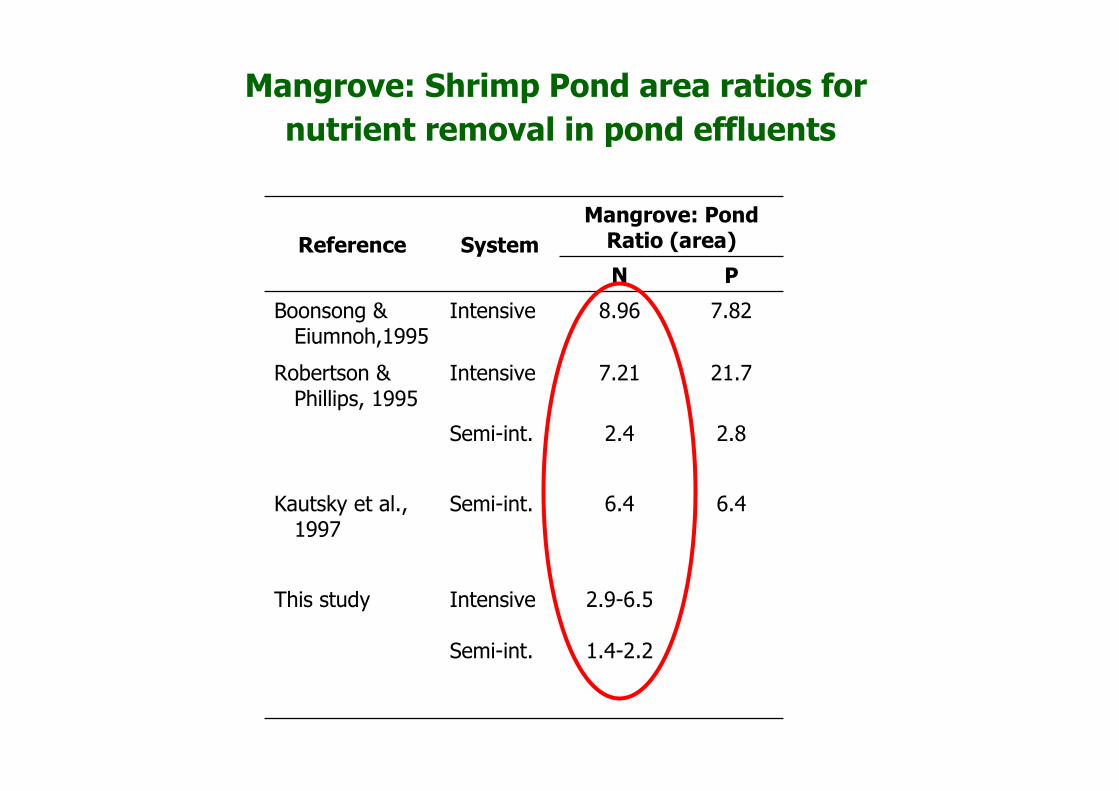
2.9-6.5
1.4-2.2
Intensive
Semi-int.
This study
6.46.4Semi-int.Kautsky et al.,1997
2.82.4Semi-int.
21.77.21IntensiveRobertson & Phillips, 1995
7.828.96IntensiveBoonsong & Eiumnoh,1995
PN
Mangrove: Pond Ratio (area)SystemReference
Mangrove: Shrimp Pond area ratios for
nutrient removal in pond effluents
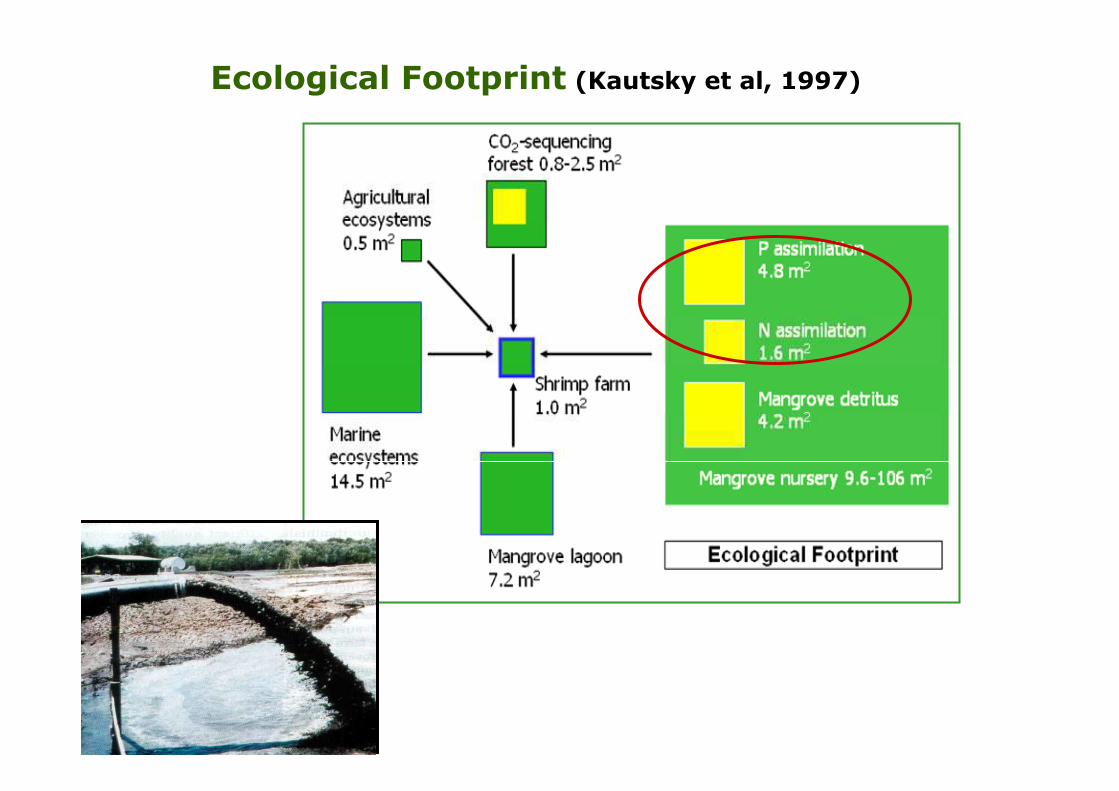
Ecological Footprint (Kautsky et al, 1997)

Summary & Conclusions
• passing pond effluents through mangroves reduced nutrient levels (in day but not night)
• reduced nutrients due to biol. transformation (plant uptake, denitrif.), rather than physical dilution (nighttime increases) or tidal flushing
• nutrient removal function of mangroves supports paradigm shift for aquaculture to clean up effluents before release
• mangrove: pond ratio for effluent processing: 2-9:1 for N, 2-22:1 for P
• implications for Philippines: compliance with national laws: greenbelt (20-, 50- and 100-m) and mangrove rehabili tation of abandoned ponds
• need to reverse present 0.5 ha mangrove: 1 ha pond ratio in the Philippines

Mudcrab Culture in Mangrove Pens Mudcrab Culture in Mangrove Pens
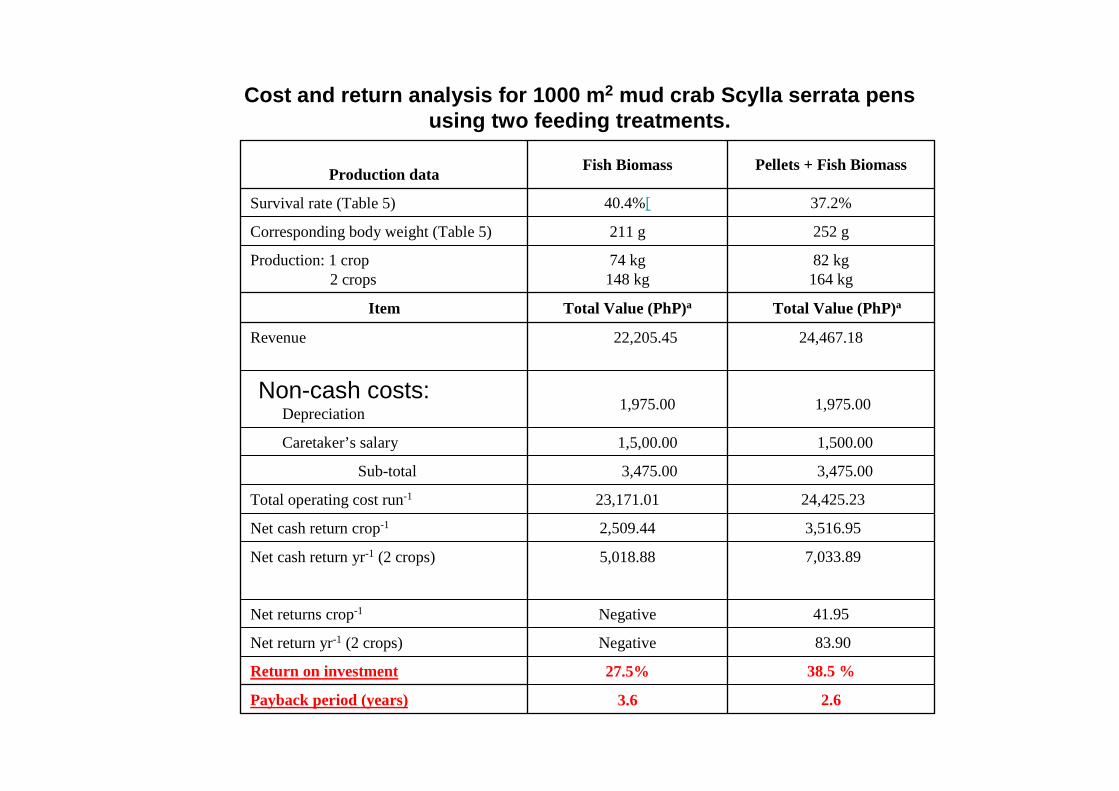
2.6 3.6Payback period (years)
38.5 %27.5%Return on investment
83.90NegativeNet return yr-1 (2 crops)
41.95 NegativeNet returns crop-1
7,033.89 5,018.88Net cash return yr-1 (2 crops)
3,516.952,509.44Net cash return crop-1
24,425.2323,171.01Total operating cost run-1
3,475.003,475.00Sub-total
1,500.001,5,00.00Caretaker’s salary
1,975.001,975.00Non-cash costs:
Depreciation
24,467.1822,205.45Revenue
Total Value (PhP)aTotal Value (PhP)aItem
82 kg 164 kg
74 kg148 kg
Production: 1 crop2 crops
252 g211 gCorresponding body weight (Table 5)
37.2%40.4%[Survival rate (Table 5)
Pellets + Fish BiomassFish BiomassProduction data
Cost and return analysis for 1000 m 2 mud crab Scylla serrata pens using two feeding treatments.

0.590.450.52Shannon Index of Sp. Diversity
13.513.98.057.07Total
7.88.26.455.96Trees
3.939.61.411.01Saplings
1.890.00.190.10Seedlings
Basal area(m2 per ha)
104,63370.315,9509,368Total
1,26737.11,6001,167Trees
12,53339.95,0033,216Saplings
90,83397.69,8504,984Seedlings
Stems/ha
Jan 2004% changeJan 2004May 2002
ControlPens
Impacts of crab pen culture on mangrove community struc ture in Zarraga, Aklan, central Philippines.

Conclusions
• Incomplete, low-cost pellets can replace fish requirement in mud crab diets• Economic analysis showed viability of crab culture in mangrove pens using fish biomass + pellets to reduce requirement for (low-value) fish, a food item of poor coastal communities• Presence of crabs results in fewer mangrove seedlings and saplings, but did not affect trees
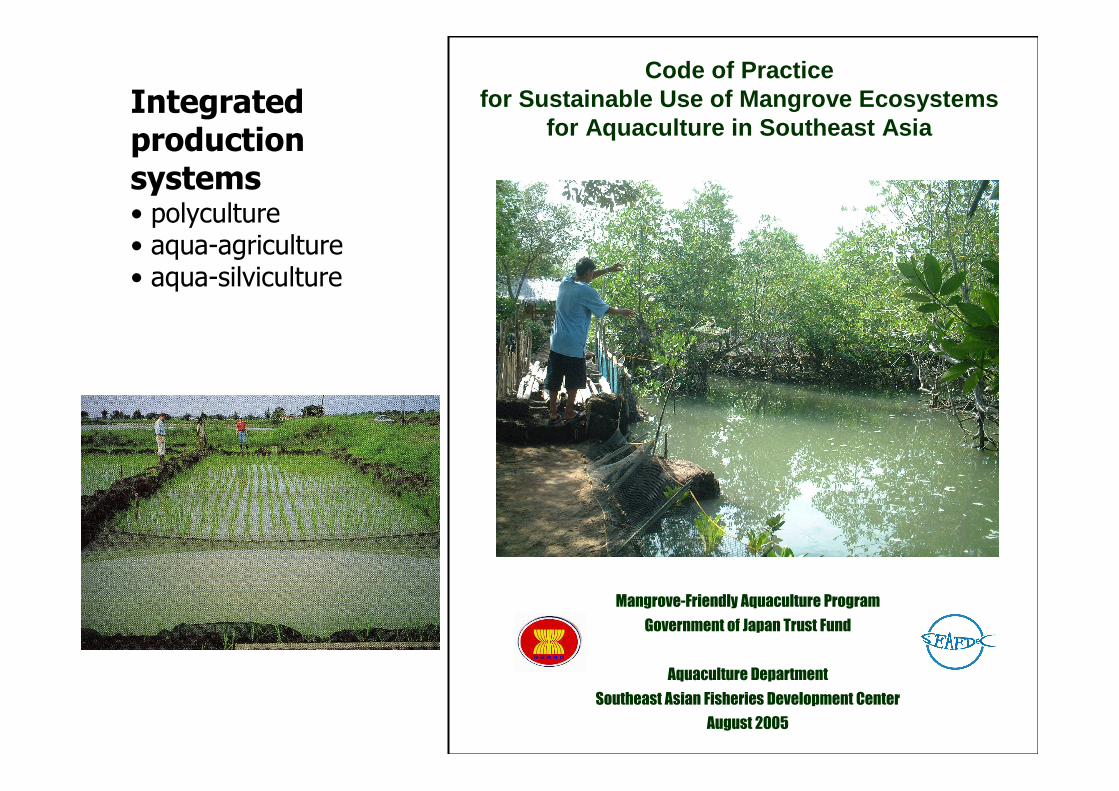
Code of Practicefor Sustainable Use of Mangrove Ecosystems
for Aquaculture in Southeast Asia
Mangrove-Friendly Aquaculture Program
Government of Japan Trust Fund
Aquaculture Department
Southeast Asian Fisheries Development Center
August 2005
Integrated productionsystems• polyculture• aqua-agriculture• aqua-silviculture

IFS – small-scale, labor intensive

Mangrove conservation in Iloiloand Aklan provinces thru --
• education• local governance
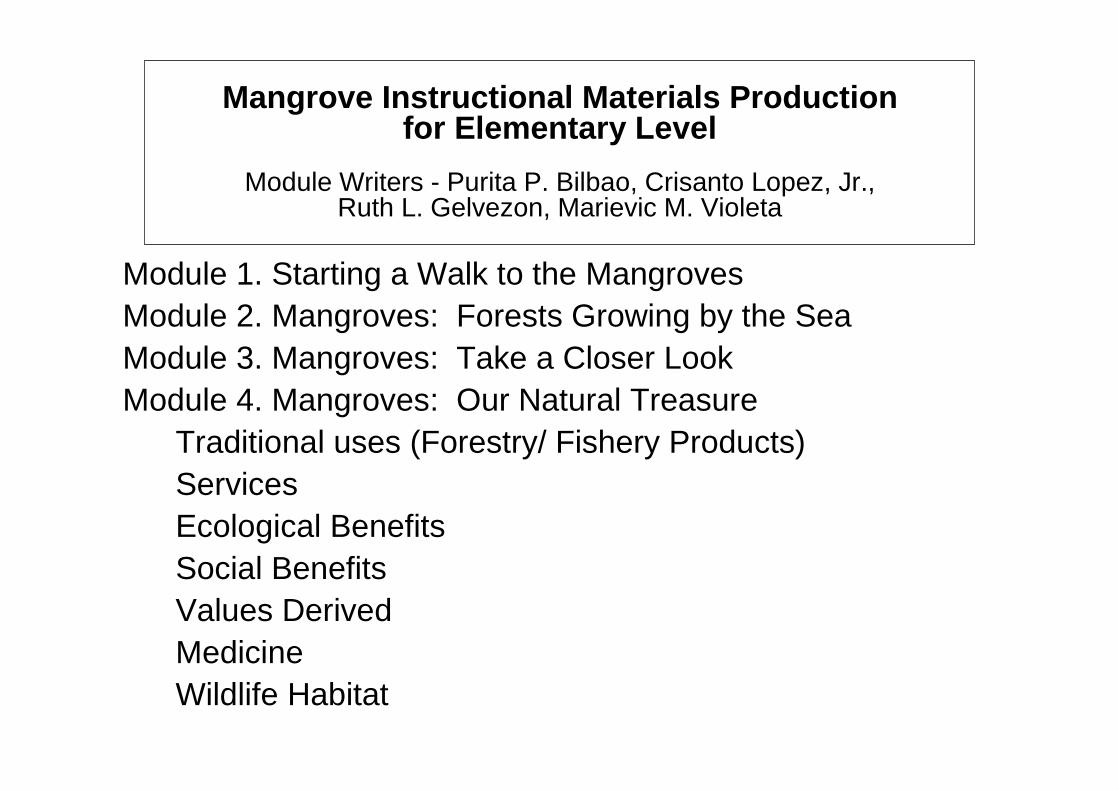
Mangrove Instructional Materials Productionfor Elementary Level
Module Writers - Purita P. Bilbao, Crisanto Lopez, Jr.,Ruth L. Gelvezon, Marievic M. Violeta
Module 1. Starting a Walk to the MangrovesModule 2. Mangroves: Forests Growing by the SeaModule 3. Mangroves: Take a Closer LookModule 4. Mangroves: Our Natural Treasure
Traditional uses (Forestry/ Fishery Products)ServicesEcological BenefitsSocial BenefitsValues DerivedMedicineWildlife Habitat