integration of increased renewable energy › portals › 1 › documents › energy ›...
TRANSCRIPT

1
Integration of Increased Renewable Energy
Barbara O’Neill
Grid Integration Manager
NREL
February 4, 2016
National Conference of State Legislatures Webinar

2
Evolution of Commercial Wind Technology
2
33
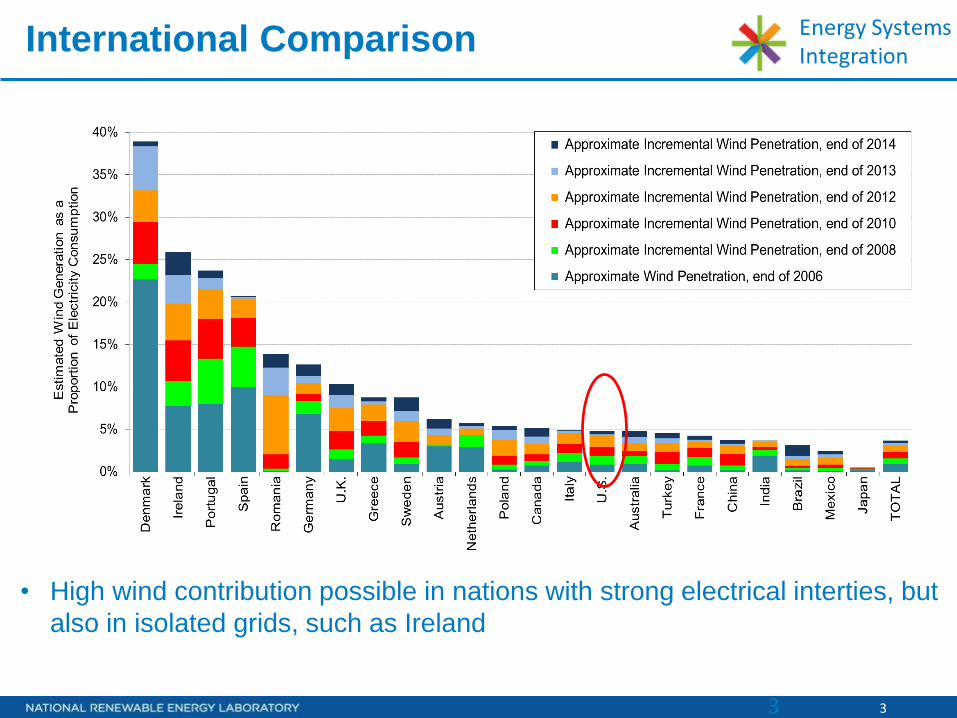
International Comparison
• High wind contribution possible in nations with strong electrical interties, but
also in isolated grids, such as Ireland
44
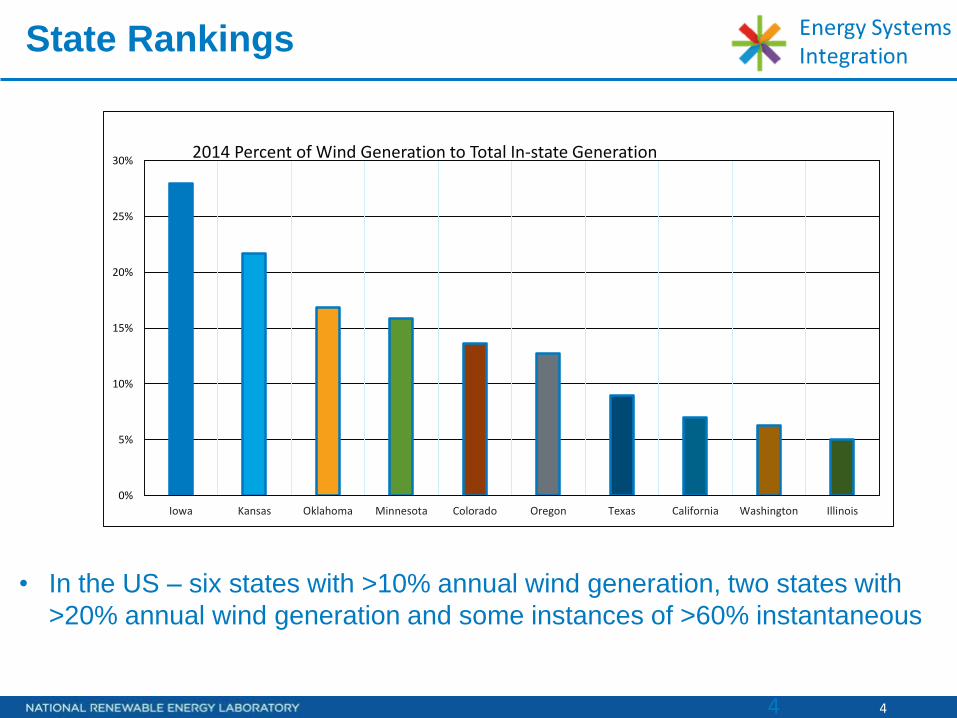
State Rankings
• In the US – six states with >10% annual wind generation, two states with
>20% annual wind generation and some instances of >60% instantaneous
0%
5%
10%
15%
20%
25%
30%2014 Percent of Wind Generation to Total In-state Generation
55
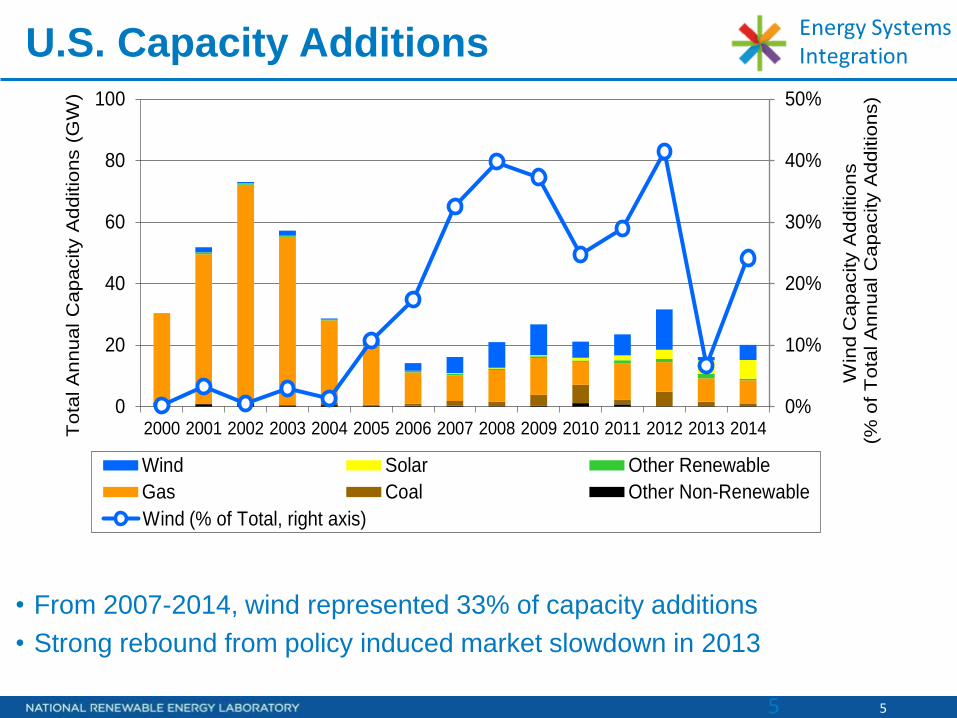
U.S. Capacity Additions
• From 2007-2014, wind represented 33% of capacity additions
• Strong rebound from policy induced market slowdown in 2013
0%
10%
20%
30%
40%
50%
0
20
40
60
80
100
2000 2001 2002 2003 2004 2005 2006 2007 2008 2009 2010 2011 2012 2013 2014Tota
l A
nnual C
apacity A
dditio
ns (
GW
)
Wind Solar Other Renewable
Gas Coal Other Non-Renewable
Win
d C
apacity A
dditio
ns
(% o
f T
ota
l A
nnual C
apacity A
dditio
ns)
Wind (% of Total, right axis)

6
Drivers for Expanded Wind Development
• Declining costs
• Long term price certainty
• Public support leading to:
• Federal (PTC and ITC) and state (RPS & PTC) policies
• Green power markets
• Expanded federal mandates
• Regional and local economic development
• Energy security and resilience
• Low environmental impact
• Reduced carbon risk
Photo Hawaiian Electric Light Company, NREL 14703
States with Renewable Portfolio Standards

7
Long term - Wind Prices are Hard to Beat:
7
• Even without the subsidies (PTC), wind still competes well against NG and
provides hedge against NG price volatility
0
10
20
30
40
50
60
70
80
90
1002
01
5
20
16
20
17
20
18
20
19
20
20
20
21
20
22
20
23
20
24
20
25
20
26
20
27
20
28
20
29
20
30
20
31
20
32
20
33
20
34
20
35
20
36
20
37
20
38
20
39
20
40
Range of AEO15 gas price projections AEO15 reference case gas price projection Wind 2012 PPA execution (985 MW, 14 contracts) Wind 2013 PPA execution (3,674 MW, 26 contracts) Wind 2014 PPA execution (1,768 MW, 13 contracts)
20
14
$/M
Wh
8
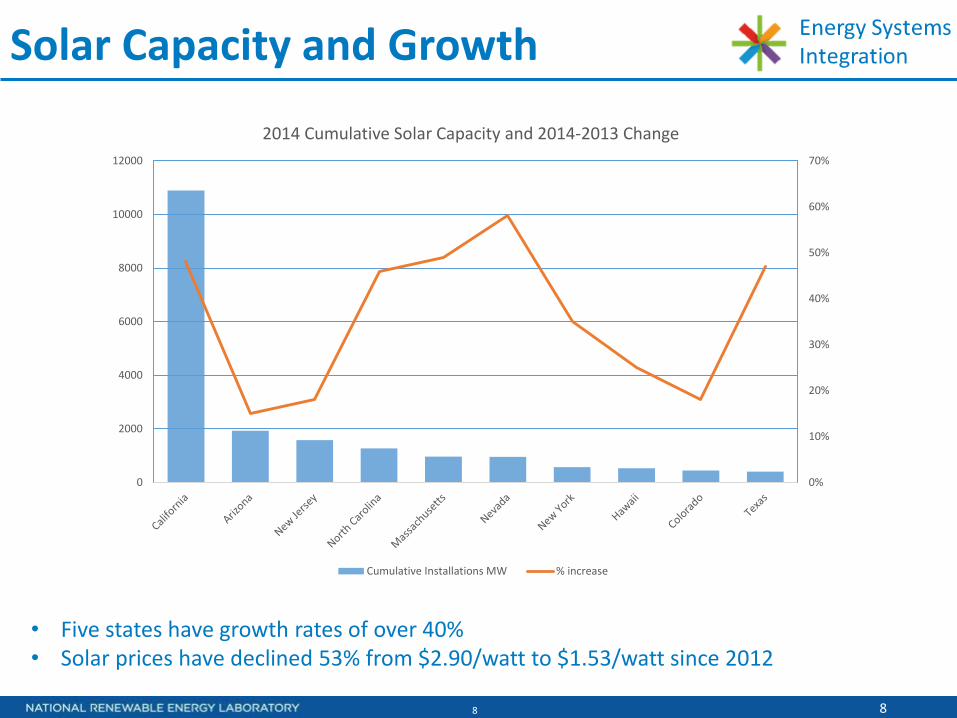
Solar Capacity and Growth
8
0%
10%
20%
30%
40%
50%
60%
70%
0
2000
4000
6000
8000
10000
12000
2014 Cumulative Solar Capacity and 2014-2013 Change
Cumulative Installations MW % increase
• Five states have growth rates of over 40%• Solar prices have declined 53% from $2.90/watt to $1.53/watt since 2012

9
Utility Scale PV System Cost Decline
9
10
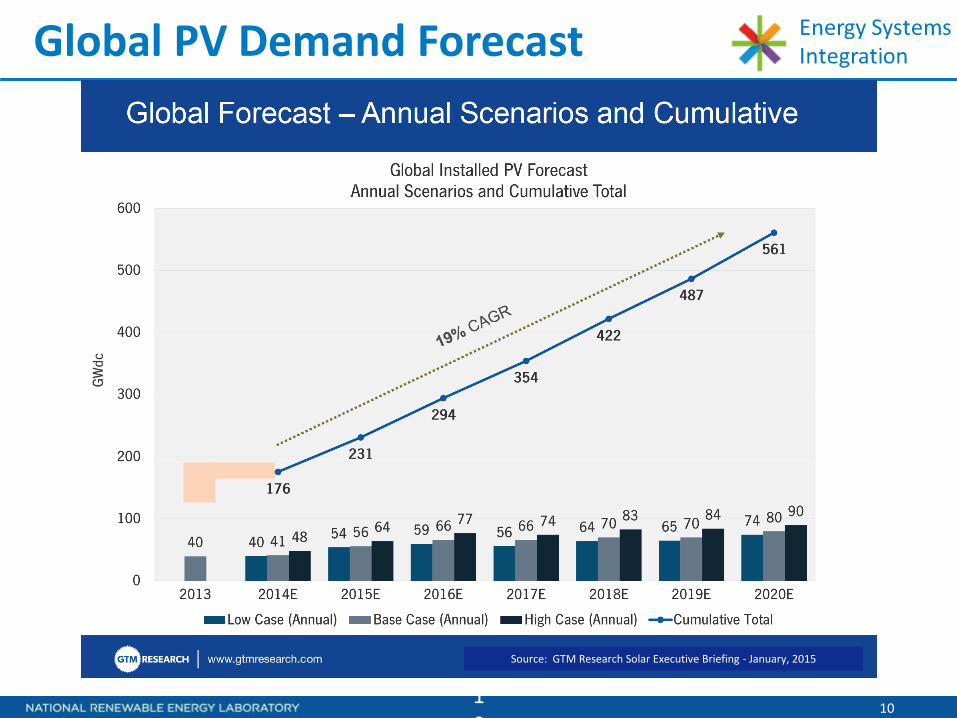
Global PV Demand Forecast
10
Source: GTM Research Solar Executive Briefing - January, 2015

11
Flexibility helps grid integration challenges
Flexibility: The ability of a power system to respond to change in demand and supply
• Increases in variable generation on a system increase the variability of the ‘net load,’ or the
demand that must be supplied by conventional generation if all renewable energy is used
• High flexibility implies the system can respond quickly to changes in net load.

12
Sources of Flexibility
Institutional:
• Fast markets
• Balancing area (BA) cooperation
• Transmission
• Rolling unit commitment
• Demand response
• Curtailment
Technological:
• Dispatchablegeneration fleet
• Renewables with active power control
• Forecasting
• Reserves
• New loads (e.g. PHEV)
• Storage
13
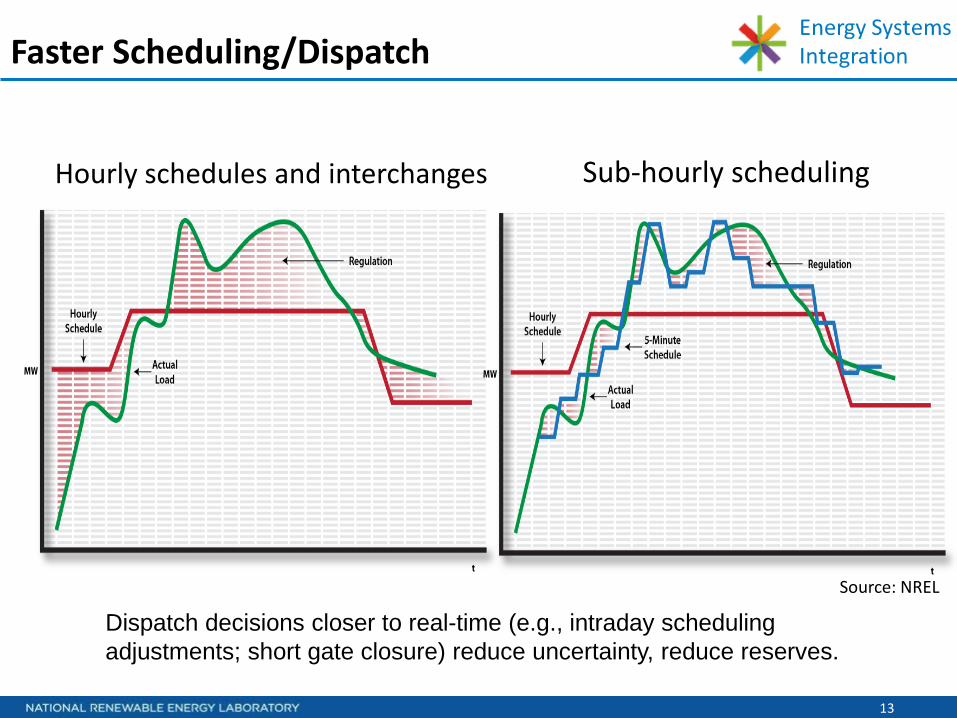
Faster Scheduling/Dispatch
Hourly schedules and interchanges
Dispatch decisions closer to real-time (e.g., intraday scheduling
adjustments; short gate closure) reduce uncertainty, reduce reserves.
Source: NREL
Sub-hourly scheduling

14
Broader balancing areas and geographic diversity can reduce variability and need for reserves
Source: NREL wind plant data(Approximately 8 hours)
1.6
1.4
1.2
1.0
0.8
0.6
Outp
ut
Norm
alized to M
ean
30x103
2520151050Seconds
1.6
1.4
1.2
1.0
0.8
0.6
1.6
1.4
1.2
1.0
0.8
0.6
15 Turbines Stdev = 1.21, Stdev/Mean = .184 200 Turbines Stdev = 14.89, Stdev/Mean = .126 215 Turbines Stdev = 15.63, Stdev/Mean = .125
Source: NREL Wind Plant Data
200 Turbines
15 Turbines
Approximately 8 hours
Expand Balancing Footprint

15
0% wind and solar
33% wind and solar energy penetration
Generation dispatch for challenging spring week in the U.S. portion of WECC
Source: WWSIS Phase 2 (2013)
Increase Thermal Plant Cycling Capability
Resource mix will evolve over time towards more flexibility.

16
Frequently Used Flexibility Options
Low capital cost options, but may require
significant changes to the institutional context

17
Questions?
We would love to partner with you. Let us know how we can help.
For more information please visit our website at
www.nrel.gov.
For more information, please visit our website at
www.nrel.gov