integration of differential sar interferometry and
TRANSCRIPT

EARSeL eProceedings 7, 1/2008 21
INTEGRATION OF DIFFERENTIAL SAR INTERFEROMETRY AND ANCILLARY GIS DATA FOR THE STUDY OF
SUPERFICIAL DEFORMATIONS
Angela Losurdo1, Savina Pacifico2, Valentina Sarli2, Antonio Colangelo1 and Maurizio Leggeri2
1. Geocart s.r.l., Potenza, Italy; {a.losurdo / a.colangelo}(at)geocart.net 2. Centro di Geomorfologia Integrata per l’area del Mediterraneo (CGIAM), Potenza, Italy;
savina.pacifico(at)basilicatanet.it, valentina.sarli(at)libero.it, m.leggeri(at)cgiam.it
ABSTRACT The aim of the present work is to study possible correlations between territorial and climatic data, and motion data obtained by Multitemporal Differential SAR Interferometry. In particular, these SAR data refer to movements occurring on selected points exhibiting coherent radar backscat-tering properties. They are targets that remain changeless between acquisitions, for example man-made structures as buildings and natural reflectors as rocks. The study area includes some coun-ties of Potenza province in the Basilicata region (Italy). In order to ensure an adequate distribution of good coherent points, the analysis was restricted to urban centres. This approach is also justi-fied by the fact that landslides affecting the urban centres have the highest socio-economic impact.
Motion data were analysed statistically and overlaid on orthophotos and different themes in GIS. Some of them represent intrinsic factors of the instability of sides: hydrologic risk map, lithologic map, Digital Elevation Model (DEM), slopes and aspect maps derived from the DEM. Others rep-resent factors inducing a landslide: rainfall, thermal data and seismic events. This integration within GIS allows us to interpret information of displacements and to individualise correlations with above themes.
Many results were obtained about motion data relations with slope and rainfall data, not as many with temperature data. The study has also noted the influence of lithology. However, further on-site inspections and historical studies are required in order to interpret the significance of Point Target motion data correctly. This analysis type can be useful for large-scale monitoring and identification of those areas where local authorities must concentrate on future detailed studies and risk mitiga-tion actions.
INTRODUCTION Differential SAR Interferometry has growing usage in research centres and universities to obtain surface deformation maps with millimetric accuracy.
Ancillary data (Digital Terrain Model (DTM), digital orthophotos, etc.) within Geographical Informa-tion System (GIS) represent an important tool for the interpretation of satellite data. Moreover, the integration of the data coming from DInSAR within GIS is helpful for the research of greater risk zones or zones that have to be the subject of detailed analyses in a context of limited economic resources. This technique has proven to be useful in the context of monitoring and land planning purposes (1,2,3,4). Apposite procedures were implemented to obtain motion data of Point Targets (PT) from SAR data adopting the DInSAR technique. Differential phases, atmospheric errors, geo-coded PT displacements, velocities were calculated (5). Moreover, an output file records the coor-dinates, annual velocity, coherence, and the temporal displacement series of each PT.
The SAR data cover two areas of the province of Potenza in Basilicata (Southern Italy). This region includes several areas affected by slope instability problems. In order to ensure an adequate dis-tribution of good coherent points, the analysis was restricted to urban centres. This approach is also justified by the fact that landslides affecting the urban centres have the highest socio-economic impact. However, the analysis of PT displacement data on urbanised hill slopes is more

EARSeL eProceedings 7, 1/2008 22
difficult because their movements may arise from a variety of natural or anthropogenic processes and thus may reflect complex deformation mechanisms (6).
The aim of the present study is to validate and interpret the displacements obtained by Differential SAR Interferometry PT (1,3,7,8). It analyses data statistically and it studies possible correlations between PT displacements and lithologic, morphologic, climatic (rainfall and temperature) data. An important tool for this aim is the overlay of geocoded PTs on aerial-photos and on the different themes in GIS.
METHODS Area of study The study area is located in the south-west of Basilicata (Southern Italy); it includes urban centres of the Val d’Agri (11 sites) and the Pollino Area (16 sites). PT displacement and velocity data were obtained by processing SAR images.
ITALY
Figure 1: Val d’Agri (11 sites) and the Pollino Area.
Some urban centres are not visible by SAR satellite and show PT data with low coherence be-cause they are affected by problems of geometric decorrelation.
From the 29 sites, two (Figure 2) were chosen as prototypes of different kinds of deformation be-haviour and environmental data: Castelluccio Inferiore (Δv ≈ 3.00 cm/year) and Lauria (Δv ≈ 3.38 cm/year), where Δv is the difference between minimum and maximum velocity recorded in each area. The sites are in an area with historical phenomena of slope hydro-geologic instability and seismic risk that involves numerous inhabited centres and infrastructural systems (9).
For these sites lithologic, morphologic, and climatic (thermic, pluviometric) data for the 1992- 2004 period (SAR acquisition period) are available. Regarding the lithology, Lauria (630 m above sea level) is characterised by three prevailing ground types: clayey-sandy debris partially cemented, monogenic or polygenic cemented conglomerates irregularly stratified and a heterogeneous com-plex with mainly clayey materials and lithoid intercalation (marble limestone, breccias). Castelluc-cio Inferiore (495 m a.s.l.) is characterised by monogenic or polygenic cemented conglomerates and breccias, irregularly stratified or chaotically accumulated, cemented debris layer, alluvial fan.
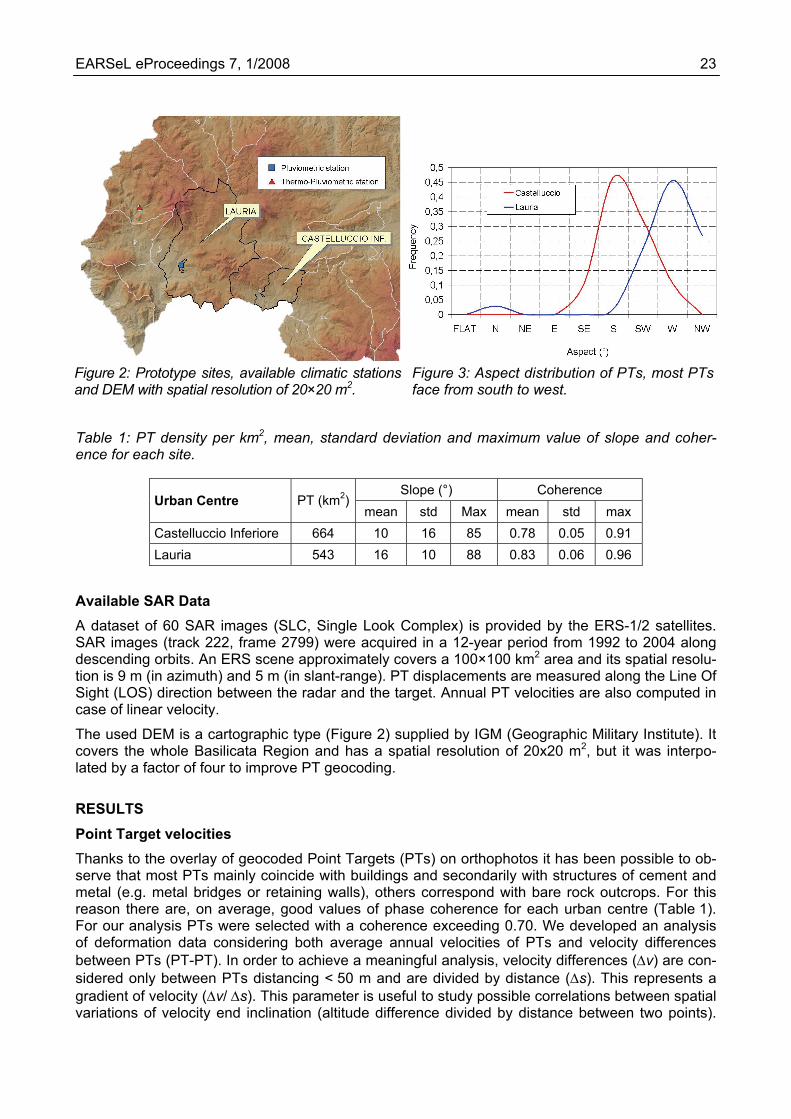
Table 1 shows slope and PT coherence values and Figure 3 shows that the aspect ranges from south-east to west (3) for each area.
EARSeL eProceedings 7, 1/2008 23
Figure 2: Prototype sites, available climatic stations and DEM with spatial resolution of 20×20 m2.
Figure 3: Aspect distribution of PTs, most PTs face from south to west.
Table 1: PT density per km2, mean, standard deviation and maximum value of slope and coher-ence for each site.
Slope (°) Coherence Urban Centre PT (km2)
mean std Max mean std max Castelluccio Inferiore 664 10 16 85 0.78 0.05 0.91 Lauria 543 16 10 88 0.83 0.06 0.96
Available SAR Data A dataset of 60 SAR images (SLC, Single Look Complex) is provided by the ERS-1/2 satellites. SAR images (track 222, frame 2799) were acquired in a 12-year period from 1992 to 2004 along descending orbits. An ERS scene approximately covers a 100×100 km2 area and its spatial resolu-tion is 9 m (in azimuth) and 5 m (in slant-range). PT displacements are measured along the Line Of Sight (LOS) direction between the radar and the target. Annual PT velocities are also computed in case of linear velocity.
The used DEM is a cartographic type (Figure 2) supplied by IGM (Geographic Military Institute). It covers the whole Basilicata Region and has a spatial resolution of 20x20 m2, but it was interpo-lated by a factor of four to improve PT geocoding.
RESULTS Point Target velocities Thanks to the overlay of geocoded Point Targets (PTs) on orthophotos it has been possible to ob-serve that most PTs mainly coincide with buildings and secondarily with structures of cement and metal (e.g. metal bridges or retaining walls), others correspond with bare rock outcrops. For this reason there are, on average, good values of phase coherence for each urban centre (Table 1). For our analysis PTs were selected with a coherence exceeding 0.70. We developed an analysis of deformation data considering both average annual velocities of PTs and velocity differences between PTs (PT-PT). In order to achieve a meaningful analysis, velocity differences (Δv) are con-sidered only between PTs distancing < 50 m and are divided by distance (Δs). This represents a gradient of velocity (Δv/ Δs). This parameter is useful to study possible correlations between spatial variations of velocity end inclination (altitude difference divided by distance between two points).

EARSeL eProceedings 7, 1/2008 24
Moreover, when studying the building stability, it is more important to analyse absolute displace-ments than relative ones.
The use of geocoded PTs together with DEM and orthophotos made it possible to analyse possible correlations between movements and inclinations, and to address subsequent surveys in the light of displacement, and velocity and velocity difference data of PT.
[dv/ds] / m(dv/ds)< 11 - 22 - 3> 3
Figure 4: Geocoded velocity gradients, Δv/Δs, divided by mean value of velocity gradients, m(dv/ds). Only more meaningful gradients are shown. Castelluccio Inferiore.
##
#########
###
##
##
####
##
##
#
#####
###
###
####
#########
####
####
#
##
###
#
#########
#
#####
#####
############
#######
####
#######
##
########
###
#####
#
##
####
#####
#
######
##########
######
###
#
####
#####
####
#
##
#
#####
####
#######
###
### ##
#
#
##
#
####
# #####
#
#
#
###########
##
#
##
###
###
##
#
#######
#
###
#
#
#
#
#
###
#
#
#
#
#
#
#
#
#
#
#
#
#
###
##
#
#
##
#
#
#
#
#
#
#
##
#
#
#
####
#
###
#
#
#
#
####
#
#
####
#
#
####
##
#
####
#
##
#
#
#####
#
#
#
#
#
#
#
#
#
#
#
#
###
#
##
#
######
##
#
#
#
####
##
#
# #
##
#
# #
#
##
#
##
#
#
###
###
#
#
#
#
#
#
#
#
####
##
#
#
##
#
#
#
##
#
####
#
#
##
#
###
#
#
#
#
#
#
#
#
#
#
###########
###
#
#
#
#
##
#
#
#
#
#
####
#####
#
##
#
#
#
#
##
#
#
##
#
#
##
#
#
##
#
#
###
#
##
#
#
#
####
#
#
#
#
#
#
##
#
#
##
#
####
#
#
##
##
# ## #
#
#
#
#
#
#
#
#
#
#
#
#
#
#
##
##
###
####
#
#
#
##
#####
#
#
#
#
###
#
##
#
#
#
####
#
#
#
##
##
##
##
#
#
#
####
#S#S
#S#S#S#S#S#S#S#S#S
#S#S#S
#S#S
#S#S
#S#S#S#S
#S#S
#S#S
#S
#S#S#S#S#S
#S#S#S
#S#S#S
#S#S#S#S
#S#S#S#S#S#S#S#S#S
#S#S#S#S
#S#S#S#S
#S
#S#S
#S#S#S
#S
#S#S#S#S#S#S#S#S#S
#S
#S#S#S#S#S
#S#S#S#S#S
#S#S#S#S#S#S#S#S#S#S#S#S
#S#S#S#S#S
#S#S
#S#S#S#S
#S#S#S#S#S#S#S
#S#S
#S#S#S#S#S#S#S#S
#S#S#S
#S#S
#S#S#S#S
#S#S
#S#S#S#S
#S#S#S#S#S
#S
#S#S#S#S#S#S
#S#S#S#S#S#S#S#S#S#S
#S#S#S#S#S#S
#S#S#S
#S
#S#S#S#S
#S#S#S
#S#S
#S#S#S#S
#S
#S#S
#S
#S#S#S#S#S
#S#S#S#S
#S#S#S#S#S#S#S
#S#S#S
#S#S#S #S#S
#S
#S
#S#S
#S
#S#S#S#S
#S #S#S#S#S#S#S
#S
#S
#S#S#S#S#S#S#S#S#S#S#S
#S#S
#S
#S#S
#S#S#S
#S#S#S
#S#S
#S
#S#S#S#S
#S#S#S
#S
#S#S#S
#S
#S
#S
#S
#S
#S#S#S
#S
#S
#S
#S
#S
#S
#S
#S
#S
#S
#S
#S
#S
#S#S#S
#S#S
#S
#S
#S#S
#S
#S
#S
#S
#S
#S
#S
#S#S
#S
#S
#S
#S#S#S#S
#S
#S#S#S
#S
#S
#S
#S
#S#S#S#S
#S
#S
#S#S#S#S
#S
#S
#S#S#S#S
#S#S
#S
#S#S#S#S
#S
#S#S
#S
#S
#S#S#S#S#S
#S
#S
#S
#S
#S
#S
#S
#S
#S
#S
#S
#S
#S#S#S
#S
#S#S
#S
#S#S#S#S#S#S
#S#S
#S
#S
#S
#S#S#S#S
#S#S
#S
#S #S
#S#S
#S
#S #S
#S
#S#S
#S
#S#S
#S
#S
#S#S#S
#S#S#S
#S
#S
#S
#S
#S
#S
#S
#S
#S#S#S#S
#S#S
#S
#S
#S#S
#S
#S
#S
#S#S
#S
#S#S#S#S
#S
#S
#S#S
#S
#S#S#S
#S
#S
#S
#S
#S
#S
#S
#S
#S
#S
#S#S#S#S
#S#S#S#S
#S#S#S
#S#S#S
#S
#S
#S
#S
#S#S
#S
#S
#S
#S
#S
#S#S#S#S
#S#S#S#S#S
#S
#S#S
#S
#S
#S
#S
#S#S
#S
#S
#S#S
#S
#S
#S#S
#S
#S
#S#S
#S
#S
#S#S#S
#S
#S#S
#S
#S
#S
#S#S#S#S
#S
#S
#S
#S
#S
#S
#S#S
#S
#S
#S#S
#S
#S#S#S#S
#S
#S
#S#S
#S#S
#S #S#S #S
#S
#S
#S
#S
#S
#S
#S
#S
#S
#S
#S
#S
#S
#S
#S#S
#S#S
#S#S#S
#S#S#S#S
#S
#S
#S
#S#S
#S#S#S#S#S
#S
#S
#S
#S
#S#S#S
#S
#S#S
#S
#S
#S
#S#S#S#S
#S
#S
#S
#S#S
#S#S
#S#S
#S#S
#S
#S
#S
#S#S#S#S
v [mm/y]< -10-10 - - 3-3 - 3
> 10
(X
(X
(X(X -3 - 3(X 3 - 10(X
re 6: Two damaged buildings: (a) on a site with seismic amplification phenomena, (b) in a zone
n in zones where there are not
amples are shown in Figure 7.
(mm/y)(Δv/Δs)
Figure 5: Geocoded Point Targets (PTs) overlaid on orthophoto. Castelluccio Inferiore.
Most PTs show absolute average annual velocities not exceeding 3 mm/year, but the analysis of PT-PT data made it possible to identify the zones where damaged buildings and deformed side-walks are, as site surveys have proved (Figure 6).
(a)
Figu
(b)
with hydro-geologic instability near a stream. Castelluccio Inferiore.
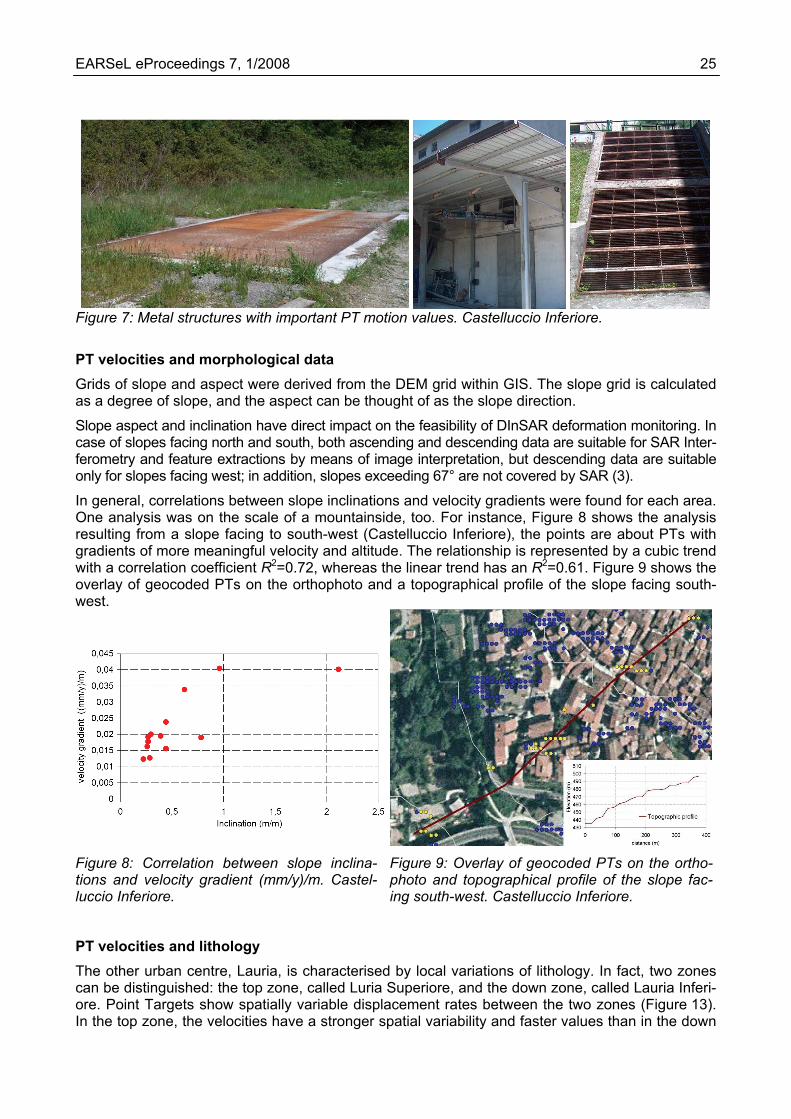
Moreover, the PT-PT displacement data sometimes exceed the meaany evident damages, but historical analyses elucidate that these buildings were damaged by the 1998 earthquake because of seismic amplification phenomena and they were restructured re-cently. However, in some cases, important values of velocity gradients are not due to phenomena of ground surface deformations, but rather they are groups of PTs falling on metal structures; ex-
EARSeL eProceedings 7, 1/2008 25
tion values. Castelluccio Inferiore.
rids of slope and aspect were derived from the DEM grid within GIS. The slope grid is calculated be thought of as the slope direction.
uitable for SAR Inter-
analysis
Figure 7: Metal structures with important PT mo
PT velocities and morphological data Gas a degree of slope, and the aspect can
Slope aspect and inclination have direct impact on the feasibility of DInSAR deformation monitoring. In case of slopes facing north and south, both ascending and descending data are sferometry and feature extractions by means of image interpretation, but descending data are suitable only for slopes facing west; in addition, slopes exceeding 67° are not covered by SAR (3).
In general, correlations between slope inclinations and velocity gradients were found for each area. One analysis was on the scale of a mountainside, too. For instance, Figure 8 shows the resulting from a slope facing to south-west (Castelluccio Inferiore), the points are about PTs with gradients of more meaningful velocity and altitude. The relationship is represented by a cubic trend with a correlation coefficient R2=0.72, whereas the linear trend has an R2=0.61. Figure 9 shows the overlay of geocoded PTs on the orthophoto and a topographical profile of the slope facing south-west.
Figure 8: Correlation between slope inclina-tions and velocity gradient (mm/y)/m. Castel-
Figure 9: Overlay of geocoded PTs on the ortho-photo and topographical profile of the slope fac-
d lithology he other urban centre, Lauria, is characterised by local variations of lithology. In fact, two zones
zone, called Luria Superiore, and the down zone, called Lauria Inferi-
luccio Inferiore.
PT velocities an
ing south-west. Castelluccio Inferiore.
Tcan be distinguished: the top ore. Point Targets show spatially variable displacement rates between the two zones (Figure 13). In the top zone, the velocities have a stronger spatial variability and faster values than in the down

EARSeL eProceedings 7, 1/2008 26
zone where the low velocities also have a uniform distribution. The differences in movement rates could be linked to local morphologic, lithologic, and hydro-geologic variations. In fact, Lauria Supe-riore is mainly characterised by clayey-sandy debris partially cemented whereas slow flows and slides prevail; Lauria Inferiore is characterised by lithoid formation of monogenic and polygenic cemented conglomerates irregularly stratified whereas rock falls and lateral spreads prevail.
Comparing the PT spatial distribution and the landslide map, it would be good to consider the lack of PTs, in the zone subject to rapid flow (in the rectangle of Figure 10 and 11) and in the strong relief zone (the ellipse) covered by vegetation and subject to rock falls (low coherence of SAR data).
rock fallslideslow flow lateral spread
Figure 10: Landslides map of Lauria (Basin Au-thority of Basilicata).
Figure 11: Orthophoto with the overlaid distribu-tion of geocoded PTs (Lauria).
ate data f possible correlations between the climatic characteristics and
t imperative to find correlations between precipitations and motion
eding the acquisition date and between subsequent scanning (SC
equent scanning days from acquisition. It also emerged that the tempo-
le and
T velocities and climPNow, we focus on the analysis odisplacements. Generally, it is nodata accumulated between different periods of scanning exceeding one day. For this reason, dis-placement data related to tandem acquisitions (one day among subsequent acquisitions) were separated from other data (35 and multiple days). In this way, two different populations of dis-placement data were analysed.
Rainfall data were elaborated to obtain average, maximum, and standard deviation and cumulate per 1, 7, 30, 35 and 90 days precdays). The correlations were studied between each of the two displacement data types and each of precipitation data types.
Proportionalities are found between tandem displacements and mean values of precipitations pre-ceding 30, 35, 90, and subsral trend of average displacements is consistent with one of average rainfalls per 30, 35, 90 days and between subsequent scanning. Figure 13 shows an example for Castelluccio Inferiore.
It is obvious from Figure 13 that increases of displacement coincide with increases of rainfall and, in the same way, decreases and peaks where displacement and rainfall data are availabcontinuous.

EARSeL eProceedings 7, 1/2008 27
PT Ev=1.1786 (mm/y)
Tandem Displacement (mm)
Rai
nfal
l mea
n pe
r 30
days
(m
m)
Figure 12: An example of direct proportionality found between tandem displacements vs average values of precipitations per 30 days.
Figure 13: The graph shows displacement time series of the PTs (mm/days), points, vs average rainfall between (mm/days) subsequent scanning, bars. Castelluccio Inferiore.
PT Ev=3.661 (mm/y)
Δs (mm/y)
Figure 14: An example of a relation found between tandem displacement and temperature range for a Point Target with average velocity of about 3.7 mm/year, probably located on a metal structure.

EARSeL eProceedings 7, 1/2008 28
Concerning thermic excursions, a thermo-pluviometric station is located in a county near Lauria. In general, any adequate correlations did not emerge between temperatures and deformations. It is probably due to the strong influence of target types, the temperature plays a preponderant role on the lithologic systems and metal structures, but most PTs are buildings. However, correlations are only observed for some PTs, probably corresponding to rock and metal structures as it seems from orthophotos, but it is necessary to verify this on site.
CONCLUSIONS In the present paper the relations were studied between motion data of Point Targets (PT) coming from the Multitemporal SAR Interferometry Differential Technique (DiffSAR) and additional data such as topographic and climatic data in order to validate and interpret the PT motion data. Addi-tionally, geocoded PT were overlayed on orthophotos to find out if PTs mainly coincide with build-ings and metal structures.
The following results were obtained about relation displacement data and environmental data:
- the average deformation trends agree with the temporal series of average and cumulate rainfalls;
- there is a proportionality between slope inclinations and PT velocity gradients along the longitudinal profile of a slope facing south west;
- the distribution of PT velocities varies spatially with lithology, in particular, in a clay-rich a-rea PT velocities have a stronger spatial variability and faster values than those located in a zone characterised by lithoid formation.
However, local knowledge of the investigated area and on-site inspections are required in order to interpret the significance of PT motion data correctly and to identify the main cause of the de-tected deformations. The overlay of geocoded PTs with the orthophotos is useful to address the site investigations in the light of displacement and velocity data. This method has also made it possible to identify the buildings suffering from damages produced by hydro-geologic instability problems or seismic events. Moreover, the interpretation of the PT motion data has to be linked to historical analyses because human interventions can mask on-site surveys.
REFERENCES 1 Ferretti A, D Perissin, C Prati & F Rocca, 2005. On the physical nature of SAR Permanent
Scatterers. Proceedings of the 2005 URSI Commission F Symposium on Microwave Remote Sensing of the Earth, Oceans, Ice, and Atmosphere, Ispra (Italy), 20–21 April 2005. http://ursi-f-2005.jrc.it/proceedings.htm (last date accessed: 19.03.2008)
2 Werner C, U Wegmüller, T Strozzi & A Wiesmann, 2003. Interferometric Point Target Analysis for Deformation Mapping. IGARSS’03, Toulouse, France, 21-25 July 2003
3 Colesanti C & J Wasowski 2006. Investigating landslides with space-borne Synthetic Aperture Radar (SAR) interferometry. Engineering Geology, 88: 173–199
4 Franceschetti G & R Lanari, 1999. Synthetic Aperture Radar Processing (CRC Press, New York)
5 Marzo C & A Losurdo, 2005. Applicazione delle tecniche interferometriche differenziali SAR per il monitoraggio degli spostamenti di fabbricati nella località di Maratea. ASITA, 2: 453-459
6 Wasowski J, F Bovenga, D Casarano, R Nutricato & A Refice, 2006. Application of PSI techni-ques to landslide investigations in the Caramanico area (Italy): Lessons learnt. Proceedings of the Fringe 2005 Workshop (Frascati, Italy, 28 Nov - 2 Dec 2005), edited by Lacoste H & L Ouwehand. ESA SP-610. (European Space Agency, Frascati, Italy) http://earth.esa.int/fringe2005/proceedings/papers/707_wasowski.pdf (last date accessed: 18.03.2008)

EARSeL eProceedings 7, 1/2008 29
7 Ferretti A, C Prati & F Rocca, 2000. Permanent scatters in SAR interferometry. IEEE Transac-
tions on Geoscience and Remote Sensing, 39: 8-20
8 Colesanti C, A Ferretti, F Ferrucci, C Prati & F Rocca, 2000. Monitoring known seismic faults using the Permanent Scatterers (PS) technique. International Geoscience and Remote Sens-ing Symposium (Honolulu, Hawaii, 24-28 July 2000) 5: 2221-2223
9 Guerricchio A, G Melidoro & V Rizzo, 1986. Slope Instability and Earthquakes in the valley of Maratea (Basilicata Region, Italy), International Symposium on Engineering Geology Problems in Seismic Areas. Geologia Applicata e Idrogeologia, XXI (IV). Reprint, 2005: Giornale di Ge-ologia Applicata, 2: 58–64