integration of art2 neural network and genetic k-means algorithm
TRANSCRIPT

www.elsevier.com/locate/dsw
Decision Support Systems 40 (2005) 355–374
Integration of ART2 neural network and genetic K-means
algorithm for analyzing Web browsing paths
in electronic commerce
R.J. Kuo*, J.L. Liao, C. Tu
Department of Industrial Engineering and Management, National Taipei University of Technology, No. 1, Section 3,
Chung-Hsiao East Road, Taipei 106, Taiwan, ROC
Received 15 May 2003; received in revised form 5 February 2004; accepted 14 April 2004
Available online 2 June 2004
Abstract
Neural networks and genetic algorithms are useful for clustering analysis in data mining. Artificial neural networks (ANNs)
and genetic algorithms (GAs) have been applied in many areas with very promising results. Thus, this study uses adaptive
resonance theory 2 (ART2) neural network to determine an initial solution, and then applies genetic K-means algorithm (GKA)
to find the final solution for analyzing Web browsing paths in electronic commerce (EC). The proposed method is compared
with ART2 followed by K-means.
In order to verify the proposed method, data from a Monte Carlo Simulation are used. The simulation results show that the
ART2+GKA is significantly better than the ART2+K-means, both for mean within cluster variations and misclassification
rate. A real-world problem, a recommendation agent system for a Web PDA company, is investigated. In this system, the
browsing paths are used for clustering in order to analyze the browsing preferences of customers. These results also show that,
based on the mean within-cluster variations, ART2 +GKA is much more effective.
D 2004 Elsevier B.V. All rights reserved.
Keywords: Clustering analysis; Data mining; ART2; Genetic K-means algorithm; Recommendation agent system
1. Introduction 2000, and it has increased dramatically. This results in
Electronic commerce (EC) has developed rapidly
in recent years. Because entering the Internet is not
difficult and creating customer interaction is easy on
the Internet, how to create long-term customer rela-
tionships is a critical factor for successful EC. The
Institute for Information Industry (III) showed that
there were over six million Internet users by the end of
0167-9236/$ - see front matter D 2004 Elsevier B.V. All rights reserved.
doi:10.1016/j.dss.2004.04.010
* Corresponding author. Fax: +886-2-27712171x4541.
E-mail address: [email protected] (R.J. Kuo).
more requirements for the analysis of network loading
and more complexity of Web site design.
To help users in browsing Web contents is an
important factor for designing a Web site. Thus,
browsing behavior becomes an important index of
effectiveness of a site. By analyzing the frequency of
Web page clicks and by understanding the regular
browsing paths, the structure of Web site can be
improved and more popular Web pages can be
provided to the customers, thereby increasing EC
sales.

R.J. Kuo et al. / Decision Support Systems 40 (2005) 355–374356
Therefore, this research proposes a novel clustering
analysis technique for data mining. It is employed to
analyze the browsing paths and behaviors of EC
customers in order to improve the development of
Web sites and customer satisfaction. Clustering anal-
ysis is a common tool in multivariate analysis and has
been applied widely in many areas. The purpose of
clustering analysis is to determine the objects in the
same cluster with similar characteristics. Furthermore,
it determines when there is a significant difference
between two different clusters. The applications of
clustering analysis include social science, genetics,
biology, business and education.
In addition to statistical methods, artificial neural
networks (ANNs) have also been widely applied in
such areas. The unsupervised neural network, which is
able to cluster objects by learning from training
samples, is especially useful. Genetic algorithms
(GAs) also have this capability. Kuo et al. [11] have
reported that very good solutions can be provided by
using self-organizing feature maps (SOM) of neural
networks to determine the number of clusters and the
starting points, and then employing the K-means
method to find the final solution. They also showed
that K-means can be replaced by GA in order to get
better results [11]. [10] Thus, this current study
proposes using a modified two-stage clustering meth-
od, adaptive resonance theory 2 (ART2) neural net-
work [3,4], followed by genetic K-means algorithm
(GKA). The results are compared with those from
ART2 followed by K-means.
In order to evaluate the performance of the two
clustering analysis methods, both simulation and real-
world data are employed. Both of sets of results
indicate that the proposed method is better than
ART2 followed by K-means. Then, the proposed
method is applied to create a recommendation agent
system for a PDA Web company, which can dramat-
ically increase customer satisfaction.
The remainder of this paper is organized as
follows. Section 2 introduces some necessary back-
ground, including applications of neural networks
and genetic algorithms for clustering analysis. The
proposed method is presented in Section 3, and
Section 4 illustrates the simulation results. Section
5 shows the model evaluation results for a PDA Web
company, and concluding remarks are made in
Section 6.
2. Background
This section introduces some general background
of data mining. In addition, applications of neural
networks and genetic algorithms for clustering are
also presented.
2.1. Data mining
Data mining is a popular research topic in EC,
primarily used to extract usable information from
huge data sets to more quickly make effective
decisions. As one aspect of Knowledge Discovery
in Databases (KDD) [20], it is able to find relevant
patterns from huge data sets and to analyze usable
information to aid in making choices. The concept of
data mining is not simply regression analysis or a
database management system (DBMS). To be a form
of regression analysis, it should have a basic hy-
pothesis and be able to process huge data set,
whereas DBMS cannot analyze data to obtain more
advanced information. Only data mining techniques,
which combine statistics, data warehouse and ma-
chine learning, can act as a valuable tool for com-
mercial purposes. Previously proposed methods for
data mining can be categorized as follows: (1)
association rules, (2) decision tree, (3) cluster anal-
ysis, (4) induction method, (5) statistic, (6) online
analysis process or OLAP, (7) neural networks and
(8) genetic algorithms [14]. This study will focus on
third part, cluster analysis. Thus, applications of
ANNs and genetic algorithms are summarized in
the following two subsections. This study intends
to realize the relationship between customer’s brows-
ing paths and preferences.
2.2. The application of ANNs in clustering analysis
An artificial neural network (ANN) is a system
which has been derived through models of neurophys-
iology. In general, it consists of a collection of simple
nonlinear computing elements whose inputs and out-
puts are linked to form the network.
The learning algorithms of ANNs can be divided
either: supervised and unsupervised [5]. In super-
vised learning, the network has its output compared
with a known answer and receives feedback about
any errors. This is sometimes called learning with a

R.J. Kuo et al. / Decision Support Systems 40 (2005) 355–374 357
teacher; the teacher tells the network what the correct
answer is. For a supervised ANN, both inputs and
outputs are necessary for training the network, so an
unsupervised ANN requires only the inputs. This
kind of network must itself discover patterns, fea-
tures and correlations in the input data, and code for
them in the output. The units and connections must
thus display some degree of self-organization. The
most widely applied unsupervised learning scheme is
Kohonen’s feature maps [8] and adaptive resonance
theory [3,4].
A number of studies have successfully demonstrat-
ed the learning capability of ANNs and their applica-
tions for engineering, with very promising results.
Proctor [21] indicated that ANN is an alternative
expert system for the solution of marketing decision
problems.
Venugopal and Bates [26] presented possible appli-
cations of self-organization feature maps with the
marketing segmentation. Balakrishnan et al. [1] com-
pared self-organizing feature maps with the K-means
method. The result reveals that the K-means method
has a higher rate of classification through the Monte
Carlo algorithm [16,17]. Balakrishnan et al. [2]
employed the frequency-sensitive competitive learn-
ing algorithm (FSCL) and the K-means method to
cluster simulated data and real-world problem data,
also presenting the combination of these two methods.
Although neither the simulated nor the real-world
problem data can determine which individual method
is better, the combination of these two methods seems
to provide better managerial explanation for the brand
choice data. A modified two-stage method, which first
uses the self-organizing feature maps to determine the
number of clusters and the starting midpoint and
employs the K-means method to find the final solu-
tion, was proposed by Kuo et al. [11] for market
segmentation. The simulation results showed that the
modified two-stage method is slightly more accurate
than the conventional two-stage method (Ward’s min-
imum variance method followed by the K-means
method) with respect to the rate of misclassification.
However, it is sometimes quite difficult to determine
the number of clusters by observing the map, unless
the topology maps clearly discriminate. However,
another unsupervised ANN, Adaptive Resonance
Theory (ART) neural network, does not have this
disadvantage, so it can determine the actual number
of clusters [19,25] without any further visual exami-
nation. It can also solve the problem of the difficulty
of determining the number of clusters, like SOM
neural network. Thus, the main advantages of ART2
are:
1. rapidly learning and adapting to a nonstable
environment,
2. stability and plasticity,
3. unsupervised learning of preferences behavior that
the target does not know initially, and
4. deciding the number of clusters exactly and
automatically.
Adaptive resonance theory networks include ART1,
which is applicable for binary data; and ART2 [3],
which is used to deal with continuous data [4].
2.3. Applications of genetic algorithms in clustering
analysis
Genetic algorithms (GAs), first developed by Hol-
land [6], include several important phases like encod-
ing and decoding, initial population, fitness function,
reproduction, crossover and mutation. Genetic algo-
rithms, which randomize search and simultaneously
generate multiple solutions, provide better solutions
than do general randomized search algorithms. Scott
[22] applied genetic algorithms to propose a stable
and efficient search technique, and subsequent results
showed that it had a higher probability of finding the
global optimum [24,27].
To date, there have already been some investigations
on applying GA in clustering analysis. Selim and
Ismail [23] proved that a conventional statistics meth-
od, like K-means algorithm, can easily find a local
minimum, although it is necessary to develop a more
robust method for clustering analysis. In Maulik and
Bandyopadhyay’s [15] experiments, the GA-clustering
algorithm is superior to the K-means algorithm.Murthy
and Chowdhury [18] proposed a GA-based method to
solve the clustering problem and experiments on syn-
thetic and real life data sets to evaluate the performance.
The results showed that the GA-based method may
improve the final output of K-means. Krishna and
Murty [9] proposed a novel approach called Genetic
K-means Algorithm (GKA) for clustering analysis,
which defines a biased mutation operator specific to

Fig. 1. The process for evaluating two methods.
Fig. 2. The architecture of ART2. Source: Ref. [4].
R.J. Kuo et al. / Decision Support Systems 40 (2005) 355–374358
clustering called distance-based mutation. Using finite
Markov chain theory, they proved that the GKA can
converge to the global optimum, and in the simulations
that GKA converged to the best-known optimum
corresponding to the given data, concurring with the
convergence result. Moreover, GKA searches faster
than some of the other evolutionary algorithms used for
clustering.
Kuo et al. [11] proposed a two-stage method which
integrated both the SOM and K-means, with results
indicating that the proposed method was much better
than using only SOM or K-means. Then, they mod-
ified the GKA by Krishna and Murty and used SOM’s
solution as the initial solution for the modified GKA
[12]. The results showed that this method was better
than the previously published method, SOM+K-
means. Kuo and Chung [10] also presented a method
integrating of ART2 and genetic algorithm, which
applied a different coding method.
3. Methodology
In this research, two clustering methods are pro-
posed. In order to evaluate the efficiency of the two
clustering methods, the Monte Carlo framework
[16,17] is employed.
The data sets generated from the Monte Carlo
method are used for evaluating the following methods:
1. A modified two-stage method uses the ART2 to
determine the number of clusters and the initial
points, and then employs the K-means algo-
rithm to find the final solution. For a detailed
discussion, refer to Kuo et al. [11]. This
method referred to as ART2 +K-means in this
study.
2. A novel two-stage method first uses the ART2 to
determine the number of clusters, and then
employs modified Genetic K-means Algorithm
(GKA) to find the final solution. It is referred to
as ART2 +GKA.
In the following subsections, the related clustering
methods and the Monte Carlo method are discussed in
detail. Fig. 1 shows the process for evaluating these
two methods.

pport Systems 40 (2005) 355–374 359
3.1. ART2 neural network
ART2 architectures are designed for processing
analog as well as binary input patterns.
3.1.1. ART2 network architecture
Fig. 2 illustrates the architecture of the ART2 neural
network, including F1 and F2 layers. There are six
nodes in the F1 layer (W, X,U, V, P,Q). The input signal
is processed by the F1 layer and then is passed from the
bottom to top value (biJ). The result of the bottom to top
value is an input signal of F2 layer. The nodes of F2
layer compete with each other to produce a winning
unit. The winning unit returns the signal to the F1 layer.
The match value is then calculated with top to bottom
value (tJi) in the F1 layer and compared with the
vigilance value. If the match value is greater than the
vigilance value, then the weight of biJ and tJi is updated.
Otherwise, the reset signal is sent to the F2 layer and the
winning units inhibited. After inhibition, the other
winning unit will be found in the F2 layer. If all of
the F2 layer nodes are inhibited, the F2 layer will
produce a new node and generate the initial
corresponding weights to the new node.
3.1.2. The learning of the ART2 network
F1 layer activation [13]:
ui ¼vi
eþ NVNð1Þ
wi ¼ si þ aui ð2Þ
pi ¼ ui þ dtJi ð3Þ
xi ¼wi
eþ NWNð4Þ
qi ¼pi
eþ NPNð5Þ
vi ¼ f ðxiÞ þ bf ðqiÞ: ð6Þ
where f ðxÞ ¼x if xz0
8<.
R.J. Kuo et al. / Decision Su
0 if x < 0:
Step 1: Initialize the parameters (a, b, c, d, e, aand q) and weights. In general,
a = b = 10, c= 0.1 and d= 0.9 to satisfy
the equation:
cd
1� dV1 ð7Þ
where e = 0; a is the learning rate; q is
the vigilance with 0.7 < q < 1; weight
initializations are t0i= 0 and bi0 ¼ 1ð1�dÞ
ffiffin
p ,
in which n is the attribution of the training
example.
Step 2: For each training example, do 3 steps 4 steps
5 steps 6 steps 7 steps 8 steps 9 steps 10
steps 11 steps 12.
Fig. 3. The flow chart of ART2+GKA.
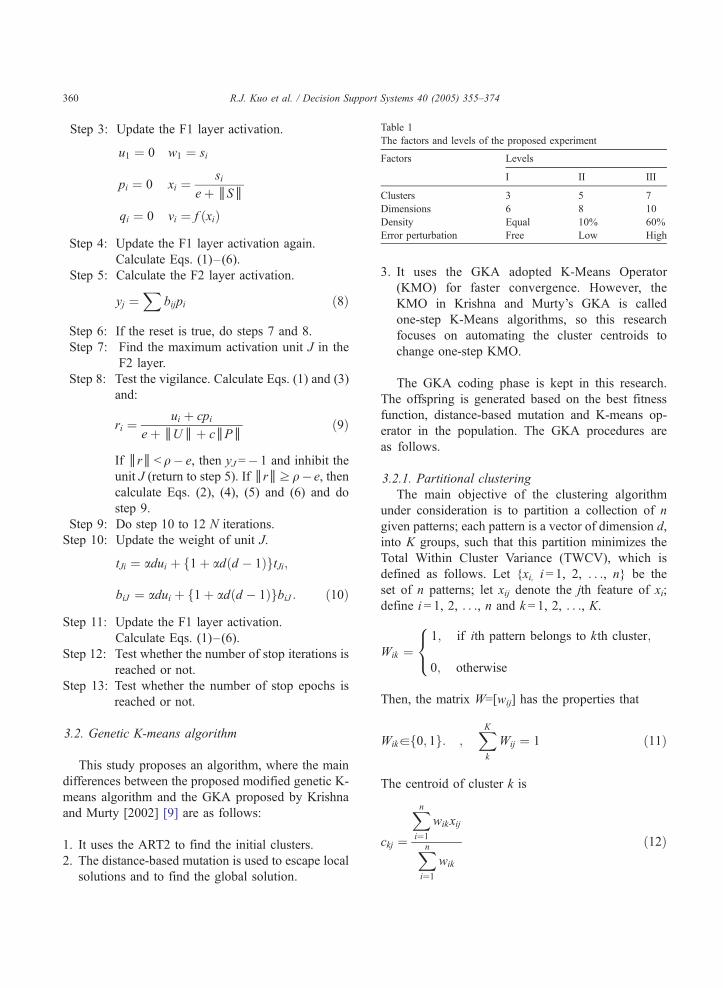
Table 1
The factors and levels of the proposed experiment
Factors Levels
I II III
Clusters 3 5 7
Dimensions 6 8 10
Density Equal 10% 60%
R.J. Kuo et al. / Decision Support Systems 40 (2005) 355–374360
Step 3: Update the F1 layer activation.
u1 ¼ 0 w1 ¼ si
pi ¼ 0 xi ¼si
eþ NSN
qi ¼ 0 vi ¼ f ðxiÞ
Error perturbation Free Low HighStep 4: Update the F1 layer activation again.
Calculate Eqs. (1)–(6).
Step 5: Calculate the F2 layer activation.
yj ¼X
bijpi ð8Þ
Step 6: If the reset is true, do steps 7 and 8.
Step 7: Find the maximum activation unit J in the
F2 layer.
Step 8: Test the vigilance. Calculate Eqs. (1) and (3)
and:
ri ¼ui þ cpi
eþ NUNþ cNPNð9Þ
If NrN< q� e, then yJ =� 1 and inhibit the
unit J (return to step 5). If NrNz q� e, then
calculate Eqs. (2), (4), (5) and (6) and do
step 9.
Step 9: Do step 10 to 12 N iterations.
Step 10: Update the weight of unit J.
tJi ¼ adui þ f1þ adðd � 1ÞgtJi;
biJ ¼ adui þ f1þ adðd � 1ÞgbiJ : ð10Þ
Step 11: Update the F1 layer activation.
Calculate Eqs. (1)–(6).
Step 12: Test whether the number of stop iterations is
reached or not.
Step 13: Test whether the number of stop epochs is
reached or not.
3.2. Genetic K-means algorithm
This study proposes an algorithm, where the main
differences between the proposed modified genetic K-
means algorithm and the GKA proposed by Krishna
and Murty [2002] [9] are as follows:
1. It uses the ART2 to find the initial clusters.
2. The distance-based mutation is used to escape local
solutions and to find the global solution.
3. It uses the GKA adopted K-Means Operator
(KMO) for faster convergence. However, the
KMO in Krishna and Murty’s GKA is called
one-step K-Means algorithms, so this research
focuses on automating the cluster centroids to
change one-step KMO.
The GKA coding phase is kept in this research.
The offspring is generated based on the best fitness
function, distance-based mutation and K-means op-
erator in the population. The GKA procedures are
as follows.
3.2.1. Partitional clustering
The main objective of the clustering algorithm
under consideration is to partition a collection of n
given patterns; each pattern is a vector of dimension d,
into K groups, such that this partition minimizes the
Total Within Cluster Variance (TWCV), which is
defined as follows. Let {xi, i= 1, 2, . . ., n} be the
set of n patterns; let xij denote the jth feature of xi;
define i = 1, 2, . . ., n and k = 1, 2, . . ., K.
Wik ¼1; if ith pattern belongs to kth cluster;
0; otherwise
8<:
Then, the matrix W=[wij] has the properties that
Wikaf0; 1g: ;XKk
Wij ¼ 1 ð11Þ
The centroid of cluster k is
ckj ¼
Xni¼1
wikxij
Xni¼1
wik
ð12Þ

Fig. 4. The 3D figure and corresponding learning curve for each cluster.
Fig. 5. Evolutional process of GKA.
R.J. Kuo et al. / Decision Support Systems 40 (2005) 355–374 361

Table 3
The average of misclassifications under different factor (%)
Factor Level ART2+K-means ART2 +GKA
Cluster number 3 0.0744 0.0593
5 0.0253 0.0033
7 0.0235 0.0036
Dimension 6 0.0460 0.0285
8 0.0389 0.0175
10 0.0383 0.0202
Density level 0.1 0.0493 0.0186
0.5 0.0417 0.0256
0.6 0.0322 0.0219
Error level Free 0.0083 0.0024
Low 0.0215 0.0113
High 0.0933 0.0525
R.J. Kuo et al. / Decision Support Systems 40 (2005) 355–374362
The within-cluster variation of kth cluster is defined as
S kð Þ Wð Þ ¼Xni¼1
wik
Xdj¼1
xij � ckj� �2 ð13Þ
and the TWCV is defined as
SðW Þ ¼XKk¼1
SðkÞðW Þ ¼XKk¼1
Xni¼1
wik
Xdj¼1
xij � ckj� �2
ð14ÞThe objective is to minimize S(W), i.e.,
SðW*Þ ¼ minW
fSðW Þg ð15Þ
3.2.2. Coding system [7]
Anatural way of coding suchW into a string, sw, is to
consider a chromosome of length n and to allow each
allele in the chromosome to take value from {1, 2, . . .,K}. In this case, each allele corresponds to a pattern and
its value represents the cluster number to which the
corresponding pattern belongs.
3.2.3. Initialize population
The initial population is selected randomly. Each
allele in the population can be initialized to a
Table 2
The results of multivariate analysis of variance of two methods
Factors ART2 +
K-means
ART2 +
GKA
Cluster number 0.000* 0.000*
Dimension 0.736 0.478
Density level 0.297 0.159
Error level 0.000* 0.000*
Cluster number dimension 0.249 0.721
Cluster number density level 0.017* 0.984
Cluster number error level 0.002* 0.000*
Dimension density level 0.302 0.141
Dimension error level 0.945 0.907
Density level error level 0.219 0.886
Cluster number dimensiondensity level
0.290 0.136
Cluster number dimensionerror level
0.995 0.995
Cluster number density levelerror level
0.446 0.998
Dimension density levelerror level
0.733 0.701
Cluster number dimensiondensity level error level
0.839 0.802
*Significant at the 0.05 level.
cluster number randomly selected from the uniform
distribution over set {1, 2, . . ., K}. This is avoided
by assigning p, the greatest integer which is less
than n/K, randomly chosen data points to each
cluster and the rest of points to randomly chosen
clusters.
3.2.4. Fitness function selection
The selection operator randomly selects a chromo-
some from the previous population according to the
distribution given by
PðsiÞ ¼FðsiÞ
XNi¼1
FðsiÞð16Þ
where F(si) represents the fitness value of the string siin the population, as defined in the next paragraph.
This kind of random selection applies to the roulette
wheel; however, the string sw’s fitness function value
is based on TWCV. The smaller the S(W), the larger
the f(sw). Furthermore, f̄ and r represent the current
population f(sw)’s average and standard error, respec-
tively. In addition, c is a value in [1,3]. f(sw) and F(sw)
are defined as:
f ðswÞ ¼ �SðW Þ; gðswÞ ¼ f ðswÞ � ðf̄ � crÞð17Þ
FðswÞ ¼ fgðswÞg; if gðswÞz0 ð18Þ

Fig. 6. The architecture of the proposed recommendation agent system.
R.J. Kuo et al. / Decision Support Systems 40 (2005) 355–374 363
3.2.5. Mutation
Mutation changes an allele value depending on
the distances of the cluster centroids from the
corresponding data point. To apply the mutation
Table 4
The hyperlink structure of the PDA Web site
Financial information Personal data
1 Real-time news 4 Personal
2 Stock reminder 5 Friends
3 Currency rate 6 Hyperlink
7 Notes
8 Reminder
9 Mail manager
10 Sending-mail recorder
operator to the allele sw(i) corresponding to
pattern Xi, let dj = d(Xi,Cj) be the Euclidean
distance between Xi and Cj (defined as average
of jth dimension). Then, the allele is replaced
Life related information Sending message
11 Fate 18 Send mail
12 Weather 19 Short Message
13 Traffic 20 ICQ
14 Foodstuffs 21 Leave message
15 Emergency
16 Video
17 News

Fig. 7. The learning curve with respect to the total distance for ART2.
R.J. Kuo et al. / Decision Support Systems 40 (2005) 355–374364
with a value chosen randomly from the following
distribution:
pj ¼ PrfswðiÞ ¼ jg ¼ cmdmax � dj
XKi¼1
ðcmdmax � diÞð19Þ
where cmz 1 and dmax =maxj{dj}.
3.2.6. K-means operator
3.2.6.1. Initialization. Use random choice for the
example i (i= 1, 2. . ., m) and cluster j ( j= 1, 2. . ., c),set j = 1 and k = 1. (Mj
0: example assigned to the jth
cluster, I j0: index of the example assigned the jth
cluster )
3.2.6.2. Algorithms.
Step 1: Calculate the centroid of cluster j.
z kj ¼ 1
Mk�1j
XiaIk�1
j
xi; if Mk�1j > 0
8<: ð20Þ
if j = c, then go to step 2, else j= j + 1 and go
to step 1.
Table 5
Step 2: Calculate the distance between each example
and centroid.
J k1 ¼Xc
j¼1
XiaIk�1
j
Nxi � zkjN2 ð21Þ
The within cluster variations of ART2 +K-means and ART2 +GKA
Mean within cluster variance
K-means 1141.7
ART2 851.2
ART2 +K-means 647.8
SOM+K-means 650.1
ART2 +GKA 592.95
SOM+GKA 592.95
Step 3: Calculate the new assignment, example i
assigned to the j* cluster (i.e., wij*= 1,
wij = 0, j= 1, . . ., c; j p j*)
Nxi� zkj*N
2VNxi � zkjN2; j ¼ 1; . . . ; c; j p j*
ð22Þ
If the equal sign is true, then break. If i<m,
then redo step 3 and let i = i + 1; else all
examples are assigned the jth cluster and all
indices of examples are assigned to the jth
cluster, go to step 4.
Step 4: Calculate the distance between examples and
centroid.
J k2 ¼Xc
j¼1
XiaIk�1
j
Nxi � zkjN2 ð23Þ
Step 5: If AJ1k� J2
kA < e, then stop, else j = j+ 1 and
k = k+ 1 go to step 1.
3.3. Integration of ART2 and GKA
Genetic K-means algorithm can find the global
optimum, but the initial clusters must be known
initially. In this research, the unsupervised neural
network ART2 is proposed for deciding the initial
cluster for GKA. The flow chart for this is shown in
Fig. 3.
3.4. Monte Carlo study
In order to evaluate the efficiency of the clustering
methods, the within variance and misclassification
rate are calculated for the Monte Carlo simulation

R.J. Kuo et al. / Decision Support Systems 40 (2005) 355–374 365
data. There are several factors which can affect the
quality of the solution:
1. the number of clusters,
2. the number of dimensions,
3. density: the different degree of scatter of the data
point, and
4. error perturbation to simulate the error of data
collection or measurement.
The factors and levels of this experiment are shown
in Table 1, and the result is a 3 3 3 3 full factorial
design with three replications. Totally, there are 243
data sets and each set contains 120 data points.
3.5. Hypothesis testing
The number of misclassifications of two cluster-
ing methods is compared with respect to sensitivity
and robustness of the two clustering methods. A
misclassification is indicated that supposes D point
belonging to the second cluster generated by the
simulation algorithm, but D point is clustered to the
first cluster by ART2 +K-means. A misclassification
is recorded to ART2 + K-means. There are five
hypotheses for evaluating the performance of two
clustering methods.
Hypothesis 1. The number of misclassification does
not differ across the levels of clusters.
Hypothesis 2. The number of misclassifications does
not differ across the levels of dimensions.
Fig. 8. The learning curves of ART2
Hypothesis 3. The number of misclassifications does
not differ across the levels of density.
Hypothesis 4. The number of misclassifications does
not differ across the levels of error perturbation.
Hypothesis 5. The number of misclassifications does
not differ across the two clustering methods.
4. Simulation
4.1. Verification of random number generator
The simulation data sets were implemented (de-
scribed in Section 3.1) in order to verify the effi-
ciency of the two clustering tools. The random
number generator must correspond to normal and
uniform distribution. Firstly, 1000 data points were
generated via the random number generator, which
grouped them into 20 segments. The chi-square test
showed that these data fit the normal and uniform
distribution.
The testing results show that the random
numbers generated by the generator fit a normal
and uniform distribution. Thus, it is reasonable to
accept the reliability of the random number
generator.
4.2. Simulation data sets generation
The three phases of writing the simulation program
are as follows. Each phase generates 81 data sets and
+K-means and ART2 +GKA.

Fig. 9. The results of ART2 +GKA and SOM+GKA. (a) The three dimensions space data of ART2 +GKA. (b) The topological space of
SOM+GKA.
R.J. Kuo et al. / Decision Support Systems 40 (2005) 355–374366

Table 6
The frequency statistics table of ART2+GKA
Cluster number 1 2 3 4 5 6
Frequency 263 303 375 366 359 209
Sex Male (%) 45 37 51 33 34 47
Female (%) 55 63 49 67 66 53
Age Under 20 (%) 40 45 55 50 11 7
21–30 (%) 45 40 40 44 44 45
31–40 (%) 18 15 5 6 45 47
Occupation Student (%) 69 63 66 69 17 20
Business (%) 9 10 13 11 43 45
Labor (%) 12 9 6 7 12 8
Officer (%) 10 18 15 13 22 27
Education Under senior
high school (%)
7 8 7 6 9 5
College or
university (%)
78 81 83 77 75 70
Over graduate
school (%)
15 11 10 17 16 35
Table 7
Browsing path categories for each cluster
Cluster Path categories
1 Personal Data, Sending Message
2 Life-related information, Sending Message
3 Personal Data, Life-related information, Sending Message
4 Personal Data, Life-related information
5 Financial Information, Life-related information
6 Financial Information, Personal Data, Sending Message
R.J. Kuo et al. / Decision Support
replicates three times. The total number of data sets is
243.
Phase 1: Generate the error-free data sets.
Phase 2: Generate the low-error data sets.
Phase 3: Generate the high-error data sets.
4.3. Experimental results and analysis
4.3.1. Results of ART2
The values of parameters in Section 3.2.2 and the
total distance (TD) used to evaluate the convergence
of ART2 can be shown as:
TD ¼ dð1� dÞXPi¼1
XMj¼1
ui
1� d� tji
h ið24Þ
where d is defined in Eq. (7), P is the number of
training patterns, M is the number of output units and
tji is the top to down weights of the activation unit for
every training pattern. If TD decreases gradually, it is
said that ART2 can converge well. Fig. 4 illustrates
the learning curve and presents the data set in three-
dimensional (3D) space (Z data shows the number of
data points).
4.3.2. Results of GKA
The data set of three clusters, six dimensions, 0.1
density condition and high-error is taken as an exam-
ple and shown in Fig. 5.
4.3.3. Comparison of two clustering methods
To examine the performance of two clustering
methods, the multivariate analysis of variance test
(MANOVA) is used to test the results of the different
factors shown in Table 2 and the average misclassifi-
cations under different factors are shown in Table 3.
The main effect of each factor is discussed in this
research. According to the results in Tables 2 and 3,
there is further discussion as follows.
Hypothesis 1 . The number of misclassification does
not differ across the levels of clusters.
Table 2 shows that the number of clusters affects
the cluster recovery of two methods at 0.05 signifi-
cance level and Table 3 shows that the cluster recov-
ery becomes better for each method.
Hypothesis 2. The number of misclassifications does
not differ across the levels of dimensions.
The number of dimensions does not affect the
cluster recovery of two methods according to Table
2. As the number of dimensions increases, ART2 +K-
means will increase the accuracy of clustering but
ART2 +GKA will not, as shown by Table 3.
Hypothesis 3. The number of misclassifications does
not differ across the levels of density.
According to Table 2, the density levels do not
affect two cluster tools. Table 3 shows that
ART2 +K-means has better accuracy under high
density.
Hypothesis 4. The number of misclassifications does
not differ across the levels of error perturbation.
Table 2 shows the error perturbation effects of two
methods. The mean misclassifications of two methods
increase for the error free, low error and high error
data sets, respectively.
Systems 40 (2005) 355–374 367
R.J. Kuo et al. / Decision Support Systems 40 (2005) 355–374368
Hypothesis 5 . The number of misclassifications does
not differ across the two clustering methods.
In order to test whether or not the two clustering
tools have significant differences, Scheffe’s multiple
comparison tests used. The p-value shows that the two
cluster methods do not differ significantly. However,
the average of within cluster variance of ART2 +GKA,
48,020, is less then that of ART2 +K-means, 53,629.
The ART2 +GKA uses the fitness function [Eq. (18)]
to find the optimal solution and decrease the within
cluster variance.
5. Model evaluation results and discussion
The proposed method, ART2 +GKA, is excellent
for clustering analysis, as shown in Section 4. To
further document the proposed method, an advanced
comparison of the two methods was made using real
data being collected from a Web PDA company. By
employing the proposed method, this research also
develops a recommendation agent system for the end-
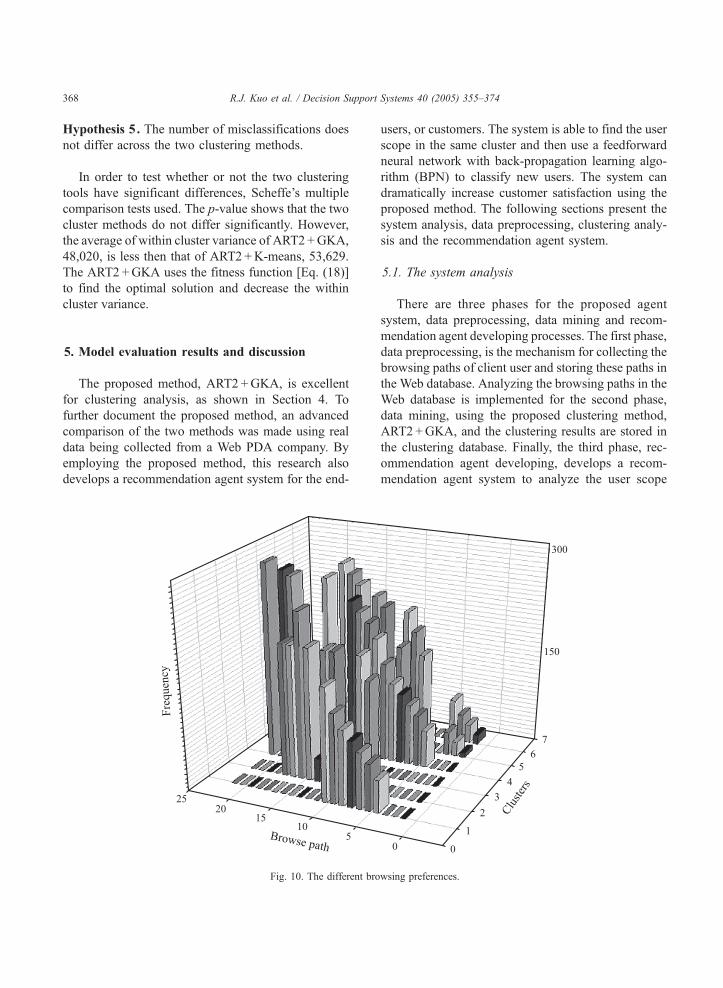
Fig. 10. The different bro
users, or customers. The system is able to find the user
scope in the same cluster and then use a feedforward
neural network with back-propagation learning algo-
rithm (BPN) to classify new users. The system can
dramatically increase customer satisfaction using the
proposed method. The following sections present the
system analysis, data preprocessing, clustering analy-
sis and the recommendation agent system.
5.1. The system analysis
There are three phases for the proposed agent
system, data preprocessing, data mining and recom-
mendation agent developing processes. The first phase,
data preprocessing, is the mechanism for collecting the
browsing paths of client user and storing these paths in
the Web database. Analyzing the browsing paths in the
Web database is implemented for the second phase,
data mining, using the proposed clustering method,
ART2 +GKA, and the clustering results are stored in
the clustering database. Finally, the third phase, rec-
ommendation agent developing, develops a recom-
mendation agent system to analyze the user scope
wsing preferences.

R.J. Kuo et al. / Decision Support Systems 40 (2005) 355–374 369
from the clustering database and recommend Web
pages to previous login users. If the user is a new
member, the agent will use a BPN to determine to
which cluster he/she belongs. Fig. 6 demonstrates the
architecture of the proposed recommendation agent
system.
5.2. Data preprocessing
The browsing paths of a Web PDA company were
collected for analysis. This company has 1875 mem-
bers, and their browsing path data was collected
from September 2000 to January 2001. The hyper-
link structure of the Web site is illustrated in Table 4.
Totally, there are 21 hyperlinks, which can be
classified into the four categories of finance, person-
ality, life and message. In order to analyze the
browsing paths with ART2, the data were trans-
formed into a matrix. The browsing page is set to
1 if the customer clicked the hyperlink of the
browsing page and set to 0 if the customer did not
Fig. 11. The user scope. The scope will recommend
click the hyperlink. After transforming, 1875 data
sets were selected, which served as the training
patterns of ART2.
5.3. Clustering analysis
In addition to the proposed method, ART2 +GKA,
ART2 neural network followed by K-means
(ART2 +K-means) was also applied for comparison
with the proposed method. Here, 21 hyperlinks were
the input patterns for ART2 neural network, and the
parameter vigilance was set to 0.6. The learning
curve and total distance are shown in Fig. 7, includ-
ing that the ART2 neural network can converge very
fast. After training, there are six output nodes, after
which, the ART2 neural network result is forwarded
to GKA and K-means. Not only the number of
clusters but also the starting points are input to
GKA and K-means. This means that the browsing
path data for 1875 members are clustered into six
segments. In the current case study, after determining
and present when the user logs in next time.

R.J. Kuo et al. / Decision Support Systems 40 (2005) 355–374370
the number of clusters, six, and starting points, they
are all forwarded to both K-means and GKA as the
initial solution. The within-cluster variations of
ART2 +K-means, ART2 +GKA, K-means, ART2,
SOM +K-means and SOM+GKA [10,11] [Kuo,
2002c] are shown in Table 5. The within-cluster
variations of ART2 +K-means and ART2 +GKA
are 647.8 and 592.95, respectively, which is a
9.25% decrease. Fig. 8 illustrates the mean within-
cluster variations for both of these methods and
others. The clustering precision of ART2 +GKA is
better than that of ART2 +K-means in this study,
similar to the results that obtained in Section 2. Fig. 9
shows the data, ART2 +GKA, presented in the three-
dimensional space and topological space of
SOM+GKA. To determine the number of clusters
of SOM+GKA is more difficult than ART2 +GKA.
Table 6 displays the percent ages of sex, age, occu-
pation and education each cluster, and Table 7 shows
the browsing path of categories. Fig. 10 shows that
Fig. 12. The home page o
different browsing preferences exist in different clus-
ters. The browsing path numbers can be found in
Table 4.
5.4. Implementation of recommendation agent
After the data preprocessing and data mining
through ART2 +GKA, six clusters are found to have
different browsing preferences. The customers in the
same cluster have the same preferences, but the user
scope may not be the same. The recommendation
agent will analyze the user scope in one cluster. In
Fig. 11, if the cluster member (1624) has the different
cluster scope, then the recommendation agent will
recommend and present the Web page to member
1624 when he/she logs in next time.
The home page of the PDA Web site is shown in
Fig. 12. If the user is a member and logs into the Web
site, the recommendation agent will search the user
attributes in the cluster’s database and recommend
f the PDA Web site.

R.J. Kuo et al. / Decision Support Systems 40 (2005) 355–374 371
pages of the cluster scope. The recommendation
mechanism is shown in Fig. 13.
From the above, only an old member can be
classified to exact cluster. However, if a new user
logs in to the system, the system is not able to
determine his/her preferences. Thus, BPN is applied
to learn the above clustering results. Once a new user
logs on to the system, it can classify the new user and
find out his/her preferences. The architecture of BPN
includes three layers.
The first layer is the input layer with 21 hyper-
links input vectors. The decision of hidden layer
nodes do not have the perfect equations or model
recently; therefore, the number of hidden layer
nodes is set to 35, 40 and 50 for this experiment.
The output layer has six nodes so that the result
shows the cluster of new user. In addition to the
hidden layer nodes, the momentum and learning rate
are set to three different levels, say 0.2, 0.4 and 0.6.
For the 1875 patterns, they are divided into training
Fig. 13. The recommend
patterns and testing patterns. Their amounts are
1500 and 375, respectively. For each factor and
level, both the mean square error (MSE) and mis-
classification rate (MR) are calculated. The MSE is
represented as:
MSE ¼
ffiffiffiffiffiffiffiffiffiffiffiffiffiffiffiffiffiffiffiffiffiffiffiffiffiffiffiffiffiffiffiffiffiffiffiffiffiXMp
XNj
ðTpj � Y
pj Þ
2
MN
vuuuutð25Þ
where Tjp is the actual output of jth output node for
pth pattern, Yjp is the network output of jth output
nodes for pth pattern, M is the number of training
patterns, and N is the number of output layer nodes.
The MR is represented as:
MR ¼ Number of misclassification patterns
Total patternsð26Þ
ation mechanism.

Fig. 14. The learning curve of training and testing data after 1000 epochs.
R.J. Kuo et al. / Decision Support Systems 40 (2005) 355–374372
This result shows that when the number of hidden
layer nodes is 50, the learning rate is 0.2 and the
momentum is 0.4, then the MSE is the lowest. Fig.
14 shows the convergence of training and testing
data in BPN. This network is used to develop the
classification system. One example of the classifica-
tion results for a new user is shown in Fig. 15.
6. Conclusions
In a clustering problem, it is always difficult to
determine the number of clusters. Therefore, this study
proposes a two-stage method, which first uses the
Adaptive Resonance Theory 2 (ART2) to determine
the number of clusters and an initial solution, then
using genetic K-means algorithm (GKA) to find the
final solution. Sometimes, the self-organizing feature
map with two-dimensional output topology has great
difficulty determining the number of clusters by ob-
serving the map. However, ART2 can actually deter-
mine the number of clusters according to the number
of output nodes. Through Monte Carlo simulation and
a real case problem, the proposed two-stage clustering
analysis method, ART2 +GKA, has been shown to
provide high performance. The p-value of Scheffe’s
multiple comparison test shows that the two cluster
methods, ART2 +K-means and ART2 +GKA, do not
differ significantly, but the average of within cluster
variance of ART2 + GKA is less than that of
ART2 +K-means. This may be because ART2 +GKA
has the characteristics of both a genetic algorithm and
K-means.
In the real-world case study, the browsing paths of
a Web PDA company were clustered by both
ART2 +K-means and ART2 +GKA. The results from

Fig. 15. The classification of new user.
R.J. Kuo et al. / Decision Support Systems 40 (2005) 355–374 373
ART2 + GKA are much better than those of
ART2 +K-means, demonstrating that ART+GKA is
an efficient tool for clustering analysis. Based on the
clustering result, the Web administrators can make
more effective Webs for the customers. After under-
standing the customers’ behaviors, the recommenda-
tion mechanism can be more easily and precisely
created. Because customers in the same cluster have
similar characteristics, this mechanism can recom-
mend Web pages that are clicked more frequently
for the same cluster. Thus, for a larger Web site, this
process may save search time, thus increasing the
customers’ convenience and satisfaction.
Future research can improve the current study.
For instance, the parameters of GKA, like the
crossover and mutation rates, affect the time to
converge, so an experimental design can decide
the best parameter combination to speed up the
convergence. Because an ant colony system is also
effective at searching, it may be a good candidate
for replacing the ART2 neural network.
Acknowledgements
The authors would like to thank the National
Science Council, Republic of China, for financial
support under Contract No. NSC 91-2416-H-027-002.
References
[1] P.V. Balakrishnan, M.C. Cooper, V.S. Jacob, A study of clas-
sification capabilities of neural networks using unsupervised
learning: a comparison with K-means clustering, Psychome-
trika 59 (4) (1994) 409–525.
[2] P.V. Balakrishnan, M.C. Cooper, V.S. Jacob, Comparative per-
formance of the FSCL neural net and K-means algorithm of
market segmentation, European Journal of Operational Re-
search 93 (1996) 346–357.
[3] G.A. Carpenter, S. Grossberg, A massively parallel architec-
ture for a self-organizing neural pattern recognition machine,
Computer Vision, Graphics, and Image Processing 37 (1987)
54–115.
[4] G.A. Carpenter, S. Grossberg, ART2: self-organization of sta-
ble category recognition codes for analog input pattern, Ap-
plied Optics 26 (1987) 4919–4930.

R.J. Kuo et al. / Decision Support Systems 40 (2005) 355–374374
[5] J. Hertz, A. Krogh, R.G. Palmer, Introduction to the Theory of
Neural Computation, Addison –Wesley Publishing, USA,
1991.
[6] J. Holland, Adaptation in Neural and Artificial Systems, Uni-
versity of Michigan Press, Ann Arbor, 1975.
[7] D.R. Jones, M.A. Tetramo, Soving partitioning problems with
genetic algorithms, Proc. 4th Int. Conf. Genetic Algorithms,
Morgan Kaufman, San Mateo, CA, 1991, pp. 442–449.
[8] T. Kohonen, Self-organizing maps: optimization approaches,
in: T. Kohonen, K. Makisara, O. Simula, J. Kangas (Eds.),
Artificial Neural Networks, Elsevier, Amsterdam, The Nether-
lands, 1991, pp. 981–990.
[9] K. Krishna, M.N. Murty, Genetic K-means algorithm, IEEE
Transactions on Systems, Man and Cybernetics. Part B. Cy-
bernetics 29 (3) (1999) 433–439.
[10] R.J. Kuo, W.J. Chung, Integration of self-organizing maps
neural network and genetic K-means algorithm for data min-
ing, Proceedings of 30th International Conference on Com-
puters and Industrial Engineering, Tinos Island, Greece, June
28–July 2, 2002, pp. 509–513.
[11] R.J. Kuo, L.M. Ho, C.M. Hu, Integration of self-organizing
feature map and K-means algorithm for market segmentation,
International Journal of Computers and Operations Research
29 (2002) 1475–1493.
[12] R.J. Kuo, K. Chang, S.Y. Chien, Integration of self-organizing
feature maps and genetic algorithm based clustering method
for market segmentation, Journal of Organizational Comput-
ing and Electronic Commerce 14 (1) (2004) 43–60.
[13] F. Laurence, Fundamental of Neural Network, Addison–Wes-
ley, USA, 1996, pp. 350–378.
[14] H. Mannila, Data mining: machine learning, statistics, and
databases, Proceedings of the 8th Conference on Scientific
and Statistical Database Systems, 1996, pp. 2–9.
[15] U. Maulik, S. Bandyopadhyay, Genetic algorithm-based
clustering technique, Pattern Recognition 33 (2000)
1455–1465.
[16] G.W. Milligan, An examination of the effect of six types of
error perturbation on fifteen cluster algorithms, Psychometrika
45 (3) (1980) 325–342.
[17] G.W. Milligan, An algorithm for generating artificial test clus-
ters, Psychometrika 50 (1) (1985) 123–127.
[18] C.A. Murthy, N. Chowdhury, In search of optimal clusters
using genetic algorithms, Pattern Recognition Letters 17
(14) (1996) 825–832.
[19] F. Peper, Z. Bing, H. Noda, A comparative study of Art2-A
and the self-organizing feature map, Proceedings of 1993 In-
ternational Joint Conference on Neural Network vol. 2, 1993,
pp. 1425–1428.
[20] A. Pieter, Z. Dolf, Data Mining, Addison–Wesley, Harlow,
1996.
[21] R.A. Proctor, Marketing decision support system: a role for
neural networking, Marketing Intelligence and Planning 10 (1)
(1992) 21–26.
[22] A. Scott, An introduction to genetic algorithms, AI Expert 4
(3) (1990) 49–53.
[23] S.Z. Selim, M.A. Ismail, K-means-type algorithms: a general-
ized convergence theorem and characterization of local opti-
mality, IEEE Transactions on Pattern Analysis and Machine
Intelligence 6 (1) (1984) 81–87.
[24] M. Srinivas, L.M. Patnaik, Genetic algorithms: a survey, IEEE
Computer, (1994) 17–26.
[25] F. Thomas, K. Karl-Friedrich, K. Torsten, Comparative analysis
of fuzzy ART and ART-2A network clustering performance,
IEEE Transactions on Neural Networks 9 (3) (1998) 544–560.
[26] V. Venugopal, W. Bates, Neural network and their application
in marketing management, Journal of Systems Management
45 (9) (1994) 16–21.
[27] K. Yamamaoto, O. Inoue, New evolutionary direction oper-
ator for genetic algorithms, AIAA Journal 33 (10) (1996)
1990–1993.
R.J. Kuo received the MS degree in Industrial and Manufacturing
Systems Engineering from Iowa State University, Ames, IA, in 1990
and the Ph.D. degreee in Industrial and Management Systems
Engineering from the Pennsylvania State University, University Park,
PA, in 1994. Currently, he is the Dean of College of Management,
National Taipei University of Technology, Taiwan, ROC. His re-
search interests include architecture issues of neural networks, fuzzy
logic, and genetic algorithms, and their applications in decision
support systems, electronic business and supply chain management.
J.L. Liao received the MS degree in Industrial Engineering and
Management fromNational Taipei University of Technology in 2002.
His research interests include neural networks, fuzzy logic, and their
applications in electronic commerce.
C. Tu received the MS degree in Institute of Management Science
from National Chiao Tung University, Shinchu, Taiwan, R.O.C. in
1978 and the Ph.D. degree in Institute of Business and Management
from the National Chiao-Tung University, Shinchu, Taiwan, R.O.C.
in 2000. Currently, he is the CEO of the Center of Regional Industry-
Education Partnership of Ministry of Education at National Taipei
University of Technology and the Associate Professor in the Depart-
ment of Industrial Engineering and Management, National Taipei
University of Technology, Taiwan, ROC. His research interests
include architecture issues of neural networks, fuzzy logic, and their
applications in service management, performance management and
supply chain management.