integration of a combined cycle power plant with med-ro
TRANSCRIPT

processes
Article
Integration of a Combined Cycle Power Plant with MED-RODesalination Based on Conventional and Advanced Exergy,Exergoeconomic, and Exergoenvironmental Analyses
Mohammad Hasan Khoshgoftar Manesh 1,2,*, Reza Shojaei Ghadikolaei 1,2 , Hossein Vazini Modabber 2 andViviani Caroline Onishi 3,*
�����������������
Citation: Khoshgoftar Manesh, M.H.;
Ghadikolaei, R.S.; Modabber, H.V.;
Onishi, V.C. Integration of a
Combined Cycle Power Plant with
MED-RO Desalination Based on
Conventional and Advanced Exergy,
Exergoeconomic, and
Exergoenvironmental Analyses.
Processes 2021, 9, 59. https://doi.org/
10.3390/pr9010059
Received: 7 November 2020
Accepted: 25 December 2020
Published: 29 December 2020
Publisher’s Note: MDPI stays neu-
tral with regard to jurisdictional clai-
ms in published maps and institutio-
nal affiliations.
Copyright: © 2020 by the authors. Li-
censee MDPI, Basel, Switzerland.
This article is an open access article
distributed under the terms and con-
ditions of the Creative Commons At-
tribution (CC BY) license (https://
creativecommons.org/licenses/by/
4.0/).
1 Energy, Environment and Biologic Research Lab (EEBRlab), Division of Thermal Sciences andEnergy Systems, Department of Mechanical Engineering, Faculty of Technology & Engineering,University of Qom, Qom 3716146611, Iran; [email protected]
2 Center of Environmental Research, Qom 3716146611, Iran; [email protected] School of Engineering and the Built Environment, Edinburgh Napier University, Merchiston Campus,
10 Colinton Road, Edinburgh EH10 5DT, UK* Correspondence: [email protected] (M.H.K.M.); [email protected] (V.C.O.)
Abstract: The ever-increasing world population, change in lifestyle, and limited natural waterand energy resources have made industrial seawater desalination plants the leading contendersfor cost-efficient freshwater production. In this study, the integration of a combined cycle powerplant (CCPP) with multi-effect distillation (MED) and reverse osmosis (RO) desalination unitsis investigated through comprehensive conventional and advanced exergy, exergoeconomic, andexergoenvironmental analyses. Firstly, the thermodynamic modelling of the CCPP is performed byusing a mathematical programming procedure. Then, a mathematical model is developed for theintegration of the existing CCPP plant with MED and RO desalination units. Finally, conventional andadvanced exergy, exergoeconomic, and exergoenvironmental analyses are carried out to assess themain performance parameters of the integrated CCPP and MED-RO desalination system, as well as toidentify potential technical, economic, and environmental improvements. A case study is presentedbased on the Shahid Salimi Neka power plant located at the north of Iran along the Caspian Sea.The mathematical modelling approach for the integrated CCPP and MED-RO desalination systemis solved in MATLAB, and the results are validated via Thermoflex software. The results reveal anincrease of 3.79% in fuel consumption after the integration of the CCPP with the desalination units.The exergy efficiency of the integrated system is 42.7%, and the highest cost of exergy destructionof the combustion chamber is 1.09 US$ per second. Economic and environmental analyses of theintegrated system also show that gas turbines present the highest investment cost of 0.047 US$ persecond. At the same time, MED exhibits the highest environmental impact rate of 0.025 points persecond.
Keywords: mathematical modelling and simulation; desalination; water and power production;combined cycle power plant (CCPP); multi-effect distillation (MED); reverse osmosis (RO); advancedexergy analysis; exergoeconomic analysis; exergoenvironmental analysis
1. Introduction
The pressing need of human societies for energy allied to the limited energy resourcesand its increasing prices have led many experts and scientists to find a way to optimizeenergy consumption. In this light, the design of a power plant with maximum efficiency interms of energy consumption has become a significant challenge today. Besides, the reliableprovision of freshwater is also an emerging issue, particularly in water-stressed countries.Thus, the implementation of new multi-purpose power plants, as well as the retrofit ofexisting single-purpose ones to produce power and water have received increased interest
Processes 2021, 9, 59. https://doi.org/10.3390/pr9010059 https://www.mdpi.com/journal/processes

Processes 2021, 9, 59 2 of 29
from the literature in the past few years. One way of converting existing single-purposepower plants into multi-purpose ones is by recovering and reusing the waste heat from thesystem. The waste heat can be utilized for local heating and cooling, and in the form ofsteam for the production of freshwater in industrial desalination plants.
The design of integrated power plants with desalination systems is a very complextask, which usually involves the optimization of several thermodynamic, economic, andenvironmental aspects at once. In this context, Najafi et al. [1] have proposed a comprehen-sive study on the thermodynamic, economic, and environmental costs of a combined gasturbine and fuel cell system coupled to a desalination unit. The authors have consideredtwo different objective functions to optimize the integrated system. Thus, the exergy effi-ciency and overall cost rate are optimized via a genetic algorithm-based approach, aimingat reducing the overall cost while increasing the exergy efficiency of the system. Theyhave also examined the rate of return of investment and concluded that the cost of theinvestment can be fully repaid after 9 years. Vazini et al. [2] have studied the optimalcoupling of a site utility steam network to a desalination system by applying total siteanalysis and exergoeconomic optimization. The authors have showed that the steam net-work used by various processes on a site, in addition to providing the required steam foreach component, can also meet the required steam of the desalination unit. They have alsoexamined the potential coupling a power plant unit to a multi-effect distillation (MED) andreverse osmosis (RO) desalination system by assessing the process fuel consumption, andpower and heat outputs.
Al-Zahrani et al. [3] have conducted a theoretical study on a hybrid system consistingof a gas turbine unit, and a membrane and thermal desalination units. The authors haveproposed a modelling approach for a MED-RO system coupled to a gas turbine cycle, bytaken into account energy and exergy efficiencies for different equipment in the integratedsystem. This study has also investigated the effects of the main parameters of the gasturbine, such as inlet temperature and pressure rate on the production of freshwater. Theyhave also evaluated the degree of exergy destruction for various components of the system.Sadri et al. [4] have proposed a thermodynamic model to predict the performance of amulti-effect steam desalination system. The authors have performed a comprehensiveexergy efficiency analysis of a RO desalination unit. They have also developed a model tooptimize the system irreversibility and exergy destruction, by using genetic algorithms.
Blanco-Marigorta et al. [5] have presented the exergy-environmental analysis of amembrane desalination unit located in the Canary Islands. The authors have performed anexergy analysis and a life cycle analysis to evaluate the main environmental parametersof the system. They have concluded that the highest exergy destruction occurs in theRO and high-pressure pump units. They have stated that the environmental impactscan be decreased by reducing the amount of exergy destruction of these components.Calise et al. [6] have examined a renewable-driven multi-generation system composed of asolar field, absorption chiller, biomass heaters, and a MED desalination unit. They haveperformed exergy and exergoeconomic analysis to identify process units with greatestimpact on exergy efficiency.
Mokhtari et al. [7] have investigated the simultaneous integration of a gas turbine withMED and RO desalination plants in Bashagard city. The authors have concluded that theintegrated system can met the electricity and freshwater demands in the region. Almutairiet al. [8] have proposed a comprehensive approach for cogeneration systems based onenergy and exergy analyses of real data. They have used IPSEPRO software to combine theMED desalination and a thermal compressor. The authors have appraised the performanceof the system under different thermodynamic and environmental conditions. They havefound that the highest system irreversibility is related to the thermo-compressor anddesalination effects. They have also concluded that the system efficiency can be increasedby changing some process conditions, which include lowering the ambient temperature,increasing the pressure rate, as well as by rising the feedwater temperature.

Processes 2021, 9, 59 3 of 29
Shahzad et al. [9] have developed a new method for categorizing fuel costs in anintegrated system of a combined cycle power plant (CCPP) and desalination unit. Theauthors have considered exergy destruction as an important factor in categorizing fuelcosts. Their results reveal that power turbines mainly use changes in the enthalpy energyof steam at high pressures and temperatures, while desalination plants (especially multi-effect plants) depend only on the latent heat of steam. In addition, the exergy destructionimposed by desalination units is about 2 to 7% of the total exergy destruction. Eveloyet al. [10] have investigated a system consisting of a solid oxide fuel cell, gas turbine, andRO desalination plant. They have examined the integrated system from a thermodynamicand economic point of view, and considered different fluids in the Rankine organic cycle.Their results show that the power output of the hybrid cycle varies from 1.2 to 2.4 MW,depending on the selected organic fluid. Their results also indicate that US$ 8 million toUS$ 21 million can be saved per year in terms of water and gas expenses.
Ng et al. [11] have proposed an optimization approach to improve the exergy efficiencyof a large-scale water desalination unit. Based on an economic analysis, Arani et al. [12]have concluded that the ease of access is one of the most important factors in increasingthe cost of a unit over the years. They have proposed a new model for economic analysisby assessing the relationship between the cost of a unit and its ease of access. In theiranalysis, the authors have investigated the integration of a combined cycle of gas turbinesand a desalination unit. Moreover, different economic parameters including the net presentvalue and repayment period have been examined in the two units with fixed and time-varying access. They have determined that unit’s access availability is a critical factor insystems with severe destruction and prolonged overhauls. Salimi and Amidpour [13] haveinvestigated the integration of different desalination systems into cogeneration units. Intheir study, the authors have used the R-CURVE diagram to analyze the integration ofMED and RO desalination units with co-production systems to reduce the overall systemcost. They have found that the R-CURVE diagram can be a useful and powerful diagramfor examining the effects of this integration on system performance.
Ameri et al. [14] have investigated the exergy analysis of a 420 MW NEKA combinedcycle power plant. The authors have evaluated the thermal and exergy efficiency of theplant. Vazini and Khoshgoftar Manesh [15] have focused on the optimization of a water de-salination unit integrated with the Qeshm power and water production plant. The authorshave developed a multi-objective model based on genetic algorithms. The objective func-tions are selected to maximize the exergy efficiency, while the economic and environmentalperformance parameters are minimized in their multi-objective optimization approach.Thermodynamic modelling and simulation have been performed in MATLAB software(R2014a, MathWorks, atick, Massachusetts, USA, 2014), and its validation performed withthe results from Thermoflex software and real results of the Qeshm site. Their resultsshow ~24% of increase in exergy efficiency and a significant decrease in the costs and theenvironmental impacts of the system. Moghimi et al. [16] have investigated an integratedsystem for the production of cooling, heating, power, and freshwater for domestic use. Inthis study, the authors have evaluated the system in terms of exergy and energy of differentoperating conditions. The results show that the proposed system is capable of supplyingfreshwater at ~86 kg/s, as well as generating 30 MW of electricity, 2 MW for the coolingsystem, and 1.1 MW for the heating system. Finally, the exergy destruction is ~56 MW,whereas the exergy and energy efficiencies are equal to 36% and 39%, respectively.
In this study, the integration of a CCPP with MED and RO desalination units is inves-tigated through comprehensive conventional and advanced exergy, exergoeconomic, andexergoenvironmental analyses. The thermodynamic modelling of the integrated CCPP andMED-RO desalination system is performed in MATLAB software by using a programmingprocedure, and the results obtained are validated via Thermoflex software. In addition,conventional and advanced exergy, exergoeconomic, and exergoenvironmental analysesare carried out to assess the main process performance parameters, as well as to identifypotential technical, economic, and environmental improvements for the integrated CCPP

Processes 2021, 9, 59 4 of 29
and MED-RO system. Hence, the exergy destruction rate of the equipment is calculatedusing conventional exergy analysis. This analysis allows identifying the components thatpresent more potential for improvements according to their rate of exergy destruction.On the other hand, performing an advanced exergy analysis provides a more detailedperspective. In advanced analysis, the exergy destruction rate of equipment is divided intotwo parts: (i) avoidable/unavoidable exergy destruction; and, (ii) endogenous/exogenousexergy destruction [17]. In the advanced exergy analysis, the potential for improvements ofprocess components is evaluated by the share of avoidable and endogenous exergy destruc-tion. Therefore, the advanced exergy analysis has the ability to more accurately identify theimprovement potential of different units of the system. A case study is performed basedon the Shahid Salimi Neka power plant located at the north of Iran along the Caspian Sea.To the best of our knowledge, this is the first study applying advanced exergy analysisto investigate the integration of MED-RO desalination system to the Neka CCPP. Thus,innovative features of this work include assessing the effects of the desalination and powerplant system integration, as well as identifying potential system improvements by perform-ing both conventional and advanced exergy, exergoeconomic, and exergoenvironmentalanalyses.
2. Process Description
A combined cycle power plant (CCPP) consists of a combination of steam turbine andgas turbine cycles. In the CCPP process, gas turbine generators produce electricity, whilethe waste heat energy from combustion products of the gas turbine (GT) is used to generatethe steam required to drive the steam turbine (ST). Note that additional electricity is neededin the latter process. The CCPP layout can vary depending on the type of turbines, heatrecovery boilers, and recovery devices used in the system. The efficiency of the power plantcan be considerably increased by combining the steam and gas turbine cycles. The electricalefficiency of a simple power plant without waste heat recovery is typically between 25–40%,while the CCPP has an efficiency of about 60%.
The Shahid Salimi Neka power plant (hereafter, referred to as Neka power plant)is a CCPP located in the vicinity of the city of Neka and the Caspian Sea at the north ofIran. The Neka power plant is composed of two GTs, one ST, two air compressors (ACs),two heat recovery steam generators (HRSGs), one combustion chamber (CC), and a platecondenser with a cooling system based on seawater. The GTs used in this cycle are of aV94.2 type with a production capacity of 132.15 MW. Since the GTs were installed in 1982,their operating parameters will differ from a new gas turbine. The temperature of theexhaust gases from the GTs enters the double pressure boiler at ambient temperature andproduces steam at 520 ◦C and 230 ◦C in the high and low-pressure sections, respectively.The production capacity of the ST in this plant is about 160.8 MW, and the total CCPPcapacity is 420 MW [14]. The schematic diagram of the Neka power plant is shown inFigure 1.
This study examines the thermodynamic feasibility of coupling a multi-effect distil-lation (MED) and reverse osmosis (RO) desalination system to the existing Neka powerplant. The schematic diagram of the proposed power and freshwater production plantis depicted in Figure 2. According to this schematic diagram, airflow first enters the ACwith a temperature of 20 ◦C. The compression process increases the airflow pressure toabout 10.8 times. Then, the compressed air is combined with the fuel in the CC and itsoutlet temperature rises to about 970 ◦C. In the next stage, the hot and compressed outletflow with significant energy enters the GT section. The GT spends part of this energy onmoving the compressor, and the rest as the net power of the turbine itself. The combustionproducts from GTs have a good potential in terms of heat.

Processes 2021, 9, 59 5 of 29����������������� ��������������� ��������
�
�������� !�"#$%&'()#�*)'+,'&����"$'$)*�"'-)&)�.%/'�0�1%,�0-'2(3�4�"5�$%'(�,%#�6%,7�8(%'&�+%2%,'(�,�'8�0,�0�8%*�97�:&%,)�%(�'-3�;<=>3� �2�#�&9)2%*�0�1%,�#7#-%8�($%�-�88����$%'(�#'2�9%�0,%6%2(%*�97�970'88)2+�($%�#�&?9@8()�2�0,�*@#(8�($,�@+$�6',)�@8�0,�#%88�#�&0�2%2(8�(��0,�*@#%�$)+$?0,%88@,%�8(%'&�'2*�@8%�)(�(��+%2%,'(%�0�1%,�)2�($%�"A3�.�(%�($'(�($%�#�&9@8()�2�0,�*@#(8��,�&�5A8�%2(%,�($%�$)+$?0,%88@,%�B4�C�8@0%,$%'(%,3�A$)8�)8�($%��),8(�%D@)0&%2(�)2�($%�4�"5�@2)(3�E7�97?0'88)2+�#�&9@8()�2�0,�*@#(8�($,�@+$�($%�4��8@0%,$%'(%,�($%�8(%'&�(%&0%,'(@,%�8$�@-*�,%'#$�����FG�(��0,�6)*%�($%�2%#%88',7�#�2*)()�28���,�@8%�)2�($%�8(%'&�(@,9)2%3��2�($%�2%�(�8(%0�($%�#�&9@8()�2�0,�*@#(8�%2(%,�($%�-�1?0,%88@,%�BH�C�%6'0�,'(�,3��A$%�H��%6'0�,'(�,�@8%8�($%�#�&9@8()�2�0,�*@#(8�$%'(�(��#�26%,(�($%�1'(%,�0$'8%��,�&�'�-)D@)*�(��6'0�,�8('(%�'2*�0,%0',%�)(���,�%2(%,)2+�($%�4��8@0%,$%'(%,3�A$%�%#�2�?&)I%,�)8�'�(,'28*@#%,�($'(�@8%8�1'8(%�$%'(�(��,')8%�($%�(%&0%,'(@,%����($%�)2-%(�1'(%,�(��($%�8'(@,'()�2�(%&0%,'(@,%�'(�($%�8'&%�0,%88@,%�'�(%,�1$)#$�($%�%6'0�,'(�,�#'2�+%2%,'(%�($%�*%&'2*%*�8(%'&3�.%�(�($%�#�&9@8()�2�0,�*@#(8�%2(%,�($%��%%*1'(%,�0,%$%'(%,�9%��,%��)2'--7�,%'#$)2+�($%�#$)&2%7�'2*��0%2?'),�8%#()�23��2�($%�H��8%#()�2����($%�4�"5�'2*�'�(%,�($%�H��8@0%,$%'(%,�($%�H��8(%'&��-�1�)8�*)6)*%*�)2(��(1��8(,%'&83��2%�8(,%'&�%2(%,8�($%�H��8%#()�2����($%�"A�1$%,%�)(�)8�&)�%*�1)($�($%��@(-%(�8(,%'&��,�&�($%�4�?"A3�A$%�8%#�2*�H��8(%'&�8(,%'&�%2(%,8�($%�J�K�0-'2(�1$%,%�)(�0,�6)*%8�($%�,%D@),%*�8(%'&���,�*,)6)2+�($%��),8(�*%8'-)2'()�2�%��%#(3�A$%�8#$%&'()#�*)'+,'&����($%�0,�0�8%*�J�K�*%8'-)2'()�2�@2)(�)8�*)80-'7%*�)2� )+@,%��3��2�($%�J�K�8%#()�2�8%'1'(%,��),8(�%2(%,8�($%�*%8'-)2'()�2�#�2*%28%,�'(�8%'1'(%,�(%&?0%,'(@,%�B�L�FGC3�A$%�)2-%(�8%'1'(%,�)8�@8%*�'8�($%�#��-)2+�1'(%,����($%�*%8'-)2'()�2�#�2?*%28%,�'2*�#�26%,(8�($%�8(%'&�8@00-7�)2(��'�-)D@)*�8('(%3�:�(%,�'�-)((-%�1',&)2+�($%�8%'?1'(%,�)8�*),%#(%*�(��(1��*)��%,%2(�878(%&�#�&0�2%2(83��2%�0',(�%2(%,8�($%�J�K�*%8'-)2'?()�2�%��%#(8�'8��%%*1'(%,�1$)-%�($%��($%,��2%�-%'6%8�($%�#�2*%28%,�@2)(�'8�#��-)2+�1'(%,�*)8#$',+%�'2*�,%(@,2�(��($%�8%'�B)��($%,%�)8�2�����@2)(�*�128(,%'&C3�.�(%�($'(�($%�J�K�@2)(�)8�*,)6%2�97�($%�8(%'&��,�&�($%�H��8%#()�2����($%�4�"5�@2)(����($%�GG��3�A$%��%%*?1'(%,�)8�80,'7%*��,�&�'9�6%��2(��($%�0)0%8�#�2(')2)2+�$�(�8(%'&�'2*�0',(����)(�%6'0�,'(%8�)2�($%�0,�#%88�*@%�(��($%�-�1�0,%88@,%����($%�%��%#(8�'2*�$)+$�(%&0%,'(@,%3�
Figure 1. Schematic diagram of Shahid Salimi Neka power plant. HRSG, heat recovery steam generator as proposed byAmeri et al. [14]. Reprinted figure with permission from Ameri, M., Ahmadi, P., Khanmohammadi, S. Exergy analysis of a420 MW combined cycle power plant. 2008, 32, 175–183.����������������� ��������������� ��������
�
��������� �!"#$%&'("�)(&*+&%����'#$�,$-�(,'$*+&'$)�"�%.(,$)�"/"0$�1�-$+�10&,'�233��4�-('#�%50'(6$��$"'�)(7'(00&'(�,�28�94�&,)�+$:$+7$��7%�7(7�2��4�)$7&0(,&'(�,�7/7'$%;�<��0�-61+$775+$=�>��#(*#61+$775+$;�?#$�+$7'����'#$��$$)-&'$+�%�:$7�&7�&�.+(,$�-('#�1+�*+$77(:$0/�#(*#$+�7&0(,('/�'�-&+)7�'#$�$�('����'#$�)$7&0(,&'(�,�5,(';�?#$�7'$&%�1+�)5"$)�./�'#$�$:&1�+&'(�,����7&0'-&'$+�$,6'$+7�'#$�5,('�&7�&�7'(%5057�7()$�$��$"';�@�'$+�'#$��(+7'�8�9�$��$"'�'#$�75110/�7'$&%�'5+,7�(,'��&�0(A5()�7'&'$�)5$�'��#$&'�0�77�&,)�0$&:$7�'#$�)$7&0(,&'(�,�5,(';�?#(7��0�-�+$�$++$)�'��&7�B7'$&%�+$'5+,$)C�(7�'#$,�%(�$)�-('#�'#$��5'0$'��0�-��+�%�'#$�33���"�,)$,7$+�'��.$�57$)�&7��$$)-&'$+����'#$�>�!D�5,(';�?#$�1+�)5"$)�)(7'(00&'$�(7�$�'+&"'$)��+�%�'#$�)$7&0(6,&'(�,�"�,)$,7$+�&7�&��+$7#-&'$+�7'+$&%;��,�&�8�9�10&,'�'#$�"��0(,*�-&'$+�)(7"#&+*$��+�%�'#$�"�,)$,7$+�#&7�&�#(*#$+�'$%1$+&'5+$�'#&,�7$&-&'$+;�>�-$:$+�('7�7&0(,('/�(7�$A5&0�'��'#&'����7$&-&'$+;�?��(,"+$&7$�'#$�&%�5,'�����+$7#-&'$+�1+�)5"$)�'#$�"��0(,*�-&'$+�)(7"#&+*$�7'+$&%�"&,�.$�57$)�&7��$$)-&'$+���+�&����)$7&0(,&'(�,�5,(';� (*5+$�E�7#�-7�&�7"#$%&'("�)(&*+&%���+�'#$����)$7&0(,&'(�,�5,('�"�,7()$+$)�(,�'#(7�7'5)/;�� �Figure 2. Schematic diagram of the new integrated combined cycle power plant (CCPP) with multi-effect distillation (MED)and reverse osmosis (RO) desalination system. LP, low-pressure; HP, high-pressure.
In combined power cycles, the loss of heat can be prevented by bypassing the combus-tion products through various process components to produce high-pressure steam, anduse it to generate power in the ST. Note that the combustion products from GTs enter thehigh-pressure (HP) superheater. This is the first equipment in the HRSG unit. By bypassingcombustion products through the HP superheater, the steam temperature should reach

Processes 2021, 9, 59 6 of 29
533 ◦C to provide the necessary conditions for use in the steam turbine. In the next step,the combustion products enter the low-pressure (LP) evaporator.
The LP evaporator uses the combustion products heat to convert the water phase froma liquid to vapor state, and prepare it for entering the HP superheater. The economizeris a transducer that uses waste heat to raise the temperature of the inlet water to thesaturation temperature at the same pressure, after which the evaporator can generate thedemanded steam. Next, the combustion products enter the feedwater preheater beforefinally reaching the chimney and open-air section. In the LP section of the HRSG, and afterthe LP superheater, the LP steam flow is divided into two streams. One stream enters theLP section of the ST, where it is mixed with the outlet stream from the HP-ST. The secondLP steam stream enters the MED plant, where it provides the required steam for drivingthe first desalination effect. The schematic diagram of the proposed MED desalination unitis displayed in Figure 3.
����������������� ��������������� ��������
�
��������� !�"#$%&'()#����($%�&*+(),%��%#(�-).()++'()�/�01�23�.4.(%&5�� �Figure 3. Schematic of the multi-effect distillation (MED) system.
In the MED section, seawater first enters the desalination condenser at seawatertemperature (20 ◦C). The inlet seawater is used as the cooling water of the desalinationcondenser and converts the steam supply into a liquid state. After a little warming,the seawater is directed to two different system components. One part enters the MEDdesalination effects as feedwater, while the other one leaves the condenser unit as coolingwater discharge and return to the sea (if there is no RO unit downstream). Note thatthe MED unit is driven by the steam from the LP section of the HRSG unit of the CCPP.The feedwater is sprayed from above onto the pipes containing hot steam and part of itevaporates in the process, due to the low pressure of the effects and high temperature.
The rest of the feedwater moves as a brine with progressively higher salinity towardsthe exit of the desalination unit. The steam produced by the evaporation of saltwater entersthe unit as a stimulus side effect. After the first MED effect, the supply steam turns intoa liquid state due to heat loss, and leaves the desalination unit. This flow, referred to as“steam returned”, is then mixed with the outlet flow from the CCPP condenser to be usedas feedwater of the HRSG unit. The produced distillate is extracted from the desalinationcondenser as a freshwater stream. In a MED plant, the cooling water discharge from thecondenser has a higher temperature than seawater. However, its salinity is equal to thatof seawater. To increase the amount of freshwater produced, the cooling water dischargestream can be used as feedwater for a RO desalination unit. Figure 4 shows a schematicdiagram for the RO desalination unit considered in this study.
Processes 2021, 9, 59 7 of 29����������������� ��������������� ��������
�
��������� !�"#$%&'()#�*)'+,'&����($%�,%-%,.%��.&�.).�/��0�*%.'1)2'()�2�32)(4�5##�,*)2+�(�� )+3,%�6�($%�#��1)2+�7'(%,�*).#$',+%��,�&�($%�8�9�.:.(%&�($'(�).�($%�����%%*7'(%,�%2(%,.�'�;,%<(,%'(&%2(�32)(���,�,%&�-'1����)(.�1',+%�'2*�.3.;%2*%*�;',()#1%.4�=$).�.(,%'&�).�($%2�;3&;%*�)2(��($%����&%&>,'2%�*3%�(��&%#$'2)#'1�;,%..3,%4�=$%�&%&<>,'2%�,%&�-%.�($%�.'1(��,�&�($%��%%*7'(%,�'2*�;,�*3#%.��,%.$7'(%,4��(�).�2�(%*�($'(��-%,<#�&)2+�($%��.&�()#�;,%..3,%�*)��%,%2#%�>%(7%%2��,%.$7'(%,�'2*�.'1(7'(%,�).�($%�>'.).����($%����*%.'1)2'()�2�;,�#%..4�?!�@�ABCDCEC�F�GHIH�JK��L�MNOPLQ��R�M�SSQOT��U�VK��WOV�T�PV�M�XX���POM�RYZ[\]�̂N�V�L� �,�>%((%,�&�*%11)2+�($%�+'.�'2*�.(%'&�(3,>)2%�#:#1%.����($%�__���'�.%(����*%�'31(�-'13%.�).�#�2.)*%,%*�'.�)2;3(�*'('4�=$).�*'('�).��>(')2%*��,�&�($%��;%,'()�2'1�)2��,&'()�2����($%�̀%a'�;�7%,�;1'2(�'.�7%11�'.�($%�7%'($%,�#�2*)()�2.�',�32*�($%�1�#'()�2����($%�;1'2(4�=$%�)2;3(�*'('�,%1'(%*�(��+'.�'2*�.(%'&�#:#1%.�',%�+'($%,%*�)2�='>1%.�b�'2*���,%<.;%#()-%1:4�831()<%��%#(�*%.'1)2'()�2�.:.(%&.�',%�#�&;�.%*�>:�.%-%,'1�)*%2()#'1�*%.'1)2'()�2�%�<�%#(.4�=$%,%��,%�($%,%�',%�.%-%,'1�)*%2()#'1�*%-)#%.�($'(�',%�3.%*�&'2:�()&%.4� �,�&�*%1<1)2+�;3,;�.%.�%'#$�*%-)#%�).�&�*%11%*�.%;','(%1:�)2�($).�.(3*:4�=$%2�($%��-%,'11�&�*%1����($%�.:.(%&�).�($%,&�*:2'&)#'11:�'2'1:c%*�>:�;,�-)*)2+�'�.3)('>1%�%d3'()�2�(��#�22%#(�)(.�*)��%,%2(�;',(.4�=$%�)2;3(�*'('���,�($%�($%,&�*:2'&)#�&�*%11)2+����($%�8�9�32)(�).�+)-%2�)2�='>1%��4�efgE��h!�=%#$2)#'1�)2;3(�*'('����($%�+'.�(3,>)2%�#:#1%�ib�j4�klm�A�nf�fo�A��� pFogCE� qfE���rsl�At�5&>)%2(�(%&;%,'(3,%� uv� �w�/x_0�=3,>)2%�)21%(�(%&;%,'(3,%� yz{v|}~v � ��b�/x_0�5_�#�&;,%..)�2�,'()�� ����� � bw�5_�).%2(,�;)#�%��)#)%2#:� ��� � w4����=�).%2(,�;)#�%��)#)%2#:� �v� � w4�w�%̀(�;�7%,��3(;3(�� �{������ � b��b�w�/a�0���7%,�$%'()2+�-'13%� ���� 6�6�6�/a��a+0��#�.(�����3%1� ������ ������ ¡¢�#�.(����'),� �£¤¥� u�#�.(����#��1)2+�7'(%,� �¦§� u�5_�'),�#�&;,%..�,̈��=�+'.�(3,>)2%4�
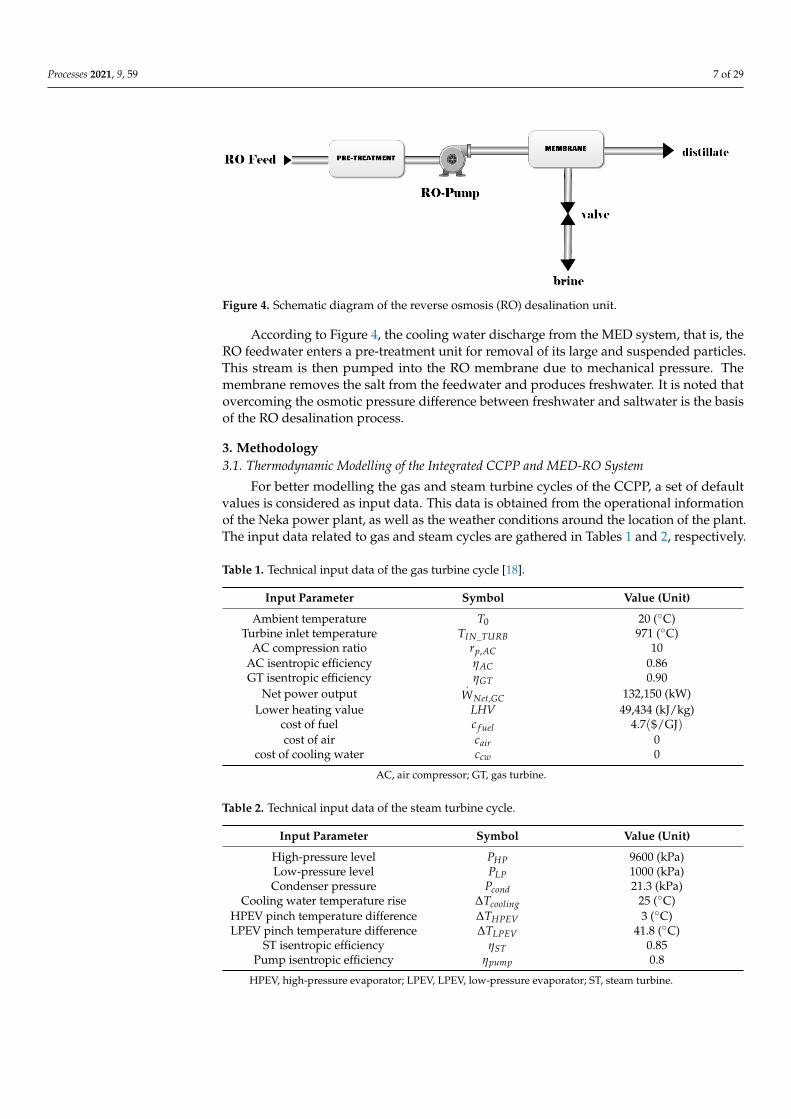
Figure 4. Schematic diagram of the reverse osmosis (RO) desalination unit.
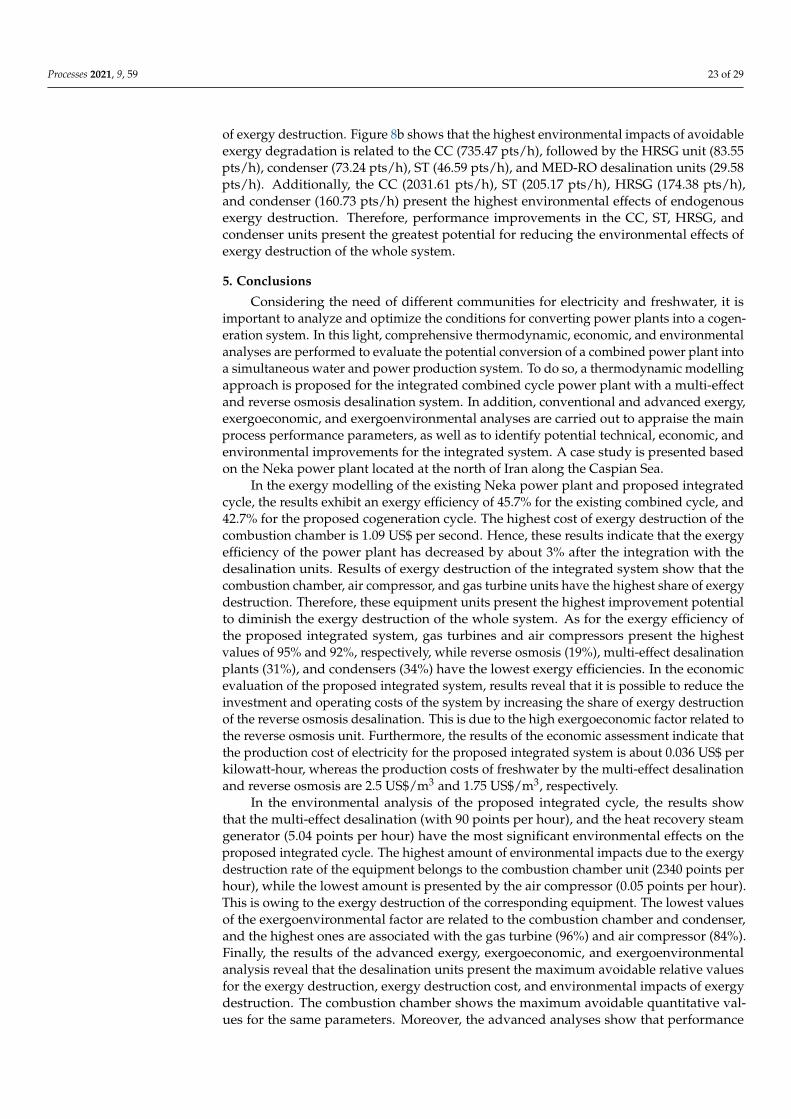
According to Figure 4, the cooling water discharge from the MED system, that is, theRO feedwater enters a pre-treatment unit for removal of its large and suspended particles.This stream is then pumped into the RO membrane due to mechanical pressure. Themembrane removes the salt from the feedwater and produces freshwater. It is noted thatovercoming the osmotic pressure difference between freshwater and saltwater is the basisof the RO desalination process.
3. Methodology3.1. Thermodynamic Modelling of the Integrated CCPP and MED-RO System
For better modelling the gas and steam turbine cycles of the CCPP, a set of defaultvalues is considered as input data. This data is obtained from the operational informationof the Neka power plant, as well as the weather conditions around the location of the plant.The input data related to gas and steam cycles are gathered in Tables 1 and 2, respectively.
Table 1. Technical input data of the gas turbine cycle [18].
Input Parameter Symbol Value (Unit)
Ambient temperature T0 20 (◦C)Turbine inlet temperature TIN_TURB 971 (◦C)
AC compression ratio rp,AC 10AC isentropic efficiency ηAC 0.86GT isentropic efficiency ηGT 0.90
Net power output.
WNet,GC 132,150 (kW)Lower heating value LHV 49,434 (kJ/kg)
cost of fuel c f uel 4.7($/GJ)cost of air cair 0
cost of cooling water ccw 0
AC, air compressor; GT, gas turbine.
Table 2. Technical input data of the steam turbine cycle.
Input Parameter Symbol Value (Unit)
High-pressure level PHP 9600 (kPa)Low-pressure level PLP 1000 (kPa)Condenser pressure Pcond 21.3 (kPa)
Cooling water temperature rise ∆Tcooling 25 (◦C)HPEV pinch temperature difference ∆THPEV 3 (◦C)LPEV pinch temperature difference ∆TLPEV 41.8 (◦C)
ST isentropic efficiency ηST 0.85Pump isentropic efficiency ηpump 0.8
HPEV, high-pressure evaporator; LPEV, LPEV, low-pressure evaporator; ST, steam turbine.

Processes 2021, 9, 59 8 of 29
Multi-effect desalination systems are composed by several identical desalinationeffects. Therefore, there are several identical devices that are used many times. Formodelling purposes, each device is modelled separately in this study. Then, the overallmodel of the system is thermodynamically analyzed by providing a suitable equation toconnect its different parts. The input data for the thermodynamic modelling of the MEDunit is given in Table 3.
Table 3. Technical input data of multi-effect distillation with thermal vapor compression (MED)unit [19].
Input Parameter Symbol Value (Unit)
Number of effects n 6Distillate rate
.mD 20 (kg/s)
Steam saturation temperature TS 70 (◦C)Seawater salinity XSW 35 (g/kg)
Terminal temperature difference ∆TTER 2 (◦C)Recovery ratio RR 0.3
Last effect temperature Te f f _n 48 (◦C)Seawater temperature rise in MED condenser ∆TSW 24 (◦C)
Steam returned pressure PSr 490 (kPa)Distillate delivered pressure PD 450 (kPa)
The following assumptions are considered to simplify the mathematical modellingapproach [19]:
i. The operating conditions of the desalination plant are considered to be steady-state.ii. The heat transfer plates are large enough to convert all vapor into a saturated liquid
according to the operating pressure of each effect.iii. Seawater is incompressible, and its properties can be expressed as a function of
only temperature and salinity.iv. Energy losses to the environment are negligible.v. The outlet temperature of brine and freshwater from each MED desalination effect
are equal to the temperature of the corresponding effect.
The number of equations which need to be solved simultaneously is quite large. Ad-ditionally, the user determines the number of effects which varies the size of equationssystem. In order to reduce complexity, the simulation of the MED unit is performed viaEES software. However, the remaining components of the integrated CCPP and MED-ROdesalination system are modelled and solved in MATLAB software. The main thermody-namic governing equations of MED and RO processes are presented in Tables A1 and A2(see Appendix A), respectively. The thermo physical properties of water and steam streamshave been determined using IAPWS [20]. Properties of gaseous streams can be obtainedusing correlations presented by Dincer et al. [21] and Valero et al. [22]. Additionally, databank of EES software provides the thermo physical properties of brine streams.
3.2. Conventional Exergy Analysis
Exergy is defined as the useful part of energy which is capable to produce work. Thisparameter provides the basis for many studies by quantifying energy quality. An energyflow can have a large energy amount but low or even zero quality value. For example,the heat that exists at ambient temperature and pressure has zero quality, owing to itsinability to produce work. Therefore, the concept of exergy adds a valuable and usefulview to thermodynamic studies. Any flow or fluid has an amount of exergy. Each fluidhas a potential exergy due to its material and nature, which is called chemical exergy. Inthis study, the physical and chemical exergy values of each process stream are estimated

Processes 2021, 9, 59 9 of 29
by Equations (1) and (2), respectively. The specific chemical exergy for methane can becalculated by Equation (3) as follows [18].
exPH = (h− h0)− T0(s− s0) (1)
exCH = ∑ xkexCHk + RT0∑ xk ln(xk) (2)
exCHmethane = 1.037× LHVmethane (3)
The chemical exergy associated with seawater streams in kJ/kmol (molar basis) isobtained by Equation (4) [23,24]:
exCHsw = ns(µs − µ0
s )− nw(µw − µ0w) (4)
In which, ns and nw indicate the moles number of salt and water in seawater, respec-tively. Additionally, µs is the molar chemical potential related to salt in seawater (kJ/kmol),and µw is that of water (kJ/kmol). The superscript zero determines the dead state asindicated by µ0 = f (P0, T0, salinity0), and salinity0 = salinity f eed.
The chemical exergy related to seawater streams can be estimated by Equation (5) asfollows (kJ/kg) [23,24]:
exCHsw = m fs(µ
∗s − µ0
s )−m fw(µ∗
w − µ0w) (5)
In which, m fs and m fw are the mass fraction of salt and water in seawater, respectively.Moreover, µ∗s and µ∗w are the chemical potential associated with salt and water in seawater(kJ/kg), correspondingly. The superscript * indicates the restricted dead state so thatµ∗ = f (P0, T0, salinityi−th stream).
The overall exergy of each stream is obtained as follows [18,21]:
exi = exCHi + exPH
i (6)
The exergy rate of each stream can be calculated by Equation (7) [18,21].
.Exi =
.mi · exi (7)
One of the important concepts of exergy analysis is the exergy destruction parameter,which is defined as the irreversibility rate of the system. In the ideal and reversible systems,the total inlet and outlet exergy flows of the system are equal. However, in real systemswith irreversibility effects such as chemical reactions, transient heating, friction, etc., thetotal exergy of the output flows from the system is lower than the total exergy of theinput flows to the system, which is presented as the exergy destruction of that system.The exergy destruction rate and exergy efficiency of each equipment can be obtained byEquations (8) and (9), respectively [18,21].
.ExD,k =
.ExF,k −
.ExP,k (8)
εk =
.ExP,k.ExF,k
(9)
The mathematical formulation for obtaining the exergy destruction of each componentin the integrated system is presented in Table 4.

Processes 2021, 9, 59 10 of 29
Table 4. Exergy destruction formulation for different system components.
System Component Exergy Destruction Equation
AC.
WAC − Ex2 + Ex1GT Ex3 − Ex4 −
.WGT
ST Ex32 + Ex26 − Ex16 −.
WSTCC ExF + Ex2 − Ex3
Condenser Ex16 − Ex17 − ExCW_out + ExCW_inMED Ex33 + Ex35 − Ex34 − Ex36 − Ex37 − Ex38RO Ex36 +
.WRO_pump − Ex39
Condenser Pump.
WCOND_pump − Ex19 + Ex18
AC, air compressor; CC, combustion chamber; GT, gas turbine; MED, multi-effect distillation; RO,reverse osmosis; ST, steam turbine.
3.3. Conventional Exergoeconomic Analysis
In the exergoeconomic modelling and evaluation, expenditures are related to eachexergy stream. Table A3 shows the capital investment of each system component (see theAppendix A).
The cost rate of the equipment can be obtained by Equation (10) [21].
.Zk =
Φk · PECk · CRF3600 · N (10)
In which, Φk indicates the maintenance factor (equal to 1.06 in this work [18,21]),while N is the annual operating hours (8000 h) [18,21], and CRF is the capital recoveryfactor as given by [18]:
CRF =i · (1 + i)ny
(1 + i)ny − 1(11)
In Equation (11), i represents the interest rate and ny the plant lifetime (25 years) [18,21].The exergoeconomic balance formulation is expressed as follows [18].
.CP,k =
.CF,k −
.CL,k +
.Zk (12)
∑e
.Ce,k +
.Cw,k =
.Cq,k −∑
i
.Ci,k +
.Zk (13)
.Ci = ci ·
.Exi (14)
The exergy cost of destruction of each system component is given as follows [18].
.CD,k = cF,k ·
.ExD,k (15)
The exergoeconomic factor for each equipment can be estimated by Equation (16) [18].
fk =
.Zk
.Zk + c f ,k ·
.ExD,k
(16)
The relative cost difference can be obtained by the following equation [18].
rk =cP,k − cF,k
cF,k=
1− εkεk
+
.Zk
c f ,k ·.ExP,k
(17)

Processes 2021, 9, 59 11 of 29
3.4. Conventional Exergoenvironmental Analysis
The exergoenvironmental analysis consists of three phases. First, exergy analysis iscarried out for each process stream. Then, the environmental impacts of the manufacturingprocess are estimated for each component. Finally, the exergoenvironmental equationsare implemented to predict the environmental impact of each stream based on the exergyanalysis. The exergoenvironmental analysis for each equipment is performed via thefollowing formulation [25].
.BP,k =
.BF,k −
.BL,k +
.Yk (18)
∑e
.Be,k +
.Bw,k =
.Bq,k −∑
i
.Bi,k +
.Yk (19)
.Bi = bi ·
.Exi (20)
The environmental impact rate associated with the exergy destruction of each systemcomponent is given by Equation (21) [25].
.BD,k = bF,k ·
.ExD,k (21)
The exergoenvironmental factor for each equipment can be calculated by Equation (22) [25].
f bk =
.Yk
.Yk + b f ,k ·
.ExD,k
(22)
The relative environmental impact difference is determined as follows [25].
rbk =bP,k − bF,k
bF,k=
1− εkεk
+
.Yk
b f ,k ·.ExP,k
(23)
The environmental impact of each equipment can be obtained by Equation (24) [25]:
yk = wk · bmk (24)
In which, yk is the environmental impact of the equipment in points (pts), while wkis the weight of the equipment in tons. bmk represents the environmental impact permass unit of the equipment in pts/ton, which is a function of the material used in themanufacturing process of the different system components. The latter can be obtained fromthe Eco-indicator 99 methodology through the determination of the material compositionrelated to each component [26]. The weight function associated with each equipment unitis given in Table 5.
The environmental impact rate of the RO unit in mpts/(h m3) is estimated by thefollowing equation [27]:
.YRO = 0.0195
ρ ·.
WRO
3600 · .mRO−distillate
+ 0.00595 (25)
The environmental impact rate of the MED unit is equal to.
YMED = 1.277 mpts/(h m3) [27].In addition, as input information is required for solving the problem, the environmentalimpacts of the equipment weight unit are listed in Table 6.

Processes 2021, 9, 59 12 of 29
Table 5. Weight function associated with each system component [25].
System Component Weight Equation (Tons)
AC100·Pe ·dAC ·FSAC
2·σAC
FSAC = 2 : safety factor of ACσAC = 16 : ruptering stress of AC in MPa
dAC = 15 m/s : diameter considering.
m and velocity
CC100·Pe ·dCC ·FSCC
2·σCC
FSCC = 2 : safety factor of CCσCC = 45 : ruptering stress of CC in MPa
dCC = 6.2 m/s : diameter considering˙
m and velocity
GT100·Pe ·dGT ·FSGT
2·σGT
FSGT = 2: safety factor of GTσGT = 6 : ruptering stress of GT in MPa
dGT = 13 m/s : diameter considering˙
m and velocitySuperheater 8.424 ·
.Q
0.87SH ,
.Q in MW
Deaerator 2.49 · .mw
0.7
Pump 0.0061 ·.
W0.95Pump,
.W in KW
Evaporator 13.91 ·.
Q0.68EV ,
.Q in MW
Economizer 2.989 ·.
Q0.97EC ,
.Q in MW
MED Environmental Impact of MED can be calculateddirectlyand independent of its weight
RO Environmental Impact of RO can be calculated directlyandindependent of its weight
ST 4.9 ·.
W0.73
,.
W in MWAC, air compressor; CC, combustion chamber; GT, gas turbine; MED, multi-effect distillation; RO, reverse osmosis;ST, steam turbine.
Table 6. Environmental impacts of the equipment weight unit.
System Component Composition bmk (pts/ton)
AC Steel 33.33%, steel low alloy44.5%, cast iron 22.22% 71.7
CC Steel 33.34%, steel high alloy66.66% 585.0
GT Steel 25%, steel high alloy 75% 645.7Superheater Steel 26%, steel high alloy 74% 638.0Evaporator Steel 100% 28.0Economizer Steel 100% 28.0
Pump Steel 35%, cast iron 65% 132.8Condenser Steel 100% 28.0
ST Steel 25%, steel high alloy 75% 646AC, air compressor; CC, combustion chamber; GT, gas turbine; ST, steam turbine.
3.5. Advanced Exergy Analysis
Exergy analysis has two important indicators that provide a relative understanding ofprocess energy performance: exergy destruction and exergy efficiency. These two indicatorsof exergy analysis show how a device works in terms of quality of energy consumption.They also allow to determine which equipment does not have good exergy performance,and wastes useful work in a process. Advanced exergy analysis is based on the results ofthe exergy analysis. Therefore, the input data of the advanced analysis are the irreversibilityand efficiency of the related process equipment. The main idea behind the advanced exergyanalysis is the irreversible division of a system device. Irreversibility that occurs in a deviceis not only due to the thermodynamic malfunction of the equipment itself, but also to theperformance of other components in which it is associated with in the process. Althoughthe exergy analysis can be used to determine the irreversibilities of a device in a more

Processes 2021, 9, 59 13 of 29
accurately and easily way, it is not able to classify such irreversibilities regarding theirorigin [17]. In other words, conventional exergy analysis is unable to determine the deviceirreversibilities originated by other means than the function of the device itself. However,this can be done by an advanced exergy analysis. In this type of analysis, equipmentirreversibility is divided into two perspectives: one from the origin of irreversibility, andanother from the ability to eliminate such irreversibility. From the origin point of view, theirreversibility of each device is divided into two categories: endogenous and exogenousirreversibility. Still, from the ability to eliminate perspective, the irreversibility of eachdevice is classified as avoidable and unavoidable [28]. The advanced energy analysis ispresented in the following sections.
3.5.1. Endogenous and Exogenous Irreversibility
In a system with n elements, the endogenous exergy destruction of the k-th element isthat part of the exergy destruction that depends on the irreversibility of that componentitself. The destruction of endogenous exergy is achieved when the element operates inreal conditions, whereas other elements operate in theoretical conditions and without anyirreversibility. Equation (26) indicates the relation between endogenous, exogenous, andreal exergy destruction for component k [29].
.ExEX
D,k =.Exreal
D,k −.ExEN
D,k (26)
3.5.2. Avoidable and Unavoidable Irreversibility
The part of exergy destruction that cannot be avoided by changes in system designtechnology to improve its thermodynamic and physical conditions is called avoidableexergy destruction. These conditions are provided when the destruction tends to be theminimum value, and the temperature differences and pressure drop in the elements areas low as possible. In many studies, the conditions applied to the unavoidable state aresuggested by the author’s knowledge and experience on the possibility of maximizingthe potential of the element to be improved. After estimating the unavoidable exergydestruction, the amount of avoidable exergy destruction is calculated as follows [29].
.ExAV
D,k =.Exreal
D,k −.ExUN
D,k (27)
3.5.3. Combination of Endogenous/Exogenous and Avoidable/Unavoidable Irreversibility
The avoidable exergy destruction is divided into endogenous and exogenous cate-gories. Endogenous avoidable exergy destruction is the part of exergy destruction thatoccurs due to the irreversibility of the elements themselves and can be avoided. Therefore,with the improvement of the efficiency of this element, the amount of its endogenousexergy destruction will be reduced. Exogenous avoidable exergy destruction is also causedby irreversibility in other elements, but because it is avoidable, the exogenous avoidable ex-ergy destruction can be reduced by improving the efficiency of other elements of the cycle.On the other hand, the endogenous and exogenous unavoidable exergy destruction arecaused by the limitations of the element’s technology, as well as the irreversible effect andtechnological limitations of other elements. The endogenous and exogenous unavoidableexergy destruction for the elements are estimated as follows:
.ExUN,EN
D,k =.ExEN
p,k (.ExD/
.ExP)
UNk (28)
.ExUN,EX
D,k =.ExUN
D,k −.ExUN,EN
D,k (29)
Endogenous avoidable exergy destruction and exogenous avoidable exergy destruc-tion are obtained by subtracting endogenous unavoidable and exogenous unavoidable

Processes 2021, 9, 59 14 of 29
exergy destruction, from endogenous exergy destruction and exogenous exergy destruction,respectively, as follows:
.ExAV,EN
D,k =.ExEN
D,k −.ExUN,EN
D,k (30).ExAV,EX
D,k =.ExEX
D,k −.ExUN,EX
D,k (31)
Therefore, the exergy destruction of the k-th element can be written as follows:
.Exreal
D,k =.ExUN,EN
D,k +.ExUN,EX
D,k +.ExAV,EN
D,k +.ExAV,EX
D,k (32)
3.6. Advanced Exergoeconomic Analysis
Similarly to the previous discussions on advanced exergy analysis, in advanced exer-goeconomic analysis, the cost of exergy destruction of each component is divided into fourparts: endogenous, exogenous, avoidable, and unavoidable cost of exergy destruction [29].
3.6.1. Endogenous and Exogenous Cost of Exergy Destruction
The endogenous cost of exergy destruction is the part of the exergy destruction costthat depends on the performance of the k-th element itself, the internal irreversibility ofthis element, and the average fuel cost per exergy unit of the component. The exogenouscost rate of exergy destruction is also the part of the exergy destruction cost that is exertedby the other elements on the k-th element. The rate of endogenous exergy destruction isobtained by implementing real conditions to the element itself, and theoretical conditionsto other elements. The endogenous cost rate of exergy destruction and the exogenous costrate of exergy destruction are obtained as follows [30].
.C
END,k = cF,k ·
.ExEN
D,k (33)
.C
EXD,k = cF,k ·
.ExEx
D,k (34)
Therefore, the total cost of exergy destruction in both endogenous and exogenousstates is equal to the total cost of exergy destruction:
.C
realD,k = cF,k ·
.Exreal
D,k =.C
END,k +
.C
EXD,k (35)
3.6.2. Avoidable and Unavoidable Cost of Exergy Destruction
The rate of the cost of exergy destruction in the avoidable and unavoidable conditionsis given by the following equations.
.C
UND,k = cF,k ·
.ExUN
D,k (36)
.C
AVD,k = cF,k ·
.ExAV
D,k (37)
The cost rate of unavoidable exergy destruction is the cost of the fuel required toprovide avoidable exergy destruction in the component, while the product exergy of thecomponent is considered to be constant. Additionally, the sum of the avoidable andunavoidable exergy destruction cost rate is equal to the total cost rate of exergy destructionof the component, as shown as follows:
.C
realD,k = cF,k ·
.Exreal
D,k =.C
UND,k +
.C
AVD,k (38)

Processes 2021, 9, 59 15 of 29
3.6.3. Combination of Endogenous/Exogenous and Avoidable/Unavoidable Cost ofExergy Destruction
The combination of the cost of exergy destruction into different sections can be writtenas follows:
.C
EN,AVD,k = cF,k ·
.ExEN,AV
D,k (39)
.C
EN,UND,k = cF,k ·
.ExEN,UN
D,k (40)
.C
EX,AVD,k = cF,k ·
.ExEX,AV
D,k (41)
.C
EX,UND,k = cF,k ·
.ExEX,UN
D,k (42)
In Equation (39),.C
EN,AVD,k indicates the cost rate of endogenous avoidable exergy
destruction of the k-th element, which depends on the performance of the element itself.Therefore, by optimizing the condition of this element, its amount can be improved. In
Equation (41),.C
EX,AVD,k is the cost rate of exogenous avoidable exergy destruction of the k-th
element, which can be improved by optimizing the conditions of other elements of the
cycle..C
EN,UND,k and
.C
EX,UND,k are the cost rate of endogenous unavoidable exergy destruction,
and the cost rate of exogenous unavoidable exergy destruction of the k-th component,respectively.
3.7. Advanced Exergoenvironmental Analysis
Similarly to the discussions on advanced exergy analysis, in advanced exergoenvi-ronmental analysis, the environmental impact of exergy destruction of each component isdivided into four parts: endogenous, exogenous, avoidable, and unavoidable environmen-tal impact of exergy destruction [31].
3.7.1. Endogenous and Exogenous Environmental Impact of Exergy Destruction
The endogenous environmental impact of exergy destruction is the part of the exergydestruction environmental impact that depends on the performance of the k-th elementitself, the internal irreversibility of this element, and the average fuel environmental impactper exergy unit of the component. The exogenous environmental impact rate of exergydestruction is also the part of the exergy destruction environmental impact that is exertedby the other elements on the k-th element. The rate of endogenous exergy destruction isobtained by implementing real conditions to the element itself, and theoretical conditions toother elements. The endogenous environmental impact rate of exergy destruction and theexogenous environmental impact rate of exergy destruction are obtained as follows [30].
.B
END,k = bF,k ·
.ExEN
D,k (43)
.B
EXD,k = bF,k ·
.ExEX
D,k (44)
Therefore, the total environmental impact of exergy destruction in both endogenousand exogenous states is equal to the total environmental impact of exergy destruction.
.C
realD,k = cF,k ·
.Exreal
D,k =.C
END,k +
.C
EXD,k (45)
3.7.2. Avoidable and Unavoidable Environmental Impact of Exergy Destruction
The rate of the environmental impact of exergy destruction in the avoidable andunavoidable conditions are given by the following equations:
.B
UND,k = bF,k ·
.ExUN
D,k (46)

Processes 2021, 9, 59 16 of 29
.B
AVD,k = bF,k ·
.ExAV
D,k (47)
The environmental impact rate of unavoidable exergy destruction refers to the en-vironmental impact of the fuel required to provide avoidable exergy destruction in thecomponent, while the product exergy of the component is considered to be constant. Ad-ditionally, the sum of the avoidable and unavoidable exergy destruction environmentalimpact rate is equal to the total environmental impact rate of exergy destruction of thecomponent, as shown as follows:
.B
realD,k = bF,k ·
.Exreal
D,k =.B
UND,k +
.B
AVD,k (48)
3.7.3. Combination of Endogenous/Exogenous and Avoidable/UnavoidableEnvironmental Impact of Exergy Destruction
The combination of the environmental impact of exergy destruction into differentsections can be written as follows:
.C
EN,AVD,k = cF,k ·
.ExEN,AV
D,k (49)
.C
EN,UND,k = cF,k ·
.ExEN,UN
D,k (50)
.C
EX,AVD,k = cF,k ·
.ExEX,AV
D,k (51)
.C
EX,UND,k = cF,k ·
.ExEX,UN
D,k (52)
In Equation (49),.C
EN,AVD,k represents the environmental impact rate of endogenous
avoidable exergy destruction of the k-th element, which depends on the performance of theelement itself. Therefore, by optimizing the condition of this element, its amount can be
improved. In Equation (51),.C
EX,AVD,k indicates the environmental impact rate of exogenous
avoidable exergy destruction of the k-th element, which can be improved by optimizing
the conditions of other elements of the cycle..C
EN,UND,k and
.C
EX,UND,k are the environmental
impact rate of endogenous unavoidable exergy destruction, and the environmental impactrate of exogenous unavoidable exergy destruction of the k-th component, respectively.
4. Results and Discussion4.1. Validation of Thermodynamic Results
Table 7 presents the verification of the MATLAB thermodynamic simulation resultsobtained for the RO desalination unit in comparison with other studies from the literature.The results show a good agreement with those attained by Al-Zahrani et al. [3] and Zhouet al. [32]. Table 8 displays the validation of the thermodynamic simulation results obtainedfor the MED unit via the Thermoflex software. Overall, the MED results also show goodagreement with those from the thermodynamic modelling in Thermoflex (which is basedon real plant data) with errors lower than 4%. In Tables A4 and A5 (see Appendix A),the main process parameters obtained from thermodynamic modelling in Thermoflex,and the proposed MATLAB modelling approach are compared for the different processstreams and system components, respectively. As it is shown, the results of thermodynamicsimulation in MATLAB and Thermoflex software are also in an appropriate agreementwith each other.

Processes 2021, 9, 59 17 of 29
Table 7. Comparison of the obtained reverse osmosis (RO) simulation results with the literature.
ThermodynamicParameters (Unit)
Present Study(MATLAB) Al-Zahrani et al. [3] Zhou et al. [32]
Feed Pressure (bar) 50 50 50Feed Salinity (%) 3 3 3Recovery Ratio 0.5008 0.51 0.481
Table 8. Validation of the multi-effect desalination (MED) results obtained by the proposed approach.
ThermodynamicParameters (Unit)
Present Study(MATLAB) Thermoflex Error (%)
No. of effects 6 6 0.000GOR 5.41 5.32 1.69SA 321.89 332.1 3.07
.msteam(kg/s) 3.28 3.22 1.86
.mdistillate(kg/s) 20.00 20.00 0.00
The results obtained from thermodynamic modelling of the existing combined cycle ofNeka power plant indicate the consumption of 8.43 kg of fuel per second to simultaneouslyproduce 132.15 MW of gas power, and 80 MW of steam power. To integrate the existingNeka power cycle with MED-RO desalination systems, a stream is extracted from thelow-pressure section of the combined cycle to satisfy the stimulus vapor of the multi-effectdesalination water with a mass flowrate of 3.6 kg/s. Additionally, the mass flowrate outputof the cooling water section of the MED desalination plant is used as the inlet flow of theRO desalination section. The multi-effect thermal desalination unit produces around 20 kgof freshwater per second from an inlet seawater mass flowrate of about 12.48 kg/s. TheRO desalination unit is capable of producing 6.54 kg of freshwater per second. Moreover,the calculations performed on the proposed integrated water and power cycle indicates a3.79% increase in fuel consumption compared to the conditions before the integration. Thethermodynamic calculations of the proposed integrated cycle also show that total powerproduction of the plant is reduced by 19%, in order to produce 26.54 kg of freshwater persecond. Under these conditions, the energy efficiency of the Neka power plant decreasesby 2.49% (from 47.98% to 45.49%) after the integration with desalination units.
4.2. Conventional Exergy, Exergoeconomic, and Exergoenvironmental Results
After modelling the integrated system and implementing conventional exergy, exer-goeconomic, and exergoenvironmental analyses, different parameters are estimated foreach of the process streams and components. Table A6 (see Appendix A) shows the resultsof thermodynamic, exergy, economic, and environmental analyses for each stream in thesystem. The corresponding results obtained for different system components are presentedin Table 9. The results presented in Table 9 reveal that the exergy efficiencies of the MED(31.59%) and RO (19.51%) desalination units, and condensers (34.56%) are relatively lowerwhen compared to other components. The GT unit presents the highest exergy efficiencyof 95.87%. The exergoeconomic efficiencies of the CC (1.87%) and condenser (1.46%) arerelatively lower when compared to other components. This is due to the high cost andenvironmental effects of exergy degradation on these two components. Thus, these com-ponents have great potential to improve the system performance, because their exergydestruction has a significant undesired impact on the environment and costs. Improvingthese components’ performance will obviously come at the expense of a cost increase. Inaddition, the HRSG (2.19%) and condenser (0.003%) have comparatively low exergoen-vironmental factors, which indicate that the exergy destruction of these components hashigh adverse effects on the environment. Therefore, it is possible to reduce the exergydestruction of these components for decreasing the environmental impacts of the integratedsystem. Still, spending cost and improving the performance of the condenser due to its low

Processes 2021, 9, 59 18 of 29
exergy-economic and exergy-environmental coefficients are among the effective proposalsto reduce costs and environmental effects of the exergy destruction of this unit.
Table 9. Conventional exergy, economic, and environmental results for different system components.
SystemComponent
Z(US$/h) f (%) r (%)
.CD
(US$/h)
.Y
(mpts/h)fb (%)
.BD
(pts/h)ε (%)
AC 140.33 27.73 10.43 365.76 288.94 84.69 0.05 92.99CC 74.94 1.87 43.50 3925.62 1463.62 0.06 2352.76 70.08GT 172.63 30.77 6.22 388.46 2944.96 96.75 0.10 95.87
Condenser 79.55 1.46 11.38 462.29 6.37 0.003 224.33 34.56ST 6.85 15.97 189.35 418.66 1552.86 0.64 242.26 84.96
MED 12.15 7.18 237.73 117.54 92,937.26 56.91 52.75 31.59RO 38.86 82.24 479.90 8.39 2823.66 36.49 4.91 19.51PRE 39.58 31.68 113.22 85.36 31.65 0.06 50.88 56.38
LPEC 22.49 83.75 132.70 4.36 4.00 0.15 2.60 82.26HPEC1 40.07 54.32 57.69 33.69 29.68 0.15 20.08 79.14LPEV 35.45 46.84 38.12 40.23 65.17 0.27 23.98 83.15LPSH 41.40 95.42 296.14 1.99 1559.06 56.84 1.18 88.06
HPEC2 87.99 67.54 26.88 42.29 94.19 0.37 25.20 91.98HPEV 107.45 47.27 19.04 119.87 175.22 0.24 71.45 90.88HPSH 57.58 50.96 15.89 55.40 3159.00 8.73 33.02 92.77HRSG 432.01 52.99 25.09 383.19 5118 2.19 228.39 84.79
AC, air compressor; CC, combustion chamber; GT, gas turbine; ST, steam turbine; MED, Multi Effect Desalination;RO, Reverse Osmosis; PRE, Preheater; LPEC, Low Pressure Economiser; HPEC1, High Pressure Economiser1;LPEV, Low Pressure Evaporator; LPSH, Low Pressure Superheater; HPEC2, High Pressure Economiser2; HPEV,High Pressure Evaporator; HPSH, High Pressure Superheater; HRSG, Heat Recovery Steam Generator.
Table 9 also shows that the relative cost difference of the MED system (237.73%) issignificantly smaller than that of the RO desalination unit (479.9%). This observationindicates that the cost of freshwater produced relative to the cost of fuel required for theMED unit, is lower than that of RO desalination unit. Still, according to Table 9, gasturbines present the highest investment cost of 0.047 US$ per second, while the MEDexhibits the highest environmental impact rate of 0.025 points per second. It should alsobe noted that the cost of exergy destruction and environmental effects imposed by exergydestruction on equipment are higher for the CC, GT, and ST units, when contrasted to otherdevices. Hence, improvements in the performance of these devices can reduce their exergydestruction and avoid cost wastage, as well as prevent the imposition of environmentaleffects by exergy destruction. This is because the exergy destruction of these componentshas higher adverse economic and environmental effects. One of the important outputsof exergy analysis is the distribution of exergy destruction between different parts ofthe system. Figure 5 depicts the distribution of exergy destruction between the differentequipment in the integrated system.
According to Figure 5, the CC exhibits the highest share of exergy destruction (57%).The GT and HRSG units present 9% both, while the MED-RO desalination units accountfor only 2% of the exergy destruction in the system. Thus, these results reveal that thehighest rate of exergy destruction is related to the gas turbine cycle in the CCPP. Therefore,reducing the share of the destruction of the gas turbine cycle can have a positive effect onthe destruction of the entire plant.
Processes 2021, 9, 59 19 of 29����������������� ��������������� ���������
�
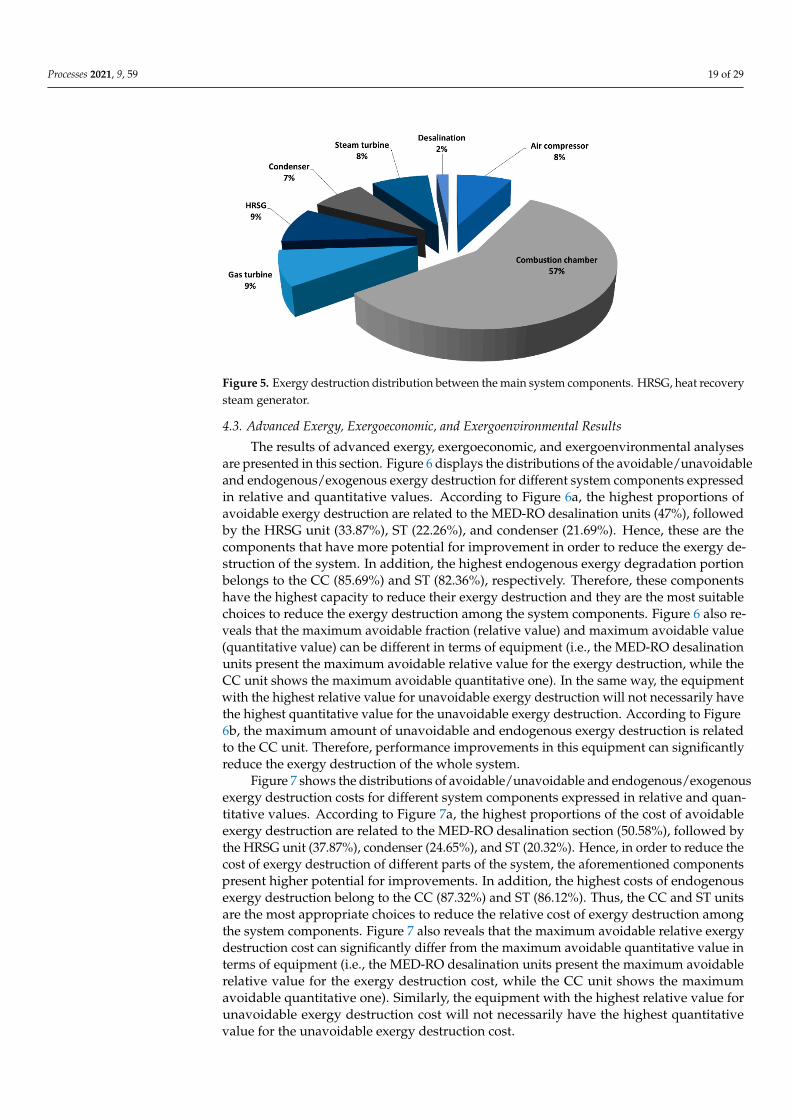
��������� ���!"#$�%!&'"()'*�+�%*&'"*,('*�+�,!'-!!+�'.!�/0*+�&$&'!/�)�/1�+!+'&2�3�45�.!0'�"!6)�7!"$�&'!0/�#!+!"0'�"2�89:9�;<=>?��<�@A��BCD�@A��B����?�EF�D�>?<�@A��B��?=F��?E�?G>H�I��JHG��K.!�"!&(L'&����0%70+)!%�!�!"#$�!�!"#�!)�+�/*)�0+%�!�!"#�!+7*"�+/!+'0L�0+0L$&!&�0"!�1"!&!+'!%�*+�'.*&�&!)'*�+2� *#("!�M�%*&1L0$&�'.!�%*&'"*,('*�+&����'.!�07�*%0,L!N(+07�*%60,L!�0+%�!+%�#!+�(&N!��#!+�(&�!�!"#$�%!&'"()'*�+���"�%*��!"!+'�&$&'!/�)�/1�+!+'&�!�61"!&&!%�*+�"!L0'*7!�0+%�O(0+'*'0'*7!�70L(!&2�P))�"%*+#�'�� *#("!�M0�'.!�.*#.!&'�1"�1�"6'*�+&����07�*%0,L!�!�!"#$�%!&'"()'*�+�0"!�"!L0'!%�'��'.!�Q�R6���%!&0L*+0'*�+�(+*'&�STUVW���LL�-!%�,$�'.!�3�45�(+*'�S��2XUVW�4K�S��2�MVW�0+%�)�+%!+&!"�S�Y2MZVW2�3!+)!�'.!&!�0"!�'.!�)�/1�+!+'&�'.0'�.07!�/�"!�1�'!+'*0L���"�*/1"�7!/!+'�*+��"%!"�'��"!%()!�'.!�!�6!"#$�%!&'"()'*�+����'.!�&$&'!/2��+�0%%*'*�+�'.!�.*#.!&'�!+%�#!+�(&�!�!"#$�%!#"0%0'*�+�1�"'*�+�,!L�+#&�'��'.!�[[�SX\2MZVW�0+%�4K�SX�2�MVW�"!&1!)'*7!L$2�K.!"!��"!�'.!&!�)�/61�+!+'&�.07!�'.!�.*#.!&'�)010)*'$�'��"!%()!�'.!*"�!�!"#$�%!&'"()'*�+�0+%�'.!$�0"!�'.!�/�&'�&(*'0,L!�).�*)!&�'��"!%()!�'.!�!�!"#$�%!&'"()'*�+�0/�+#�'.!�&$&'!/�)�/1�+!+'&2� *#("!�M�0L&��"!7!0L&�'.0'�'.!�/0�*/(/�07�*%0,L!��"0)'*�+�S"!L0'*7!�70L(!W�0+%�/0�*/(/�07�*%06,L!�70L(!�SO(0+'*'0'*7!�70L(!W�)0+�,!�%*��!"!+'�*+�'!"/&����!O(*1/!+'�S*2!2�'.!�Q�R6���%!&0L*+0'*�+�(+*'&�1"!&!+'�'.!�/0�*/(/�07�*%0,L!�"!L0'*7!�70L(!���"�'.!�!�!"#$�%!&'"()6'*�+�-.*L!�'.!�[[�(+*'�&.�-&�'.!�/0�*/(/�07�*%0,L!�O(0+'*'0'*7!��+!W2��+�'.!�&0/!�-0$�'.!�!O(*1/!+'�-*'.�'.!�.*#.!&'�"!L0'*7!�70L(!���"�(+07�*%0,L!�!�!"#$�%!&'"()'*�+�-*LL�+�'�+!)!&&0"*L$�.07!�'.!�.*#.!&'�O(0+'*'0'*7!�70L(!���"�'.!�(+07�*%0,L!�!�!"#$�%!&'"()'*�+2�P))�"%*+#�'�� *#("!�M,�'.!�/0�*/(/�0/�(+'����(+07�*%0,L!�0+%�!+%�#!+�(&�!�!"#$�%!&'"()'*�+�*&�"!L0'!%�'��'.!�[[�(+*'2�K.!"!��"!�1!"��"/0+)!�*/1"�7!/!+'&�*+�'.*&�!O(*16/!+'�)0+�&*#+*�*)0+'L$�"!%()!�'.!�!�!"#$�%!&'"()'*�+����'.!�-.�L!�&$&'!/2� *#("!�U�&.�-&�'.!�%*&'"*,('*�+&����07�*%0,L!N(+07�*%0,L!�0+%�!+%�#!+�(&N!��#!6+�(&�!�!"#$�%!&'"()'*�+�)�&'&���"�%*��!"!+'�&$&'!/�)�/1�+!+'&�!�1"!&&!%�*+�"!L0'*7!�0+%�O(0+'*'0'*7!�70L(!&2�P))�"%*+#�'�� *#("!�U0�'.!�.*#.!&'�1"�1�"'*�+&����'.!�)�&'����07�*%60,L!�!�!"#$�%!&'"()'*�+�0"!�"!L0'!%�'��'.!�Q�R6���%!&0L*+0'*�+�&!)'*�+�S\]2\XVW���LL�-!%�,$�'.!�3�45�(+*'�S�U2XUVW�)�+%!+&!"�S�T2M\VW�0+%�4K�S�]2��VW2�3!+)!�*+��"%!"�'��"!6%()!�'.!�)�&'����!�!"#$�%!&'"()'*�+����%*��!"!+'�10"'&����'.!�&$&'!/�'.!�0��"!/!+'*�+!%�)�/1�+!+'&�1"!&!+'�.*#.!"�1�'!+'*0L���"�*/1"�7!/!+'&2��+�0%%*'*�+�'.!�.*#.!&'�)�&'&����!+%�#!+�(&�!�!"#$�%!&'"()'*�+�,!L�+#�'��'.!�[[�SXU2��VW�0+%�4K�SXM2Y�VW2�K.(&�'.!�[[�0+%�4K�(+*'&�0"!�'.!�/�&'�011"�1"*0'!�).�*)!&�'��"!%()!�'.!�"!L0'*7!�)�&'����!�!"#$�%!&'"()6'*�+�0/�+#�'.!�&$&'!/�)�/1�+!+'&2� *#("!�U�0L&��"!7!0L&�'.0'�'.!�/0�*/(/�07�*%0,L!�"!L0'*7!�!�!"#$�%!&'"()'*�+�)�&'�)0+�&*#+*�*)0+'L$�%*��!"��"�/�'.!�/0�*/(/�07�*%0,L!�O(0+'*'0'*7!�70L(!�*+�'!"/&����!O(*1/!+'�S*2!2�'.!�Q�R6���%!&0L*+0'*�+�(+*'&�1"!&!+'�'.!�/0�*/(/�07�*%0,L!�"!L0'*7!�70L(!���"�'.!�!�!"#$�%!&'"()'*�+�)�&'�-.*L!�'.!�[[�(+*'�&.�-&�'.!�/0�*/(/�07�*%0,L!�O(0+'*'0'*7!��+!W2�4*/*L0"L$�'.!�!O(*1/!+'�-*'.�'.!�.*#.6!&'�"!L0'*7!�70L(!���"�(+07�*%0,L!�!�!"#$�%!&'"()'*�+�)�&'�-*LL�+�'�+!)!&&0"*L$�.07!�'.!�.*#.!&'�O(0+'*'0'*7!�70L(!���"�'.!�(+07�*%0,L!�!�!"#$�%!&'"()'*�+�)�&'2�
Figure 5. Exergy destruction distribution between the main system components. HRSG, heat recoverysteam generator.
4.3. Advanced Exergy, Exergoeconomic, and Exergoenvironmental Results
The results of advanced exergy, exergoeconomic, and exergoenvironmental analysesare presented in this section. Figure 6 displays the distributions of the avoidable/unavoidableand endogenous/exogenous exergy destruction for different system components expressedin relative and quantitative values. According to Figure 6a, the highest proportions ofavoidable exergy destruction are related to the MED-RO desalination units (47%), followedby the HRSG unit (33.87%), ST (22.26%), and condenser (21.69%). Hence, these are thecomponents that have more potential for improvement in order to reduce the exergy de-struction of the system. In addition, the highest endogenous exergy degradation portionbelongs to the CC (85.69%) and ST (82.36%), respectively. Therefore, these componentshave the highest capacity to reduce their exergy destruction and they are the most suitablechoices to reduce the exergy destruction among the system components. Figure 6 also re-veals that the maximum avoidable fraction (relative value) and maximum avoidable value(quantitative value) can be different in terms of equipment (i.e., the MED-RO desalinationunits present the maximum avoidable relative value for the exergy destruction, while theCC unit shows the maximum avoidable quantitative one). In the same way, the equipmentwith the highest relative value for unavoidable exergy destruction will not necessarily havethe highest quantitative value for the unavoidable exergy destruction. According to Figure6b, the maximum amount of unavoidable and endogenous exergy destruction is relatedto the CC unit. Therefore, performance improvements in this equipment can significantlyreduce the exergy destruction of the whole system.
Figure 7 shows the distributions of avoidable/unavoidable and endogenous/exogenousexergy destruction costs for different system components expressed in relative and quan-titative values. According to Figure 7a, the highest proportions of the cost of avoidableexergy destruction are related to the MED-RO desalination section (50.58%), followed bythe HRSG unit (37.87%), condenser (24.65%), and ST (20.32%). Hence, in order to reduce thecost of exergy destruction of different parts of the system, the aforementioned componentspresent higher potential for improvements. In addition, the highest costs of endogenousexergy destruction belong to the CC (87.32%) and ST (86.12%). Thus, the CC and ST unitsare the most appropriate choices to reduce the relative cost of exergy destruction amongthe system components. Figure 7 also reveals that the maximum avoidable relative exergydestruction cost can significantly differ from the maximum avoidable quantitative value interms of equipment (i.e., the MED-RO desalination units present the maximum avoidablerelative value for the exergy destruction cost, while the CC unit shows the maximumavoidable quantitative one). Similarly, the equipment with the highest relative value forunavoidable exergy destruction cost will not necessarily have the highest quantitativevalue for the unavoidable exergy destruction cost.

Processes 2021, 9, 59 20 of 29����������������� ��������������� ���������
�
������������� !"�#$�%&'()&*+(&�,'����-.�&/-*012+,-.�&/-*01�-,/�1,/�31,�+'21��31,�+'�1�1)34�/1'()+5(&�,���)�/&��1)1,(�'4'(16�5�678�,1,('�&,�����)10-(&.1�.-0+1'�-,/�����9+-,(&(-(&.1�.-0+1':�;<�-&)�5�68)1''�)=�<<�5�6*+'(&�,�5>-6*1)=�?@�3-'�(+)*&,1=�A�B?�>1-(�)15�.1)4�'(1-6�31,1)-(�)=�<�,/�5�,/1,'1)=�B@�'(1-6�(+)*&,1=�C�%7���6+0(&71��15(�/&'(&00-(&�,�-,/�)1.1)'1��'6�'&'�'4'(16:� &3+)1D*�'>�E'�(>-(�(>1�>&3>1'(�5�'(����-.�&/-*01�1�1)34�/1'()+5(&�,�&'�)10-(1/�(��(>1�<<��FDF:G�HBI2>����00�E1/�*4�(>1�A�B?�+,&(��GJF:G�HBI2>��5�,/1,'1)��GK�:��HBI2>��-,/�B@�+,&(��L�:LJ�HBI2>�:��,�-//&(&�,�(>1�<<���J�D:M�HBI2>��B@���LM:G��HBI2>��5�,/1,'1)���KG:LJ�HBI2>��-,/�A�B?�+,&('���LJ:�F�HBI2>��>-.1�(>1�>&3>1'(�'>-)1'����1,/�31,�+'�1�1)34�/1'()+5(&�,�5�'(:�@>1)1��)1�81)��)6-,51�&68)�.161,('�&,�(>1'1�19+&861,(�+,&('�>-.1�(>1�3)1-(1'(�8�(1,(&-0���)�)1/+5&,3�(>1�5�'(����1�1)34�/1'()+5(&�,����(>1�E>�01�'4'(16:�
Figure 6. Distributions of avoidable/unavoidable and endogenous/exogenous exergy destruction for different systemcomponents in (a) relative values, and (b) quantitative values. AC, air compressor; CC, combustion chamber; GT, gasturbine; HRSG, heat recovery steam generator; Cond, condenser; ST, steam turbine; MED-RO, multi-effect distillation andreverse osmosis system.
Figure 7b shows that the highest cost of avoidable exergy destruction is related to theCC (575.1 US$/h), followed by the HRSG unit (145.1 US$/h), condenser (103.2 US$/h), andST unit (93.94 US$/h). In addition, the CC (3427.8 US$/h), ST (398.13 US$/h), condenser(301.94 US$/h), and HRSG units (294.35 US$/h) have the highest shares of endogenousexergy destruction cost. Therefore, performance improvements in these equipment unitshave the greatest potential for reducing the cost of exergy destruction of the whole system.

Processes 2021, 9, 59 21 of 29����������������� ��������������� ���������
�
������������ !"#�$%�&'()*'+,)'�-(����./�'0.+123,-./�'0.+12�.-0�2-0�42-�,(32��42-�,(�2�2*45�02()*,6)'�-�6�()���*�0'��2*2-)�(5()27�6�78�-2-)(�'-�����*21.)'/2�/.1,2(�.-0�����9,.-)').)'/2�/.1,2(:�;<�.'*�6�78*2((�*=�<<�6�7+,()'�-�6>.7+2*=�?@�4.(�),*A+'-2=�B�C?�>2.)�*26�/2*5�()2.7�42-2*.)�*=�<�-0�6�-02-(2*=�C@�()2.7�),*+'-2=�D�&A���7,1)'A2��26)�0'()'11.)'�-�.-0�*2/2*(2��(7�('(�(5()27:� '4,*2�E�(>�F(�)>2�0'()*'+,)'�-(���*�2-/'*�-72-).1�'78.6)(����./�'0.+123,-./�'0.A+12�.-0�2-0�42-�,(32��42-�,(�2�2*45�02()*,6)'�-���*�0'��2*2-)�(5()27�6�78�-2-)(�2�A8*2((20�'-�*21.)'/2�.-0�9,.-)').)'/2�/.1,2(:�;66�*0'-4�)�� '4,*2�E.�)>2�>'4>2()�8*�8�*A)'�-(����2-/'*�-72-).1�'78.6)(����./�'0.+12�2�2*45�02()*,6)'�-�.*2�*21.)20�)��)>2�D�&A���02(.1'-.)'�-�(26)'�-��GH:�IJ����11�F20�+5�)>2�B�C?�,-')���K:GEJ��6�-02-(2*����:KGJ��.-0�<<���H:�KJ�:�B2-62�'-��*02*�)��*20,62�)>2�2-/'*�-72-).1�2��26)(����2�2*45�02()*,6)'�-����0'��2*2-)�8.*)(����)>2�(5()27�)>2�.��*272-)'�-20�6�78�-2-)(�8*2(2-)�>'4>2*�8�)2-)'.1���*�'78*�/272-)(:��-�.00')'�-�)>2�>'4>2()�2-/'*�-72-).1�'78.6)(����2-A0�42-�,(�2�2*45�02()*,6)'�-�+21�-4�)��)>2�<<��EK:�GJ��C@��E�:KLJ��.-0�?@��IL:��J�:�@>2*2��*2�)>2�<<�C@�.-0�?@�,-')(�.*2�)>2�7�()�.88*�8*'.)2�6>�'62(�)��*20,62�)>2�*21.)'/2�2-/'*�-72-).1�2��26)(����2�2*45�02()*,6)'�-�.7�-4�)>2�(5()27�6�78�-2-)(:�
Figure 7. Distributions of avoidable/unavoidable and endogenous/exogenous exergy destruction cost for different systemcomponents in (a) relative values and (b) quantitative values. AC, air compressor; CC, combustion chamber; GT, gas turbine;HRSG, heat recovery steam generator; Cond, condenser; ST, steam turbine; MED-RO, multi-effect distillation and reverseosmosis system.
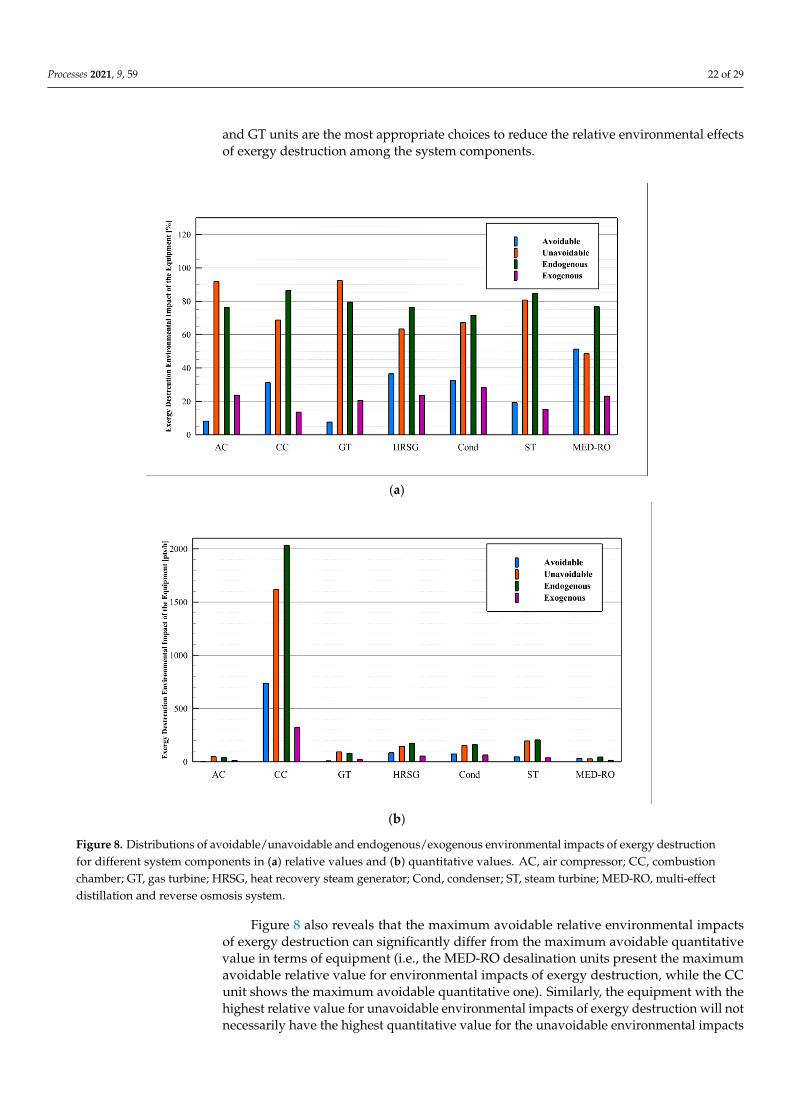
Figure 8 shows the distributions for environmental impacts of avoidable/unavoidableand endogenous/exogenous exergy destruction for different system components expressedin relative and quantitative values. According to Figure 8a, the highest proportions ofenvironmental impacts of avoidable exergy destruction are related to the MED-RO desali-nation section (51.37%), followed by the HRSG unit (36.58%), condenser (32.65%), andCC (31.26%). Hence, in order to reduce the environmental effects of exergy destructionof different parts of the system, the aforementioned components present higher potentialfor improvements. In addition, the highest environmental impacts of endogenous exergydestruction belong to the CC (86.35%), ST (84.69%), and GT (79.43%). Therefore, the CC, ST,
Processes 2021, 9, 59 22 of 29
and GT units are the most appropriate choices to reduce the relative environmental effectsof exergy destruction among the system components.����������������� ��������������� ���������
�
������������ !"#�$%�&'()*'+,)'�-(����./�'0.+123,-./�'0.+12�.-0�2-0�42-�,(32��42-�,(�2-/'*�-52-).1�'56.7)(����2�2*48�02()*,79)'�-���*�0'��2*2-)�(8()25�7�56�-2-)(�'-�����*21.)'/2�/.1,2(�.-0�����:,.-)').)'/2�/.1,2(;�<=�.'*�7�56*2((�*>�==�7�5+,()'�-�7?.5+2*>�@A�4.(�),*+'-2>�B�C@�?2.)�*27�/2*8�()2.5�42-2*.)�*>�=�-0�7�-02-(2*>�CA�()2.5�),*+'-2>�D�&9���5,1)'92��27)�0'()'11.)'�-�.-0�*2/2*(2��(5�('(�(8()25;� '4,*2�E�.1(��*2/2.1(�)?.)�)?2�5.�'5,5�./�'0.+12�*21.)'/2�2-/'*�-52-).1�'56.7)(����2�2*48�02()*,7)'�-�7.-�('4-'�'7.-)18�0'��2*��*�5�)?2�5.�'5,5�./�'0.+12�:,.-)').)'/2�/.1,2�'-�)2*5(����2:,'652-)��';2;�)?2�D�&9���02(.1'-.)'�-�,-')(�6*2(2-)�)?2�5.�'5,5�./�'0.+12�*21.)'/2�/.1,2���*�2-/'*�-52-).1�'56.7)(����2�2*48�02()*,7)'�-�F?'12�)?2�==�,-')�(?�F(�)?2�5.�'5,5�./�'0.+12�:,.-)').)'/2��-2�;�C'5'1.*18�)?2�2:,'652-)�F')?�)?2�?'4?2()�*21.)'/2�/.1,2���*�,-./�'0.+12�2-/'*�-52-).1�'56.7)(����2�2*48�02()*,7)'�-�F'11�-�)�-272((.*'18�?./2�)?2�?'4?2()�:,.-)').)'/2�/.1,2���*�)?2�,-./�'0.+12�2-/'*�-52-).1�'56.7)(����2�2*48�02()*,7)'�-;� '4,*2�E+�(?�F(�)?.)�)?2�?'4?2()�2-/'*�-52-).1�'56.7)(����./�'0.+12�2�2*48�024*.0.)'�-�'(�*21.)20�)��)?2�==��G��;HG�6)(3?����11�F20�+8�)?2�B�C@�,-')��E�;���6)(3?��7�-02-(2*��G�;�H�6)(3?��CA��HI;�J�6)(3?��.-0�D�&9���02(.1'-.)'�-�,-')(���J;�E�6)(3?�;�<00')'�-.118�)?2�==���K�L;IL�6)(3?��CA���K�;LG�6)(3?��B�C@��LGH;�E�
Figure 8. Distributions of avoidable/unavoidable and endogenous/exogenous environmental impacts of exergy destructionfor different system components in (a) relative values and (b) quantitative values. AC, air compressor; CC, combustionchamber; GT, gas turbine; HRSG, heat recovery steam generator; Cond, condenser; ST, steam turbine; MED-RO, multi-effectdistillation and reverse osmosis system.
Figure 8 also reveals that the maximum avoidable relative environmental impactsof exergy destruction can significantly differ from the maximum avoidable quantitativevalue in terms of equipment (i.e., the MED-RO desalination units present the maximumavoidable relative value for environmental impacts of exergy destruction, while the CCunit shows the maximum avoidable quantitative one). Similarly, the equipment with thehighest relative value for unavoidable environmental impacts of exergy destruction will notnecessarily have the highest quantitative value for the unavoidable environmental impacts
Processes 2021, 9, 59 23 of 29
of exergy destruction. Figure 8b shows that the highest environmental impacts of avoidableexergy degradation is related to the CC (735.47 pts/h), followed by the HRSG unit (83.55pts/h), condenser (73.24 pts/h), ST (46.59 pts/h), and MED-RO desalination units (29.58pts/h). Additionally, the CC (2031.61 pts/h), ST (205.17 pts/h), HRSG (174.38 pts/h),and condenser (160.73 pts/h) present the highest environmental effects of endogenousexergy destruction. Therefore, performance improvements in the CC, ST, HRSG, andcondenser units present the greatest potential for reducing the environmental effects ofexergy destruction of the whole system.
5. Conclusions
Considering the need of different communities for electricity and freshwater, it isimportant to analyze and optimize the conditions for converting power plants into a cogen-eration system. In this light, comprehensive thermodynamic, economic, and environmentalanalyses are performed to evaluate the potential conversion of a combined power plant intoa simultaneous water and power production system. To do so, a thermodynamic modellingapproach is proposed for the integrated combined cycle power plant with a multi-effectand reverse osmosis desalination system. In addition, conventional and advanced exergy,exergoeconomic, and exergoenvironmental analyses are carried out to appraise the mainprocess performance parameters, as well as to identify potential technical, economic, andenvironmental improvements for the integrated system. A case study is presented basedon the Neka power plant located at the north of Iran along the Caspian Sea.
In the exergy modelling of the existing Neka power plant and proposed integratedcycle, the results exhibit an exergy efficiency of 45.7% for the existing combined cycle, and42.7% for the proposed cogeneration cycle. The highest cost of exergy destruction of thecombustion chamber is 1.09 US$ per second. Hence, these results indicate that the exergyefficiency of the power plant has decreased by about 3% after the integration with thedesalination units. Results of exergy destruction of the integrated system show that thecombustion chamber, air compressor, and gas turbine units have the highest share of exergydestruction. Therefore, these equipment units present the highest improvement potentialto diminish the exergy destruction of the whole system. As for the exergy efficiency ofthe proposed integrated system, gas turbines and air compressors present the highestvalues of 95% and 92%, respectively, while reverse osmosis (19%), multi-effect desalinationplants (31%), and condensers (34%) have the lowest exergy efficiencies. In the economicevaluation of the proposed integrated system, results reveal that it is possible to reduce theinvestment and operating costs of the system by increasing the share of exergy destructionof the reverse osmosis desalination. This is due to the high exergoeconomic factor related tothe reverse osmosis unit. Furthermore, the results of the economic assessment indicate thatthe production cost of electricity for the proposed integrated system is about 0.036 US$ perkilowatt-hour, whereas the production costs of freshwater by the multi-effect desalinationand reverse osmosis are 2.5 US$/m3 and 1.75 US$/m3, respectively.
In the environmental analysis of the proposed integrated cycle, the results showthat the multi-effect desalination (with 90 points per hour), and the heat recovery steamgenerator (5.04 points per hour) have the most significant environmental effects on theproposed integrated cycle. The highest amount of environmental impacts due to the exergydestruction rate of the equipment belongs to the combustion chamber unit (2340 points perhour), while the lowest amount is presented by the air compressor (0.05 points per hour).This is owing to the exergy destruction of the corresponding equipment. The lowest valuesof the exergoenvironmental factor are related to the combustion chamber and condenser,and the highest ones are associated with the gas turbine (96%) and air compressor (84%).Finally, the results of the advanced exergy, exergoeconomic, and exergoenvironmentalanalysis reveal that the desalination units present the maximum avoidable relative valuesfor the exergy destruction, exergy destruction cost, and environmental impacts of exergydestruction. The combustion chamber shows the maximum avoidable quantitative val-ues for the same parameters. Moreover, the advanced analyses show that performance

Processes 2021, 9, 59 24 of 29
improvements in different equipment units can significantly reduce the exergy destruction,cost of exergy destruction, as well as the environmental effects of exergy destruction of thewhole system.
The advanced exergy-based analyses performed in this study allows to identify thepotential for technical, economic, and environmental improvements of different units inthe integrated system. The system components identified by the previous analysis could beconsidered as the most appropriate options to enhance overall plant efficiency. Decreasingexergy destruction in these units allows improving their performance, which will lead toenhancing the efficiency of the whole plant, as well as diminishing their adverse effectson system’s costs and environmental impacts. As these specific units have the highestimpact on the system, the effect of their improvement will be significant. For improvingthe performance and thereby reducing the exergy destruction of the selected units, specificactions for each considered component should be conducted. Discussing the practical waysto prevent the irreversibility in different units is an attractive suggestion for future studieson the integrated system.
Author Contributions: Conceptualization, M.H.K.M.; methodology, R.S.G.; investigation, R.S.G.;software, R.S.G. and M.H.K.M.; data curation, R.S.G. and H.V.M.; formal analysis and resultsdiscussion, H.V.M., R.S.G. and V.C.O.; writing—original draft preparation, H.V.M.; writing—reviewand editing, V.C.O. and M.H.K.M.; validation, H.V.M. and M.H.K.M.; resources, M.H.K.M. andV.C.O.; visualization, H.V.M. All authors have read and agreed to the published version of themanuscript.
Funding: This research received no external funding.
Data Availability Statement: The data presented in this study are available on request to the corre-sponding author.
Conflicts of Interest: The authors declare no conflict of interest.
Appendix A
Table A1. Modelling equations for the multi-effect distillation (MED) system [19].
Component Modelling Equations
MED
Performance : PR =.
mD.ms
, RR =.
mD.mF
Mass Balance ith effect : FXF = BXB, FXF = Be · XBe
Energy Balance ith effect : Dc∆hDc = DhD + BhB − FhFBoiling Point Elevation : BPED = TD − TDsat
Area : Dc · ∆hDc = AeUe(TprevDsat− Te)
Ue = 10−3[1939.1 + 1.40562(TprevDsat− 273.15)
−0.0207525(TprevDsat− 273.15)
2
+0.0023186(TprevDsat− 273.15)
3]
Terminal Temperature Difference : ∆TTER = Tc − Te
Mass Balance ith flashbox : Dbd + D f b = Dinbd + Dc
Energy Balance ith flashbox : Dbd · hDbd + D f b · hD f b = Dinbd · hDin
bd+ Dc · hDc
feedheater : Q f h = Dc(hinDc− hout
Dc) =
.mF(hout.
mF− hin.
mF)
Q f h = A f hU f hTin.
mF−Tout.
mF
ln
(TDc,sat
−Tout.mF
TDc,sat−Tin.
mF
)U f h = 10−3[1617.5 + 0.1537(TDc,sat − 273.15)
+0.1825(TDc,sat − 273.15)2
−0.00008026(TDc,sat − 273.15)3]

Processes 2021, 9, 59 25 of 29
Table A1. Cont.
Component Modelling Equations
Condenser
Qcond = Dc(hinDc− hout
Dc) =
.mcond(hout
sw − hinsw)
Qcond = AcUcTin
sw−Toutsw
ln(
TD−Tinsw
TD−Toutsw
)Uc = 10−3[1617.5 + 0.1537(TD − 273.15)
+0.1825(TD − 273.15)2
−0.00008026(TD − 273.15)3].
mD =n∑
i=1D(i)
.ms = Dc(1).mF = F(1).
mB = B(n)Specific Area : SA =
∑ Ae+∑ A f h+Ac.
mD
Table A2. Modelling equations for the RO desalination unit [3].
Modelling Equations
RR =.
mD.mF
RR = RR|T=25 · JwJw |T=25.
mF =.
mD +.
mB.mF =
.mcwd,MED.
WRO =.
mF(pFeed−p37)·100ρ·ηpump
Jw = DwCwVwRTe[K] {(pF − pD)− (πF − πD)}
πi =385·sali ·Ti
0.14507(1000−10sali)
T : average Temp. o f ROR : Universal Gas Cons tan t
e : membrane thicknessVw : water molar volumeCw : water concentration
Dw = k·T[0K ]3πFµwds
µw = 4.23× 10⁻⁵ + [0.157(TF + 64.993)2 − 91.296]−1
ds = 0.076MWwds : Stocks diameter
MW : Molcular WeightsalB = salF
1−RR
hdistillate =h f eed−RR·hbrine
1−RR
Table A3. Capital investment for different system components.
SystemComponent Cost Equation (US$) Reference
AC 44.71 ·ma · rp,AC · ln(rp,AC)1
0.95−ηAC[21]
CC 28.98ma
0.995−(
poutpin
) (1 + e(0.015(Tout−1540))) [21]
GT 479.34 m f g0.93−ηGT
ln(rp,GT)(1 + e(0.036Tin−54.4)) [33]
HRSG 6570[(
QEC∆TEC
)0.8+(
QEV∆TEV
)0.8+(
QSH∆TSH
)0.8]+ 21276 ·mw
+1184.4 ·m1.2f g
[33]
Deaerator 6570(
QDEA∆TDEA
)0.8 [25]

Processes 2021, 9, 59 26 of 29
Table A3. Cont.
SystemComponent Cost Equation (US$) Reference
Pump 3540 ·W0.71Pump [34]
MED ∑ PECe f f ects + ∑ PEC f eed−heaters + ∑ PEC f lash−boxes + PECcondenser
PECHX = 12, 000(
Area100
)0.6 [25]
RO
PECmembrane + PECpretreat + PECRO−pump + PECRO−valvePECmembrane = NO.membranes · PECone−membrane
PECone−membrane = 7846
PECpretreat = 996 · ξ1
( .mRO− f eed
ρ · 24 · 3600)0.8
ξ1 = 1.399 : inflation factorPECRO−pump = 393, 000ξ1 + 701.19 · 14.5 · PRO− f eed
PECRO−valve = 8.07 · 0.989.
m(
TiPi
)0.05Pe−0.75
[35,36]
ST ηST0.85 × 10(2.6259+1.4398∗log10(WST)−0.1776(log10(WST))2) [34]
AC, air compressor; CC, combustion chamber; GT, gas turbine; HRSG, heat recovery steam generator; MED,multi-effect distillation; RO, reverse osmosis; ST, steam turbine.
Table A4. Verification of thermodynamic simulation results of the different process streams.
.m (kg/s) T (◦C) P (bar)
MATLAB Thermoflex Error (%) MATLAB Thermoflex Error (%) MATLAB Thermoflex Error (%)
1 495.60 491.10 0.92 20.00 20.00 0.00 1.010 1.010 0.002 495.60 491.10 0.92 337.25 344.40 2.08 10.800 10.800 0.003 504.30 498.90 1.08 971.00 970.90 0.01 10.001 10.300 2.904 504.30 498.90 1.08 502.12 528.40 4.97 1.010 1.030 1.945 504.30 498.90 1.08 502.12 528.40 4.97 1.010 1.030 1.948 504.30 498.90 1.08 436.26 441.30 1.14 1.010 1.030 1.949 504.30 498.90 1.08 311.01 318.70 2.41 1.010 1.030 1.9410 504.30 498.90 1.08 252.89 257.90 1.94 1.010 1.020 0.9811 504.30 498.90 1.08 250.93 255.60 1.83 1.010 1.020 0.9812 504.30 498.90 1.08 221.69 231.10 4.07 1.010 1.020 0.9813 504.30 498.90 1.08 200.39 206.40 2.91 1.010 1.010 0.0014 504.30 498.90 1.08 197.02 202.60 2.76 1.010 1.010 0.0015 504.30 498.90 1.08 168.50 168.20 0.18 1.010 1.010 0.0016 63.03 60.72 3.80 61.43 61.45 0.04 0.213 0.213 0.0017 63.03 60.72 3.80 63.21 61.45 2.86 0.221 0.213 3.7618 63.03 60.72 3.80 63.21 61.45 2.86 0.221 0.213 3.7619 66.70 63.93 4.33 63.23 61.54 2.75 4.900 4.938 0.7720 66.70 63.93 4.33 63.23 60.78 4.03 4.900 4.938 0.7721 66.70 63.93 4.33 126.00 126.70 0.55 4.900 4.938 0.7722 8.98 9.18 2.17 126.06 128.90 2.20 10.000 10.450 4.3123 55.74 54.75 1.81 126.87 128.90 1.58 96.000 98.900 2.9324 8.98 9.18 2.17 179.89 181.80 1.05 10.000 10.450 4.3125 8.98 9.18 2.17 179.89 181.80 1.05 10.000 10.340 3.2926 8.98 9.18 2.17 236.00 236.50 0.21 10.000 10.340 3.2927 55.74 54.75 1.81 180.00 185.00 2.70 96.000 97.900 1.9428 55.74 54.75 1.81 308.01 308.70 0.22 96.000 96.900 0.9329 55.74 54.75 1.81 308.01 308.70 0.22 96.000 96.900 0.9332 55.74 54.75 1.81 523.00 522.00 0.19 96.000 96.000 0.0033 3.28 3.22 1.86 236.00 236.50 0.21 10.000 10.340 3.2934 3.28 3.22 1.86 70.00 70.11 0.16 4.900 4.930 0.6135 79.14 82.86 4.49 20.00 20.00 0.00 1.010 1.010 0.0036 13.48 13.60 0.88 44.00 44.49 1.10 1.010 1.014 0.3937 46.66 48.75 4.29 48.00 47.60 0.84 1.010 1.014 0.3938 20.00 20.00 0.00 47.49 46.54 2.04 4.500 4.500 0.0039 6.84 6.90 0.87 44.00 46.13 4.62 1.010 1.010 0.0040 6.54 6.60 0.91 46.75 47.69 1.97 1.010 1.010 0.00
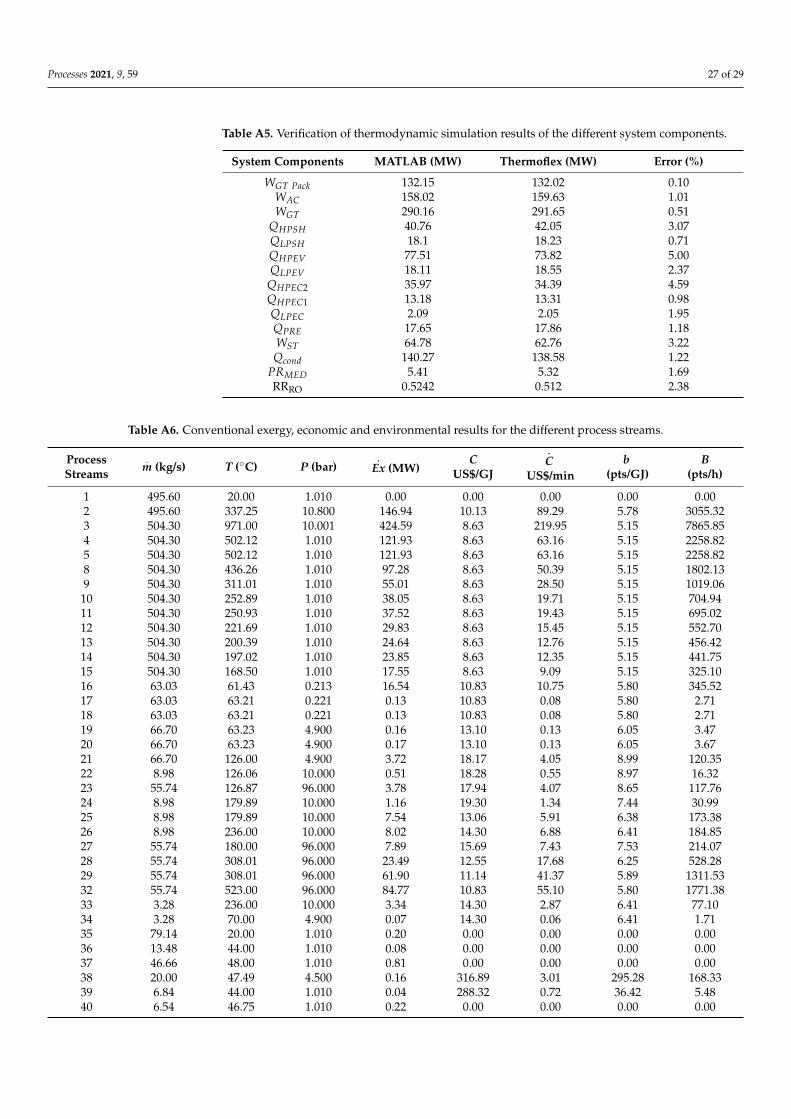
Processes 2021, 9, 59 27 of 29
Table A5. Verification of thermodynamic simulation results of the different system components.
System Components MATLAB (MW) Thermoflex (MW) Error (%)
WGT Pack 132.15 132.02 0.10WAC 158.02 159.63 1.01WGT 290.16 291.65 0.51
QHPSH 40.76 42.05 3.07QLPSH 18.1 18.23 0.71QHPEV 77.51 73.82 5.00QLPEV 18.11 18.55 2.37
QHPEC2 35.97 34.39 4.59QHPEC1 13.18 13.31 0.98QLPEC 2.09 2.05 1.95QPRE 17.65 17.86 1.18WST 64.78 62.76 3.22Qcond 140.27 138.58 1.22
PRMED 5.41 5.32 1.69RRRO 0.5242 0.512 2.38
Table A6. Conventional exergy, economic and environmental results for the different process streams.
ProcessStreams
.m (kg/s) T (◦C) P (bar)
.Ex (MW)
CUS$/GJ
.C
US$/minb
(pts/GJ)B
(pts/h)
1 495.60 20.00 1.010 0.00 0.00 0.00 0.00 0.002 495.60 337.25 10.800 146.94 10.13 89.29 5.78 3055.323 504.30 971.00 10.001 424.59 8.63 219.95 5.15 7865.854 504.30 502.12 1.010 121.93 8.63 63.16 5.15 2258.825 504.30 502.12 1.010 121.93 8.63 63.16 5.15 2258.828 504.30 436.26 1.010 97.28 8.63 50.39 5.15 1802.139 504.30 311.01 1.010 55.01 8.63 28.50 5.15 1019.0610 504.30 252.89 1.010 38.05 8.63 19.71 5.15 704.9411 504.30 250.93 1.010 37.52 8.63 19.43 5.15 695.0212 504.30 221.69 1.010 29.83 8.63 15.45 5.15 552.7013 504.30 200.39 1.010 24.64 8.63 12.76 5.15 456.4214 504.30 197.02 1.010 23.85 8.63 12.35 5.15 441.7515 504.30 168.50 1.010 17.55 8.63 9.09 5.15 325.1016 63.03 61.43 0.213 16.54 10.83 10.75 5.80 345.5217 63.03 63.21 0.221 0.13 10.83 0.08 5.80 2.7118 63.03 63.21 0.221 0.13 10.83 0.08 5.80 2.7119 66.70 63.23 4.900 0.16 13.10 0.13 6.05 3.4720 66.70 63.23 4.900 0.17 13.10 0.13 6.05 3.6721 66.70 126.00 4.900 3.72 18.17 4.05 8.99 120.3522 8.98 126.06 10.000 0.51 18.28 0.55 8.97 16.3223 55.74 126.87 96.000 3.78 17.94 4.07 8.65 117.7624 8.98 179.89 10.000 1.16 19.30 1.34 7.44 30.9925 8.98 179.89 10.000 7.54 13.06 5.91 6.38 173.3826 8.98 236.00 10.000 8.02 14.30 6.88 6.41 184.8527 55.74 180.00 96.000 7.89 15.69 7.43 7.53 214.0728 55.74 308.01 96.000 23.49 12.55 17.68 6.25 528.2829 55.74 308.01 96.000 61.90 11.14 41.37 5.89 1311.5332 55.74 523.00 96.000 84.77 10.83 55.10 5.80 1771.3833 3.28 236.00 10.000 3.34 14.30 2.87 6.41 77.1034 3.28 70.00 4.900 0.07 14.30 0.06 6.41 1.7135 79.14 20.00 1.010 0.20 0.00 0.00 0.00 0.0036 13.48 44.00 1.010 0.08 0.00 0.00 0.00 0.0037 46.66 48.00 1.010 0.81 0.00 0.00 0.00 0.0038 20.00 47.49 4.500 0.16 316.89 3.01 295.28 168.3339 6.84 44.00 1.010 0.04 288.32 0.72 36.42 5.4840 6.54 46.75 1.010 0.22 0.00 0.00 0.00 0.00

Processes 2021, 9, 59 28 of 29
References1. Najafi, B.; Shirazi, A.; Aminyavari, M.; Rinaldi, F.; Taylor, R. A Exergetic, economic and environmental analyses and multi-
objective optimization of an SOFC-gas turbine hybrid cycle coupled with an MSF desalination system. Desalination 2014, 334,46–59. [CrossRef]
2. Modabber, H.V.; Manesh, M.H.K. Optimal Exergetic, Exergoeconomic and Exergoenvironmental Design of Polygeneration Systembased on Gas Turbine-Absorption Chiller-Solar Parabolic Trough Collector Units Integrated with Multi-Effect Desalination-Thermal Vapor Compressor- Reverse Osmosis Desalination Systems. Renew. Energy 2020, 165, 533–552.
3. Al-Zahrani, A.; Orfi, J.; Al-Suhaibani, Z.; Salim, B.; Al-Ansary, H. Thermodynamic Analysis of a Reverse Osmosis DesalinationUnit with Energy Recovery System. Procedia Eng. 2012, 33, 404–414. [CrossRef]
4. Sadri, S.; Ameri, M.; Khoshkhoo, R.H. Multi-objective optimization of MED-TVC-RO hybrid desalination system based on theirreversibility concept. Desalination 2017, 402, 97–108. [CrossRef]
5. Blanco-Marigorta, A.M.; Masi, M.; Manfrida, G. Exergo-environmental analysis of a reverse osmosis desalination plant in GranCanaria. Energy 2014, 76, 223–232. [CrossRef]
6. Calise, F.; d’Accadia, M.D.; Piacentino, A. Exergetic and exergoeconomic analysis of a renewable polygeneration system andviability study for small isolated communities. Energy 2015, 92, 290–307. [CrossRef]
7. Mokhtari, H.; Sepahvand, M. Thermoeconomic and exergy analysis in using hybrid systems (GT + MED + RO) for desalinationof brackish water in Persian Gulf. Desalination 2016, 399, 1–15. [CrossRef]
8. Almutairi, A.; Pilidis, P.; Al-Mutawa, N.; Al-Weshahi, M. Energetic and exergetic analysis of cogeneration power combined cycleand ME-TVC-MED water desalination plant: Part-1 operation and performance. Appl. Therm. Eng. 2016, 103, 77–91. [CrossRef]
9. Shahzad, M.W.; Ng, K.C.; Thu, K. An improved cost apportionment for desalination combined with power plant: An exergeticanalyses. In Applied Mechanics and Materials; Trans Tech Publications Ltd.: Stafa-Zurich, Switzerland, 2016.
10. Eveloy, V.; Rodgers, P.; Qiu, L. Integration of an atmospheric solid oxide fuel cell-gas turbine system with reverse osmosis fordistributed seawater desalination in a process facility. Energy Convers. Manag. 2016, 126, 944–959. [CrossRef]
11. Ng, K.C.; Shahzad, M.W.; Son, H.S.; Hamed, O. A An exergy approach to efficiency evaluation of desalination. Appl. Phys. Lett.2017, 110, 184101. [CrossRef]
12. Arani, A.M.A.; Zamani, V.; Behbahaninia, A. Economic analysis of a combined power and desalination plant consideringavailability changes due to degradation. Desalination 2017, 414, 1–9. [CrossRef]
13. Salimi, M.; Amidpour, M. Investigating the integration of desalination units into cogeneration systems utilizing R-curve tool.Desalination 2017, 419, 49–59. [CrossRef]
14. Ameri, M.; Ahmadi, P.; Khanmohammadi, S. Exergy analysis of a 420 MW combined cycle power plant. Int. J. Energy Res. 2008,32, 175–183.
15. Vazini Modabber, H.; Manesh, M.H.K. Exergetic Exergoeconomic and Exergoenvironmental Multi-Objective Genetic AlgorithmOptimization of Qeshm Power and Water Cogeneration Plant. Gas Process. 2019, 7, 1–28.
16. Moghimi, M.; Emadi, M.; Akbarpoor, A.M.; Mollaei, M. Energy and exergy investigation of a combined cooling, heating, powergeneration, and seawater desalination system. Appl. Therm. Eng. 2018, 140, 814–827. [CrossRef]
17. Petrakopoulou, F.; Tsatsaronis, G.; Morosuk, T. Advanced Exergoeconomic Analysis of a Power Plant with CO2 Capture. EnergyProcedia 2015, 75, 2253–2260. [CrossRef]
18. Bejan, A.; Tsatsaronis, G.; Moran, M.J. Thermal Design and Optimization; Wiley: New York, NY, USA, 1996.19. Mistry, K.H.; Antar, M.A.; Lienhard, J.H. An improved model for multiple effect distillation. Desalination Water Treat. 2013, 51,
807–821. [CrossRef]20. Wagner, W.; Kretzschmar, H.J. International Steam Tables—Properties of Water and Steam based on the Industrial Formulation IAPWS-
IF97: Tables, Algorithms, Diagrams, and CD-ROM Electronic Steam Tables—All of the Equations of IAPWS-IF97 Including a Complete Setof Supplementary Backward Equations for Fast Calculations of Heat Cycles, Boilers, and Steam Turbines; Springer: Berlin/Heidelberg,Germany, 2007.
21. Dincer, I.; Rosen, M.A.; Ahmadi, P. Optimization of Energy Systems; Wiley: New York, NY, USA, 2017.22. Valero, A.; Lozano, M.A.; Serra, L.; Tsatsaronis, G.; Pisa, J.; Frangopoulos, C.; von Spakovsky, M.R. CGAM problem: Definition
and conventional solution. Energy 1994, 19, 279–286. [CrossRef]23. Dincer, I.; Rosen, M.A. Chapter 3—Chemical Exergy, in Exergy, 2nd ed.; Dincer, I., Rosen, M.A., Eds.; Elsevier: Amsterdam, The
Netherlands, 2013; pp. 31–49.24. Sharqawy, M.H.; Zubair, S.M.; Lienhard, J.H. Second law analysis of reverse osmosis desalination plants: An alternative design
using pressure retarded osmosis. Energy 2011, 36, 6617–6626. [CrossRef]25. Cavalcanti, E.J.C. Exergoeconomic and exergoenvironmental analyses of an integrated solar combined cycle system. Renew.
Sustain. Energy Rev. 2017, 67, 507–519. [CrossRef]26. Goedkoop, M.; Effting, S.; Collignon, M. The Eco-indicator 99: A Damage Oriented Method for Life-cycle Impact Assessment : Manual
for Designers; PRé, Product Ecology Consultants: Amersfoort, The Netherlands, 2000.27. Raluy, G.; Serra, L.; Uche, J. Life cycle assessment of MSF, MED and RO desalination technologies. Energy 2006, 31, 2361–2372.
[CrossRef]28. Petrakopoulou, F.; Tsatsaronis, G.; Morosuk, T.; Carassai, A. Advanced exergoeconomic analysis applied to a complex energy
conversion system. J. Eng. Gas Turbines Power 2012, 134, 031801. [CrossRef]

Processes 2021, 9, 59 29 of 29
29. Tsatsaronis, G.; Park, M.-H. On avoidable and unavoidable exergy destructions and investment costs in thermal systems. EnergyConvers. Manag. 2002, 43, 1259–1270. [CrossRef]
30. Anvari, S.; Saray, R.K.; Bahlouli, K. Conventional and advanced exergetic and exergoeconomic analyses applied to a tri-generationcycle for heat, cold and power production. Energy 2015, 91, 925–939. [CrossRef]
31. Boyano, A.; Morosuk, T.; Blanco-Marigorta, A.M.; Tsatsaronis, G. Conventional and advanced exergoenvironmental analysis of asteam methane reforming reactor for hydrogen production. J. Clean. Prod. 2012, 20, 152–160. [CrossRef]
32. Zhou, W.; Song, L.; Guan, T.K. A numerical study on concentration polarization and system performance of spiral wound ROmembrane modules. J. Membr. Sci. 2006, 271, 38–46. [CrossRef]
33. Ghaebi, H.; Saidi, M.H.; Ahmadi, P. Exergoeconomic optimization of a trigeneration system for heating, cooling and powerproduction purpose based on TRR method and using evolutionary algorithm. Appl. Therm. Eng. 2012, 36, 113–125. [CrossRef]
34. Boyaghchi, F.A.; Heidarnejad, P. Thermoeconomic assessment and multi objective optimization of a solar micro CCHP based onOrganic Rankine Cycle for domestic application. Energy Convers. Manag. 2015, 97, 224–234. [CrossRef]
35. Park, C.; Park, P.K.; Mane, P.P.; Hyung, H.; Gandhi, V.; Kim, S.H.; Kim, J.H. Stochastic cost estimation approach for full-scalereverse osmosis desalination plants. J. Membr. Sci. 2010, 364, 52–64. [CrossRef]
36. El-Sayed, Y.M. The Thermoeconomics of Energy Conversions; Elsevier Science: Amsterdam, The Netherlands, 2013.