integration of 3 dimensional parametric … · geographic information systems in educational...
TRANSCRIPT
i
INTEGRATION OF 3 DIMENSIONAL PARAMETRIC BUILDING MODEL WITH
GEOGRAPHIC INFORMATION SYSTEMS IN EDUCATIONAL FACILITIES
PLANNING AND MANAGEMENT
A Masters Thesis
Submitted to the Faculty
Of the
Worcester Polytechnic Institute
In partial fulfillment of the requirements for the
Degree of Masters of Science
In
Civil Engineering
Construction Project Management
By
Viren Samdadia
May 2004 Approved Prof. Guillermo Salazar, PhD Major Advisor Prof. Fabio Carrera, PhD Co-Advisor Prof. Frederick L. Hart, PhD Civil and Environmental Engineering Dept. Head Thesis Committee Members Mr. John Miller Prof. Robert Fitzgerald, PhD
ii
Abstract The efficient management of buildings and grounds of colleges and universities
require an increased amount of information that is current, well organized and easy to
access. This information is first generated at the planning stage of the facility before it
is even designed. A seamless database containing current and accurate information
about the facility and a tool that allows decision-makers to graphically relate the
database with the physical location of the information provides a system to better
integrate the decision making process from planning to actual operations and
maintenance of the facility.
This thesis presents an operational environment for facilities managers that integrates
the 3 dimensional parametric building modeling with geographic information
systems, both related to a common database, and explores the possible benefits and
costs of using this integrated system.
iii
Acknowledgements:
I am greatly indebted to many people, directly and indirectly who helped me see
through the successful completion of my thesis. I sincerely thank my advisor Prof.
Guillermo Salazar for his invaluable advice and his patience throughout my learning
process. There are few words to express the impact he had on my learning. I thank
Prof. Carrera for his guidance as a co-advisor. I’m thankful to Mr. John Miller and
Prof. Fitzgerald for sharing invaluable ideas and results with me. I would also like to
thank all the faculty and staff at the Civil and Environmental Engineering Department
for providing an enjoyable experience during my stay at Worcester Polytechnic
Institute.
In addition, there are several other people who deserve special thanks and contributed
to this dissertation in different ways.
iv
Table of contents:
ABSTRACT........................................................................................................ I
ACKNOWLEDGEMENTS: ................................................................................ III
LIST OF FIGURES: .......................................................................................... VI
1. INTRODUCTION ............................................................................................1
1.1 Problem Statement:............................................................................................. 2
1.2 Objectives and Scope:......................................................................................... 3
2. OBJECTIVES .................................................................................................7
2.1 Facilities Management:....................................................................................... 7
2.1.1. What is Facilities Management at WPI: ..................................................... 8
2.1.2. Benefits of this project towards improving Facilities Management: ........ 15
2.2 Current solutions available for Facilities Management .................................... 19
2.2.1 CAD: .......................................................................................................... 19
2.2.1.1 3D CAD .............................................................................................. 20
2.2.1.2 3D PARAMETRIC CAD: .................................................................. 22
2.2.1.3 The use of 3DPM for Facility Management: ...................................... 26
2.2.2 GIS: ............................................................................................................ 27
2.2.4 The need for improved use of IT in Facilities Management...................... 39
2.2.4.1 Need for Integration of CAD and GIS:............................................... 39
2.2.4.2 The issues in integrating the two systems:.......................................... 42
3. AVAILABLE IT SOLUTIONS AND OTHER INTEGRATION INITIATIVES .......47
3.1 Open GIS Consortium: ..................................................................................... 47
3.2 Open interoperability with Oracle spatial technology: ..................................... 48
3.3 Bentley/ESRI AEC-GIS Interoperability:......................................................... 48
3.4 ODMS – Object Domain Modeling Support .................................................... 51
3.5 3D and 4D Visualization of 2D GIS data: ........................................................ 52
3.6 ArcGIS 3D Analyst with ArcGlobe:................................................................. 54
4 CASE STUDY................................................................................................57
4.1 Description of the project.................................................................................. 57
v
4.2 The need for integration.................................................................................... 59
4.3 Methodology..................................................................................................... 61
4.3.1 Kaven Hall 3DPM in Revit........................................................................ 64
4.3.2 MapInfo...................................................................................................... 69
4.3.3 Integrating Revit and MapINFO................................................................ 70
4.3.3.1 Technical Issues .................................................................................. 72
4.4 Results and analysis of the results: ................................................................... 75
4.4.1 Applications of the system......................................................................... 75
4.4.2 Limitations of the integrated 3DPBM-GIS system:................................... 84
5. CONCLUSIONS AND RECOMMENDATIONS:................................................87
6. FUTURE SCOPE OF WORK: .........................................................................92
BIBLIOGRAPHY:.............................................................................................93
APPENDICES: .................................................................................................95
Appendix A: Methodology ..................................................................................... 95
Appendix B: Structure of the ‘Location Code’..................................................... 106
Appendix C: Thesis presentation .......................................................................... 108
Appendix D: Description and listings of the project files..................................... 119

vi
List of figures: Figure 1: Scope of Facilities Management at WPI, considered for this project ......... 10
Figure 2: Visualizing Kaven Hall; a 3-D Model and a floor plan .............................. 22
Figure 3: Object Attributes in Revit............................................................................ 24
Figure 4: Representation of data as layers in GIS. [15].............................................. 29
Figure 5: Example: A line that denotes a road tells you nothing but its location. An
attribute table stores all relevant (descriptive) information about this feature,
which can be queried and displayed in many formats based on the user’s
needs.[11]............................................................................................................ 32
Figure 6: GIS in the planning process......................................................................... 35
Figure 7: Client Interoperability between MicroStation and ArcInfo allowing both the
software to read files in the other software’s format. [22].................................. 49
Figure 8: Server to server interoperability between MicroStation Content
Management and Publishing and ESRI ArcSDE [22] ........................................ 50
Figure 9: 3D visualization of the 2D data done by replacing the 2D data with relevant
3D objects from an object library representing the data. [20] ............................ 53
Figure 10: 3D representation of a city model in ArcGlobe ........................................ 55
Figure 11: Flow chart describing the process of integration of the 3DPBM from
AutoDesk Revit with MapInfo............................................................................ 63
Figure 12: 2D Kaven Hall first floor plan in AutoCAD ............................................. 64
Figure 13: The 3 dimensional parametric building model for Kaven Hall, WPI as
created using Revit.............................................................................................. 66
Figure 14: 3D Models of Kaven Hall and Campus Center as placed on the 2D
Campus Map AutoCAD file in Revit.................................................................. 68
Figure 15: The database structure as exported from Revit to Access......................... 68
Figure 16: The inter-relations between the tables in Access as created by Revit....... 69
Figure 17: Hourly Usage of KH116 for D-Term Classes ........................................... 79
Figure 18: Space controlled by different departments in Kaven Hall ........................ 80
Figure 19: Space usage on the 1st floor of Kaven Hall ............................................... 80
Figure 20: Space usage on the 2nd floor of Kaven Hall .............................................. 81

vii
Figure 21: Usage of the total space in Kaven Hall ..................................................... 81
Figure 22: Division of space in Kaven Hall first floor as seen in Autodesk Revit..... 82
Figure 23: Division of space on the second floor of Kaven Hall as seen in Autodesk
Revit.................................................................................................................... 82
Figure 24: Maintaining the equipment inspection records ......................................... 83
Figure 25: Fire Extinguisher coverage considering a maximum travel distance of 30
feet....................................................................................................................... 83
Figure 26: Uni-directional flow of information in the integrated 3DPBM-GIS system
............................................................................................................................. 85
Figure 27: Kaven Hall Rev B, 2 dimensional floor plans as provided by Department
of Plant Services, WPI. ....................................................................................... 95
Figure 28: Using the Kaven Hall floor plans to trace the 3D Model.......................... 96
Figure 29: The drawing tools offered by Autodesk Revit for creating new user
defined building objects...................................................................................... 97
Figure 30: Autodesk Revit offers the ability to add user defined object attributes .... 97
Figure 31: A new object (Post Indicator Valve) along with the object attributes as
created in Revit for this project........................................................................... 98
Figure 32: Merging the Kaven Hall floor plans with the campus map in AutoCAD . 99
Figure 33: Universal Translator used to convert AutoCAD files to MapInfo format
(TAB files) ........................................................................................................ 100
Figure 34: Screen shot from MapInfo showing the TAB file created for the campus
map containing the Kaven Hall 1st floor plan. .................................................. 100
Figure 35: Making the ‘walls’ layer editable to add the field ‘Location Code’ to the
various equipment located on the ‘walls’ layer in MapInfo. ............................ 101
Figure 36: Adding the Location Code to individual objects such as fire extinguishers,
etc. in MapInfo.................................................................................................. 101
Figure 37: The tables created by Autodesk Revit as exported from the 3D Model to a
database in MS Access...................................................................................... 103
Figure 38: The inter-relations between all the tables in the database as created by
Revit.................................................................................................................. 103

viii
Figure 39: Different symbols used to represent different types of objects on the
campus map in MapInfo. .................................................................................. 104
Figure 40: A query on the geo-referenced database showing the inspection schedules
of equipment the date of inspection and the action taken................................. 105
Figure 41: CD Main Page listing the files created and used for the project. ............ 119
Figure 42: Revit Files folder snap shot ..................................................................... 119
Figure 43: AutoCAD files folder snap shot .............................................................. 120
Figure 44: Databases folder snap shot ...................................................................... 121
Figure 45: Snap shot of the folder ‘MapInfo Files’ .................................................. 121
1
1. Introduction
Computer-aided design is employed by almost every aspect of the architecture,
engineering and construction market (designers and engineers), but it has proven
incapable of handling the planning, development and management of large
infrastructures.
Unlike CAD, which is a tool for creating new information in the form of geometrical
representations of actual or potential structures, GIS is a computer-based tool for
modeling and analyzing existing data and events in the context of their geographical
location as needed by planners.
Despite distinct roles, planners and engineers very much depend upon each other to
conduct their work. Planners need accurate information on as-built conditions and
engineers and architects need the context of plans to create their designs. Operational
staffs / facility management need access to all of this information and they require the
information to be current and accurate to make efficient decisions supporting the
short and long term goals of the organization and which relate to the most current
situation and advancements on campus.
Though some CAD packages are including some limited GIS functionalities,
traditional CAD packages lack the capability of truly analyzing spatial data provided
by GIS (checking the connectivity, adjacency, proximity, buffer, etc.). Similarly GIS
2
systems provide only some basic drafting and designing capabilities as compared to
the CAD systems.
1.1 Problem Statement: In today’s world, the requirements for interoperability between CAD and GIS are met
most commonly by exchanging files in an ad hoc manner. Files are imported and
reformatted for use in the target system. Alternatively, for systems requiring lower
tolerance levels, workflows are reduced to exchanging printed materials allowing
only the lowest level of information content to be communicated as a unidirectional
unique event.
With such a file exchange paradigm, considerable information is lost in the
translation process. There is no record of information dependencies. There is
significant editing of translated information to "clean-up" the data. And there is no
central information index, available to both AEC professionals and planners, that
details who has what information.
In recent years, there have been a number of efforts on the software front to facilitate
CAD/GIS integration. Such major CAD and GIS vendors as Autodesk, Intergraph,
Bentley Systems, and ESRI have introduced products that attempt to leverage the best
of both CAD and GIS.
Some of the methods used or being developed for sharing data between the two
systems of CAD and GIS are:
3
File Translation
Direct Read, or
Shared Access to the Database
In addition, some traditional CAD packages have taken on certain aspects of GIS
functionality, such as database-management capabilities, and some GIS tools have
added such CAD functions as 3D projection.
Such CAD systems pretending to be GIS suffer from poor handling of object
attributes, limited and slow database links, and rudimentary spatial analysis and
cartography capabilities. They offer limited capabilities for data integration and
sharing. GIS trying to be CAD systems are often accused of being overly complex,
being too slow at screen refresh, and having limited sketching and drafting
capabilities.
While achieving integration between CAD and GIS will solve the problem of
integration of information between designers and planners, often the information
provided by planners is 2 dimensional and difficult to visualize by a layman.
Providing a 3D visualization drastically improves the efficiency of communicating
the correct information.
1.2 Objectives and Scope: The objectives of this project are to understand the necessity of providing integration
between 3D CAD and GIS, and exploring the possible benefits and the costs of
following this approach towards integration.
4
The methodology followed in conducting this research of integrating the 3D CAD
with GIS included a detailed literature research which provided a general idea of the
current state of affairs in the industry for providing integration between CAD and GIS
and also helped in identifying the scope of this project. This was followed by
identifying a case-study to look in-depth at real world situations, and then finding
different possible methods of integration between the CAD and GIS software systems
and following the most efficient method and then identifying the capabilities and
limitations of the integrated system. The tools used for conducting this research were
selected on the basis of ease of availability for use and the prior knowledge in using
the software systems.
The scope of this project is to try to provide an operational environment for facilities
managers by integrating 3D parametric building models created in Autodesk Revit
with the Geographic Information Systems (MapInfo).
The project will aid in integrating the efforts of the planners who require a broad view
of spatial information, the ability to work with large areas, and a powerful toolbox of
analytical functions (offered by GIS) with the work of the engineers who create and
work from sets of detailed drawings and models, with spatial information, and require
a rich set of 2D and 3D geometry-based engineering and design functions.
This integration of the 3D AEC model with the GIS can thus help solve many of the
issues regarding interoperability between different project participants.
An integration effort in this direction will help both the AEC participants as well as
the GIS planners in understanding each others role, as well as work in the direction of
creating complementary ideas which will fit each others plans, and ultimately helping
5
the end-users and decision-makers who are best served by integrated information
systems.
A 3D model was created in AutoDesk Revit for Kaven Hall (Civil and Environmental
Engineering Department at WPI). This model included various building components
such as fire safety equipment, hazardous materials, furnishings, etc. apart from the
superstructure objects (doors, walls, windows, etc.) along with the relevant object
specific attribute data as needed for facilities management purposes such as:
1. The useful life of the equipment before a replacement or servicing is needed,
2. The type and model of the fire safety equipment used which can be helpful for
emergency personnel in case of emergencies knowing exactly what to expect,
3. The gross and net areas for various spaces (rooms) on campus, which can be
divided into various uses such as classrooms, office space, laboratories, etc.
This attribute data from the 3D model was then imported into GIS (MapInfo). Users
are able to view and work with the 3D model in Revit (helpful for visualizing the
building) while the data from the 3D Model is imported into the GIS database thus
allowing spatial analysis capabilities on the building attribute data. The data from the
3D Model can thus be used to retrieve various trends, patterns and query specific
information, which weren’t originally seen by the user in the 3D building model.
This opens up the integrated 3DPBM-GIS system to applications in numerous fields
such as Safety Management, Facilities Management and Operations and
Maintenance, which require data from the completed facility or structure.

6
Some of the possible benefits of the integrated 3DPBM-GIS system can be listed
as:
1. Tracking and documentation of changes/renovations across campus through a
central database.
2. A systematic and well monitored system will help in tracking down the
problems within a facility, thus helping in a quick and effective solution
(temporary as well as permanent).
3. Since the facilities management will be carried out from a central database it
will be easier to relate and understand any proposed changes in the existing
facilities as they affect the surrounding facilities and environment.
4. This project will help in reducing some of the contracting costs for facilities
management by providing up-to-date information (spatial as well as attribute
information) from a central database, avoiding the need to maintain and
integrate different databases across campus.
5. Facilities space management applications such as knowing accurate space
measurements, space usage (office, labs, classrooms, etc.), maintaining space
occupancy records and department responsible can be very useful to facility
managers.
7
2. Objectives
2.1 Facilities Management:
Facility Management refers to buildings in use, to the planning, design, management
of occupied buildings and their associated building systems, equipment and furniture
to enable and to enhance the organization’s ability to meet its business or
programmatic objectives. It is the practice of coordinating the physical workplace
with the people and work of the organization, to integrate the principles of business
administration, architecture and the behavioural and engineering sciences.[1]
Facility Management thus refers to organizational effectiveness.
Facilities Management can encompass
• Real estate management
• Life cycle cost analysis
• Financial management
• Change management
• Human resource management
• Health and safety
• Contract management
• Building maintenance
• Domestic services
• Utilities supplies
8
2.1.1. What is Facilities Management at WPI:
Facilities Management is a vital strategic discipline because it ‘translates’ the high-
level, strategic change required by senior decision makers into day to day reality for
people in their work or living space.
The university campus provides unique challenges and opportunities as a context for
GIS applications. [2]
• Universities provide multiple communities with different thinking styles,
decision making structures and applications of technology. A system
encompassing all the departments considering all the issues might thus be
difficult to form but useful for accessing the untapped resources presented by
all the departments.
• Creating an all-encompassing system requires collaboration between
departments. For decisions to be made in the context of the larger ‘whole’ of
the university, it will require to draw on information stored in various
departments. An integrated 3DPBM-GIS system can form the foundation on
which shared spatial data are built.
• The use of professional judgment for decision support will be unusable with
the retirement of the personnel responsible for decision making and might
limit the use of any system for graphically rendering solutions or decisions.
The use of an integrated 3DPBM-GIS system will provide structured analyses

9
for decision support by facility managers and will be easily transferable/usable
between different personnel.
In order to make the correct decisions, facilities management needs the correct tools
for maintaining up-to-date information which will aid in making decisions benefiting
the organization in achieving short as well as long term goals.
Currently WPI doesn’t have a central decision making system where all the strategic
decisions to be made can be related to the general context, helping the decision
makers in evaluating the impact of their decisions on other disciplines.
Also the data is not maintained electronically thus providing the ability to view and
analyze the data for informational purposes. Any inefficiency in the maintained
records causes the results to be skewed or biased or inaccurate.
Also all this information is not related to any location or space directly. Users might
know the location of some equipment by knowing the mark numbers or codes
attached to the equipment, but in many cases a standard for recording the mark
numbers or codes for equipment is not maintained. Thus it might be impractical to
know the locations of every equipment on campus by mentally associating it with a
particular location. Also creating a standard for mark numbers or equipment codes for
locating it accurately on campus might work but the process of decoding the code to
find the equipment location might be time consuming.
The use of an integrated 3DPBM-GIS system will provide electronic maintenance of
records which are spatially referenced and which can be easily viewed and queried to
provide the required information useful for facilities maintenance.
10
Also the data attributes such as space, furniture, equipment and employee
characteristics will be linked to graphics offering analysis capabilities including
optimization studies, space utilization and cost projections.
The integrated 3DPBM - GIS system can thus provide some solutions to the current
needs of facilities management at WPI.
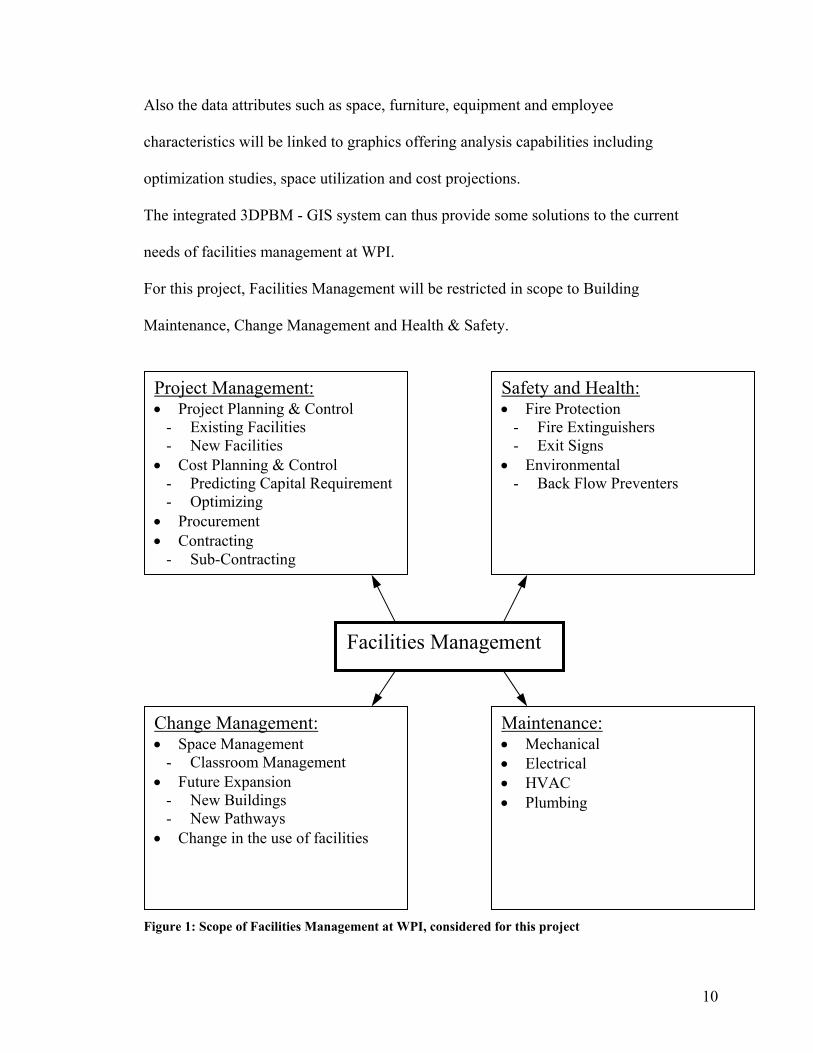
For this project, Facilities Management will be restricted in scope to Building
Maintenance, Change Management and Health & Safety.
Figure 1: Scope of Facilities Management at WPI, considered for this project
Facilities Management
Change Management: • Space Management
- Classroom Management • Future Expansion
- New Buildings - New Pathways
• Change in the use of facilities
Maintenance: • Mechanical • Electrical • HVAC • Plumbing
Safety and Health: • Fire Protection
- Fire Extinguishers - Exit Signs
• Environmental - Back Flow Preventers
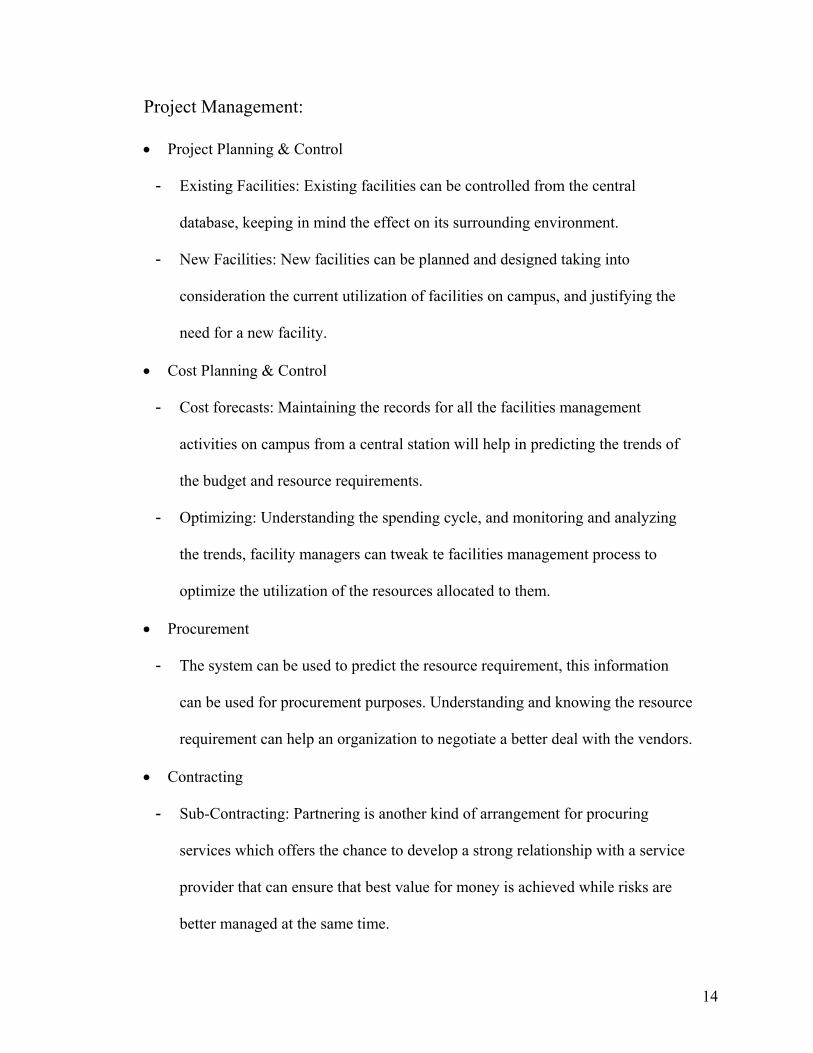
Project Management: • Project Planning & Control
- Existing Facilities - New Facilities
• Cost Planning & Control - Predicting Capital Requirement - Optimizing
• Procurement • Contracting
- Sub-Contracting
11
The figure represents the scope of facilities management as considered for this
project.
Facilities management can be divided into Maintenance, Change management, Safety
& Health issues and Project Management.
Maintenance:
Maintenance includes the daily maintenance, cleanup and servicing of the buildings
and facilities on campus, the various mechanical, electrical, HVAC and plumbing
equipment and also the seasonal maintenance to be carried out such as clearing of
snow from the pathways during the winter, etc.
Change Management:
• Space Management can be classified as a part of change management because of
the need to assign classroom space for different classes for each semester. It can
encompass:
- Development of standards for consistent space allocation of offices,
workstations, conference rooms and support spaces; achieving consistency
between facilities, improved workplace productivity and reduced facility
management costs.
- One such standard at WPI is that every space on campus must have a minimum
utilization of 67%.
• Developing a modular standard "kit of parts" for consistent workstation, private
office and support area furniture requirements. The objective is to achieve
12
maximum flexibility, lower the long-term cost of ownership and increase ability
to support change while maximizing productivity.[3]
• Future Expansion:
- Consideration should be given for the future expansion needs and addition of
new facilities on campus. Design and planning for new facilities can be done
considering the user requirements, and how efficiently or completely those are
satisfied by the current facilities. This efficiency can be determined by
understanding the (under)utilization of facilities on campus (Space
Management).
• Change in the use of facilities:
- Predicting/visualizing the functionality of the facility for a use different than the
present, and its reactivity in terms of providing a functional, safe, and
productive environment for the users, towards the achievement of the
organizations objectives.
Safety and Health:
• Fire Protection:
- Providing a safe environment to aid in increasing the organization’s
productivity.
- Inspection, maintenance and servicing of the fire protection equipment such as
the Fire Extinguishers, the Exit Signs, and the Emergency Lights to ensure their
proper functionality, to provide a safe exit for the building occupants in case of
a need for an emergency evacuation.
13
- Various federal, state and local statutes need to be followed while providing for
such safety facilities on campus. Inspection of the facilities to ensure proper
code enforcement must be done as a safety requirement.
• Environmental Issues:
- Impact of the facility on local environment should be assessed periodically and
should be controlled to ensure a minimal effect on its surroundings. The impact
could be Pollution (Air, Noise, Water, Land, etc.)
Backflow Preventer is a device used to prevent the back flow of wastewater
into the fresh water lines in case of a mechanical failure. A failure such as a
leakage in the mains may cause a negative pressure to develop in the mains
which may result in a negative pressure head causing the wastewater to flow
into the fresh water mains, thus contaminating the local water supply.
Backflow Preventers on campus are specifically used on lines discharging
contaminants and hazardous or toxic wastes that might be very harmful for
human health. Examples of locations for providing backflow preventers could
be the outlet for laboratory facilities or some industrial facility where the point
of fresh water outlet comes in contact with other contaminants which could be
sucked into the fresh water lines due to a negative pressure head in the water
lines.
This space left blank intentionally
14
Project Management:
• Project Planning & Control
- Existing Facilities: Existing facilities can be controlled from the central
database, keeping in mind the effect on its surrounding environment.
- New Facilities: New facilities can be planned and designed taking into
consideration the current utilization of facilities on campus, and justifying the
need for a new facility.
• Cost Planning & Control
- Cost forecasts: Maintaining the records for all the facilities management
activities on campus from a central station will help in predicting the trends of
the budget and resource requirements.
- Optimizing: Understanding the spending cycle, and monitoring and analyzing
the trends, facility managers can tweak te facilities management process to
optimize the utilization of the resources allocated to them.
• Procurement
- The system can be used to predict the resource requirement, this information
can be used for procurement purposes. Understanding and knowing the resource
requirement can help an organization to negotiate a better deal with the vendors.
• Contracting
- Sub-Contracting: Partnering is another kind of arrangement for procuring
services which offers the chance to develop a strong relationship with a service
provider that can ensure that best value for money is achieved while risks are
better managed at the same time.

15
For the scope of this project, only certain equipment within the Kaven Hall building
(Department of Civil and Environmental Engineering) at WPI will be considered for
Facilities Management.
List of equipment considered for the purpose of Facilities Management for this
project:
1. Fire Extinguishers
2. Exit Signs
3. Back Flow Preventers
4. Space Management
a. Classroom Management
5. Doors
6. Windows
7. Flooring
8. Ceiling
9. Walls
2.1.2. Benefits of this project towards improving Facilities Management:
Currently WPI has hired contractors to map and inspect the safety equipment that are
needed to meet the minimum requirements for the new codes. Wherever the condition
of a building or its safety equipment is found to be inadequate to meet the building
code requirements, the equipment will have to be upgraded to be code compliant.
This process has already started, and will make some of the equipment files and
documentation obsolete. There is currently no all-encompassing location map
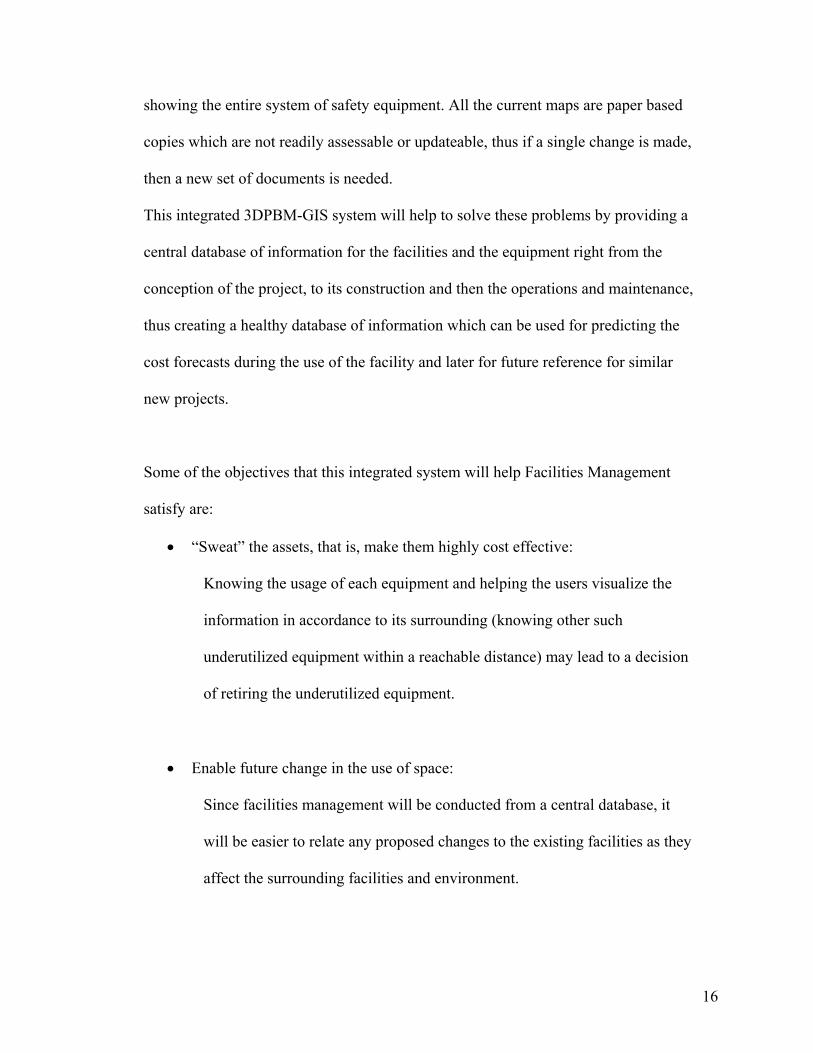
16
showing the entire system of safety equipment. All the current maps are paper based
copies which are not readily assessable or updateable, thus if a single change is made,
then a new set of documents is needed.
This integrated 3DPBM-GIS system will help to solve these problems by providing a
central database of information for the facilities and the equipment right from the
conception of the project, to its construction and then the operations and maintenance,
thus creating a healthy database of information which can be used for predicting the
cost forecasts during the use of the facility and later for future reference for similar
new projects.
Some of the objectives that this integrated system will help Facilities Management
satisfy are:
• “Sweat” the assets, that is, make them highly cost effective:
Knowing the usage of each equipment and helping the users visualize the
information in accordance to its surrounding (knowing other such
underutilized equipment within a reachable distance) may lead to a decision
of retiring the underutilized equipment.
• Enable future change in the use of space:
Since facilities management will be conducted from a central database, it
will be easier to relate any proposed changes to the existing facilities as they
affect the surrounding facilities and environment.
17
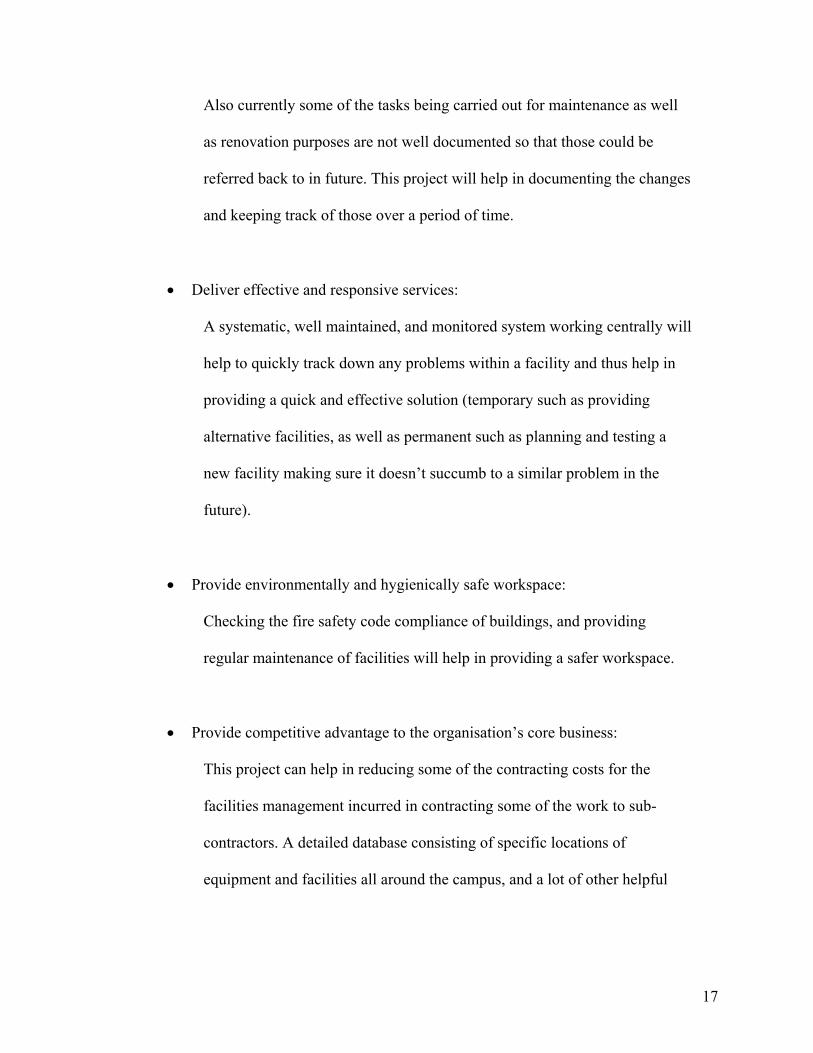
Also currently some of the tasks being carried out for maintenance as well
as renovation purposes are not well documented so that those could be
referred back to in future. This project will help in documenting the changes
and keeping track of those over a period of time.
• Deliver effective and responsive services:
A systematic, well maintained, and monitored system working centrally will
help to quickly track down any problems within a facility and thus help in
providing a quick and effective solution (temporary such as providing
alternative facilities, as well as permanent such as planning and testing a
new facility making sure it doesn’t succumb to a similar problem in the
future).
• Provide environmentally and hygienically safe workspace:
Checking the fire safety code compliance of buildings, and providing
regular maintenance of facilities will help in providing a safer workspace.
• Provide competitive advantage to the organisation’s core business:
This project can help in reducing some of the contracting costs for the
facilities management incurred in contracting some of the work to sub-
contractors. A detailed database consisting of specific locations of
equipment and facilities all around the campus, and a lot of other helpful

18
attribute data will avoid the need to create and maintain different databases
and providing links between them.
This integrated system will thus help Facilities management to provide more value for
the facility in terms of a better life cycle cost benefit.

19
2.2 Current solutions available for Facilities Management
2.2.1 CAD:
CAD (Computer-Aided Design/ Drafting) can be described as the use of computers
for creating and editing drawings. Before the 1980s, most drawings, including maps,
floor plans, and engineering designs, were created using paper and ink or drawn using
expensive time-sharing CAD systems.
In 1963, Ivan Sutherland did the PhD thesis ‘Sketchpad’ at MIT. Highly precise
drawings could be created, manipulated, duplicated, and stored. The software
provided a scale of 2000:1, offering many acres of drawing space. This was the first
step towards CAD.[5]
Later in 1980, Mike Riddle wrote ‘MicroCAD’, later known as ‘Interact’, and
ultimately called ‘AutoCAD’.
In 1984, Smith and Davies found Micro-Control Systems to build cheap 3D
digitizers; shortly thereafter, they released ‘CADKEY’, the first all-3D PC CAD
product.
Cericor, a software development firm, released the first ever Object Oriented CAD in
1986 (later acquired by HP). In the mid 1990’s Autodesk acquired Woodbourne with
their parametric solid modeler - precursor of Mechanical Desktop.
Soon after, AutoCAD 13 was released in 1996, with object-oriented kernel for 2D
and 3D.
Visio released ‘IntelliCAD’, an inexpensive replacement for AutoCAD. In 1999,
AutoCAD 2000 was released. Revit Technology Corporation founded in 1997
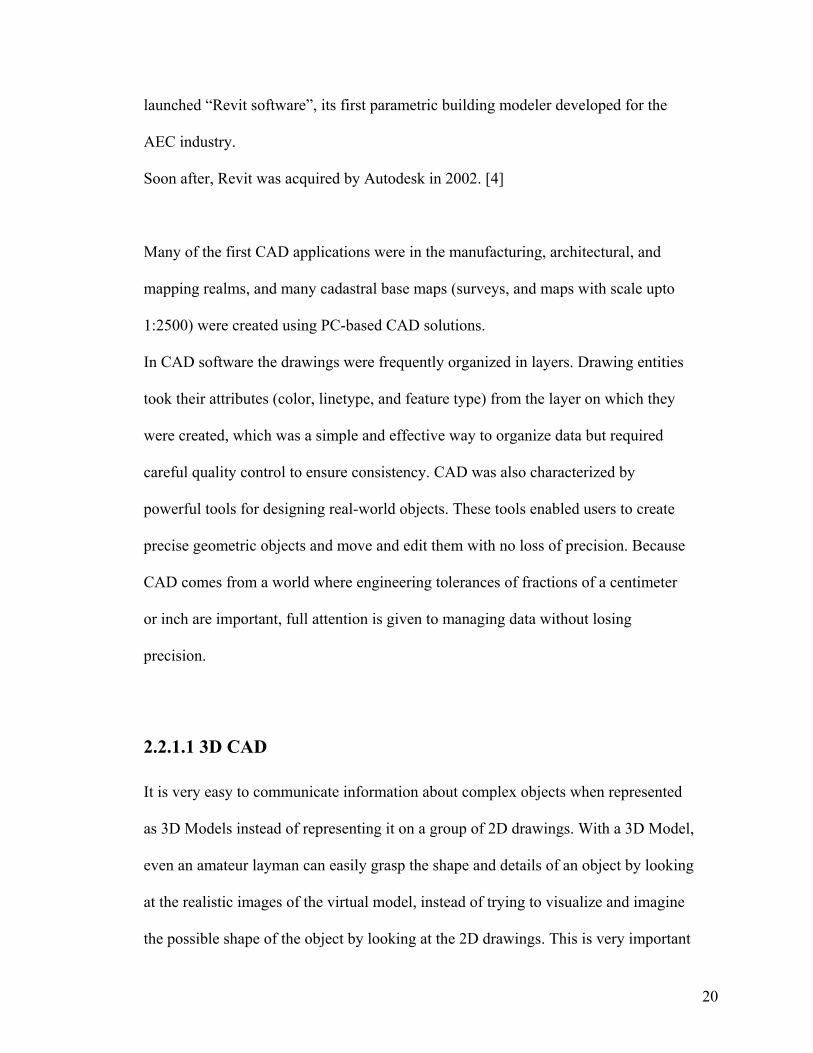
20
launched “Revit software”, its first parametric building modeler developed for the
AEC industry.
Soon after, Revit was acquired by Autodesk in 2002. [4]
Many of the first CAD applications were in the manufacturing, architectural, and
mapping realms, and many cadastral base maps (surveys, and maps with scale upto
1:2500) were created using PC-based CAD solutions.
In CAD software the drawings were frequently organized in layers. Drawing entities
took their attributes (color, linetype, and feature type) from the layer on which they
were created, which was a simple and effective way to organize data but required
careful quality control to ensure consistency. CAD was also characterized by
powerful tools for designing real-world objects. These tools enabled users to create
precise geometric objects and move and edit them with no loss of precision. Because
CAD comes from a world where engineering tolerances of fractions of a centimeter
or inch are important, full attention is given to managing data without losing
precision.
2.2.1.1 3D CAD
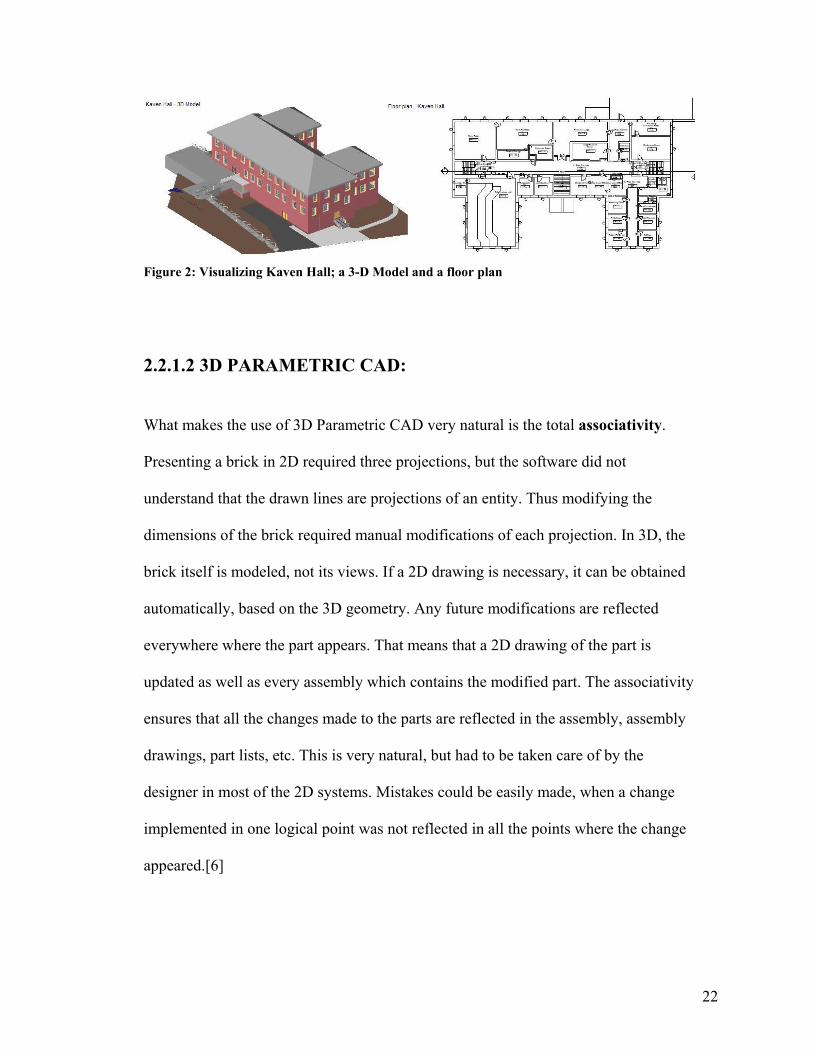
It is very easy to communicate information about complex objects when represented
as 3D Models instead of representing it on a group of 2D drawings. With a 3D Model,
even an amateur layman can easily grasp the shape and details of an object by looking
at the realistic images of the virtual model, instead of trying to visualize and imagine
the possible shape of the object by looking at the 2D drawings. This is very important

21
as such images are directly understandable not only by the engineers, but by all the
project participants who come from a wide variety of backgrounds, which makes
presentation, evaluation, and decision making substantially easier. The importance of
visualization is especially big in customer-oriented companies, as visual evaluation of
the products can be done together with the customers even if no physical prototype
exists (this is specially true in the construction industry).
In 3D CAD, the data is stored as lines, planes and surfaces creating a 3D object when
viewed as a group. The object is recognized as a group of lines, planes and surfaces
by the software, with no additional information about the objects.
The great advantage of 3D models is that they eliminate the drawing translation
process – the time it takes to make sense of a 2D drawing. A few complex drawings
can be so difficult to read only their designers really understand them. In contrast,
users only faintly familiar with a product modeled in solids (3-dimensional) know
exactly what it is. And that’s the point – understanding is near simultaneous, and
collaboration and communication becomes a by-product.
This Space Left Blank Intentionally
22
Figure 2: Visualizing Kaven Hall; a 3-D Model and a floor plan
2.2.1.2 3D PARAMETRIC CAD:
What makes the use of 3D Parametric CAD very natural is the total associativity.
Presenting a brick in 2D required three projections, but the software did not
understand that the drawn lines are projections of an entity. Thus modifying the
dimensions of the brick required manual modifications of each projection. In 3D, the
brick itself is modeled, not its views. If a 2D drawing is necessary, it can be obtained
automatically, based on the 3D geometry. Any future modifications are reflected
everywhere where the part appears. That means that a 2D drawing of the part is
updated as well as every assembly which contains the modified part. The associativity
ensures that all the changes made to the parts are reflected in the assembly, assembly
drawings, part lists, etc. This is very natural, but had to be taken care of by the
designer in most of the 2D systems. Mistakes could be easily made, when a change
implemented in one logical point was not reflected in all the points where the change
appeared.[6]
23
Parametric representation is also a very useful innovative feature of the 3D CAD: it
means that the main numerical values used for modeling entities are stored and can be
modified directly by the user. For example a 3D software understands what it means
to change the "length" of a brick (E.g.: Length = Width * 2, so changing the length of
a brick manually will automatically change its width). In 2D, the user had to mainly
deal with correcting graphical entities which had no special meaning for the software.
Parametric approach makes the 3D CAD software a more suitable tool for design
customization as the small logical changes are easy to implement whereas in non-
parametric software even a logically small modification implies a substantial amount
of routine work.
A couple of software packages have emerged in the market which support the use of
parametric building model such as: Revit by Autodesk. (http://www.revit.com),
MicroStation by Bentley (www.bentley.com) and ArchiCAD by Graphisoft
(www.graphisoft.com)
Autodesk REVIT:
Revit is a 3 dimensional object oriented parametric building modelling software. The
building information is created and designed as a collection of objects rather than
simply representing the building graphically as lines. Users work with real world
objects such as walls, doors, windows, etc. creating 3-dimensional models of
buildings instead of plans, elevations and sections. Numerous plan, section and
elevation views can then be extracted from the 3D building model. The parametric
capabilities of Revit allow any changes made in the model to be reflected in all the
24
plans, sections, schedule of quantities to be updated to the model as a whole and are
reflected in the elevations, 3D views, sections and schedules of quantities.
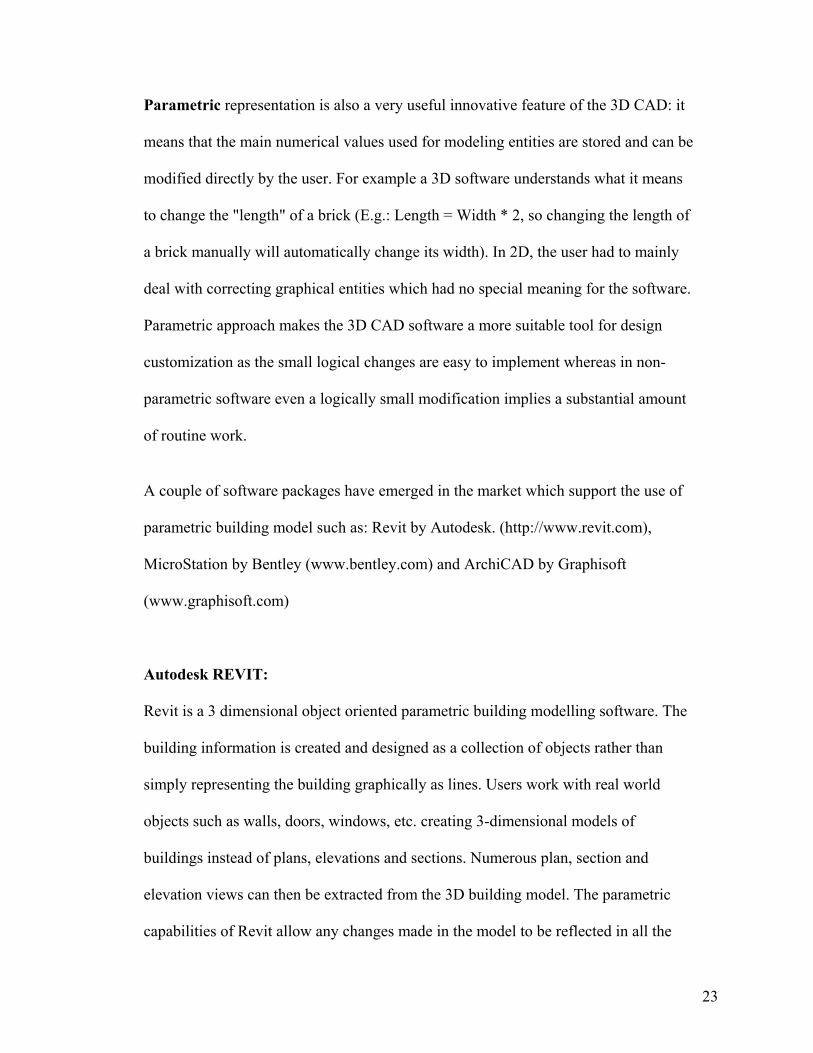
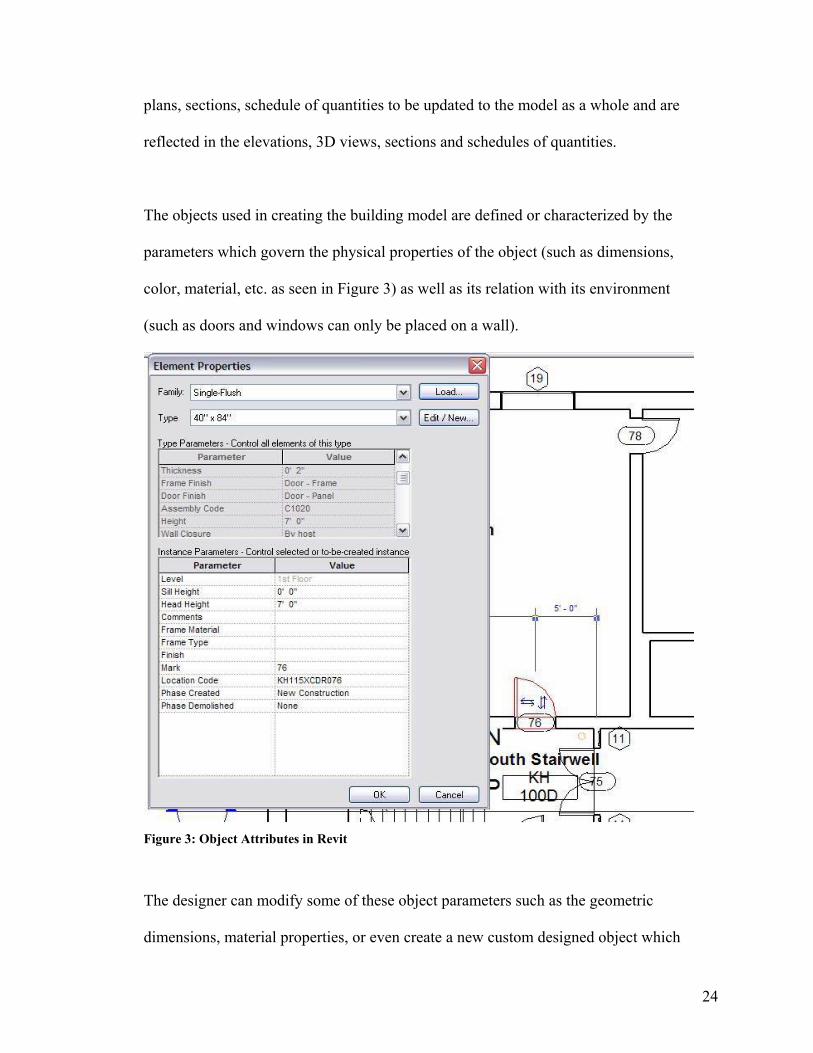
The objects used in creating the building model are defined or characterized by the
parameters which govern the physical properties of the object (such as dimensions,
color, material, etc. as seen in Figure 3) as well as its relation with its environment
(such as doors and windows can only be placed on a wall).
Figure 3: Object Attributes in Revit
The designer can modify some of these object parameters such as the geometric
dimensions, material properties, or even create a new custom designed object which
25
is not already present in the object library. These objects when used to create the
building models, already have some attribute data associated with them, which can be
useful for facilities management as well as operations and maintenance such as the
manufacturer name, the date of installation, the cost of the item, the material finish,
fire rating, assembly codes (Uniformat: Standard Classification of Building Elements
and Related Site work. This classification enables a seamless link of all phases of a
building life cycle - from facilities development through facilities management.), etc.
along with the dimensional parameters such as the dimensions.
All this attribute information associated with the objects can be modified by the
designer to represent the correct/actual data for the objects that will be used in the
actual construction.
Revit also provides documentation capabilities. Users can create quantity schedules
for objects such as doors, windows, allowing all the attribute fields to be displayed.
The parametric process is extended out to the documentation side, where changes
made to door schedules, room schedules, size amendments are fed back into the
model. This will certainly take the chore out of going through the entire set of plans
amending each door in turn. The same can be applied to windows, M&E components,
rooms and fixtures and fittings.
Thus the 3D Model contains spatial data (location of various objects within the
project space) as well as attribute data (features and characteristics of the objects)
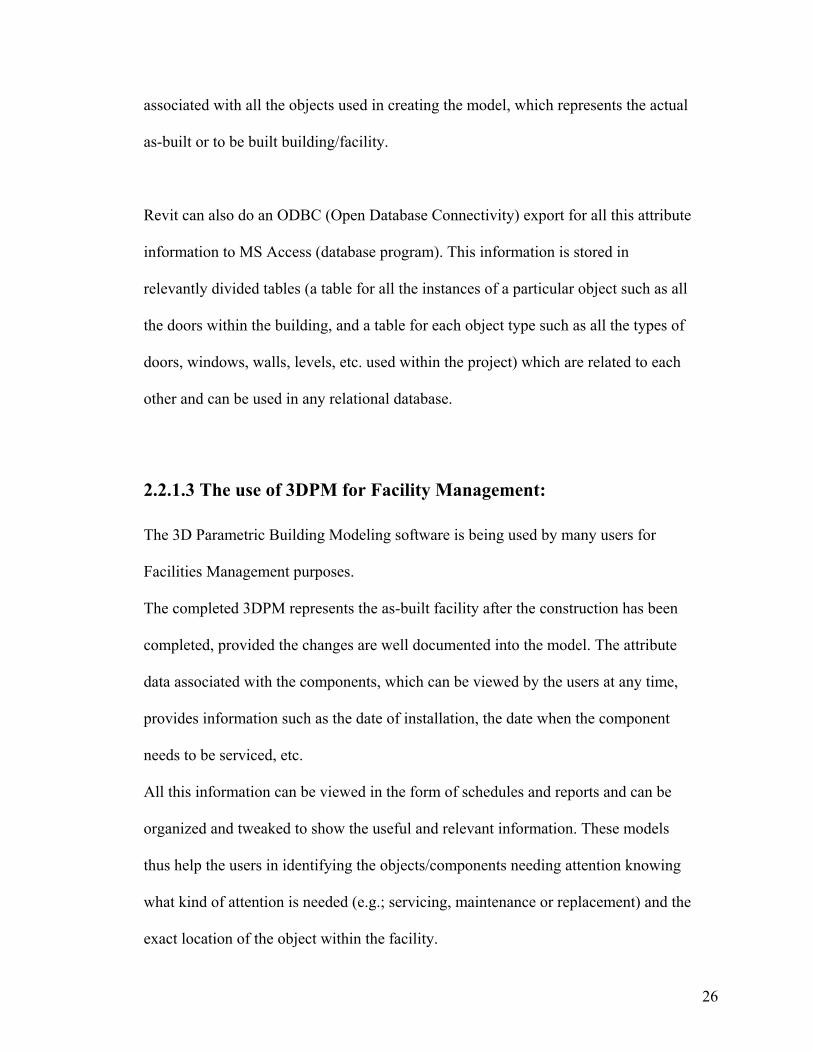
26
associated with all the objects used in creating the model, which represents the actual
as-built or to be built building/facility.
Revit can also do an ODBC (Open Database Connectivity) export for all this attribute
information to MS Access (database program). This information is stored in
relevantly divided tables (a table for all the instances of a particular object such as all
the doors within the building, and a table for each object type such as all the types of
doors, windows, walls, levels, etc. used within the project) which are related to each
other and can be used in any relational database.
2.2.1.3 The use of 3DPM for Facility Management:
The 3D Parametric Building Modeling software is being used by many users for
Facilities Management purposes.
The completed 3DPM represents the as-built facility after the construction has been
completed, provided the changes are well documented into the model. The attribute
data associated with the components, which can be viewed by the users at any time,
provides information such as the date of installation, the date when the component
needs to be serviced, etc.
All this information can be viewed in the form of schedules and reports and can be
organized and tweaked to show the useful and relevant information. These models
thus help the users in identifying the objects/components needing attention knowing
what kind of attention is needed (e.g.; servicing, maintenance or replacement) and the
exact location of the object within the facility.

27
2.2.2 GIS:
When Geographic Information Systems (GIS) was introduced in the early 1950’s, its
early use was limited to small group of researchers. Botanists, meteorologists, and
transportation planners began automating the process of thematic mapping. These
researchers’ efforts represent the early attempts at computerized cartography.[8]
GIS can be defined as:
Geographic: The system is concerned with data relating to geography and
geographic scales of measurement. This is referenced by some coordinate system or
locations on the surface of the earth.
Information: The system allows for the storage and extraction of specific and
meaningful attribute information. These data are connected to some geography, and
are organized around a model of the real world. Spatial and aspatial queries are
made possible.
Systems: An automated system should include an integrated set of procedures for the
input, storage, manipulation, and output of geographic information.
GIS relies on the integration of three areas of computer technology. A relational
database management system to store graphic and non-graphic data; cartographic
capabilities to depict, graph, and plot geographic information; and spatial analytical
capabilities to facilitate manipulation and spatial analysis.
28
Geographic information systems are among the most exciting and powerful geomatics
decision-making tools in the world. (Geomatics, also known as geoinformatics, is the
science and technology of gathering, analyzing, interpreting, distributing and using
geographic information. Geomatics encompasses a broad range of disciplines
including surveying and mapping, remote sensing, geographic information systems
(GIS), and the Global Positioning System (GPS)).
GIS has grown out of a number of technologies, including cartography, information
management, computer science, photogrammetry and remote sensing. Advancements
made in these fields correspond to advancements in GIS. This technology therefore
consists of computer software and hardware designed to organize spatial data for
analysis, assessment and cartographic depiction. It provides a mechanism by which
information on a feature’s location, spatial interaction and geographic relationship
can be assessed and viewed in moments. It provides an opportunity to efficiently view
and access geographic data to improve the decision-making process.
A GIS uses computer technology to integrate, manipulate and display a wide range of
information to create a picture of an area's geography, environment and socio-
economic characteristics. Beginning with a computerized topographic map as its base,
a GIS overlays and integrates graphic and textual information from separate
databases. The end result is a customized and reliable tool that can support decision
making and problem solving and provide almost instantaneous answers to complex
questions.
29
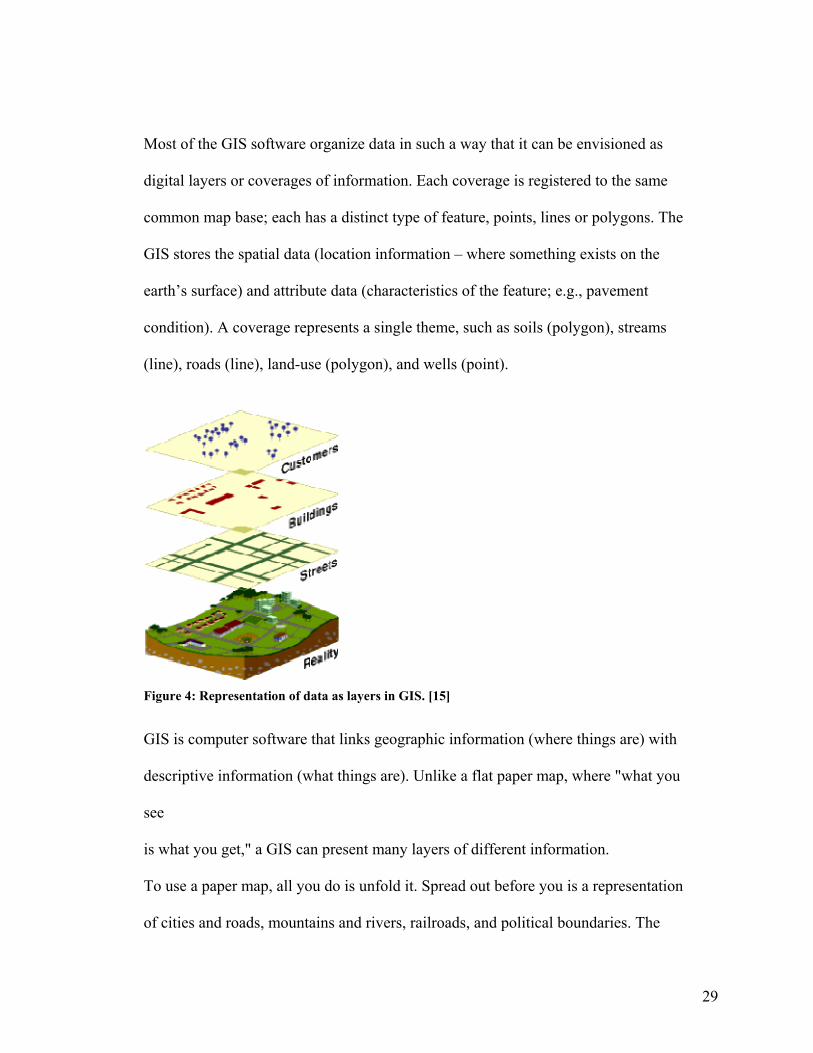
Most of the GIS software organize data in such a way that it can be envisioned as
digital layers or coverages of information. Each coverage is registered to the same
common map base; each has a distinct type of feature, points, lines or polygons. The
GIS stores the spatial data (location information – where something exists on the
earth’s surface) and attribute data (characteristics of the feature; e.g., pavement
condition). A coverage represents a single theme, such as soils (polygon), streams
(line), roads (line), land-use (polygon), and wells (point).
Figure 4: Representation of data as layers in GIS. [15]
GIS is computer software that links geographic information (where things are) with
descriptive information (what things are). Unlike a flat paper map, where "what you
see
is what you get," a GIS can present many layers of different information.
To use a paper map, all you do is unfold it. Spread out before you is a representation
of cities and roads, mountains and rivers, railroads, and political boundaries. The
30
cities are represented by little dots or circles, the roads by black lines, the mountain
peaks by tiny triangles, and the lakes by small blue areas similar to the real lakes.
A digital map is not much more difficult to use than a paper map with an added
functionality to zoom in and out. As on the paper map, there are dots or points that
represent features on the map such as cities, lines that represent features such as
roads, and small areas that represent features such as lakes.
All this information—where the point is located, how long the road is, and even how
many square miles a lake occupies—is stored as layers in digital format as a pattern
of ones and zeros in a computer.
Think of this geographic data as layers of information underneath the computer
screen.
Each layer represents a particular theme or feature of the map. One theme could be
made up of all the roads in an area. Another theme could represent all the lakes in the
same area. Yet another could represent all the cities as seen in Figure 4.
These themes can be laid on top of one another, creating a stack of information about
the same geographic area. Each layer can be turned off and on, as if peeling a layer
off the stack or placing it back on. Users can control the amount of information about
an area that they want to see, at any time, on any specific map.[9]
Why is this layering so important? The power of a GIS over paper maps is the ability
to select the information needed to see according to what goal the user is trying to
achieve.
31
A business person trying to map customers in a particular city will want to see very
different information than a water engineer who wants to see the water pipelines for
the same city. Both may start with a common map—a street and neighborhood map
of the city—but the information they add to that map will differ.[10]
Components of GIS:
There are four integrated components of GIS: data and databases, hardware, software,
and users.
Data and databases: The data in GIS are by definition geographic. Spatial data being
specifically location information pertaining to where objects of interest are located,
their distribution and extent, adjacency, proximity, and connectivity, verses, attribute
data, or observation about features.
Geographic information systems rely on two interrelated types of databases:
The Spatial Database: Describes the location and shape of geographic features, and
their spatial relationship to other features. The information contained in the spatial
database is held in the form of digital co-ordinates, which describe the spatial
features. These can be points (for example, buildings), lines (for example, roads), or
polygons (for example, land parcels, administrative districts). Normally, the different
sets of data will be held as separate layers, which can be combined in a number of
different ways for analysis or map production.
The Attribute Database: The attribute database is of a more conventional type; it
contains data describing characteristics or qualities of the spatial features (i.e.,
descriptive information): land use, type of soil, distance from the regional centre, type

32
of road, population of the administrative districts. Thus, we could have land use zones
(polygons) and facility locations (points) in the spatial database, and characteristics of
these features in the attribute database, for instance, number of shopping centers
within a zone area.
GIS links spatial data with geographic information about a particular feature on a
map. The information is stored as ‘attributes’ of the graphically represented feature.
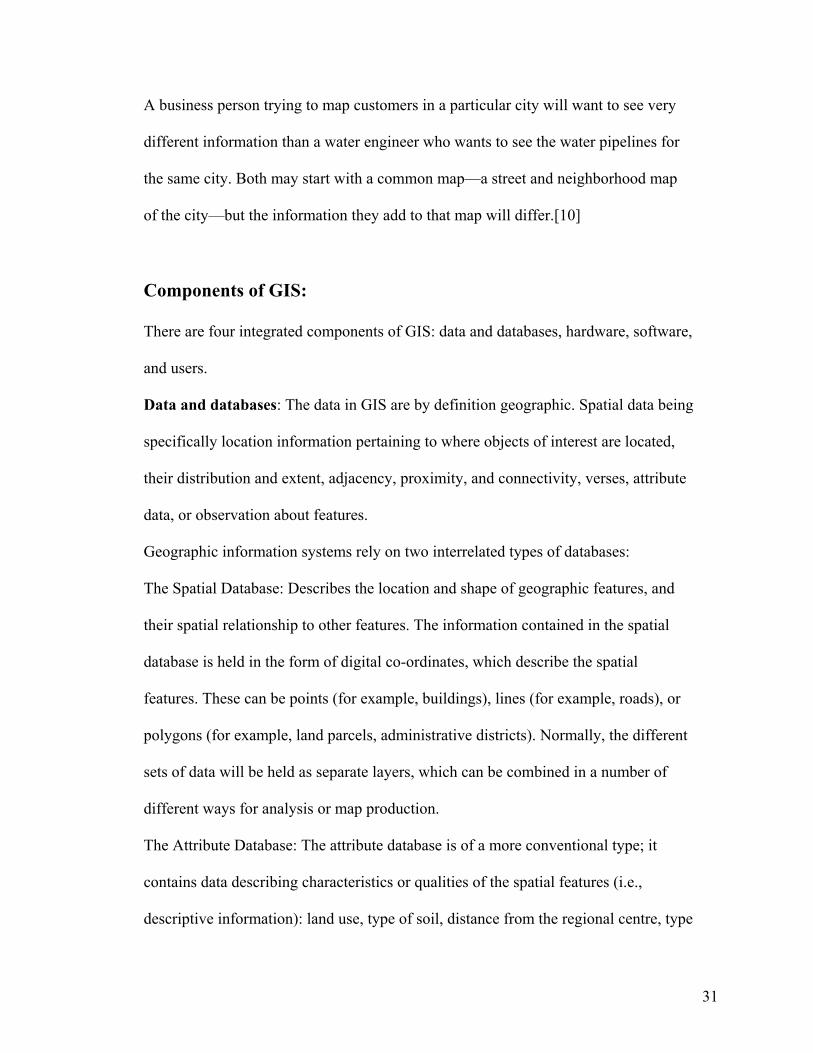
Figure 5: Example: A line that denotes a road tells you nothing but its location. An attribute table stores all relevant (descriptive) information about this feature, which can be queried and displayed in many formats based on the user’s needs.[11]
Data Availability and Quality Issues:
One potential problem with GIS is the availability and quality of data needed by such
systems to use and analyze in order to produce meaningful results. The data provided
may be inaccurate or incomplete or inappropriate for some particular use, e.g., not of
the appropriate geographic scale needed in some situation (Albert et al, 2000). Data is
usually accompanied by descriptions (metadata). Spatial data quality standards are
33
now in place to help users understand what is out there and the intended purpose of
the dataset.
The dataset should also have accurate and current attribute data, meaning the
information (attribute data) attached with the location (spatial data) should be correct
and current
E.g.: the system doing a traffic flow analysis to calculate alternate routes for
emergency vehicles will have an inaccurate dataset if the street locations are incorrect
or are not updated, or if they have wrong or misspelled names, whereas a system
working on a state level providing traffic flow analysis to show change in population
will not consider the street names as necessary in order to get accurate results.
The data should be updated frequently to maintain a working dataset because many of
the GIS applications today work with ever changing data.
Thus if the data is not updated or current (considering the application), the results
provided by the GIS will be based on obsolete data and thus will be of no relevance.
The data accuracy and integrity is thus defined by the application for which it will be
used. Also it is a function of the cost that should be incurred in gathering the data
because more accurate data generally means increased cost, while less accurate data
might result in unreliable or insignificant results.

34
Also the data can cost upto 80 percent of the total GIS project cost (including all the
infrastructure as well as technical skills employed to undertake the project) depending
on the type of project and its data requirements.
Hardware: A fully functional GIS must contain hardware to support data input,
output, storage, retrieval, display and analysis. Hardware essentials focus on the
platform and peripheral devices. Rapid improvements in computer technologies have
allowed the advent of true desktop GIS functionality.
Software: Many GIS software packages are on the market, each offering different
levels of functionality. Turnkey systems (ready for use directly out of the box) such
as EVS by and customized installations are all possible. Because GIS software
packages are so numerous the trend is to perform a needs assessment or requirements
analysis prior to committing to a purchase from one vendor.
Users: The true GIS professional needs to be well versed in many disciplines. Map
reading, database management, spatial analysis, computer cartography, computer
science, programming, and basic geography are disciplines in which a thorough
grounding is required. A balanced education in GIS theory and practical experience
(familiar with GIS software) are essential. However, three categories of GIS users
have developed: (a) System Users, technical people who have hands on use of GIS;
(b) End Users, people who make use of the end product; (c) Data Generators, people
who enter or capture data for analysis in GIS.
35
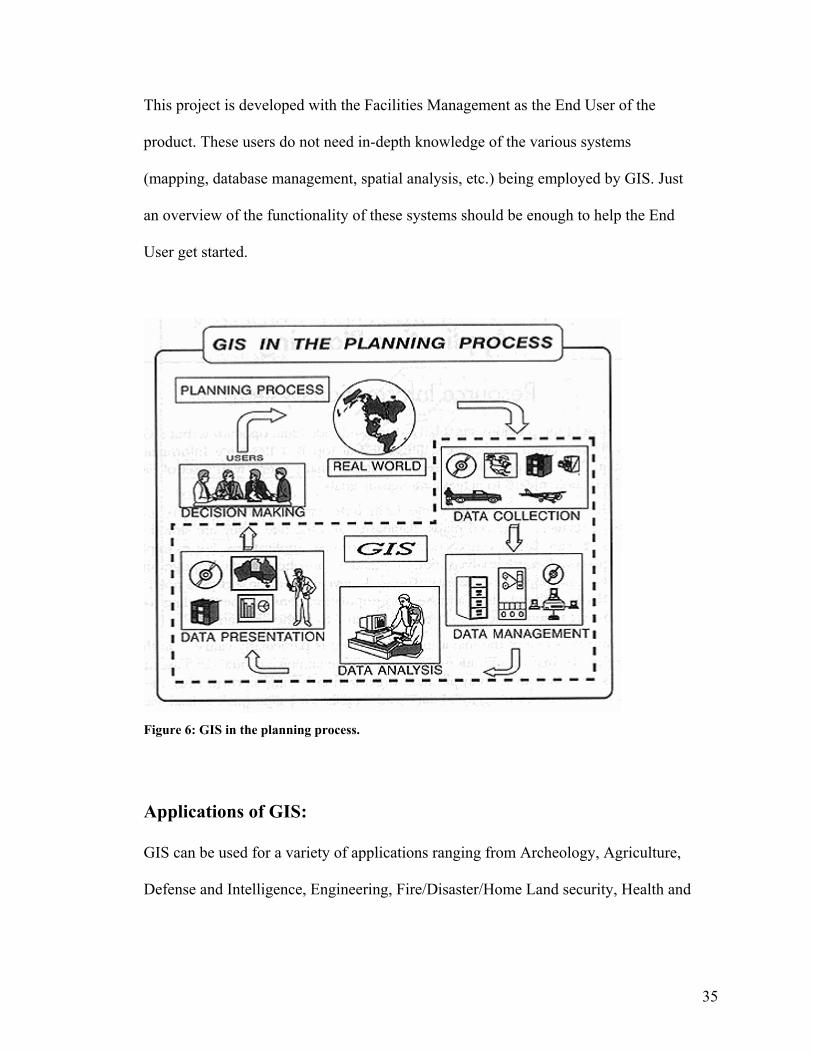
This project is developed with the Facilities Management as the End User of the
product. These users do not need in-depth knowledge of the various systems
(mapping, database management, spatial analysis, etc.) being employed by GIS. Just
an overview of the functionality of these systems should be enough to help the End
User get started.
Figure 6: GIS in the planning process.
Applications of GIS:
GIS can be used for a variety of applications ranging from Archeology, Agriculture,
Defense and Intelligence, Engineering, Fire/Disaster/Home Land security, Health and
36
human services, Insurance, Landscape architecture, Media, Mining, Real Estate, State
and Local governments, Transportation, Universities, Water and wastewater.
Some questions a GIS can answer are:
Condition: What is…?
Location: Where is it?
Trends: What has changed since...?
Patterns: What spatial patterns exist?
Modeling: What if...?
Fire/Disaster/Homeland Security:
GIS is used as an interface for integrating and accessing massive amounts of location
based information in the public safety market. GIS allows public safety personnel to
effectively plan for emergency response, determine mitigation priorities, analyze
historical events, and predict future events. GIS can also be used to get critical
information to emergency responders upon dispatch or while en route to an incident
to assist in tactical planning. Customers including SAIC, Federal Emergency
Management
Association, the National Institute of Justice, and many city and county governments
are using GIS to make the world a safer place.

37
Landscape Architecture:
Landscape architecture is the design, planning, and management of natural and
manmade environments. It is a discipline grounded in spatial thinking. GIS is
increasingly important as a tool for organizing digital spatial data in an accessible and
logical manner.
This allows landscape architects to consider more design options and to do so more
quickly and efficiently than ever before when designing new communities.
Real Estate:
The real estate industry has always known geography matters; after all, real estate
professionals coined the phrase "location, location, location." Since location is what
GIS is all about, ESRI is actively engaged in implementing GIS-based solutions in all
segments of the real estate industry from map-based contact management to
sophisticated investment analysis in large real estate investment trusts. Companies
such as SSR Realty
Advisors, Inc., use GIS in commercial real estate, while Homestore.com uses GIS
software to bring maps online to people shopping for a new home.
An example of the use of GIS in Facilities Management:
The InfoGraphics Lab housed in the Department of Geography coordinates the
University of Oregon Campus Mapping Program with several University Offices.
This effort supports the mapping and graphic needs of a wide range of users from
several disciplines. [12]
38
The Campus Mapping Program has evolved into three main work areas: 1)
Architectural Applications, 2) GIS/Facilities Mapping, and 3) Map Publishing
The Architectural Applications consist of the development of a Bentley MicroStation
CAD database of buildings with floor plans and interior features. The CAD building
drawings are used for remodels and various architectural and planning needs. The
CAD files are integrated with the ArcView GIS database by geo-referencing the
building drawings using a world file for the campus map coordinate system. A layer
within the CAD file is defined for room polygons. In ArcView the CAD file is added
and the level with the room polygons is converted to a shape file (ArcInfo format)
and attributes are added.
The GIS/Facilities Mapping area can be divided into two main categories: Building
Maintenance and Grounds Maintenance. The Building Maintenance applications
track a variety of maintenance and infrastructure information down to the room level.
The Grounds Maintenance applications track campus-wide information on trees,
storm lines, and sanitary lines. The GIS database is stored in an ArcView GIS shape
file format. A Web-based GIS server application is being planned. The GIS database
is evolving as the primary source for data for final map publications. The ArcView
Shape files are converted into Macromedia Freehand using Avenza MaPublisher
which maintains the map scale and projection.

39
2.2.4 The need for improved use of IT in Facilities Management
Currently there is no all encompassing system that provides detailed as built
conditions as well as the capability to handle and process huge amounts of data that
can help in facilities management. Different systems are used for different
applications ranging from the conceptualization of a project, to its construction and
then for operations and maintenance when the facility is occupied for use, creating a
need for integration to provide a system that encompasses a project during all its
stages providing facility managers with the most current and accurate data.
2.2.4.1 Need for Integration of CAD and GIS:
GIS users typically perform enterprise data management, decision support,
cartography, and planning and analysis functions. CAD users design, engineer, build,
and operate roadways, buildings, plants, communication networks and other large
constructed assets.
The planning role, for example, requires a broad view of spatial information, the
ability to work with large areas, and a powerful toolbox of analytical functions.
Engineers create and work from sets of detailed drawings and models, with spatial
information, and require a rich set of 2D and 3D geometry-based engineering and
design functions.
The needs of the planner are best met by a continuous database, a GIS. The
Engineer's requirements continue to be best met by a model and drawing paradigm.
Yet, despite distinct roles, planners and engineers very much depend upon each other
to conduct their work. Planners need accurate information on as-built conditions and
40
engineers and architects need the context of plans to create their designs. Operational
staff needs access to all of this information. The work is not static but synergistic,
dynamically integrated, and recursive.[13]
An integrating effort in this direction will help both the AEC participants as well as
the GIS planners in understanding each others role, as well as work in the direction of
creating complementary ideas which will fit each others plans.
CAD became the primary tool for engineering teams to design water and sewer
projects and telecommunication facilities, and for surveyors to produce topographic
plans and subdivision layouts. In some cases, they brought in the underlying land
base from a GIS, and in others they used the CAD system to create the land base.
These users often exported their completed engineering designs and boundary plans
to a GIS, demonstrating the need for data to move in and out of these systems more
than once.
Engineering design and geographic analysis are extremely important to the
organizations that employ CAD and GIS. These distinctive technologies deliver
mission critical answers and excel at discipline specific-tasks that the other performs
poorly or not at all. However, there is increasing demand for CAD and GIS software
that is well integrated. Integration helps professionals throughout a project lifecycle to
exchange data and collaborate more efficiently.[14]
41
The differences between computer-aided design and geographical information
systems make the technologies ideal partners for some AEC applications
Computer-aided design has pervaded nearly every facet of the AEC (architecture,
engineering, and construction) market, from the design of buildings to the layout of
telecommunications facilities to the development of highway proposals. However,
there is one area--arguably one of the fastest growing segments of the market--in
which CAD on its own just can't cut it: the planning, development, and management
of large infrastructure projects for such applications as transportation planning oil and
gas exploration, utilities management, telecommunications network management, and
urban design.
Unlike CAD, which is a tool for creating new information in the form of geometrical
representations of actual or potential structures, GIS is a computer-based tool for
modeling and analyzing existing data and events in the context of their geographical
location. In a typical GIS, information is stored in thematic layers (a Land Use layer
on top of a Streets layer on top of a Districts layer, and so forth), and the layers are
linked by geography. Despite its many capabilities, however, a standalone GIS is
insufficient to meet the demands of the latest crop of infrastructure design and
maintenance projects. While it would clearly meet the informational needs of such
applications, it lacks the graphical design functionality of CAD.
On the surface, the two technologies go together like “cookies and milk”: each has
something that the other doesn't, but together they make the perfect combination.
In recent years, there have been a number of efforts on the software front to facilitate
CAD/GIS integration. Such major CAD and GIS vendors as Autodesk, Intergraph,
42
Bentley Systems, and ESRI have introduced products that attempt to leverage the best
of both CAD and GIS. In addition, some traditional CAD packages have taken on
certain aspects of GIS functionality, such as database-management capabilities, and
some GIS tools have added such CAD functions as 3D projection.
2.2.4.2 The issues in integrating the two systems:
CAD comes from the engineering world, GIS comes from cartography. To GIS
people, topology issues are key. It's really important to them to know who's next to
whom when they've got a property or a line. And they need to know things like the
direction as you're moving down a road. Such issues are of little concern to engineers.
Also, the Earth is round, so projection systems are very much a concern to people in
GIS. Most CAD packages consider the world flat.
When GIS people talk about modeling, they're talking about network analysis, gravity
models, principal component analysis, and such. CAD modelers are dealing with
solid models. They're interested in things like Boolean modeling and rendering. CAD
users tend to deal with smaller objects relative to GIS, which usually deals with areas
on the order of square kilometers.
Another critical difference between the two worlds is the role of data. GIS
applications are by their nature data-centric. The data they incorporate has to live for
a long time and has to be updated and enriched continually. In contrast, CAD has
historically been project-driven: do the project, create the graphic CAD data, then put
it on a shelf so if you ever have to renovate or fix a leaky pipe, you can go back and
reference it. The quality of the data is so critical to GIS, in fact, that more than 80%
43
of the lifecycle cost of any GIS is spent on data creation and maintenance. In CAD,
hardware and software are the primary cost factors.
A significant impediment to bringing CAD and GIS together has to do with the
perceived cost. People don't welcome the prospect of buying two systems, one for
CAD and one for GIS. Yet that's really what has to be done right now to get the best
tool for each task. The other issue is training. It's already hard to find people who are
really good in CAD or GIS. Now there is a need to find someone who's really good in
both.
A number of organizational issues also must be overcome. People are typically rallied
around a particular tool, so there may well be two groups--the GIS group and the
CAD group. One uses one piece of software, and the other uses another one. When it
comes time for someone to go to the other side and ask for information, you have to
throw stuff over the wall. If you're lucky, you catch something on the other side that
you can use.
In order to smooth this transition, a third group is becoming more and more critical.
It's the people who sit in the middle, the information systems people, who can break
down that wall. They typically have the knowledge of the networking and the security
and the database. With such a scenario, the idea of a single design file that one side or
the other owns disappears. The idea is that the data created now gets stored in the
central repository.
This raises other concerns, however. For instance, there are now too many hands on
the data. Who owns the data? Who owns responsibility for the maintenance and

44
update of the data? How do we document the quality and history of the data as it's
passed from one person to the next?
In addition, people don't think highly of having their data exposed to other groups. It
makes a lot of people uncomfortable, and maybe rightly so. Suddenly, people are
going to judge how nicely you made your CAD drawings: Do all your lines meet up?
Are things layered as they're supposed to be? That's scary to put out in the open. On
the other hand, it's almost a guarantee that the quality of the data will increase.
Another challenge to the central repository idea is the current lack of data standards,
not only among vendors, but among applications. Going from CAD to GIS is not
simple. Because no one ever thought they were going to need to do that, the data
doesn't always exist in a format that can be read by a given program. You can't just
take a CAD file and read it into a given GIS program and expect it to work. The
program has to go through and clean the data up, and if the person who created the
data initially wasn't concerned about building a GIS, it could be a real mess.
What perpetuates this problem is the fact that CAD managers don't always, establish
a protocol for entering data, which is crucial to GIS. You might have a budding
footprint made out of line segments. If it's a complicated footprint, you might have 20
line segments. Since it's only one footprint, it should be a polyline or a polygon, not
line segments, because the computer doesn't know what to do with them. So now you
have to go through and join them all together. And what do you do if you have
100,000 properties, all made up of four to ten line segments? Are you going to clean
them all up?
45
Other concerns have to do with the database itself. You've got to make sure the data is
attached to the right objects, and that you had the right data in the first place. Then
you have to worry about where the data's coming from? Is it coming from some tax-
assessment file that's stored in a format that AutoCAD can't read or that [ESRI's]
ArcInfo doesn't know about? If so, you have to translate it, and if you translate it,
which version do you store? Edits and revisions to the data also have to be managed.
If the updates aren't being made to the central database in real time people could be
getting inaccurate information.
For the traditional GIS vendors, the move to lifecycle and data integration has been
more difficult because of their historical focus on polygon analysis without precision
engineering support. In addition, many software vendors have focused on one or two
of the disciplines of GIS, engineering, surveying, and infrastructure management.
One company may specialize in infrastructure management by developing an electric
utility management system, but they rely on other vendors for surveying and data
capture tools that are rarely well integrated.[14]
Early attempts to use CAD for GIS data creation and management were hampered by
several limitations, including
• Lack of data connectivity and topology
• File-based storage of data
• Single-user access to data and associated information
• Crude methods for attaching attributes to features

46
Because of the GIS industry’s early focus on land analysis and polygons, the arc/node
topology model became widespread and persists to this day. The arc/node data model
is useful for polygons because of its efficient data storage and the ease of computing
polygon overlays. Also, an arc/node model enables users to determine whether an
object is inside or outside a polygon, a necessary feature for many spatial analyses.
The arc/node topology model uses a series of points and short line segments to
represent a geometric arc, whereas a CAD geometric model uses a mathematical
formula to generate true arcs. Traditional GIS was aimed at general cartography and
broad land-use analysis, not precision design for the construction and management of
real-world projects. Although the arc node model can approximate the geometry of
designed objects or “entities” in projects such as roads and communications networks,
it cannot represent them with the geometric precision that many engineers demand.
Traditional GIS companies have recognized the limitations of their technology and
have employed complex databases to model real-world objects. These databases can
create a logical model of features and networks. However, they are still built on
points, lines, and polygons and cannot store other geometric objects such as true arcs
and road spirals.
Early use of GIS for design projects was characterized by several limitations,
including
• Loss of geometric accuracy and precision of features
• Limited data editing tools
• Limited engineering drawing entry and data migration capabilities
47
3. Available IT solutions and other Integration
Initiatives
There are various other initiatives currently to integrate CAD and GIS in various
forms as needed by different user groups like engineers, designers, planners, facility
managers, etc.
Some of these integration initiatives work on integrating 2D CAD with GIS, while
some are even offering some 3D capabilities in their GIS packages (though not a true
3D CAD-GIS integration).
3.1 Open GIS Consortium:
Open GIS Consortium (OGC) is a consortium of over 257 organizations including
several universities, government organizations, and software vendors.
OGC is working towards the creation of open standards which will allow all the GIS
software to share data amongst themselves.
OGC has created The Open Group Architecture Framework (TOGAF) which defines
an architectural framework for assisting in the production of organization-specific
architectures. An architectural framework consists of a technical reference model
(TRM), a method for architecture development and a list of component standards,
specifications, products and their interrelationships which can be used to describe the
components of an information system in a consistent manner. [21]
This standard framework will be used to share data between various GIS software
across various platforms, and across various versions of the same software.
48
3.2 Open interoperability with Oracle spatial technology:
Oracle is a database application. This initiative is developed around the spatial data
storage capabilities of Oracle Spatial.
This initiative is driven by software companies Autodesk, Intergraph, Laser-Scan and
MapInfo to provide integration between different GIS software applications like
Autodesk Mapguide – a map building software, Intergraph GeoMedia, Laser-Scan
map digitizing software and MapInfo – a GIS software.
Each software vendor will release an interoperability kit that would enable certain,
mostly graphical, commands to be interpreted through a set of stored procedures in an
Oracle database. Whenever a user creates some additional data or changes the
existing data, the necessary changes are updated to the Oracle database. Also, a stored
procedure in Oracle ‘fires’ a trigger that subsequently notifies another trigger via the
interoperability kits from other vendors to write the changes to the appropriate
format, allowing all the users to view the updated data.
This integration initiative considers the integration issues between different GIS
software applications, not getting to the 2D or 3D CAD integration issues.
3.3 Bentley/ESRI AEC-GIS Interoperability:
Bentley with its solutions for Architecture/Engineering/Construction (AEC)
professionals and ESRI as a GIS provider are started work towards integrating the
AEC and GIS software in 2002. [22]
The AEC-GIS integration will occur at two levels:
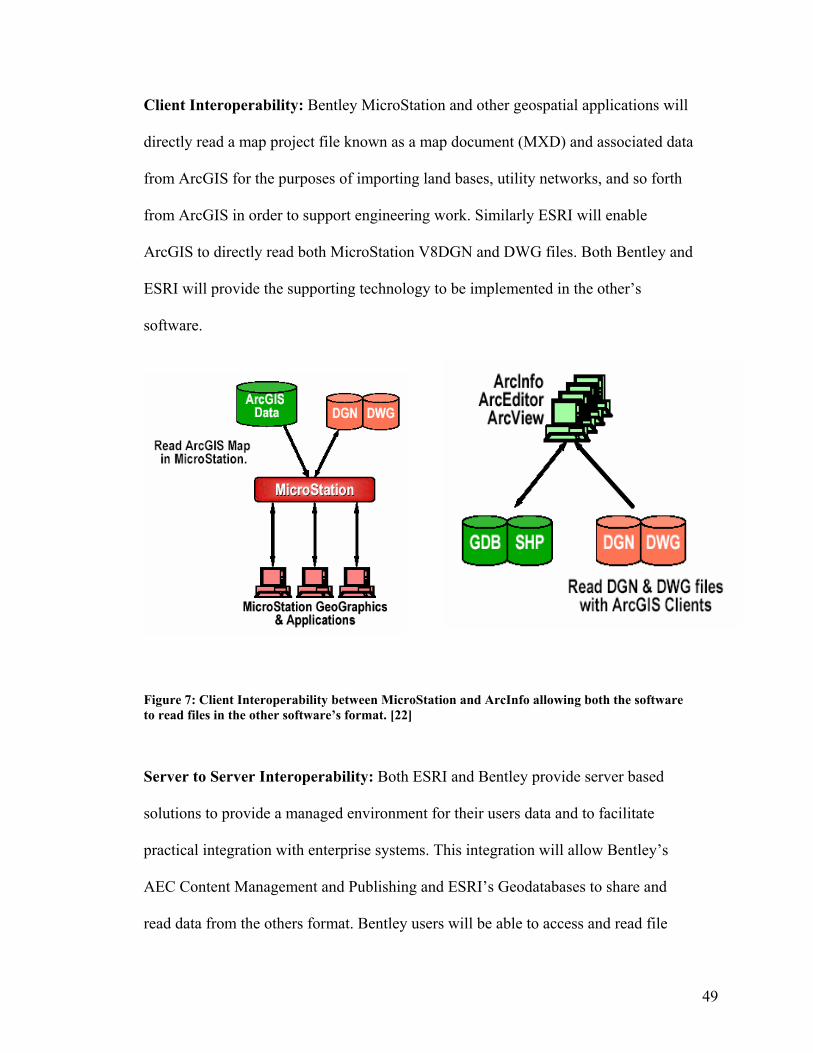
49
Client Interoperability: Bentley MicroStation and other geospatial applications will
directly read a map project file known as a map document (MXD) and associated data
from ArcGIS for the purposes of importing land bases, utility networks, and so forth
from ArcGIS in order to support engineering work. Similarly ESRI will enable
ArcGIS to directly read both MicroStation V8DGN and DWG files. Both Bentley and
ESRI will provide the supporting technology to be implemented in the other’s
software.
Figure 7: Client Interoperability between MicroStation and ArcInfo allowing both the software to read files in the other software’s format. [22]
Server to Server Interoperability: Both ESRI and Bentley provide server based
solutions to provide a managed environment for their users data and to facilitate
practical integration with enterprise systems. This integration will allow Bentley’s
AEC Content Management and Publishing and ESRI’s Geodatabases to share and
read data from the others format. Bentley users will be able to access and read file
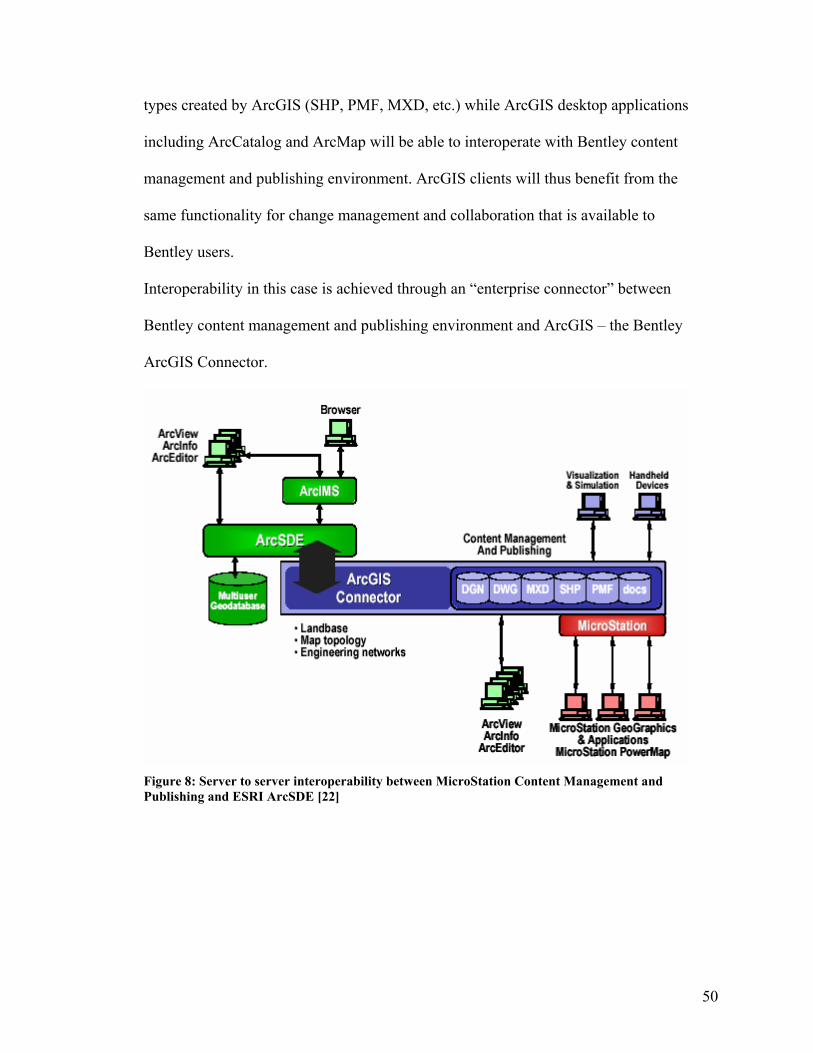
50
types created by ArcGIS (SHP, PMF, MXD, etc.) while ArcGIS desktop applications
including ArcCatalog and ArcMap will be able to interoperate with Bentley content
management and publishing environment. ArcGIS clients will thus benefit from the
same functionality for change management and collaboration that is available to
Bentley users.
Interoperability in this case is achieved through an “enterprise connector” between
Bentley content management and publishing environment and ArcGIS – the Bentley
ArcGIS Connector.
Figure 8: Server to server interoperability between MicroStation Content Management and Publishing and ESRI ArcSDE [22]

51
3.4 ODMS – Object Domain Modeling Support
The Object Domain Modeling Support (ODMS) is an initiative taken by the CADD
GIS Technology Center, to develop domain models for utilities as a vehicle to
achieve semantic interoperability within and across information communities.
The CADD GIS Technology Center is a group hosted by US Army Corps of
Engineers and includes other organizations such as US Department of Defense,
NASA, Intelligence agencies, etc. to develop standards and methods facilitating the
integration between CAD and GIS.
The CADD GIS Technology Center is collaborating with AEC/FM standard
organizations, primarily the International Alliance for Interoperability (IAI) and the
National Institute of Building Science (NIBS) to expand the IFC standard object class
library.
This initiative is to phase out the (CADD GIS data standards) Spatial data standard
for facilities, infrastructure and environment (SDSFIE) and the facilities management
standards for facilities, infrastructure and environment (FMSFIE) which were based
on a relational structure and create Object oriented standards applicable across AEC,
CADD, FM and GIS disciplines.
SDSFIE and FMSFIE provided a data content standard to create and store GIS data so
that it could be easily shared between various organizations. The SDS/FMSFIE
provide the structure of tables to be stored within a database, the attributes of the
objects to be stored within the tables and their format, the join relations between
different tables, etc. [16]
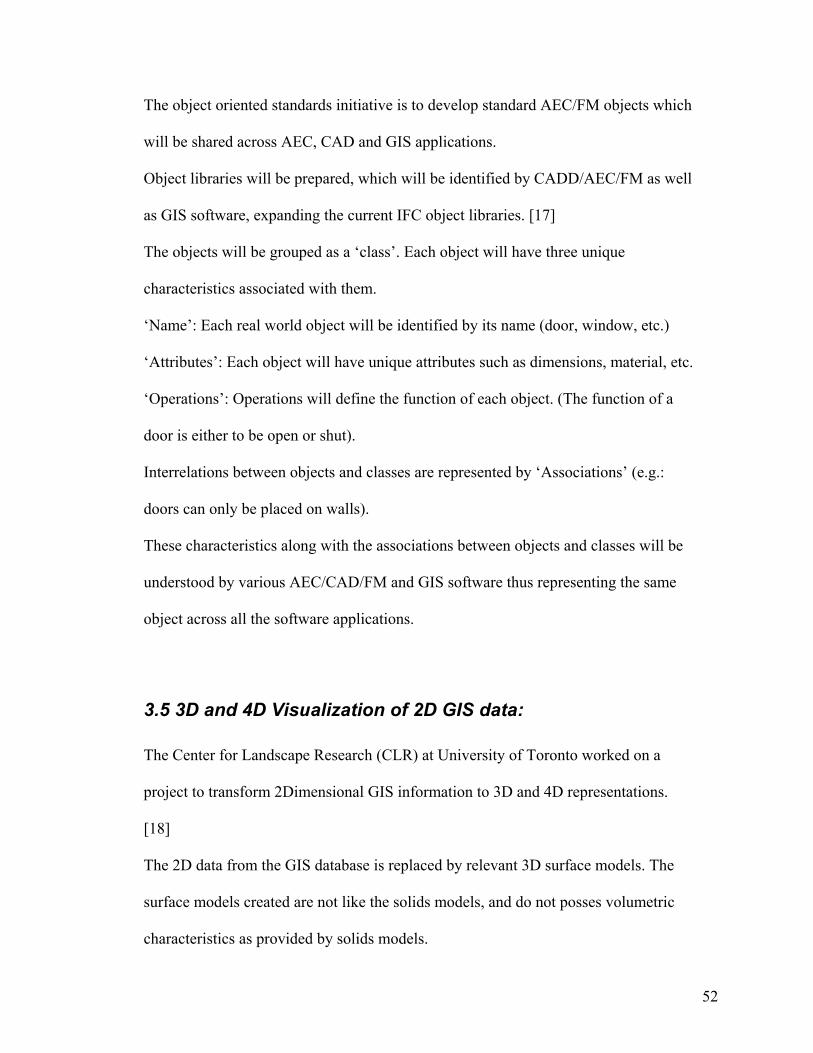
52
The object oriented standards initiative is to develop standard AEC/FM objects which
will be shared across AEC, CAD and GIS applications.
Object libraries will be prepared, which will be identified by CADD/AEC/FM as well
as GIS software, expanding the current IFC object libraries. [17]
The objects will be grouped as a ‘class’. Each object will have three unique
characteristics associated with them.
‘Name’: Each real world object will be identified by its name (door, window, etc.)
‘Attributes’: Each object will have unique attributes such as dimensions, material, etc.
‘Operations’: Operations will define the function of each object. (The function of a
door is either to be open or shut).
Interrelations between objects and classes are represented by ‘Associations’ (e.g.:
doors can only be placed on walls).
These characteristics along with the associations between objects and classes will be
understood by various AEC/CAD/FM and GIS software thus representing the same
object across all the software applications.
3.5 3D and 4D Visualization of 2D GIS data:
The Center for Landscape Research (CLR) at University of Toronto worked on a
project to transform 2Dimensional GIS information to 3D and 4D representations.
[18]
The 2D data from the GIS database is replaced by relevant 3D surface models. The
surface models created are not like the solids models, and do not posses volumetric
characteristics as provided by solids models.
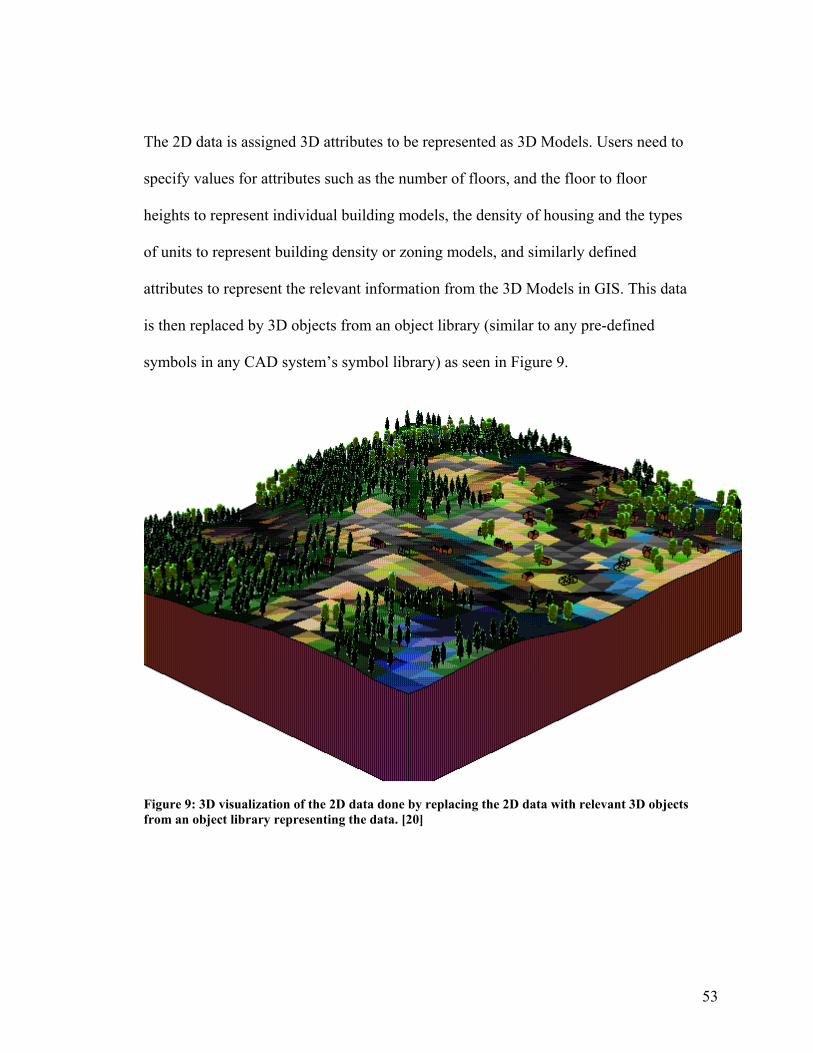
53
The 2D data is assigned 3D attributes to be represented as 3D Models. Users need to
specify values for attributes such as the number of floors, and the floor to floor
heights to represent individual building models, the density of housing and the types
of units to represent building density or zoning models, and similarly defined
attributes to represent the relevant information from the 3D Models in GIS. This data
is then replaced by 3D objects from an object library (similar to any pre-defined
symbols in any CAD system’s symbol library) as seen in Figure 9.
Figure 9: 3D visualization of the 2D data done by replacing the 2D data with relevant 3D objects from an object library representing the data. [20]
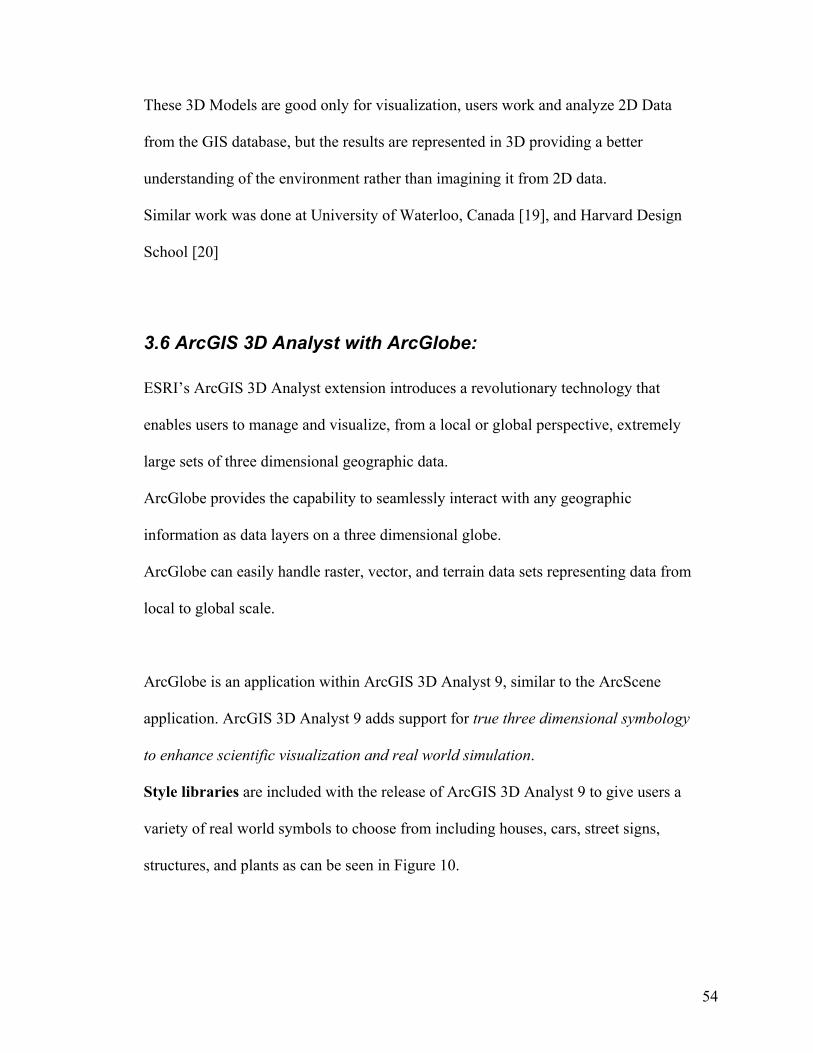
54
These 3D Models are good only for visualization, users work and analyze 2D Data
from the GIS database, but the results are represented in 3D providing a better
understanding of the environment rather than imagining it from 2D data.
Similar work was done at University of Waterloo, Canada [19], and Harvard Design
School [20]
3.6 ArcGIS 3D Analyst with ArcGlobe:
ESRI’s ArcGIS 3D Analyst extension introduces a revolutionary technology that
enables users to manage and visualize, from a local or global perspective, extremely
large sets of three dimensional geographic data.
ArcGlobe provides the capability to seamlessly interact with any geographic
information as data layers on a three dimensional globe.
ArcGlobe can easily handle raster, vector, and terrain data sets representing data from
local to global scale.
ArcGlobe is an application within ArcGIS 3D Analyst 9, similar to the ArcScene
application. ArcGIS 3D Analyst 9 adds support for true three dimensional symbology
to enhance scientific visualization and real world simulation.
Style libraries are included with the release of ArcGIS 3D Analyst 9 to give users a
variety of real world symbols to choose from including houses, cars, street signs,
structures, and plants as can be seen in Figure 10.
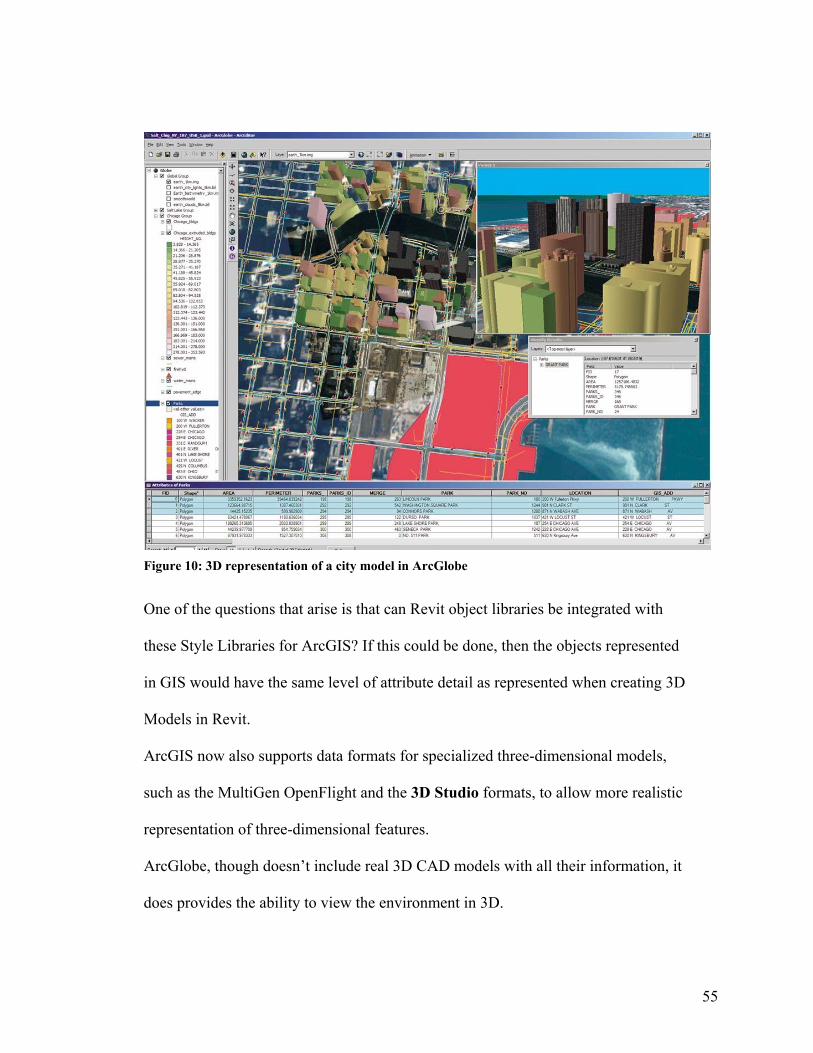
55
Figure 10: 3D representation of a city model in ArcGlobe
One of the questions that arise is that can Revit object libraries be integrated with
these Style Libraries for ArcGIS? If this could be done, then the objects represented
in GIS would have the same level of attribute detail as represented when creating 3D
Models in Revit.
ArcGIS now also supports data formats for specialized three-dimensional models,
such as the MultiGen OpenFlight and the 3D Studio formats, to allow more realistic
representation of three-dimensional features.
ArcGlobe, though doesn’t include real 3D CAD models with all their information, it
does provides the ability to view the environment in 3D.
56
The users will thus be able to view just the extruded exterior features representing the
building as 3D block in GIS losing most of the fine details of the building/facility 3D
Model instead of the building as a detailed structure with its interior features as was
created in 3D Studio.
This better visualization can help users in better understanding the environment as a
real world rather than layers of 2-dimensional informational layers. Error!
Reference source not found.
Software like Environmental Visualization System (EVS) and Modeling
Animation System (MAS) from CTECH provide true three-dimensional Analysis
and Visualization and 4-dimensional animations (time study) for Earth Sciences
(mining, geology, hydrology, etc.). [23]
They help in providing true 3D mining and geological information and analysis.
If this field can provide true 3D information and analysis power, maybe same
principles can be used for Construction and Facilities Management. Of course the
level of detail for the data required for construction and FM might be high as
compared to the detail requirements for mining.
57
4 Case Study This section describes the need for this project, the methodology followed, and the
results obtained by following the approach.
4.1 Description of the project
The aim of this project is to provide an operational environment for facility managers
by integrating the 3 dimensional parametric building models created using Autodesk
Revit with the analytical prowess of the Geographic Information Systems using
MapInfo and to explore the potential benefits and costs of following this approach.
For the scope of this project, a 3D building model was constructed for the building of
Kaven Hall (Civil and Environmental Engineering Department at Worcester
Polytechnic Institute). The 3D model was completed to include the super structure
excluding the structural members, and some furnishing and equipment as necessary
for the facilities management. The 3D model contained different objects representing
various building components with attribute information attached to each object.
Once the model was created it was integrated with MapInfo using Access as a link to
integrate the detailed building attribute data between Autodesk Revit and MapInfo
and using AutoCAD to represent the 3D model as 2D building plans which can be
recognized by MapInfo.
Integrating the 3DPBM with GIS allows the data stored within the 3D Model to be
used by the spatial analytical power of GIS. GIS is able to query the data exported
58
from the Model and help the users in finding suitable and helpful trends and patterns
in the vast data.
The integrated system will aid in facilities management activities like
1. Space management
a. Providing accurately approximate space measurements across campus
b. Space usage on campus and space reservations
c. Maintaining records for space occupancy and personnel responsible
for the space
2. Equipment and facilities maintenance across campus
a. Scheduling and planning equipment maintenance
b. Scheduling and planning building/facility maintenance activities
c. Providing accurate location maps for equipment and facility
d. Creating maintenance cost forecasts
3. Fire-safety issues
a. Planning and designing of new fire safety systems by applying a set of
pre-defined codes to a building/facility
b. Increasing safety by optimizing the code compliant designs
c. Checking the code compliance for existing fire safety systems for
buildings/facilities.
d. Providing relevant visually informative maps to fire safety personnel
in case of emergency
4. Planning

59
a. Getting code approval for building and facility designs before
construction
b. Optimizing the design while complying with the codes (Value
Engineering)
c. Planning future expansion and construction of new facilities based on
current satisfaction of needs
d. Predicting possible conflicts between the existing and proposed
facilities at the design phase
4.2 The need for integration
The 3 dimensional model created in Revit is very useful during the design and
construction phase of a construction project.
The 3D Model can be effectively used by the CM/GC to explain their understanding
of the project to a client. A visual model of a facility will be much more effective in
helping the client/user understand the project and the satisfaction of his needs by the
project.
This 3D Model is built using object-oriented technology, meaning each component
used to create the building model is identified by the software as a unique object with
a set of predefined as well as user defined attributes, and not just a set of lines and
planes which are supposed to represent a particular object.
This 3 dimensional parametric model is also dynamic in nature, meaning all the plans,
sections, schedule of quantities etc. are just templates which project only the relevant
60
information from the 3D Model. Any changes made to the model are immediately
reflected in all the relevant plans, sections, schedule of quantities, and similarly any
changes made to the plans, sections or schedule of quantities are reflected back in the
3D Model. Such a model can be very effective in maintaining and coordinating the
correct and updated information between the project participants.
This 3D Modeling software is thus very useful for preconstruction and construction
phases of a project.
The model contains detailed information about the as-built facility and the different
components and objects within the project, provided all the changes while design and
construction are regularly updated to the model. All this information will be rendered
useless if the 3D Model is left on the shelf once the building/facility is completely
constructed.
The model provides much detailed information about the project which can be
effectively used for facilities management purposes once the facility is in use.
MapInfo is a Geographic Information System software providing spatial analytical
capabilities.
Geographic Information Systems is a database management system which allows
spatially referenced data to be stored and analyzed by the user. The results of queries
and analysis are visually represented to the user on a map (or a building plan in this
case) to help in identifying patterns in the data which would be difficult to identify
and visualize from the use of numerical representations alone.
61
For facilities management purposes, the information provided by the model could be
much more useful if it could be queried and analyzed to identify different trends and
patterns within the data.
An integration of the informative 3D Model with the spatial database management
capabilities of GIS will thus aid in FM.
Also a spatial representation of the query results would help the user immensely in
identifying and understanding the location specific information such as locating
defective equipment for maintenance or replacement, identifying areas within the
facility which need to be modified, updated for providing a safe egress in case of an
emergency, etc. among others.
4.3 Methodology
The method used for integrating the 3D building model with the GIS is as follows
The data flow diagram for the whole process of integrating the 3D Parametric Model
with GIS:
This Space Left Blank Intentionally

62
Revit: Create a 3D Building Model.
Export 2D CAD drawing of the building
Export Attribute Data in MS Access
Translate the CAD file with the building plans placed on the campus map (already geo-coded) to MapInfo
Existing Campus Maps dwgs
Merge the building CAD with the Campus Map
Create the new tables for room utilization, equipment inspection, etc. in Access database.
A C
Create the relevant interrelations between the existing and the new tables in Access database.
Select only the layers required in MapInfo, and explode all the blocks in the dwg.

63
Figure 11: Flow chart describing the process of integration of the 3DPBM from AutoDesk Revit with MapInfo
Open the translated CAD file and the Access Data exported from Revit in MapInfo.
C A
Geo-code the rooms, furnishings and the equipment data from the Access database to the campus map in MapInfo using the common field Location Codes
Query and analyze the Access database from Revit, to get the desired information and solutions aiding the Facilities Management process
Make decisions based on the information and results made from the queries and data analysis in MapInfo.
Edit the relevant layers to add the field ‘Location Code’ to building objects as represented in MapInfo (e.g.: Edit the ‘Wall’ layer to add the Location Codes for the rooms, furnishings and equipment).
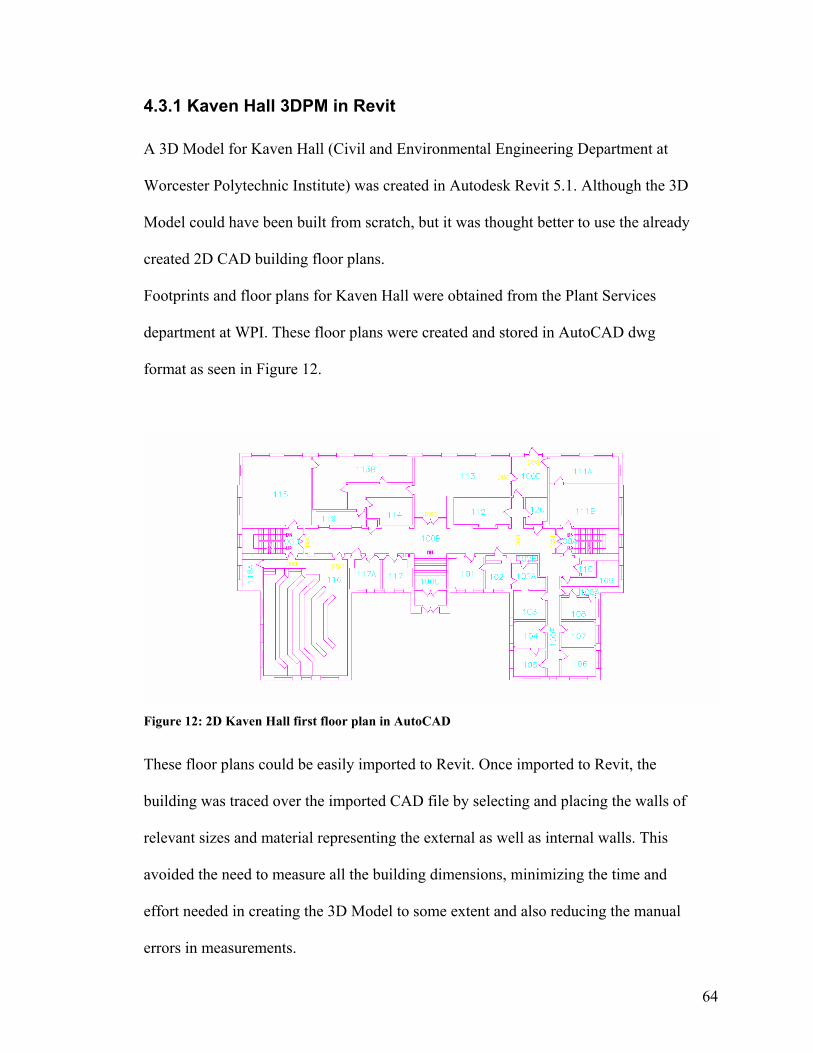
64
4.3.1 Kaven Hall 3DPM in Revit
A 3D Model for Kaven Hall (Civil and Environmental Engineering Department at
Worcester Polytechnic Institute) was created in Autodesk Revit 5.1. Although the 3D
Model could have been built from scratch, but it was thought better to use the already
created 2D CAD building floor plans.
Footprints and floor plans for Kaven Hall were obtained from the Plant Services
department at WPI. These floor plans were created and stored in AutoCAD dwg
format as seen in Figure 12.
Figure 12: 2D Kaven Hall first floor plan in AutoCAD
These floor plans could be easily imported to Revit. Once imported to Revit, the
building was traced over the imported CAD file by selecting and placing the walls of
relevant sizes and material representing the external as well as internal walls. This
avoided the need to measure all the building dimensions, minimizing the time and
effort needed in creating the 3D Model to some extent and also reducing the manual
errors in measurements.
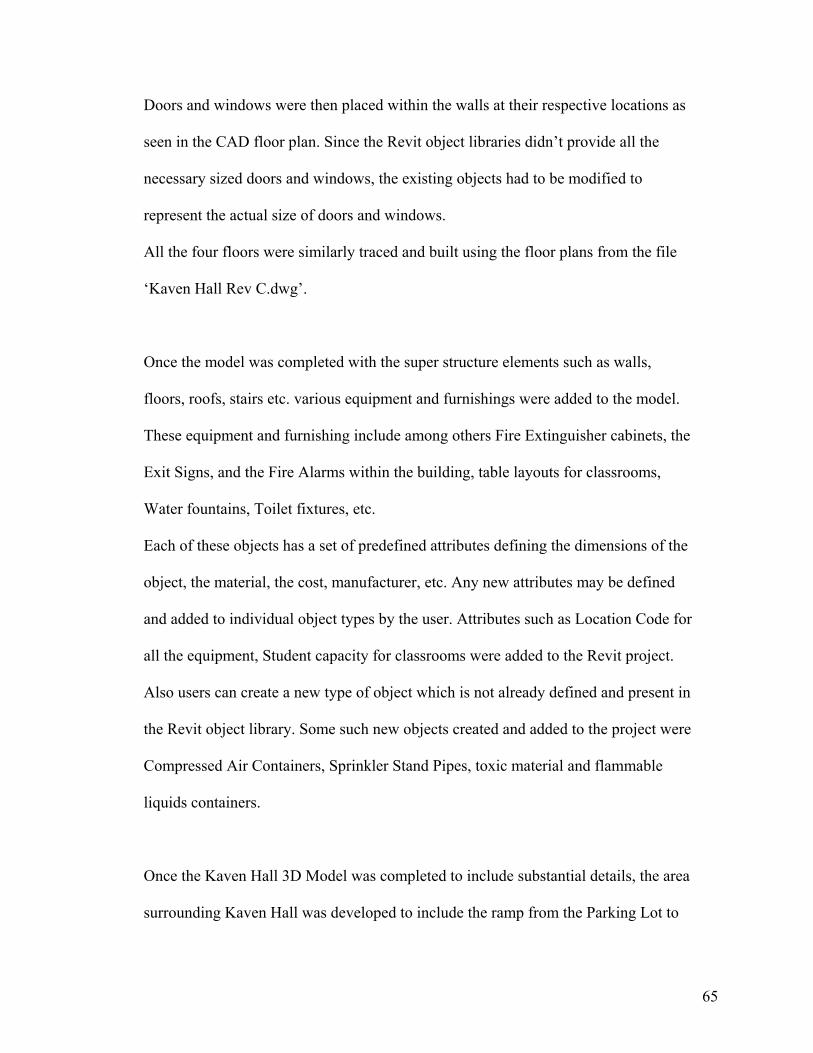
65
Doors and windows were then placed within the walls at their respective locations as
seen in the CAD floor plan. Since the Revit object libraries didn’t provide all the
necessary sized doors and windows, the existing objects had to be modified to
represent the actual size of doors and windows.
All the four floors were similarly traced and built using the floor plans from the file
‘Kaven Hall Rev C.dwg’.
Once the model was completed with the super structure elements such as walls,
floors, roofs, stairs etc. various equipment and furnishings were added to the model.
These equipment and furnishing include among others Fire Extinguisher cabinets, the
Exit Signs, and the Fire Alarms within the building, table layouts for classrooms,
Water fountains, Toilet fixtures, etc.
Each of these objects has a set of predefined attributes defining the dimensions of the
object, the material, the cost, manufacturer, etc. Any new attributes may be defined
and added to individual object types by the user. Attributes such as Location Code for
all the equipment, Student capacity for classrooms were added to the Revit project.
Also users can create a new type of object which is not already defined and present in
the Revit object library. Some such new objects created and added to the project were
Compressed Air Containers, Sprinkler Stand Pipes, toxic material and flammable
liquids containers.
Once the Kaven Hall 3D Model was completed to include substantial details, the area
surrounding Kaven Hall was developed to include the ramp from the Parking Lot to
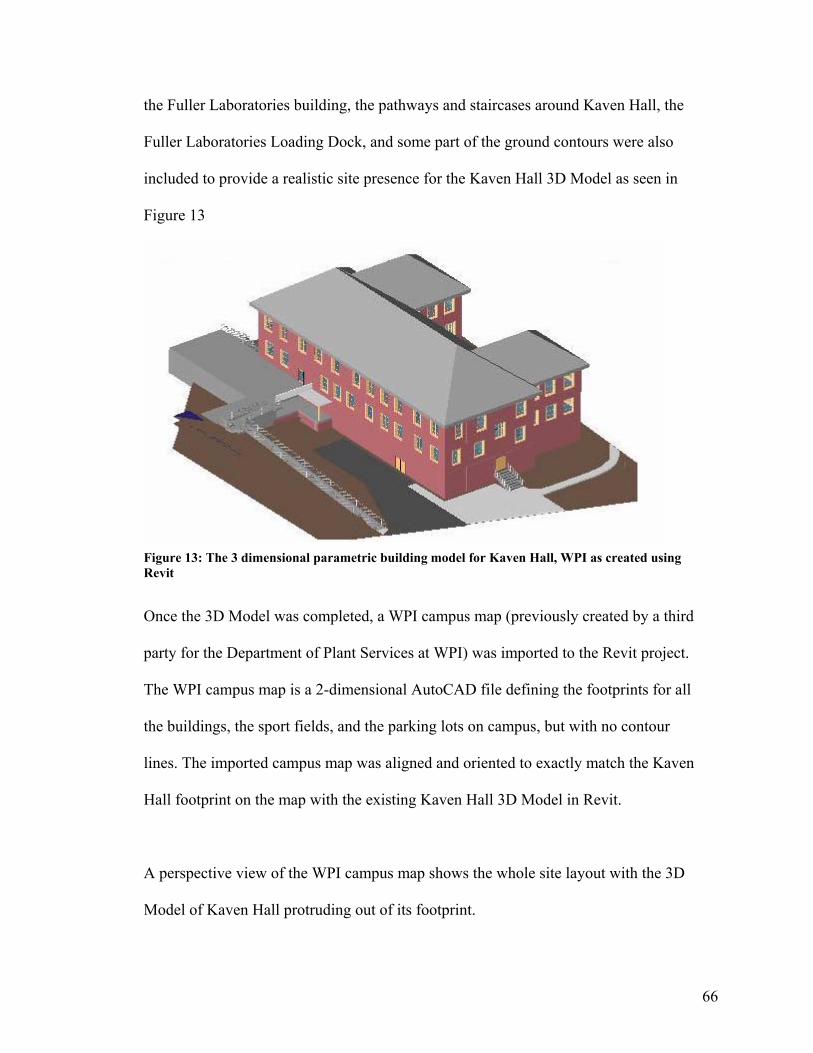
66
the Fuller Laboratories building, the pathways and staircases around Kaven Hall, the
Fuller Laboratories Loading Dock, and some part of the ground contours were also
included to provide a realistic site presence for the Kaven Hall 3D Model as seen in
Figure 13
Figure 13: The 3 dimensional parametric building model for Kaven Hall, WPI as created using Revit
Once the 3D Model was completed, a WPI campus map (previously created by a third
party for the Department of Plant Services at WPI) was imported to the Revit project.
The WPI campus map is a 2-dimensional AutoCAD file defining the footprints for all
the buildings, the sport fields, and the parking lots on campus, but with no contour
lines. The imported campus map was aligned and oriented to exactly match the Kaven
Hall footprint on the map with the existing Kaven Hall 3D Model in Revit.
A perspective view of the WPI campus map shows the whole site layout with the 3D
Model of Kaven Hall protruding out of its footprint.

67
Also an already built 3D Model for the Campus Center building at WPI (created by
Ismail Polat, a WPI student, in order to explore the capabilities of this model for 4D
studies [24]) was imported into the project and placed on its footprint on the campus
map. Since the campus center building is located at a certain elevation as compared to
Kaven Hall, it appears to be floating above its building footprint (in green) on the 2D
campus map as seen in Figure 14.
After the project was completed in Revit, all the project data (object type properties,
and individual object properties) was exported to an Access database using the ODBC
export command in Revit.
The attribute data available for all the objects from the 3D Model can only be used by
MapInfo if it can be extracted to some database making it easier for MapInfo to read
and analyze the attribute data.
The project data is exported to Access in a particular format.
All the data is stored in different tables, each table representing data about a particular
type of object (doors, windows, rooms, walls, etc.). The data common to a particular
object type is stored in unique tables, such as the ‘AssemblyCodes’ table lists the
assembly codes for all the objects used within the project, all the types of doors used
within the project are stored in the table ‘DoorTypes’, the types of walls used for the
project are stored in ‘WallTypes’, while individual door listings along with the
particular door instance attributes (specific to that particular door only) are stored in
the ‘Doors’ table, similarly tables for ‘Walls’, ‘Windows’, etc. are automatically
created by Revit as seen in Figure 15.
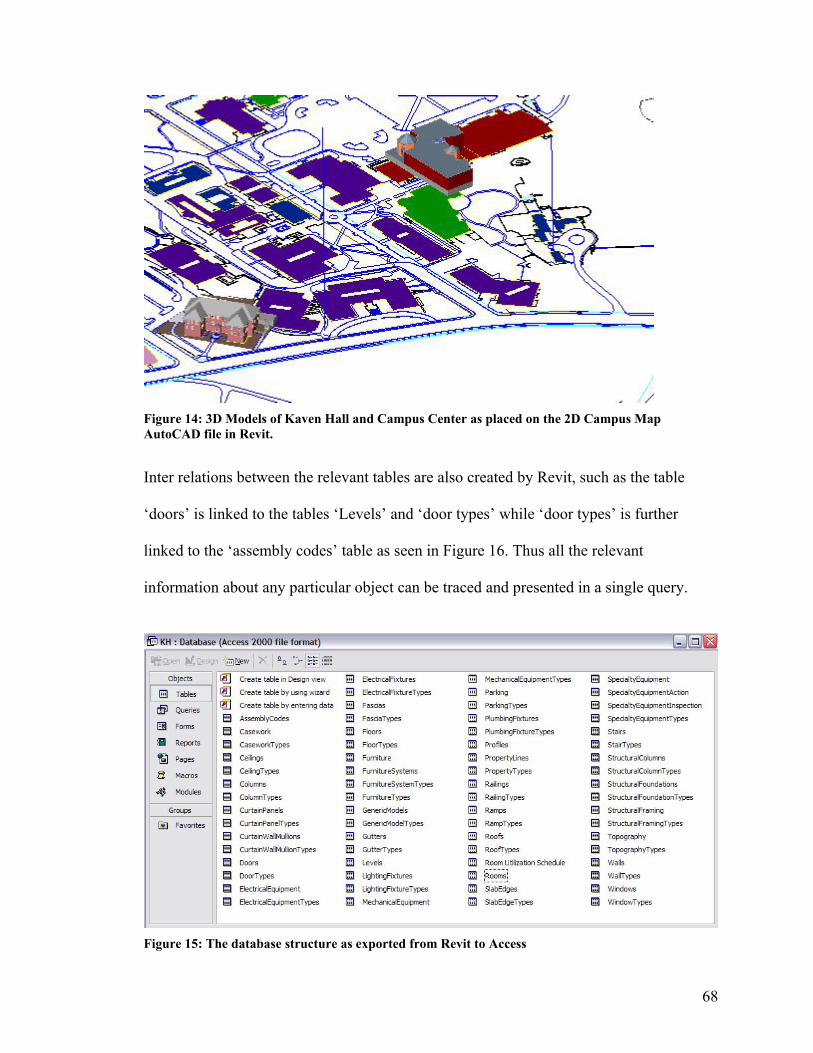
68
Figure 14: 3D Models of Kaven Hall and Campus Center as placed on the 2D Campus Map AutoCAD file in Revit.
Inter relations between the relevant tables are also created by Revit, such as the table
‘doors’ is linked to the tables ‘Levels’ and ‘door types’ while ‘door types’ is further
linked to the ‘assembly codes’ table as seen in Figure 16. Thus all the relevant
information about any particular object can be traced and presented in a single query.
Figure 15: The database structure as exported from Revit to Access
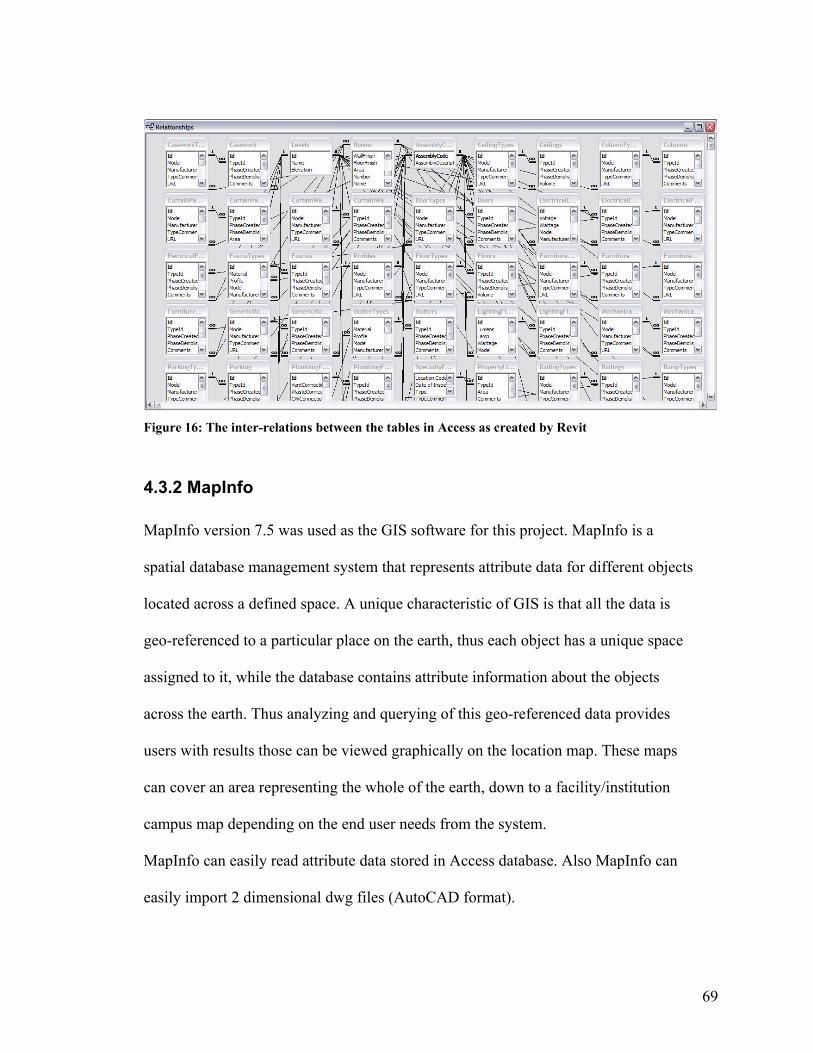
69
Figure 16: The inter-relations between the tables in Access as created by Revit
4.3.2 MapInfo
MapInfo version 7.5 was used as the GIS software for this project. MapInfo is a
spatial database management system that represents attribute data for different objects
located across a defined space. A unique characteristic of GIS is that all the data is
geo-referenced to a particular place on the earth, thus each object has a unique space
assigned to it, while the database contains attribute information about the objects
across the earth. Thus analyzing and querying of this geo-referenced data provides
users with results those can be viewed graphically on the location map. These maps
can cover an area representing the whole of the earth, down to a facility/institution
campus map depending on the end user needs from the system.
MapInfo can easily read attribute data stored in Access database. Also MapInfo can
easily import 2 dimensional dwg files (AutoCAD format).
70
Since Revit allows the 3D building model to be exported as 2 dimensional plan views
in the CAD format (dwg files), these 2D CAD files can be imported to MapInfo and
used as maps with the attribute data geo-referenced to their correct locations on the
map.
4.3.3 Integrating Revit and MapINFO
The attribute information exported from Revit to Access is easily readable by
MapInfo.
To spatially represent the attribute data from the Access database, floor plans for each
floor of Kaven Hall were exported as AutoCAD files. These exported files represent
the as-built facility showing the equipment and furnishings along with the walls,
doors and windows.
Since the project is to represent facilities across the whole of the WPI campus, the
exported floor plans for Kaven Hall must be added to the WPI campus map CAD file.
The Campus Map CAD file was already geo registered by the file’s author to
represent it in the right location on the world map. So adding the Kaven Hall floor
plan to the campus map was thought to work.
The Kaven Hall floor plan was copied and pasted to the campus map CAD file. The
Kaven Hall floor plan had to be rescaled by a factor of 1/12. This was done to correct
the difference of units in both the files and to represent the Kaven Hall floor plan in
the correct scale on the Campus Map.
71
Since objects are represented as 3 dimensional entities in Revit and not just a set of
lines meant to represent the object, the Kaven Hall floor plan exported from Revit to
AutoCAD has blocks representing the doors, equipment and furnishings, among other
objects. In order for the new CAD file containing the campus map and the Kaven Hall
floor plan to correctly translate to MapInfo, all the blocks in the Kaven Hall Floor
plan exported from the Revit project must be exploded.
The new CAD file is now translated to the MapInfo format using Universal
Translator. The CAD file is translated using the ‘Massachusetts 2001 Mainland Zone
(1983 feet)’ projection. This converted CAD file can be viewed and edited from
MapInfo. Different layers of data as represented in AutoCAD are retained in
MapInfo. Users can edit, view or freeze individual layers.
In order to geo-reference the attribute data from the Access database, there has to be a
common field between the data from Access database and the CAD files converted to
MapInfo and represented as maps, through which the Access database can be linked
to the locations on the campus map. This common field (Location Code) allows the
integration between the 3D Model in Revit and MapInfo.
To add the common field (Location Code) which is unique for each individual object
and equipment, the layer containing the object/equipment is made editable in
MapInfo. Users can then select the individual objects representing the actual objects
as represented in the Access database and add the attribute ‘Location Code’ to the
map objects.

72
Once the common field is added to the maps, the data rows from the Access database
can be geo-registered to their correct locations on the maps such as the doors
information is linked to the correct location of the door on the building floor plan.
Once all the relevant attribute data was geo-referenced onto the WPI campus map,
various queries were created to provide some expected analysis of the data for
facilities management purposes such as:
1. Knowing all the space owned by a certain department (say, space owned by
Civil and Environmental Engineering Department), and used for a specific
purpose (say Office space) on a particular floor of the Kaven Hall building.
2. Knowing all the equipment and their locations that need to be serviced,
inspected or replaced for any particular day as inferred by the last date of
inspection for the equipment.
4.3.3.1 Technical Issues
The integration of the 3D Building Model with GIS posed some of its problems and
limitations.
Some of the technical issues encountered while integrating Revit with MapInfo were
as follows:
1. When creating the 3D building model in Revit, not all the required objects
were present in the Revit object library. New objects thus had to be created to
represent the correct building components such as the correct sized doors and
73
windows, the toxic and hazardous material containers, the sprinkler shut-off
valves, the sprinkler stand pipes, etc.
2. The floor plans exported from Revit (dwg files) need to be assigned a
coordinate system. The floor plans have a ‘unitless’ coordinate system with
the origin lying at the centroid of the exported file. In order to geo-register the
floor plan in its correct location on the earth, it has to be assigned a coordinate
system and the correct coordinates. To achieve this, the building floor plans
exported from Revit were pasted onto the Campus map CAD file (already
geo-registered) to match the building footprint. This new CAD file containing
the building floor plan on the campus map was then translated to MapInfo.
3. The building floor plans exported from Revit have a different scale than the
campus map drawing. The building floor plans needed to be rescaled and
resized by a factor of 1/12 to fit the building footprints in the campus map.
4. The building floor plans exported from the Revit 3D model, after rescaling; do
not exactly fit onto the building foot prints seen in the campus map CAD file.
A possible reason for this discrepancy could be that the floor plans exported
from Revit represent the wall projections, while the foot prints seen in the
campus map file are the building roofline projections, thus justifying the
mismatch between the two.
5. It was observed that CAD files containing blocks worked unpredictably when
being translated to MapInfo. All the blocks representing various objects such
as doors and windows in the building floor plans exported from Revit were
thus exploded before being translated to MapInfo.

74
6. The new CAD file containing the campus map and the building floor plans
become skewed after being translated to MapInfo. The straight lines
representing the walls and doors as seen in the exported building floor plans
from Revit become crooked and skewed when translated to MapInfo.
7. The building attribute data exported from Revit to Access does not include all
the relevant links between the different tables containing the different objects
types. E.g.: The ‘Doors’ table is not linked to the ‘Rooms’ table thus
associating the doors with the respective rooms to which they open.
8. In order to geo-register the building attribute data (exported from Revit) onto
the campus map containing the building floor plans in GIS, there has to be a
common field (Location Code) which can be picked by the software to link
the data to its correct location. The first attempt was to add the ‘Location
Code’ to individual building objects in the exported building floor plans in
AutoCAD. Though the location code could be added as block attribute in
AutoCAD, the new file containing blocks could not always be translated to
MapInfo.
The Location Codes for different building objects were then added directly to
the respective object layers on the translated campus map file containing the
building floor plans in MapInfo, which could be easily used to link the
building attribute data (also containing the Location Codes) to their respective
locations.
75
4.4 Results and analysis of the results:
The integrated CAD-GIS system allows users to use most of/all the attribute data
stored in the 3D building model from Revit, by providing the power to query and
analyze the data using the spatial analysis power of GIS.
Some of the possible applications of this system are:
4.4.1 Applications of the system
On-campus Space Management
1. Providing fairly accurate space measurements for on-campus space utilization.
This application will help the administrators and the facilities managers to
know the division of space for different purposes such as classrooms, office
space, laboratories, library space, etc. An example for this application could
be; Educational institutions getting state funds and federal grants are paid
proportionate to the utilization of space for research activities within the
campus. Thus maintaining the space utilization plans and fairly accurate space
measurements will help these institutions immensely in avoiding repetitive
and time consuming space measurement activities for their facilities.
2. Providing space utilization plans, along with the room/furniture layouts as
seen in Figure 22 and Figure 23, linked with the building floor plans (knowing
the location of space on campus) will help the process of space utilization and
reservation tremendously. Queries regarding room utilization schedules can be
directed to the web for users to directly check the availability of space during

76
any particular period of time. Also knowing the furniture/room layout can
help users in their selection of the space.
3. Central space occupancy records and the personnel/department responsible for
the space can be useful in maintaining strict responsibility boundaries between
departments and for knowing who is responsible for what space as seen in
Figure 18, also this information could be useful for administrators and facility
managers to delegate responsibilities dealing with space.
Equipment and facilities maintenance across campus
1. On-campus equipment maintenance and inspections can be easily scheduled
using the equipment inspection history database maintained by the facilities
management and aided by the visual representation of the equipment locations
on campus as seen in Figure 24.
Similarly, maintenance and renovation activities like painting, carpeting, etc.
among others can be planned for the facilities/buildings on-campus, using the
building attributes information provided by the Revit 3D Model and creating
an inspection database in Access for buildings/facilities on campus.
2. Cost forecasting for facilities operations and maintenance can be easily done
by analyzing the inspection databases for equipment and facilities on campus
for the previous periods and predicting the possible future operations and
maintenance costs.
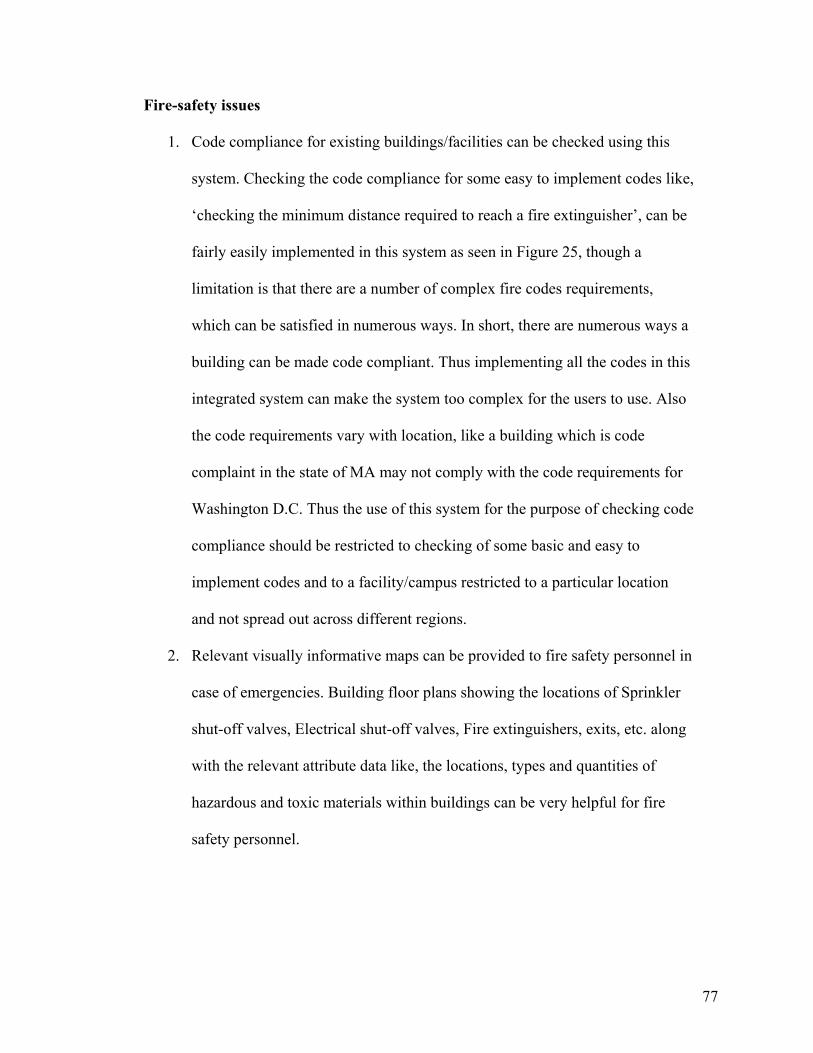
77
Fire-safety issues
1. Code compliance for existing buildings/facilities can be checked using this
system. Checking the code compliance for some easy to implement codes like,
‘checking the minimum distance required to reach a fire extinguisher’, can be
fairly easily implemented in this system as seen in Figure 25, though a
limitation is that there are a number of complex fire codes requirements,
which can be satisfied in numerous ways. In short, there are numerous ways a
building can be made code compliant. Thus implementing all the codes in this
integrated system can make the system too complex for the users to use. Also
the code requirements vary with location, like a building which is code
complaint in the state of MA may not comply with the code requirements for
Washington D.C. Thus the use of this system for the purpose of checking code
compliance should be restricted to checking of some basic and easy to
implement codes and to a facility/campus restricted to a particular location
and not spread out across different regions.
2. Relevant visually informative maps can be provided to fire safety personnel in
case of emergencies. Building floor plans showing the locations of Sprinkler
shut-off valves, Electrical shut-off valves, Fire extinguishers, exits, etc. along
with the relevant attribute data like, the locations, types and quantities of
hazardous and toxic materials within buildings can be very helpful for fire
safety personnel.

78
Planning
1. The 3D building model can be used for getting municipal approvals for the
proposed buildings/facilities from the government authorities before the
commencement of construction. The 3D Model can be used to extract
numerous plans, sections, site layouts, elevations of the building, representing
the relevant details to the authorities/users for the approvals.
2. The 3D model is very powerful in helping the users visualize the building
design and layout. The model can thus be used for value engineering and
design optimization purposes providing users with an instant understanding of
their proposed solutions.
3. Planning of future expansion projects and construction of new facilities can be
aided by the use of 3D modeling and the GIS. The need for new facilities can
be checked by knowing the current satisfaction of various requirements using
the GIS analytical capabilities.
E.g.: The need for more classroom space can be defined by checking
classroom space utilization on campus and defining the need to reschedule the
space utilization to include some more classes or the inability to reschedule
causing the need for more classroom space thus defining the need for a new
building on campus.
4. Predicting possible conflicts between the existing and the proposed facilities
during the design phase can be done using the integrated system. The 3D
visualizations and the object oriented technology of Revit (object relations
which allow users to place doors and windows only on walls) along with the
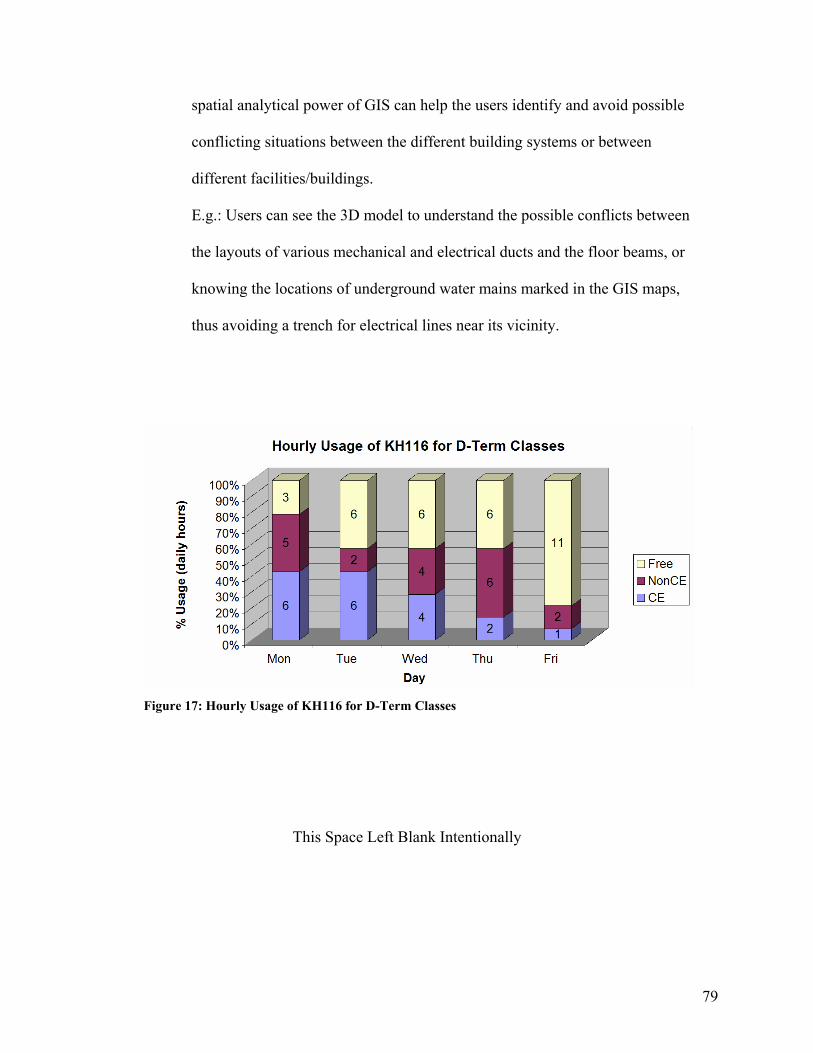
79
spatial analytical power of GIS can help the users identify and avoid possible
conflicting situations between the different building systems or between
different facilities/buildings.
E.g.: Users can see the 3D model to understand the possible conflicts between
the layouts of various mechanical and electrical ducts and the floor beams, or
knowing the locations of underground water mains marked in the GIS maps,
thus avoiding a trench for electrical lines near its vicinity.
Figure 17: Hourly Usage of KH116 for D-Term Classes
This Space Left Blank Intentionally
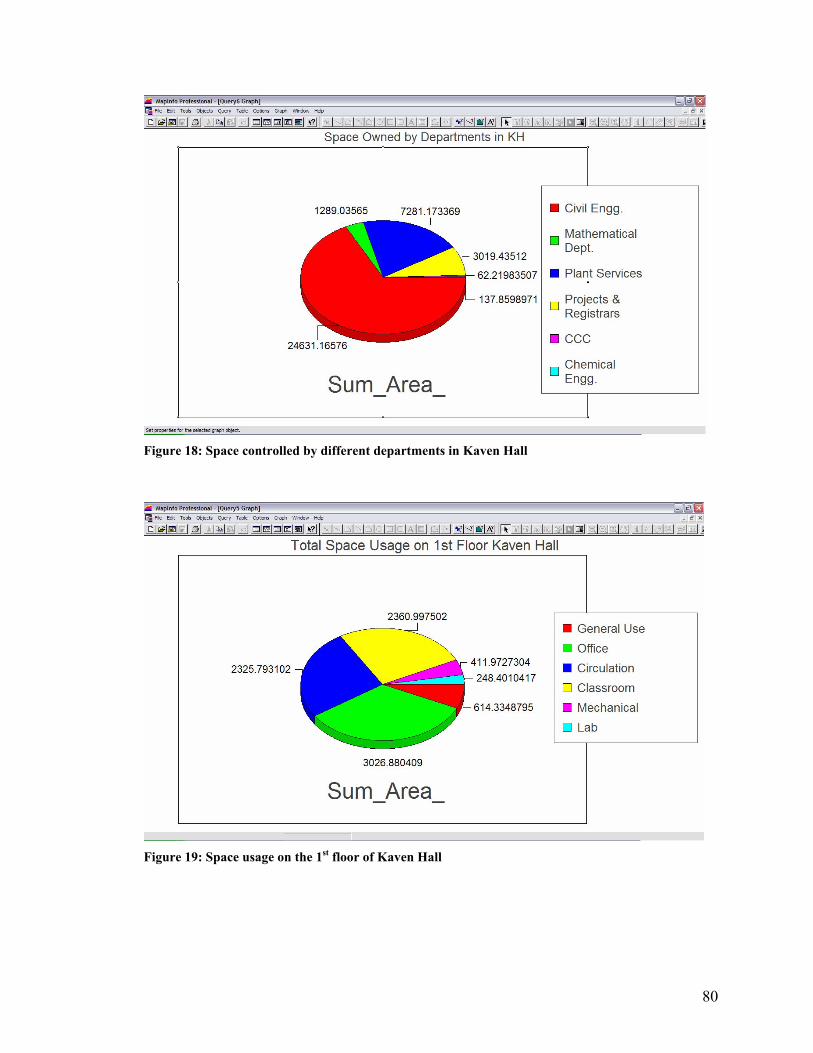
80
Figure 18: Space controlled by different departments in Kaven Hall
Figure 19: Space usage on the 1st floor of Kaven Hall
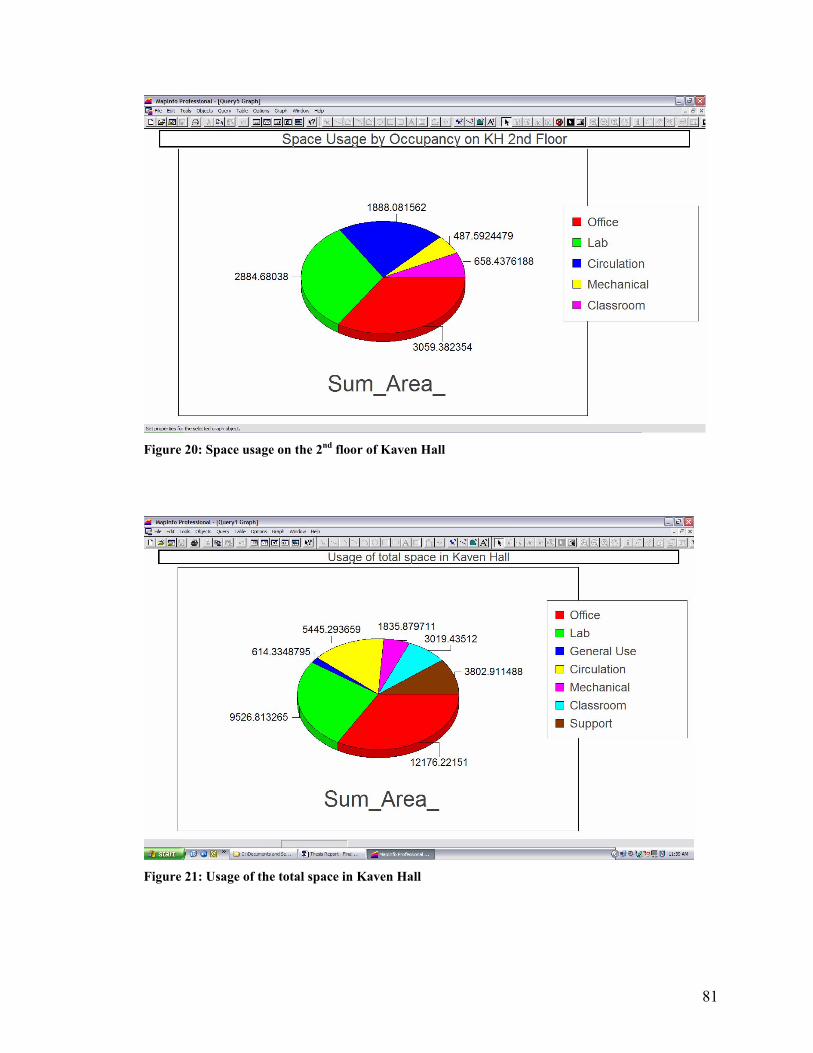
81
Figure 20: Space usage on the 2nd floor of Kaven Hall
Figure 21: Usage of the total space in Kaven Hall
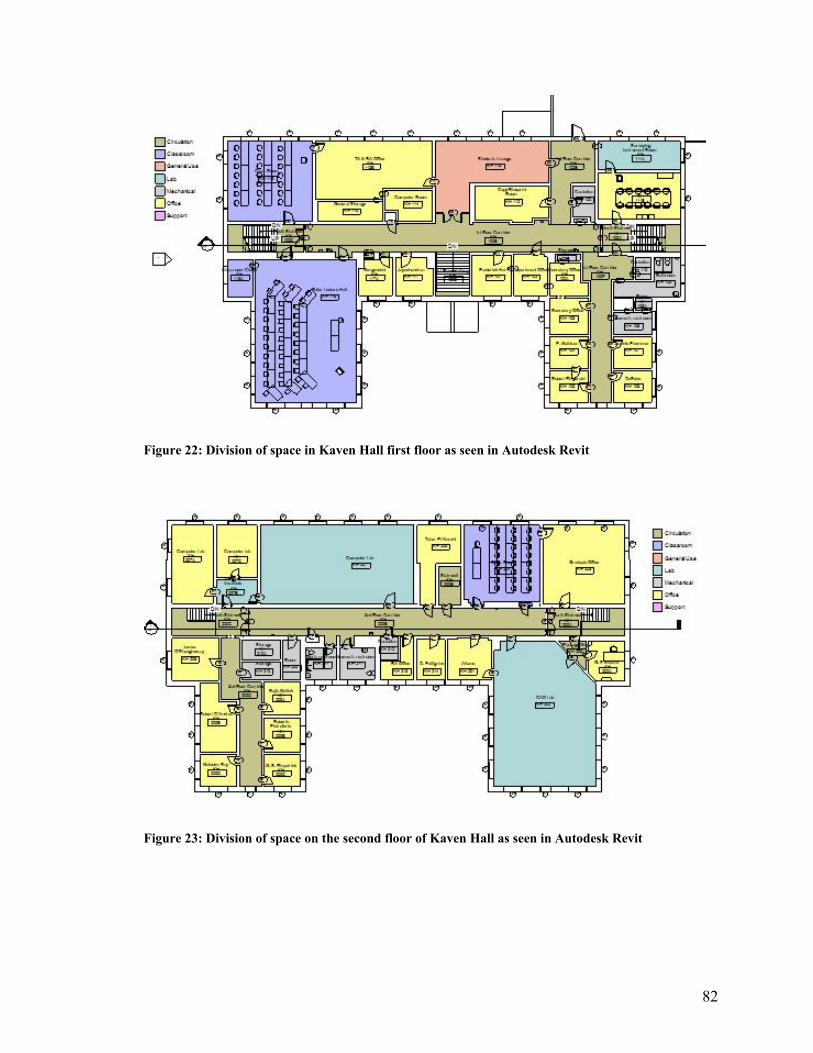
82
Figure 22: Division of space in Kaven Hall first floor as seen in Autodesk Revit
Figure 23: Division of space on the second floor of Kaven Hall as seen in Autodesk Revit
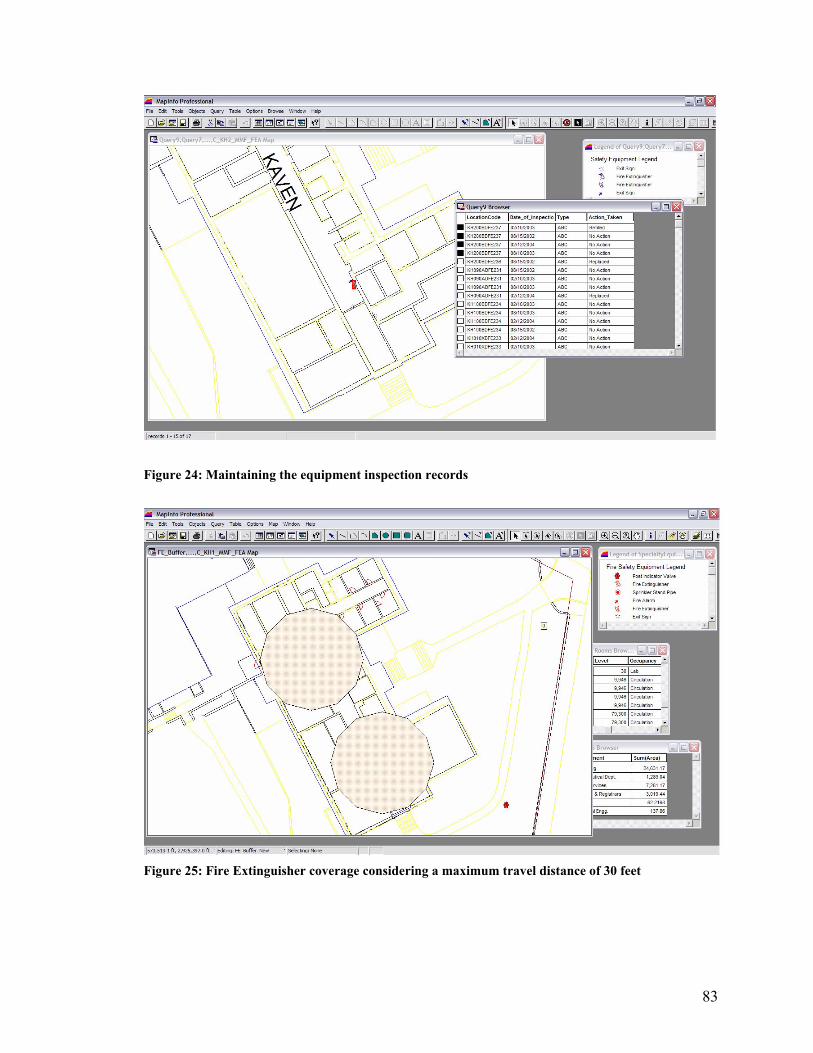
83
Figure 24: Maintaining the equipment inspection records
Figure 25: Fire Extinguisher coverage considering a maximum travel distance of 30 feet
84
4.4.2 Limitations of the integrated 3DPBM-GIS system:
1. The flow of the data is unidirectional as seen in Figure 26.
a. Data flows from Autodesk Revit to AutoCAD and MS Access, which
is later merged in MapInfo.
b. Data in the Access database can be updated from MapInfo, but any
other updates in the 3D Model representing the changes in the as-built
conditions of the facility need to be updated into the 3D Model, which
are later transmitted to AutoCAD and MS Access, and then to
MapInfo.
c. The data exported to AutoCAD contains only the graphics (vector
drawing) and not the attributes attached to each of the objects in the
3D Model in Revit. The Location Code (Object identifier code) for
each object thus needs to be added manually to the vector drawing
when imported in MapInfo.
d. Any updates made to the model need to be exported to AutoCAD and
then MapInfo, where the drawing is modified manually to include the
Location Codes. This is a tedious and erroneous process. Also
updating any small changes requires the whole drawing to be updated
(adding the Location Codes for objects in the drawing) in AutoCAD
and MapInfo. Though it is possible to update only the layers on which
the data is updated thus restricting the need to update the whole
drawing, a single layer might contain huge amounts of information and
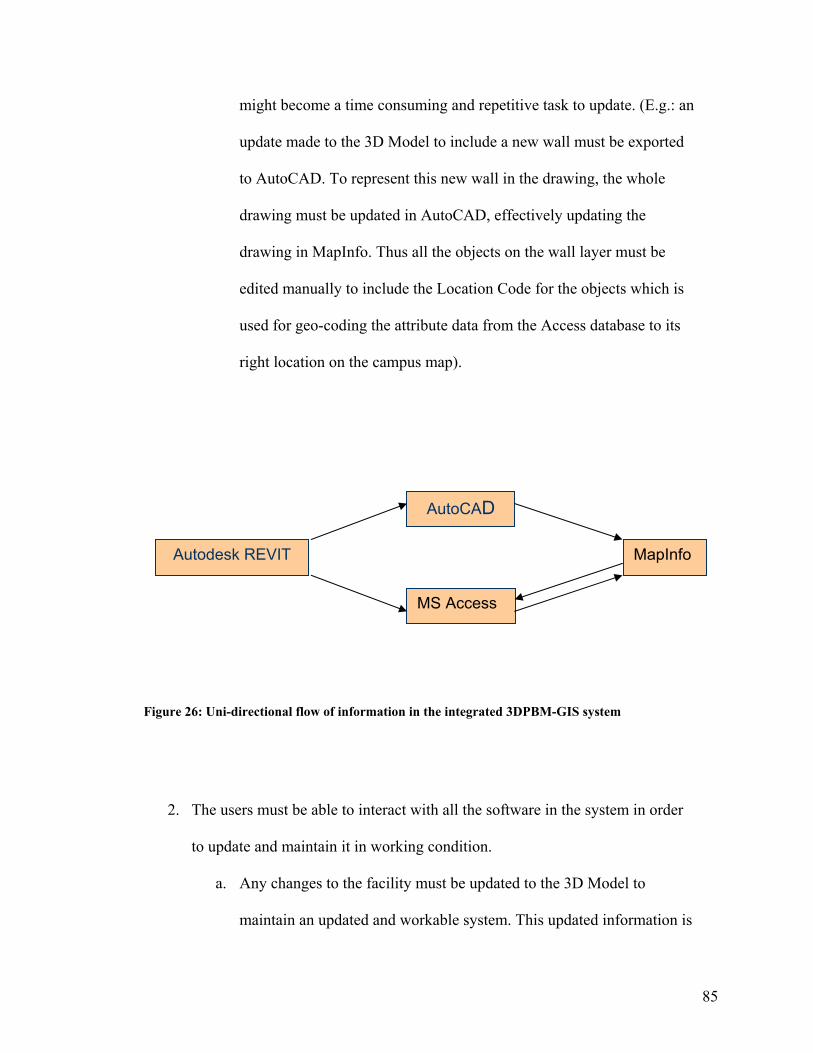
85
might become a time consuming and repetitive task to update. (E.g.: an
update made to the 3D Model to include a new wall must be exported
to AutoCAD. To represent this new wall in the drawing, the whole
drawing must be updated in AutoCAD, effectively updating the
drawing in MapInfo. Thus all the objects on the wall layer must be
edited manually to include the Location Code for the objects which is
used for geo-coding the attribute data from the Access database to its
right location on the campus map).
Figure 26: Uni-directional flow of information in the integrated 3DPBM-GIS system
2. The users must be able to interact with all the software in the system in order
to update and maintain it in working condition.
a. Any changes to the facility must be updated to the 3D Model to
maintain an updated and workable system. This updated information is
Autodesk REVIT
AutoCAD
MS Access
MapInfo

86
later exported to AutoCAD as well as the database in Access. Users
thus must be well versed in the use of Autodesk Revit and able to
create new objects and attributes (object parameters) to represent the
real world objects and the changes made to the facility.
b. Though some predefined queries can be prepared to provide some
desired results, the huge database provides the potential to create
numerous queries for various desired results. The user must thus be
able to work with and create new query structures in MapInfo.
87
5. Conclusions and Recommendations:
Revit is used by Architectural Engineering and Construction firms and functions as a
building designing and modeling software. It is used to design and model buildings as
3 dimensional entities providing true 3 dimensional visualizations to designers. It thus
deals with a lot of micro-level detail which is important for designers, within a
smaller area (area occupied by a building) as compared to the scale of data
representation in GIS.
MapInfo is a GIS software usually used to represent data on very large scales as
needed by planners, with much less micro-level detail as compared to the details
provided by CAD drawings for buildings (as provided by Revit).
Revit though it provides detailed information about the various building components,
it lacks the capabilities to analyze spatial data, while MapInfo is poor at providing
drafting tools to create detailed drawings for various elements (buildings in this case)
it can use an already created information database (as exported from Revit) and can
analyze and query it to provide trends and patterns which weren’t visible to users
earlier.
The integration of the 3D AEC model with the GIS can thus help solve many of the
issues regarding interoperability between different project participants.
An integrating effort in this direction will help both the AEC participants as well as
the GIS planners in understanding each others role, as well as work in the direction of

88
creating complementary ideas which will fit each others plans, and ultimately helping
the end-users and decision-makers who are best served by integrated information
systems.
The benefits of using a 3D model provided by Revit instead of 2D CAD drawings can
be tremendous in helping the users visualize and understand the true environment
instead of trying to imagine the possible scenario. An added benefit of using 3D
building models (Revit) instead of 2D CAD with GIS is that Revit with its object
oriented technology (objects having attributes, relations, and functions associated
with them) provides a huge information database which can be shared by GIS thus
avoiding the need to collect/create data manually.
The integrated 3DPBM-GIS system can be used for a variety of applications such as
1. Tracking and documentation of changes/renovations across campus through a
central database.
2. A systematic and well monitored system will help in tracking down the
problems within a facility, thus helping in a quick and effective solution
(temporary as well as permanent).
3. Since the facilities management will be carried out from a central database it
will be easier to relate and understand any proposed changes in the existing
facilities as they affect the surrounding facilities and environment.
4. This project will help in reducing some of the contracting costs for facilities
management by providing up-to-date information (spatial as well as attribute

89
information) from a central database, avoiding the need to maintain and
integrate different databases across campus.
5. Facilities space management applications such as knowing fairly accurate
space measurements, space usage (office, labs, classrooms, etc.), maintaining
space occupancy records and department responsible can be very useful for
facility managers.
Though some applications such as providing detailed building floor plans to fire
safety personnel or maintaining equipment maintenance and inspection schedules can
be taken care to different extents by using Revit and Access alone, most other
applications improving facilities management will require the use of spatial analysis
capabilities provided by GIS.
E.g.: Some applications such as maintaining equipment inspection schedules and
querying the data to provide current equipment maintenance schedules can be done
using only Revit and Access; the results cannot be spatially displayed on a building
floor plan/campus map providing an informative picture to users from which trends
and patterns can be seen unless a GIS is used.
Also the queried results from Access can be manually located in Revit maybe for a
building or two, but the system can become very tedious and erroneous when
analyzing data for a whole campus which includes numerous buildings and facilities.

90
Using only a 3D modeling system for the life cycle of a facility would be useful only
for the design and construction phases of the facility, while using the GIS would only
aid in the facilities management and planning process. Integrating the 3D modeling
with GIS provides a system that can be used for a facility from its design phase
through the construction phase and then for facilities management.
The continuous flow of information right from the conceptual stage of a project to the
construction and then to life cycle management till the very end of the project’s life
creates a healthy database of information which is regularly updated and maintained
and can be used for analyzing the project life cycle costs which can further be used as
a reference for future projects.
Before a complete working 3DPBM-GIS system can be prepared, some issues must
be addressed which might hamper the creation and usability of such an integrated
system.
1. Departments should be designated to create, update and maintain data for the
system. The role of each participating department should be established,
accepted and clearly documented to avoid future conflicts in data maintenance
and usability. Also it is important that responsible parties be designated to
ensure that tasks are completed and to minimize duplication of efforts.
2. Standards should be developed to maintain a consistent information pattern
which can be easily shared among users. Developing standards for data field

91
characteristics, naming conventions, standards for drawing elements,
frequency of update, and some software standards could be useful.
It is thus better to keep the two software (3DPBM and GIS) separate allowing each to
cater to their individual capabilities and functionalities, while integrating their
applications thus helping create a variety of applications helpful for facilities
management and thus avoiding the need to create a system that is capable of doing
drafting, as well as database management and spatial analysis making the system very
cumbersome, complex to use and which would require much more computing power
than any of the CAD or GIS considered individually.
92
6. Future scope of work:
The integration of 3D CAD and GIS being a newly researched field provides many
opportunities for future research.
Some recommendations for future scope of work are:
1. The possibility of developing and integrating the animation capabilities (4D
studies) of GIS with the data provided by the 3DPBM to provide time studies
for life cycle cost analysis of facilities.
2. The possibility to provide an internet based system including an interface to
view the GIS results and also the ability to manipulate or update the data
through the interface. Users being able to observe the results in a general and
broad context through the GIS web interface. When zooming in on details
they get an option to either view the facility in the GIS environment or the
AutoCAD environment. And then based on the access privileges users are
able to update the data in GIS or AutoCAD. These changes are then instantly
updated to both the systems through a seamless interface.
a. This can be possible if AutoCAD provides a web tool which allows
users to open AutoCAD files and manipulate them on the internet.
b. Also, the current system’s limitation to export only the vector data
from Autodesk Revit to AutoCAD limits the possibility of integrating
GIS with 3D Model on the fly due to the need of adding the Location
Codes to individual objects manually in MapInfo.
93
Bibliography:
[1]. http://www.geocities.com/ksyakirin/defFM.htm
[2]. Valcik Nicolas, Huesca-Dorantes Patricia, “Building a GIS Database for
Space and Facilities Management”, New Directions for Institutional
Research 2003, no. 120 (2003): 53
[3]. http://www.p2mnet.com/services_pp_two.htm
[4]. http://www.joelorr.com/id55.htm
[5]. http://www.sun.com/960710/feature3/sketchpad.html
[6]. http://www.hut.fi/~jbiskups/masters/chapter2.html
[7]. http://www.caduser.com/reviews/reviews.asp?a_id=104
[8]. Editorial – “Basics of GIS”, Journal of computing in Civil Engineering,
Jan 98
[9]. “Geography Matters” – ESRI white paper,
http://whitepapers.zdnet.co.uk/0,39025945,60008384p-39000586q,00.htm
[10]. http://www.gis.com/whatisgis/whatisgis.html
[11]. http://www.soi.city.ac.uk/~dk708/pg2_2.htm
[12]. http://geography.uoregon.edu/infographics/esriposter.html
[13]. “Bentley ESRI AEC GIS Interoperability” March 03,
http://www.esri.com/software/opengis/bentley_esri_wp.pdf
[14]. http://usa.autodesk.com/adsk/servlet/index?siteID=123112&id=35823
11
[15]. http://www.gis.com/whatisgis/index.html

94
[16]. http://tsc.wes.army.mil/products/tssds-
tsfms/tssds/slides/toolbox_220.pdf
[17]. http://tsc.wes.army.mil/Projects/01.044/COS_Strategic_Plan_030206_
final.pdf
[18]. Rodney Hoinkes and Eckart Lange “3D for Free - Toolkit Expands
Visual Dimensions in GIS”, GIS World, July 1995
[19]. Kevin Mayall and Brent Hall, "Integrate GIS and CAD to Visualize
Landscape Change", GIS World, Vol.7 No.9, Sept.1994, pp.46-49
[20]. http://www.gsd.harvard.edu/~servin/giscad/
[21]. http://www.enterprise-architecture.info/Architecture_Standards.htm
[22]. http://www.esri.com/software/opengis/bentley_esri_wp.pdf
[23]. http://www.ctech.com/
[24]. Ismail Polat, 2001, “Exploring the possibilities of the 3DPBM for
4dimensional Studies”, Interim Thesis report, Worcester Polytechnic
Institute, Department of Civil and Environmental Engineering.
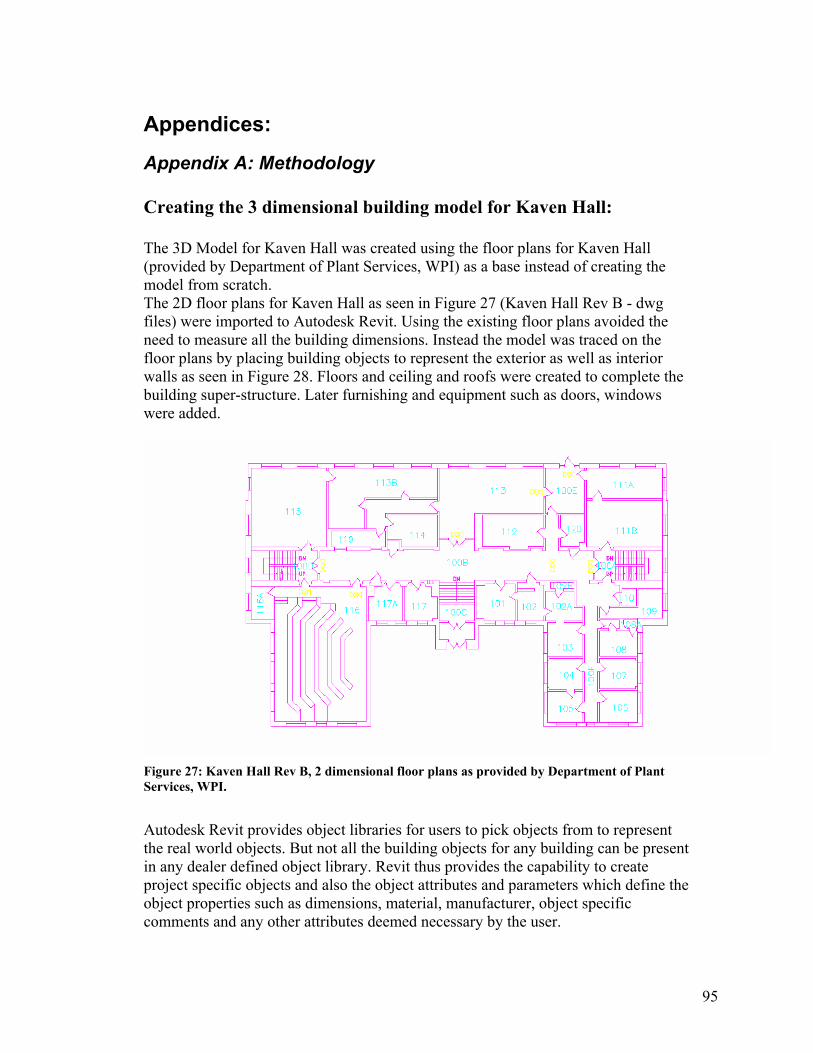
95
Appendices:
Appendix A: Methodology Creating the 3 dimensional building model for Kaven Hall: The 3D Model for Kaven Hall was created using the floor plans for Kaven Hall (provided by Department of Plant Services, WPI) as a base instead of creating the model from scratch. The 2D floor plans for Kaven Hall as seen in Figure 27 (Kaven Hall Rev B - dwg files) were imported to Autodesk Revit. Using the existing floor plans avoided the need to measure all the building dimensions. Instead the model was traced on the floor plans by placing building objects to represent the exterior as well as interior walls as seen in Figure 28. Floors and ceiling and roofs were created to complete the building super-structure. Later furnishing and equipment such as doors, windows were added.
Figure 27: Kaven Hall Rev B, 2 dimensional floor plans as provided by Department of Plant Services, WPI.
Autodesk Revit provides object libraries for users to pick objects from to represent the real world objects. But not all the building objects for any building can be present in any dealer defined object library. Revit thus provides the capability to create project specific objects and also the object attributes and parameters which define the object properties such as dimensions, material, manufacturer, object specific comments and any other attributes deemed necessary by the user.
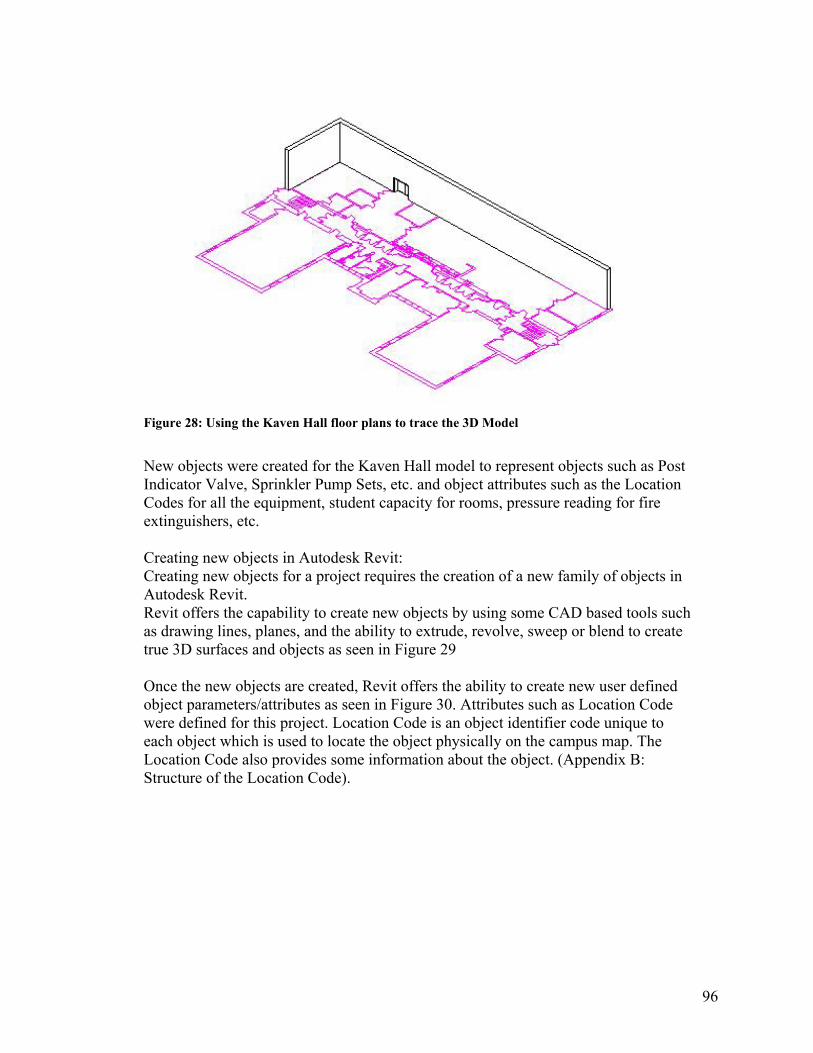
96
Figure 28: Using the Kaven Hall floor plans to trace the 3D Model
New objects were created for the Kaven Hall model to represent objects such as Post Indicator Valve, Sprinkler Pump Sets, etc. and object attributes such as the Location Codes for all the equipment, student capacity for rooms, pressure reading for fire extinguishers, etc. Creating new objects in Autodesk Revit: Creating new objects for a project requires the creation of a new family of objects in Autodesk Revit. Revit offers the capability to create new objects by using some CAD based tools such as drawing lines, planes, and the ability to extrude, revolve, sweep or blend to create true 3D surfaces and objects as seen in Figure 29 Once the new objects are created, Revit offers the ability to create new user defined object parameters/attributes as seen in Figure 30. Attributes such as Location Code were defined for this project. Location Code is an object identifier code unique to each object which is used to locate the object physically on the campus map. The Location Code also provides some information about the object. (Appendix B: Structure of the Location Code).
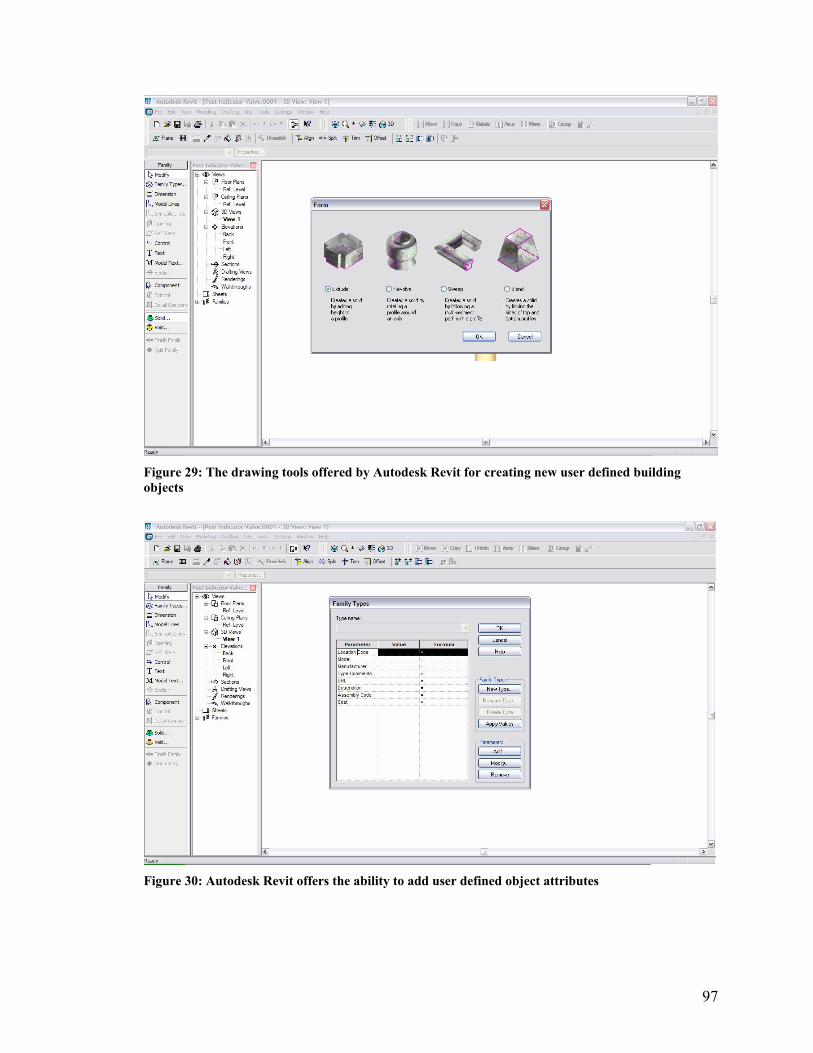
97
Figure 29: The drawing tools offered by Autodesk Revit for creating new user defined building objects
Figure 30: Autodesk Revit offers the ability to add user defined object attributes
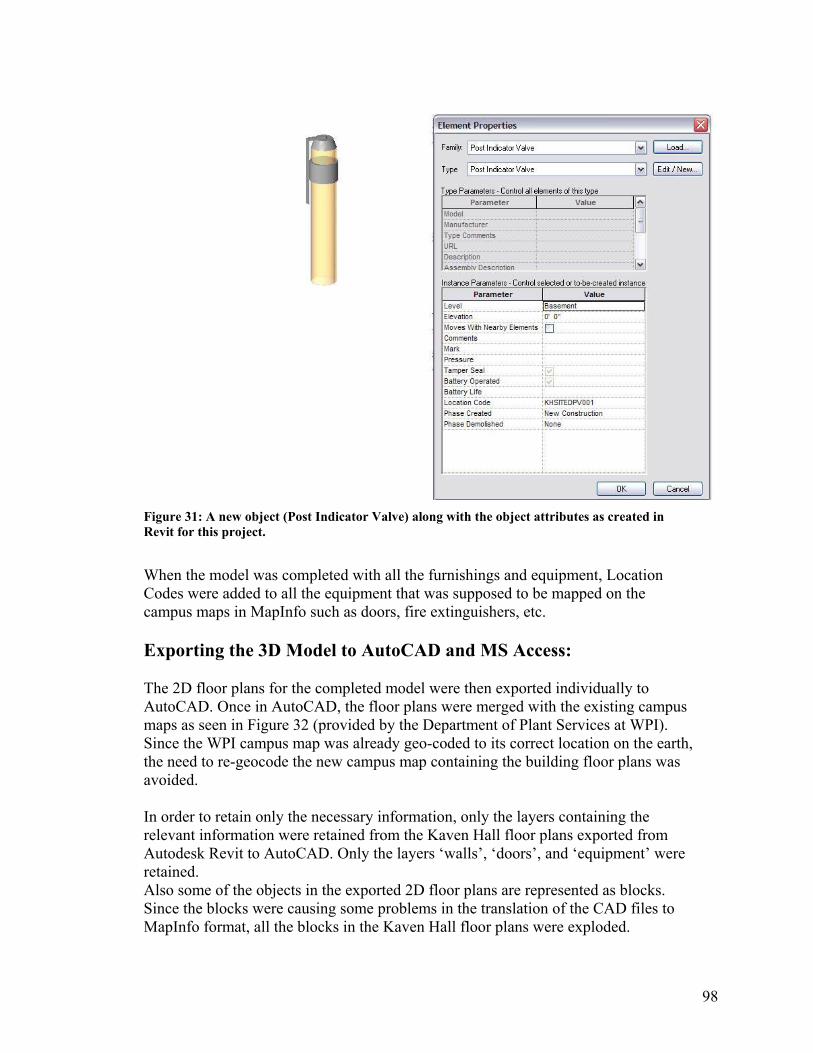
98
Figure 31: A new object (Post Indicator Valve) along with the object attributes as created in Revit for this project.
When the model was completed with all the furnishings and equipment, Location Codes were added to all the equipment that was supposed to be mapped on the campus maps in MapInfo such as doors, fire extinguishers, etc. Exporting the 3D Model to AutoCAD and MS Access: The 2D floor plans for the completed model were then exported individually to AutoCAD. Once in AutoCAD, the floor plans were merged with the existing campus maps as seen in Figure 32 (provided by the Department of Plant Services at WPI). Since the WPI campus map was already geo-coded to its correct location on the earth, the need to re-geocode the new campus map containing the building floor plans was avoided. In order to retain only the necessary information, only the layers containing the relevant information were retained from the Kaven Hall floor plans exported from Autodesk Revit to AutoCAD. Only the layers ‘walls’, ‘doors’, and ‘equipment’ were retained. Also some of the objects in the exported 2D floor plans are represented as blocks. Since the blocks were causing some problems in the translation of the CAD files to MapInfo format, all the blocks in the Kaven Hall floor plans were exploded.
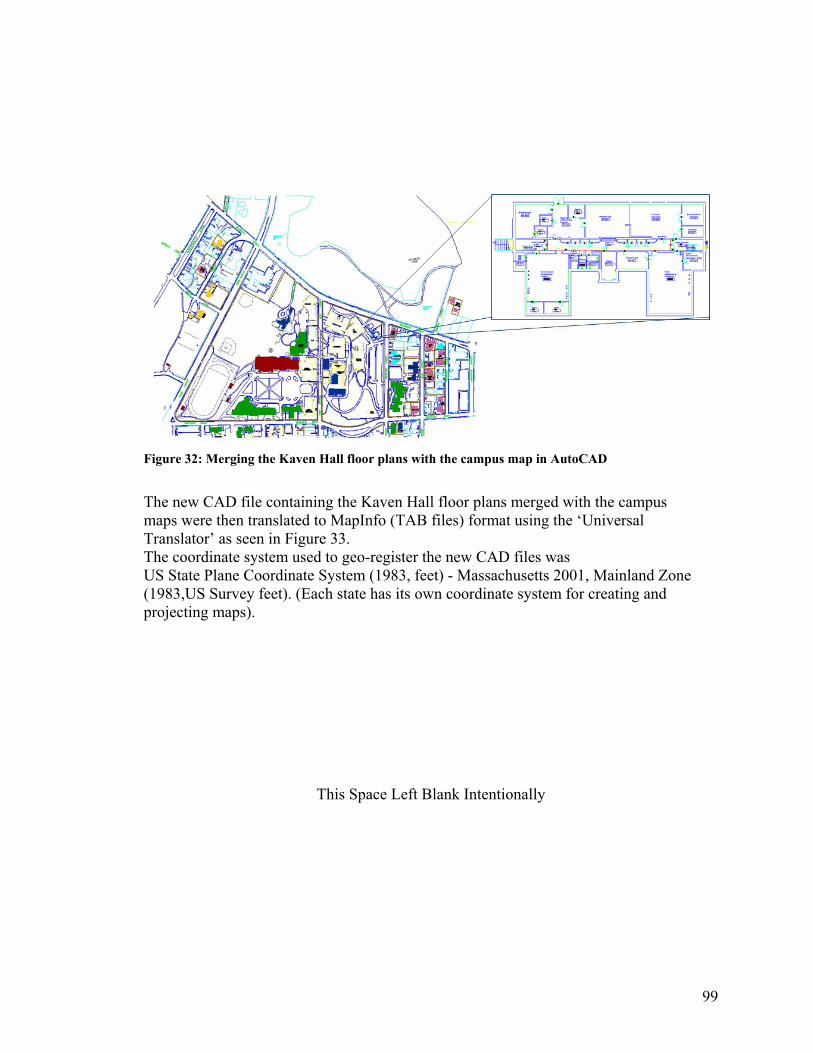
99
Figure 32: Merging the Kaven Hall floor plans with the campus map in AutoCAD
The new CAD file containing the Kaven Hall floor plans merged with the campus maps were then translated to MapInfo (TAB files) format using the ‘Universal Translator’ as seen in Figure 33. The coordinate system used to geo-register the new CAD files was US State Plane Coordinate System (1983, feet) - Massachusetts 2001, Mainland Zone (1983,US Survey feet). (Each state has its own coordinate system for creating and projecting maps).
This Space Left Blank Intentionally
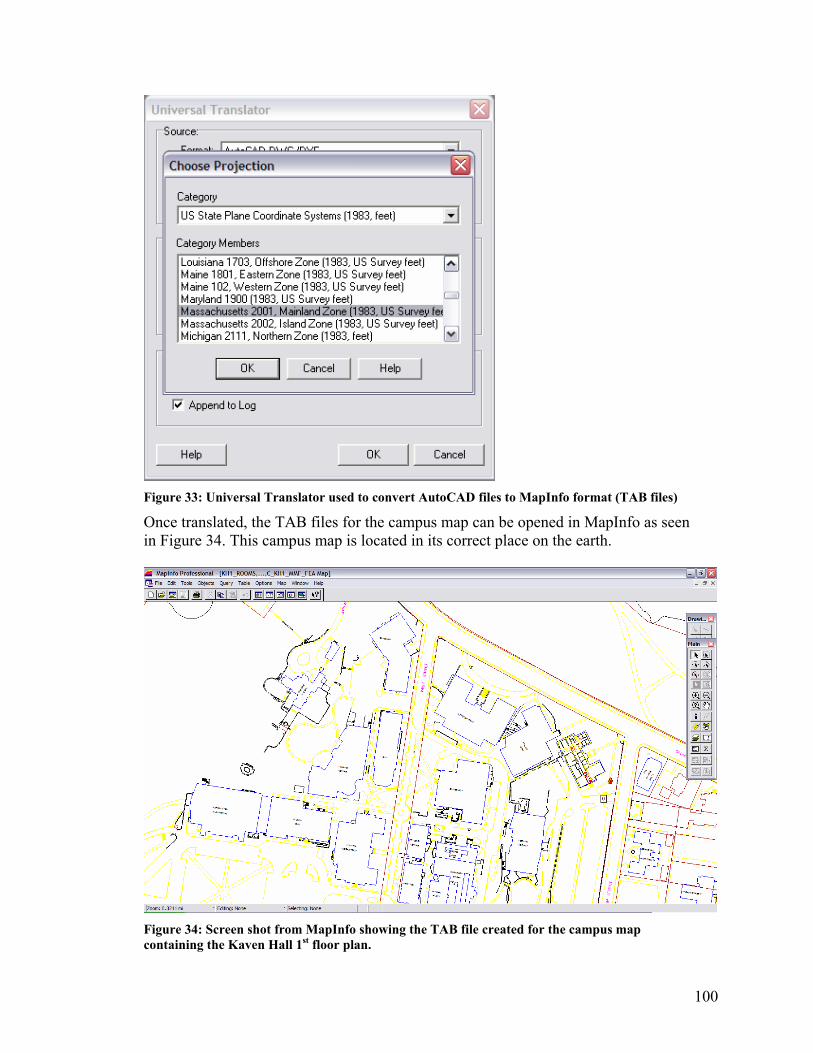
100
Figure 33: Universal Translator used to convert AutoCAD files to MapInfo format (TAB files)
Once translated, the TAB files for the campus map can be opened in MapInfo as seen in Figure 34. This campus map is located in its correct place on the earth.
Figure 34: Screen shot from MapInfo showing the TAB file created for the campus map containing the Kaven Hall 1st floor plan.

101
Figure 35: Making the ‘walls’ layer editable to add the field ‘Location Code’ to the various equipment located on the ‘walls’ layer in MapInfo.
Figure 36: Adding the Location Code to individual objects such as fire extinguishers, etc. in MapInfo

102
The next task was to add the ‘Location Code’ for all the equipment and furnishings within the Kaven Hall to provide a link between the building objects attribute information database and the location on campus map. The layers containing the objects were made editable using the ‘layer control’ function in MapInfo as seen in Figure 35 and a new field ‘Location Code’ was created for the same layer as viewed in a table form. Selecting individual objects, the ‘Location Code’ was added to each of them as seen in Figure 36. The attribute information about the building objects in the 3D Model for Kaven Hall created in Autodesk Revit was exported to a database in MS Access. All the attribute information for all the objects in the Revit project including any user defined parameters/attributes such as the ‘Location Codes’ are exported to the database. The information is stored in different tables in the datasbe, each table containing information about a particular type of object as seen in Figure 37. Also the tables are all inter-related to each other as seen in Figure 38. This creates a relational database of information about the project ready to be analyzed. Also new tables were created in the Access database to store some more information such as ‘room utilization schedules’ which stores the schedules when the room is used, for what purpose is it used, and the time slots for which it is used, or ‘equipment inspection schedules’ which maintains a record of the equipment that was inspected, the date of inspection and the result of the inspection. These tables were then interrelated to the relevant existing tables as created by Revit in the Access database such as the ‘room utilization schedules’ table was linked to the existing ‘rooms’ table and the ‘equipment inspection schedule’ table was linked to the existing ‘equipment’ table.
This Space Left Blank Intentionally

103
Figure 37: The tables created by Autodesk Revit as exported from the 3D Model to a database in MS Access.
Figure 38: The inter-relations between all the tables in the database as created by Revit
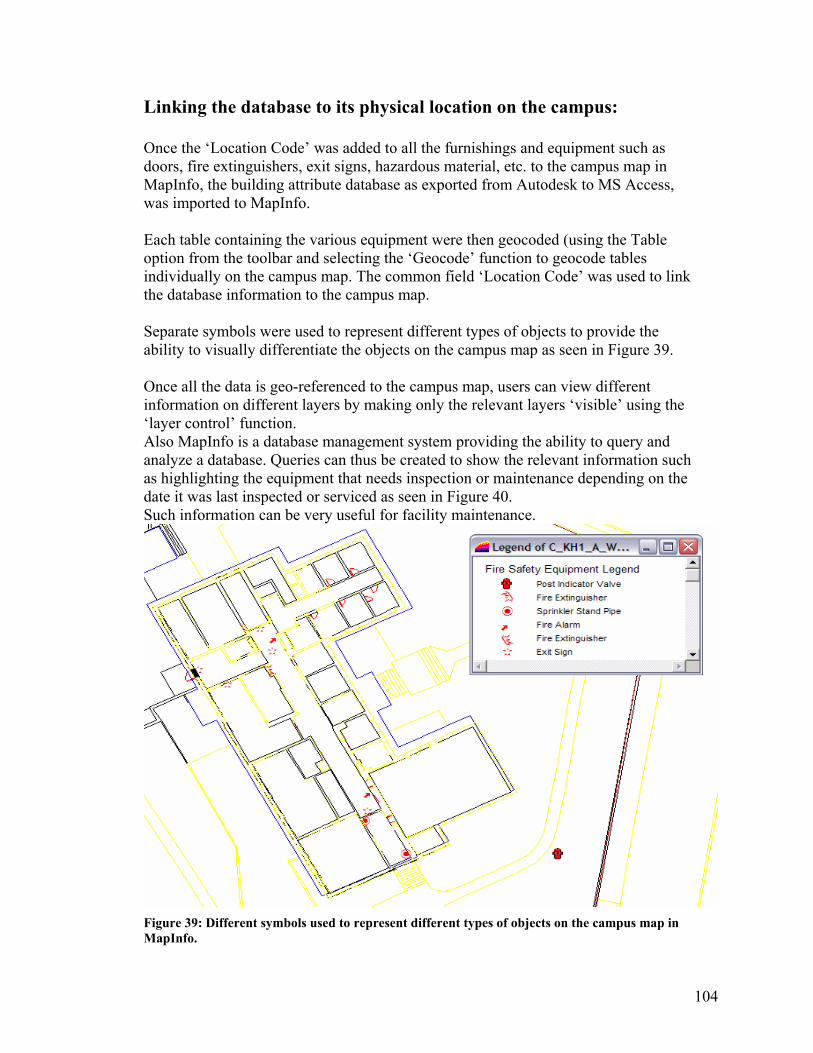
104
Linking the database to its physical location on the campus: Once the ‘Location Code’ was added to all the furnishings and equipment such as doors, fire extinguishers, exit signs, hazardous material, etc. to the campus map in MapInfo, the building attribute database as exported from Autodesk to MS Access, was imported to MapInfo. Each table containing the various equipment were then geocoded (using the Table option from the toolbar and selecting the ‘Geocode’ function to geocode tables individually on the campus map. The common field ‘Location Code’ was used to link the database information to the campus map. Separate symbols were used to represent different types of objects to provide the ability to visually differentiate the objects on the campus map as seen in Figure 39. Once all the data is geo-referenced to the campus map, users can view different information on different layers by making only the relevant layers ‘visible’ using the ‘layer control’ function. Also MapInfo is a database management system providing the ability to query and analyze a database. Queries can thus be created to show the relevant information such as highlighting the equipment that needs inspection or maintenance depending on the date it was last inspected or serviced as seen in Figure 40. Such information can be very useful for facility maintenance.
Figure 39: Different symbols used to represent different types of objects on the campus map in MapInfo.
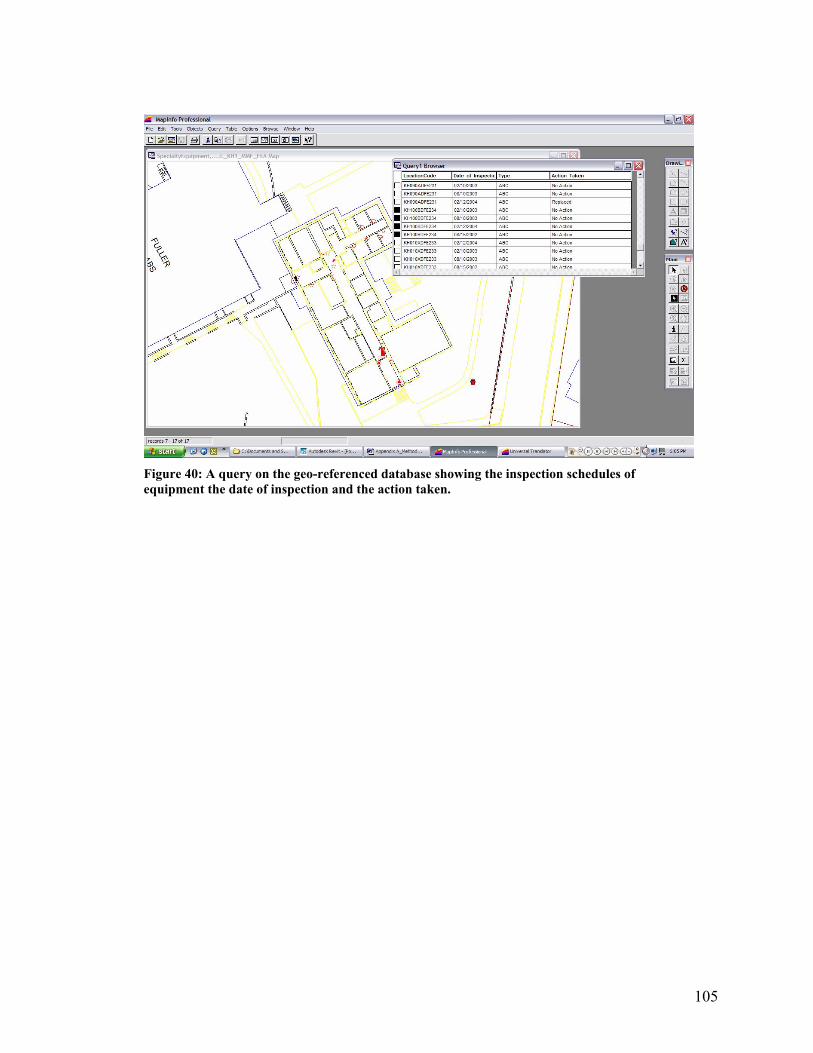
105
Figure 40: A query on the geo-referenced database showing the inspection schedules of equipment the date of inspection and the action taken.
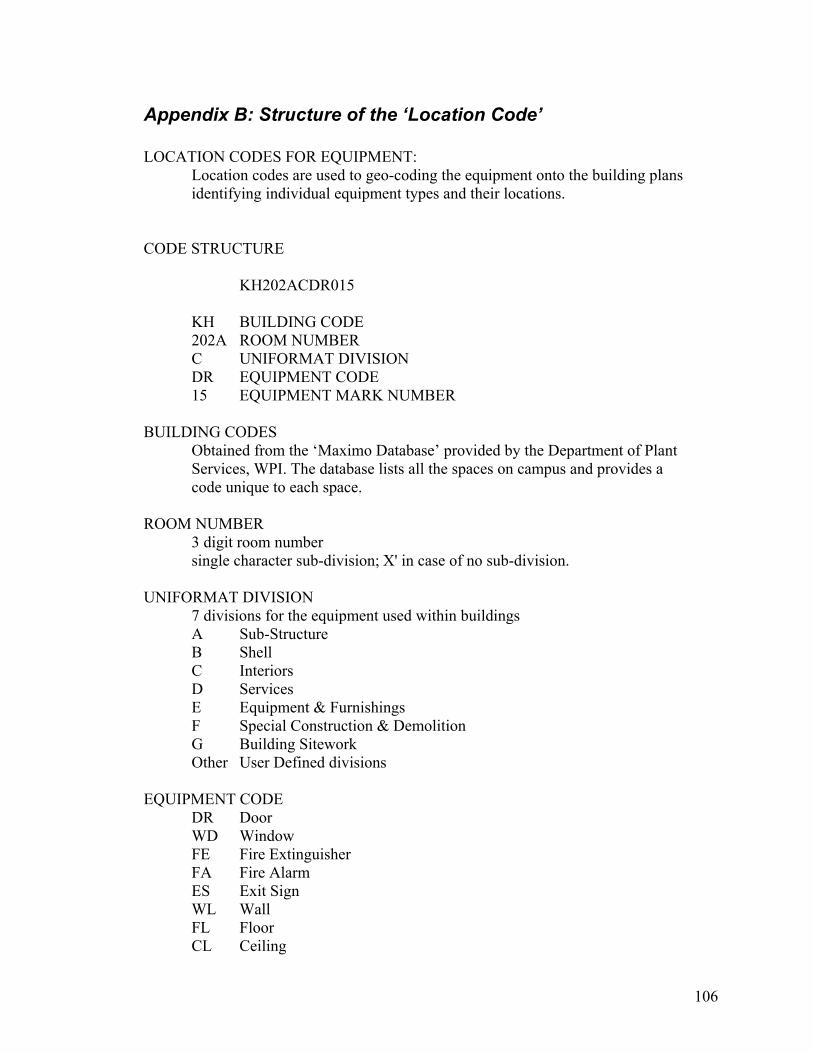
106
Appendix B: Structure of the ‘Location Code’ LOCATION CODES FOR EQUIPMENT: Location codes are used to geo-coding the equipment onto the building plans identifying individual equipment types and their locations. CODE STRUCTURE KH202ACDR015 KH BUILDING CODE 202A ROOM NUMBER C UNIFORMAT DIVISION DR EQUIPMENT CODE 15 EQUIPMENT MARK NUMBER BUILDING CODES
Obtained from the ‘Maximo Database’ provided by the Department of Plant Services, WPI. The database lists all the spaces on campus and provides a code unique to each space.
ROOM NUMBER 3 digit room number single character sub-division; X' in case of no sub-division. UNIFORMAT DIVISION 7 divisions for the equipment used within buildings A Sub-Structure B Shell C Interiors D Services E Equipment & Furnishings F Special Construction & Demolition G Building Sitework Other User Defined divisions EQUIPMENT CODE DR Door WD Window FE Fire Extinguisher FA Fire Alarm ES Exit Sign WL Wall FL Floor CL Ceiling
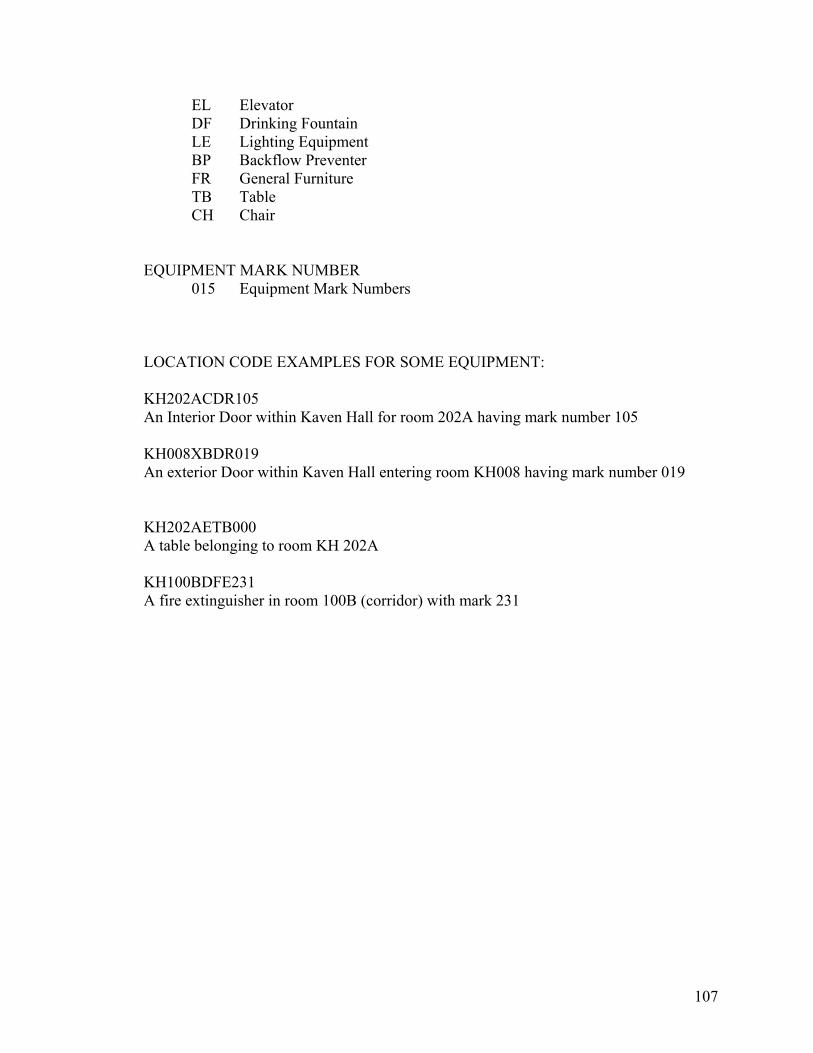
107
EL Elevator DF Drinking Fountain LE Lighting Equipment BP Backflow Preventer FR General Furniture TB Table CH Chair EQUIPMENT MARK NUMBER 015 Equipment Mark Numbers LOCATION CODE EXAMPLES FOR SOME EQUIPMENT: KH202ACDR105 An Interior Door within Kaven Hall for room 202A having mark number 105 KH008XBDR019 An exterior Door within Kaven Hall entering room KH008 having mark number 019 KH202AETB000 A table belonging to room KH 202A KH100BDFE231 A fire extinguisher in room 100B (corridor) with mark 231

108
Appendix C: Thesis presentation
Integration of 3D Parametric Building Model (3DPBM) and Geographic
Information Systems (GIS) in Educational Facilities Planning and
Management
Viren Samdadia
Acknowledgements
Advisor: Prof. G. F. Salazar
Co-advisor: Prof. F. Carrera
Thesis Committee members– Mr. John Miller– Prof. R. Fitzgerald
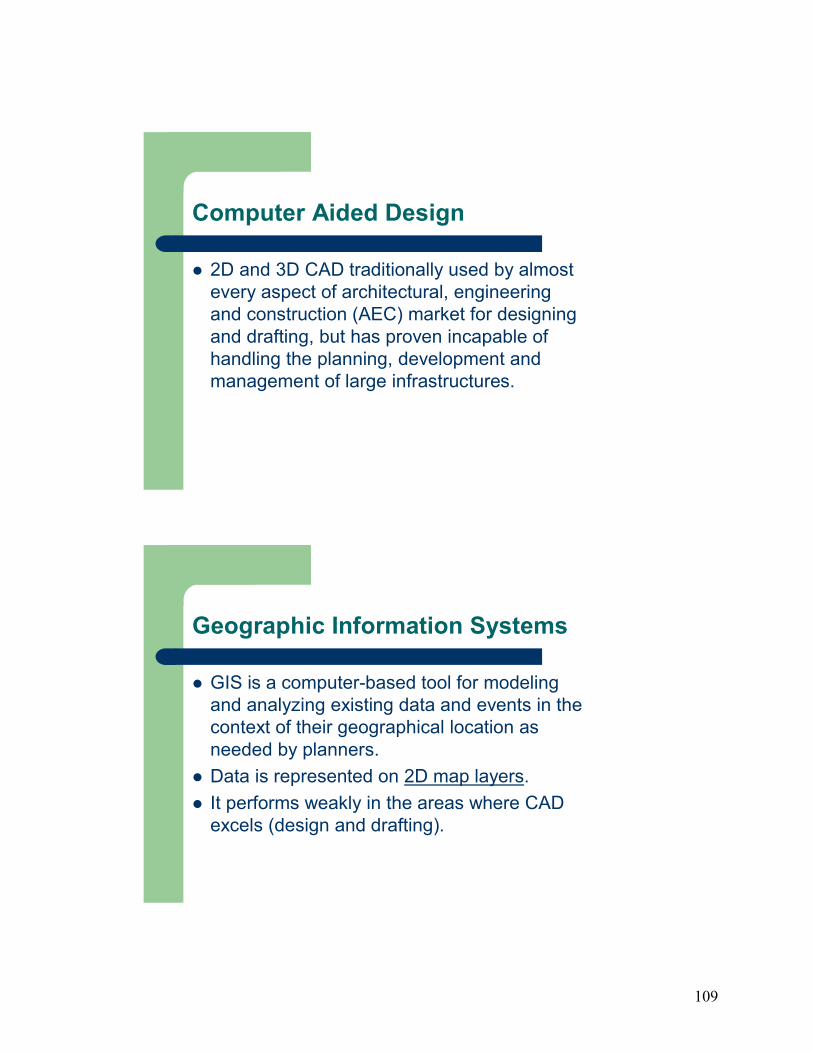
109
Computer Aided Design
2D and 3D CAD traditionally used by almost every aspect of architectural, engineering and construction (AEC) market for designing and drafting, but has proven incapable of handling the planning, development and management of large infrastructures.
Geographic Information Systems
GIS is a computer-based tool for modeling and analyzing existing data and events in the context of their geographical location as needed by planners. Data is represented on 2D map layers.It performs weakly in the areas where CAD excels (design and drafting).
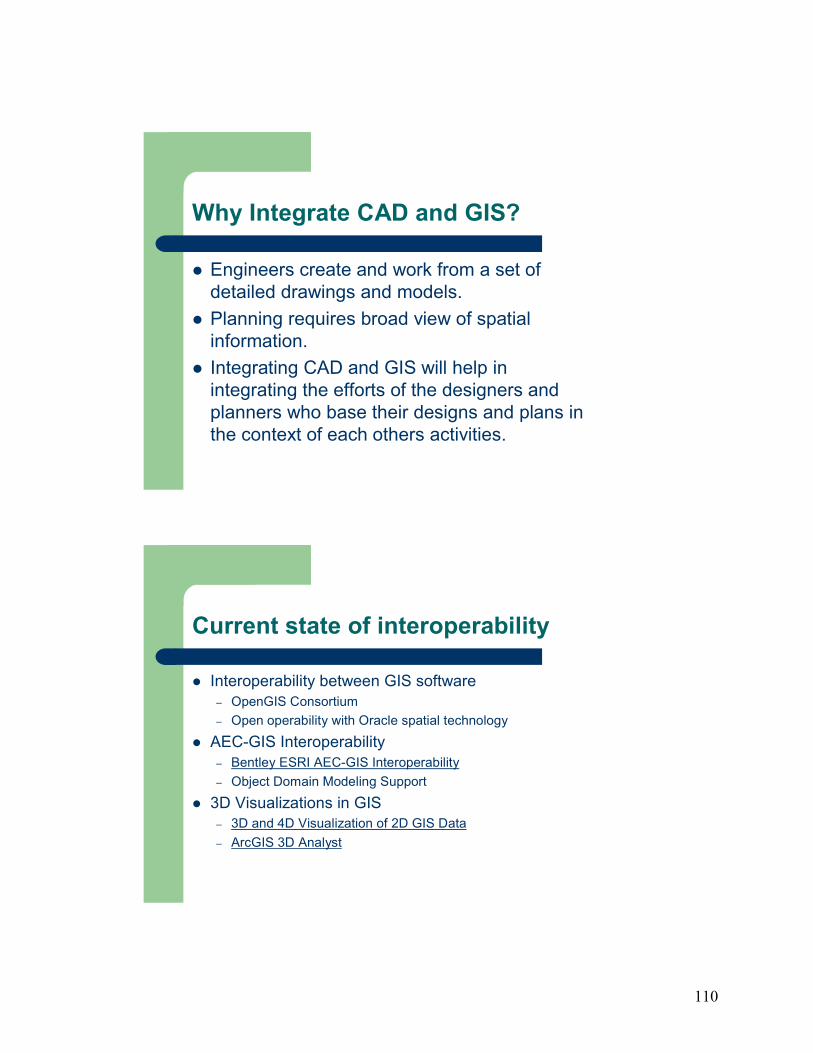
110
Why Integrate CAD and GIS?
Engineers create and work from a set of detailed drawings and models.Planning requires broad view of spatial information.Integrating CAD and GIS will help in integrating the efforts of the designers and planners who base their designs and plans in the context of each others activities.
Current state of interoperability
Interoperability between GIS software– OpenGIS Consortium– Open operability with Oracle spatial technology
AEC-GIS Interoperability– Bentley ESRI AEC-GIS Interoperability– Object Domain Modeling Support
3D Visualizations in GIS– 3D and 4D Visualization of 2D GIS Data– ArcGIS 3D Analyst
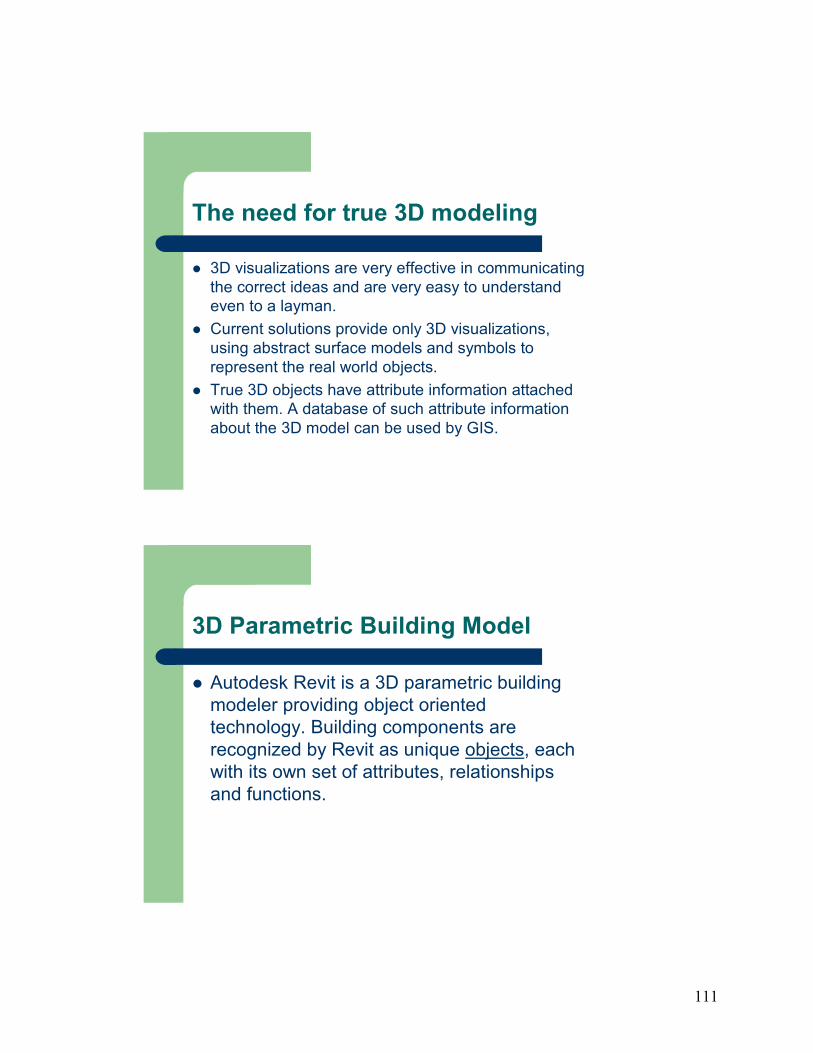
111
The need for true 3D modeling
3D visualizations are very effective in communicating the correct ideas and are very easy to understand even to a layman.Current solutions provide only 3D visualizations, using abstract surface models and symbols to represent the real world objects.True 3D objects have attribute information attached with them. A database of such attribute information about the 3D model can be used by GIS.
3D Parametric Building Model
Autodesk Revit is a 3D parametric building modeler providing object oriented technology. Building components are recognized by Revit as unique objects, each with its own set of attributes, relationships and functions.
112
Advantages of using the 3DPBM
The building model created in Autodesk Revit provides a true 3D picture to users.The 3D Model is a detailed database containing the graphic representation as well as attribute data for all the building components.The attribute data and the graphic view are just templates representing the properties of the same object. Any updates made to the object in any view or to the attribute data are thus reflected immediately in all the views as well as the attribute data.
Integration of 3DPBM and GIS
Object of this project is to integrate the 3DPBM with GIS allowing the use of the building objects database provided by the 3DPBM for spatial analysis purposes by GIS, and to explore the potential benefits and costs of following this approach.
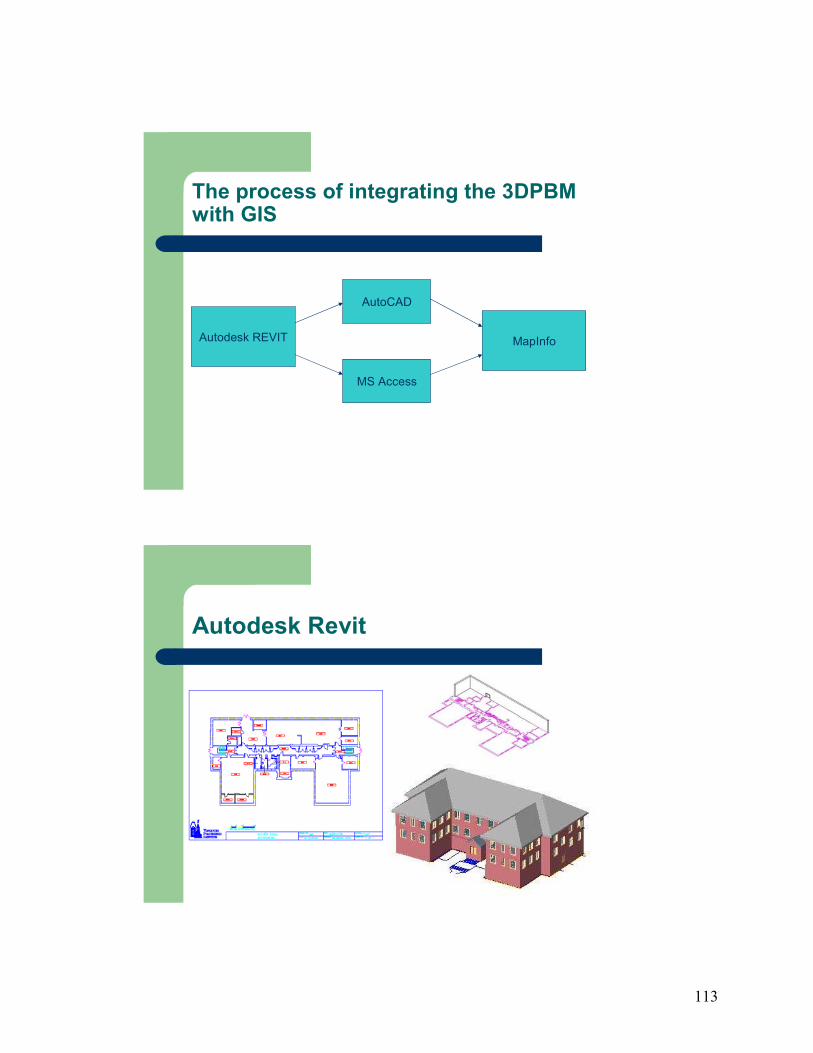
113
The process of integrating the 3DPBM with GIS
Autodesk REVIT
AutoCAD
MS Access
MapInfo
Autodesk Revit
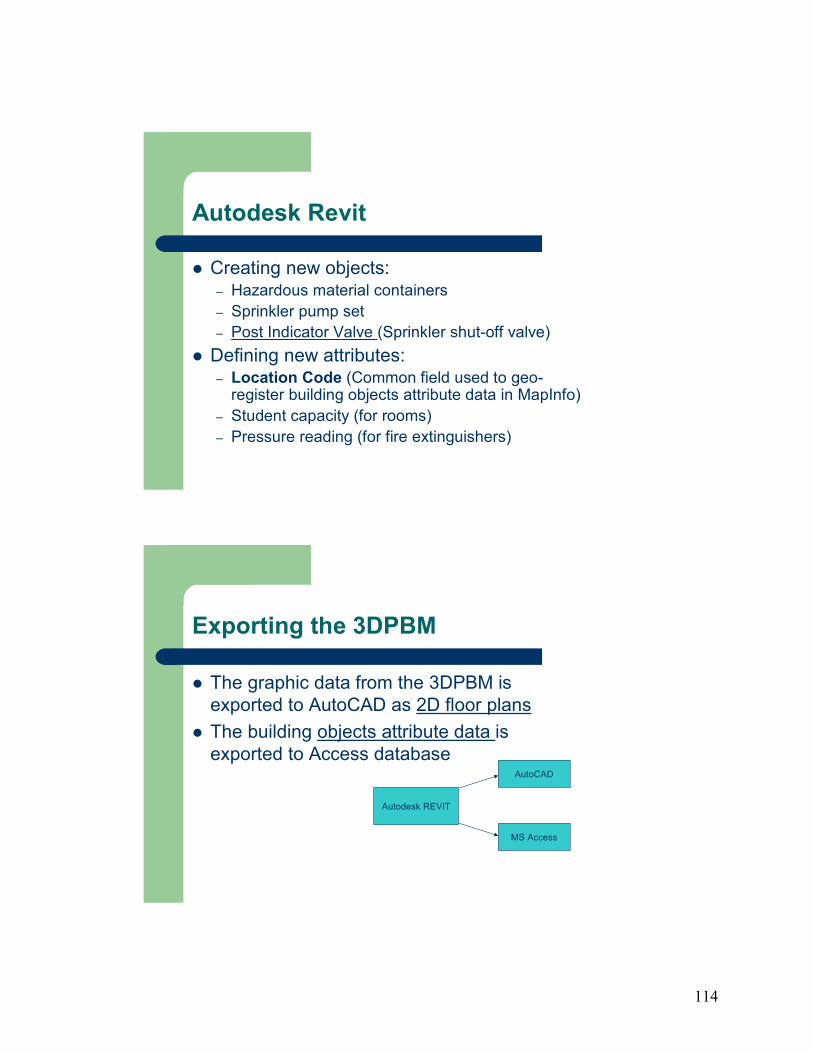
114
Autodesk Revit
Creating new objects:– Hazardous material containers– Sprinkler pump set– Post Indicator Valve (Sprinkler shut-off valve)
Defining new attributes:– Location Code (Common field used to geo-
register building objects attribute data in MapInfo)– Student capacity (for rooms)– Pressure reading (for fire extinguishers)
Exporting the 3DPBM
The graphic data from the 3DPBM is exported to AutoCAD as 2D floor plansThe building objects attribute data is exported to Access database
Autodesk REVIT
AutoCAD
MS Access
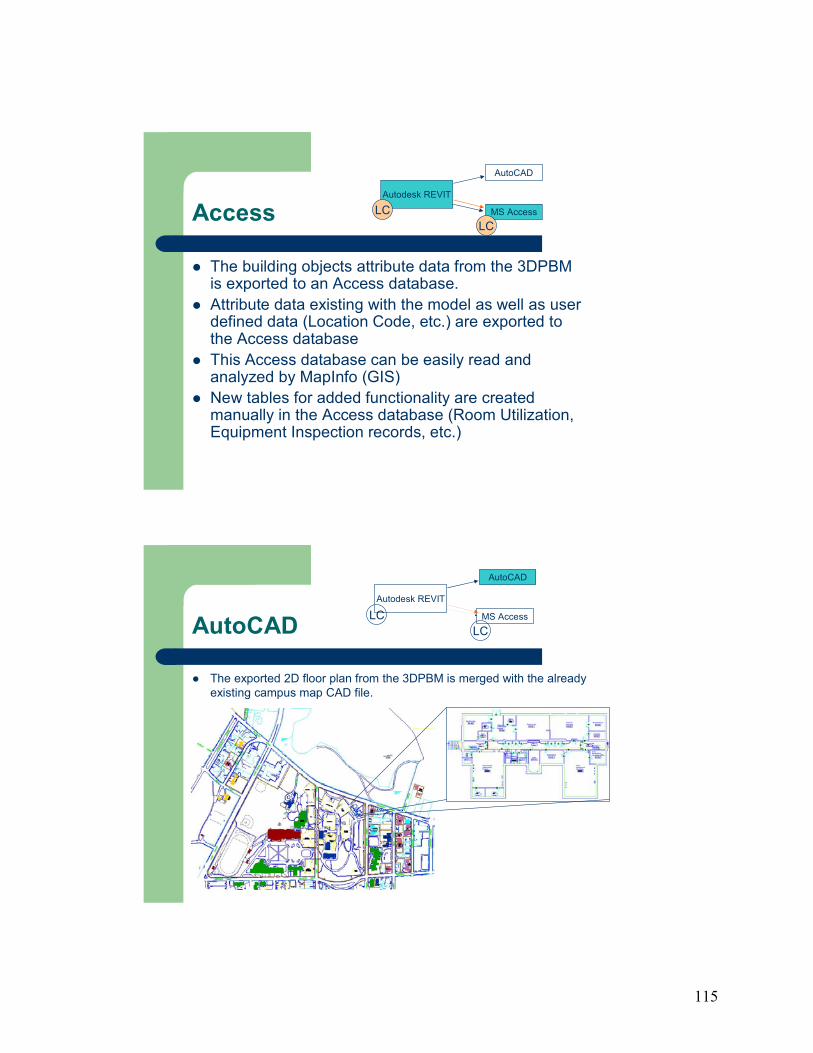
115
Access
The building objects attribute data from the 3DPBM is exported to an Access database.Attribute data existing with the model as well as user defined data (Location Code, etc.) are exported to the Access databaseThis Access database can be easily read and analyzed by MapInfo (GIS)New tables for added functionality are created manually in the Access database (Room Utilization, Equipment Inspection records, etc.)
Autodesk REVIT
AutoCAD
MS AccessLCLC
AutoCAD
The exported 2D floor plan from the 3DPBM is merged with the already existing campus map CAD file.
Autodesk REVIT
AutoCAD
MS AccessLCLC
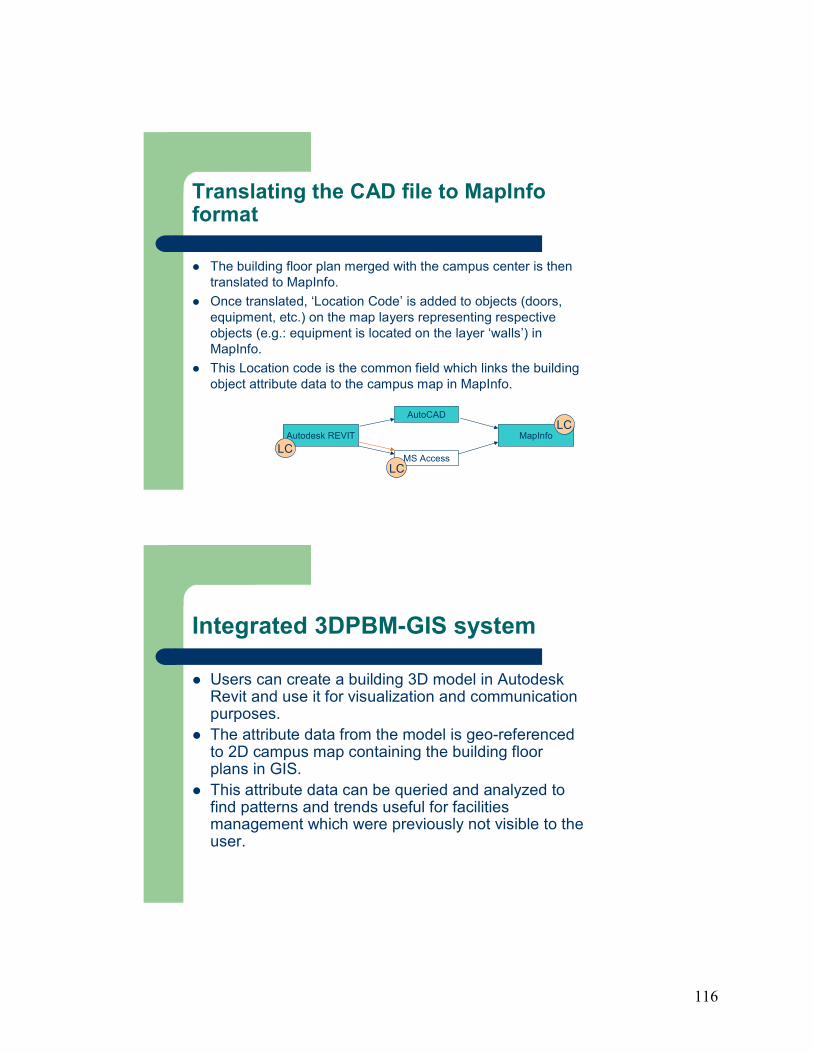
116
Translating the CAD file to MapInfo format
The building floor plan merged with the campus center is then translated to MapInfo.Once translated, ‘Location Code’ is added to objects (doors, equipment, etc.) on the map layers representing respective objects (e.g.: equipment is located on the layer ‘walls’) in MapInfo.This Location code is the common field which links the building object attribute data to the campus map in MapInfo.
Autodesk REVIT
AutoCAD
MS Access
MapInfoLC
LC
LC
Integrated 3DPBM-GIS system
Users can create a building 3D model in Autodesk Revit and use it for visualization and communication purposes.The attribute data from the model is geo-referenced to 2D campus map containing the building floor plans in GIS.This attribute data can be queried and analyzed to find patterns and trends useful for facilities management which were previously not visible to the user.
117
Conclusions
The integrated 3DPBM-GIS system can be used for a variety of applications such as:– On-campus space management– Equipment and facilities maintenance on campus– Planning for future expansion and new
construction– Dealing with fire safety issues on-campus
Benefits of the integrated 3DPBM-GIS system
Data created by 3DPBM is reused by GIS avoiding the necessity to re-create data.A central database system helps in maintaining records, keeping track of changes, understand the effects of the proposed changes on existing facilities.Continuous data flow from project conception, to construction to operations and maintenance till the end of the project life creates a healthy database for future reference.
118
Future recommendations
Integrating the animation capabilities (4D studies) of GIS with the data provided by the 3DPBM.Providing a CAD-GIS web-interface for displaying and manipulating the GIS results on the internet through the CAD or GIS environment.
Special Thanks
Mr. Ken Stowe and Autodesk Revit helplinePlant Services, WPI.Mr. Charles Kornick, WPI.E-Safety IQP group
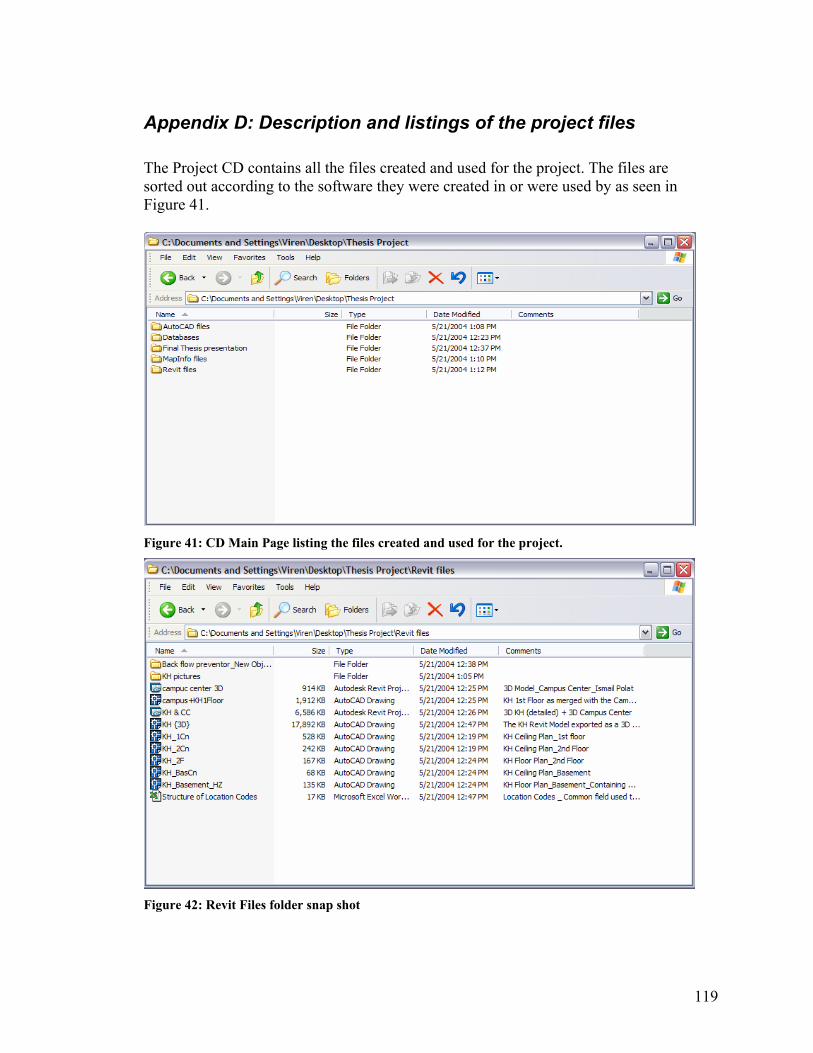
119
Appendix D: Description and listings of the project files
The Project CD contains all the files created and used for the project. The files are sorted out according to the software they were created in or were used by as seen in Figure 41.
Figure 41: CD Main Page listing the files created and used for the project.
Figure 42: Revit Files folder snap shot
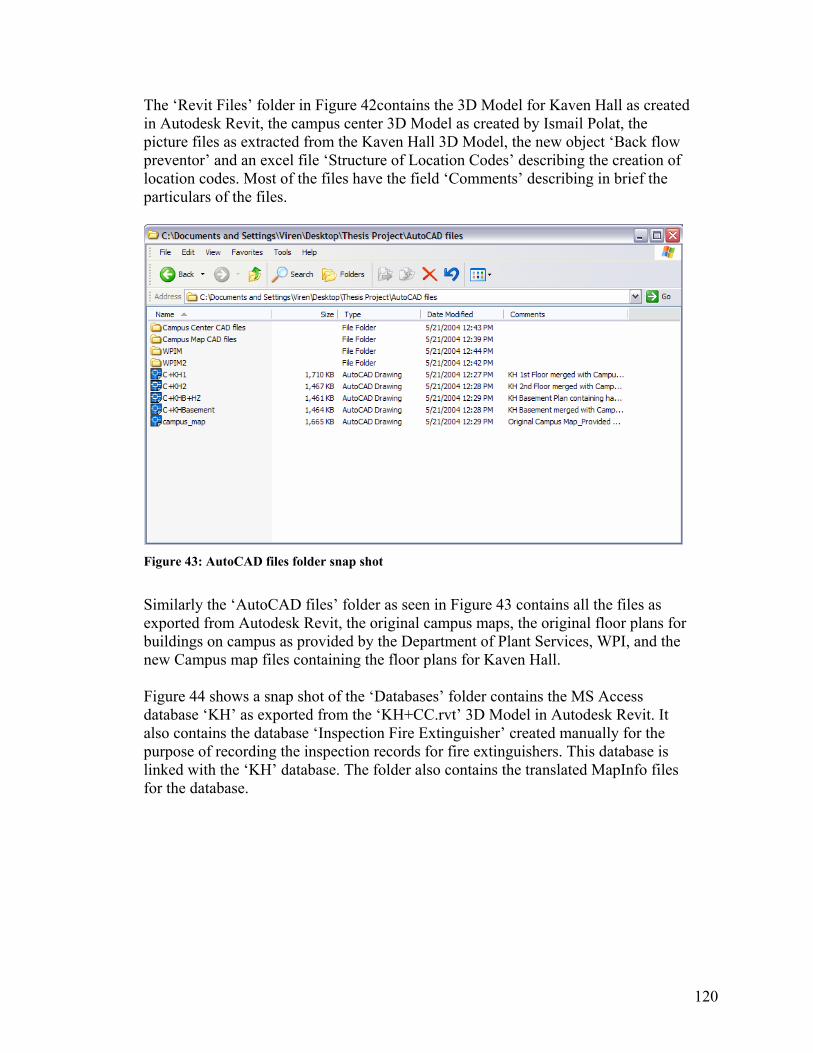
120
The ‘Revit Files’ folder in Figure 42contains the 3D Model for Kaven Hall as created in Autodesk Revit, the campus center 3D Model as created by Ismail Polat, the picture files as extracted from the Kaven Hall 3D Model, the new object ‘Back flow preventor’ and an excel file ‘Structure of Location Codes’ describing the creation of location codes. Most of the files have the field ‘Comments’ describing in brief the particulars of the files.
Figure 43: AutoCAD files folder snap shot
Similarly the ‘AutoCAD files’ folder as seen in Figure 43 contains all the files as exported from Autodesk Revit, the original campus maps, the original floor plans for buildings on campus as provided by the Department of Plant Services, WPI, and the new Campus map files containing the floor plans for Kaven Hall. Figure 44 shows a snap shot of the ‘Databases’ folder contains the MS Access database ‘KH’ as exported from the ‘KH+CC.rvt’ 3D Model in Autodesk Revit. It also contains the database ‘Inspection Fire Extinguisher’ created manually for the purpose of recording the inspection records for fire extinguishers. This database is linked with the ‘KH’ database. The folder also contains the translated MapInfo files for the database.
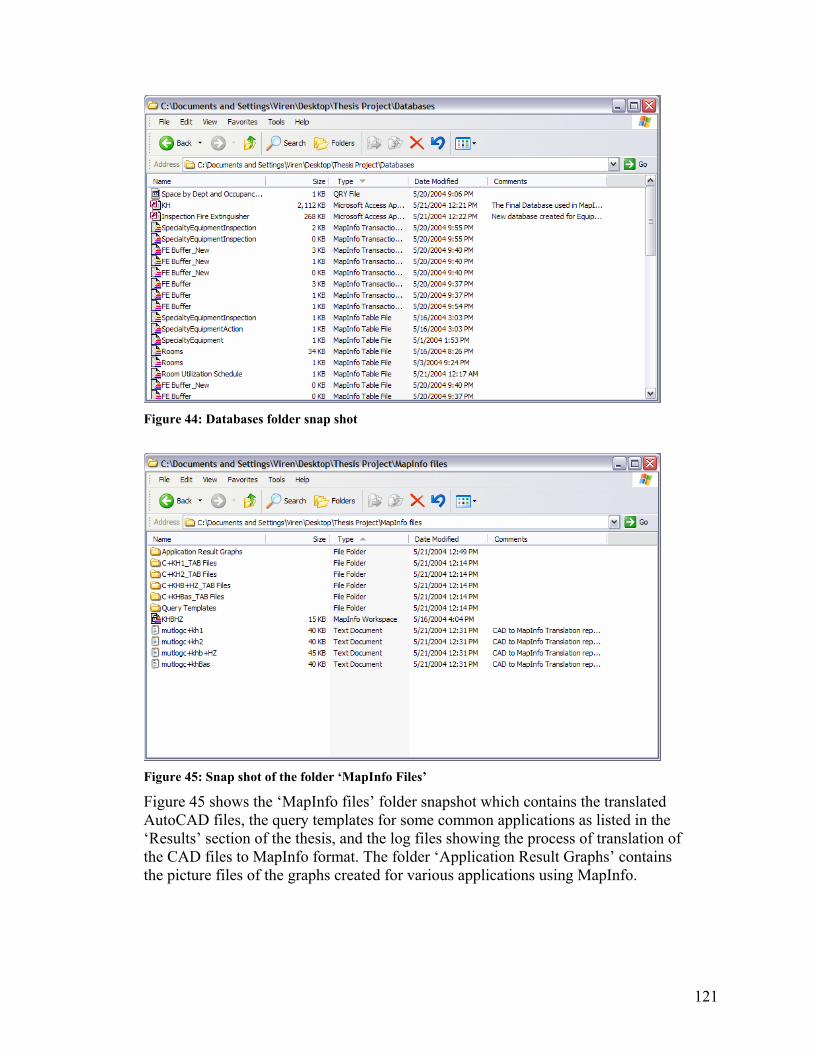
121
Figure 44: Databases folder snap shot
Figure 45: Snap shot of the folder ‘MapInfo Files’
Figure 45 shows the ‘MapInfo files’ folder snapshot which contains the translated AutoCAD files, the query templates for some common applications as listed in the ‘Results’ section of the thesis, and the log files showing the process of translation of the CAD files to MapInfo format. The folder ‘Application Result Graphs’ contains the picture files of the graphs created for various applications using MapInfo.