integration and shock transmissions across european...
TRANSCRIPT

Integration and Shock Transmissionsacross
European Electricity Forward Markets
Derek W. Bunn and Angelica Gianfreda∗
December 17, 2007
Abstract
New results are presented relating to the integration of the French, German,British, Dutch and Spanish power markets at day ahead, week-ahead, month-aheadand two month-ahead lead times. Overall, there is evidence of market integration,increasing over time, despite an underlying inefficiency in each market with respectto the forward and spot price convergence. The spatial analysis is undertakenusing causality tests, cointegration and impulse response techniques, for both pricelevels and volatilities. In general we find less influence of the size and proximity ofneighboring markets than other studies, more integration at baseload than peak,and, surprisingly, less integration in forwards than spot prices.
Keywords: Electricity, Forward Prices, Efficiency, Integration, Volatility, ShockTransmissions.
1 Introduction
Electricity is a comparatively new commodity, but it represents an increasingly importantsector of trading, and a challenging area of research. Although a substantial amount of re-search has already appeared to model the economic and dynamic properties of spot prices,eg Weron (2007), a full characterisation of the multicommodity, temporal and spatial as-pects of forward electricity prices still presents many open questions. A crucial stylisedfact is that electricity, once produced cannot be stored in any significant amount, and soforward prices are generally seen as expectations of spot, adjusted perhaps with a riskpremium (Bessembinder and Lemmon, 2002; Shawky et al, 2003). This raises empiricalissues of the convergence of forward prices to the expected spot prices as well as modelspecifications for the term structure (Borenstein et al, 2003; Lucia and Schwartz, 2002;Wilkens and Wimschulte, 2007). Furthermore, this also implies, since consumer demand
∗Energy Markets Group, Department of Decision Sciences, London Business School, Sussex Place,London. Emails: [email protected] and [email protected]
1

varies throughout the day and sets prices according to its intersection with the generators’supply function, that the separate hourly prices for electricity actually represent differentcommodities. Electricity produced during a daily peak hour is quite different from thatproduced during the night, in terms of the fundamental demand and supply functions,as well as the relative risk aversion of the market participants (Longstaff et al, 2004).Thus, without any physical temporal arbitrage, regulators hope that competitive forceswill be enough to create efficiency, and hence we see their persistent policy concerns aboutmarket structure, resource adequacy and regional interconnection (EC, 2006). Facilitat-ing the latter, in particular, through greater network interconnection capacities, and theharmonisation of trading at various local hubs has been actively pursued in many partsof the world including North and South America, Europe and Australia, with the aim ofimproving both market efficiency and system reliability.
This paper seeks to advance our understanding of the efficiency of European electric-ity spot and forward prices looking at their predictability and at their spatial properties,where several regional markets may be linked by capacity constrained interconnections.We pursue this through an analysis of forward and spot prices at the French, German,Dutch, British and Spanish markets within the European grid. All of these markets are ac-tive, but differ in their interconnectivity: France and Germany are well-linked; the Dutchand British rather less so with Germany and France respectively, and Spain even less sowith France.Previous studies on the European market integration have included Bower(2002), Boisselau (2004) and Zachmann (2007), resulting in the general observations thatsignificant, but rather inefficient, market integration was being achieved. Furthermore,these analyses focussed only upon spot markets, without seasonal considerations, andwithout the base and peak product distinctions. Elsewhere, Bailey (1998), De Vany andWalls (1999), Jerko et al. (2004) have looked at market integration in the US, whilst Wor-thington et al. (2005) provides an empirical analysis of market integration and volatilityshock transmission in Australia. The overall insights again point to integration, more inthe US, less so in Australia, but fundamental general concepts are still quite formative,however. Thus, Bailey (1998) and Jerko et al (2004) suggest that integration is higherin the higher demand seasons, but De Vany and Walls (1999), find, unlike Worthington(2005), that there is no increased integration in Peak compared to Off-peak prices. Jerkopoints to the size of the importing market in driving prices, whereas Worthington suggeststhe extra effect of geographical proximity in transmitting volatility shocks.
Compiling and extending these concepts, we therefore seek to use the European marketdata to provide insights on the following general propositions:
1. Integration will be higher, the more interconnection capacity a market possess : thisseems most plausible, and one would expect, for example, Germany, with nineexternal links to be more integrated than Spain, with its two, but what this impliesfor price shock and volatility transmission is still an open question
2. Integration will be higher for the geographically closer market : with large geograph-ical distances, and the associated transmission losses, this would seem plausible,but as Europe is quite compact, and the transmission fees are not distance related,neighbourliness by itself may not be a significant driver
2

3. Integration will be higher, the larger the import market : with California being alarge importing market, this effect was suggested in the study by Jerko et al (2004).However, it is also possible to envisage that a large exporting country, eg France,could equally well foster greater market integration
4. Integration will be higher, the higher the seasonal demand : this has also been foundin previous studies, but one could hypothesise that lower demand periods are morecompetitive, with less congestion at the interconnectors and therefore possibly moreintegrated
5. Integration will be higher for peak than for off-peak prices : again, this is an openquestion. The peaks motivate more trading, but the off-peaks may exhibit lesslocalised scarcity pricing
6. Integration will be higher in the forward than the spot : in that forward prices reflectexpectations, and therefore internalise the conventionally understood interactionmodel in the market, whereas spot prices reflect local demand and supply shocks onthe day, one would suggest that forward integration should be greater. Less plausiblebut possible, is that short-term events promote more opportunistic trading whichmight foster integration, especially as the network system operators often releasemore of their previously reserved interconnection capacity closer to real-time whenit becomes clear that their own system reserves are adequate.
Thus, all of these propositions are open to further evidence and analysis. The paper isorganized as follows. Section 2 presents the data and before looking at spatial efficiency,the efficiency of the forward to spot relationships in each market is summarised. Section 3then reports the analysis of cross-market interactions with respect to market integrationand shock transmissions, for both price levels and volatility. Section 4 concludes.
2 Definitions and Data Sets
Data from the power exchanges and the Heren price reporting service have been used.Hourly prices coming from Power Exchanges have been converted into average day-aheadprices (as in Worthington et al. (2005), Lucia and Schwartz (2002) and De Vany andWallas (1999)). The exception is the UK market, which trades continuously until an hourbefore real time, and so day ahead prices coming from Heren were used for comparability.All prices are quoted in e/MWh, except UK prices which are in £/MWh.
The forward price, F (t, T ), is the price observed on day t for delivery on maturity T .Using the Heren’s price assessments, we have: the day–ahead price, D(t, T )i, is the priceobserved today, t, for delivery during period i on the following working day (T = t + 1);
the week–ahead price, W (t, T )i, is for delivery each day of the next week which starts onMonday and ends on Sunday for delivery during base periods, and on Friday for deliveryduring peak periods; the one month–ahead price, 1M(t, T )i, is for delivery during period
i of each day of the following month; the two month–ahead price, 2M(t, T )i, is for deliveryduring period i of each day of the month following the next month.
3

We use both the baseload and the peakload prices. The former are for a delivery ata flat rate during the delivery period, Monday to Sunday, and they are the average of24 hourly prices. The latter are for peak periods of only working days, that is Mondayto Friday1. Moreover, since UK day-ahead prices provided by Heren are not reported onweekends, then base prices are assumed to be referred only to days Monday to Friday,because the error introduced is negligible2.
Following convention, we refer to these day ahead prices as ”spot”, since they offerthe final opportunity for speculators to trade out of forward positions. We consider theperiod from 15 July 2001 to 15 July 2005, for Germany, France3, The Netherlands, Spainand UK. The average base spot prices4 are represented in figure (1), and the statisticsfor spot, week-ahead, one month-ahead and two month-ahead (base and peak) forwardprices are reported in table (1).
Notwithstanding jumps and volatility clustering, our results confirm stationary for allbase and peak spot prices, according to the Phillips-Perron test. But all other week andmonth ahead prices were tested as not stationary5 and in particular base and peak weeklyand monthly series are found to be I(1).
Among the aspects of market efficiency, authors have considered the law of one price(that is observing the same price between different locations/markets), some others con-sider the predictability of forward prices (see Fama and French (1987)) and finally othersagain the existence of zero risk premia (Hadsell and Shawky (2007)).
As first aspect of market efficiency, we consider the possibility that forward prices con-tain some information on realized spot prices, following the approaches proposed by Famaand French (1987), implemented by Chinn, LeBlanc and Coibion (2001), Movissagh andModjtahedi (2005) and Huismann et al. (2006). Thus, if markets are efficient we expectthat forward prices are unbiased predictors of future spot prices or that the differencesbetween current spot and forward prices, known as the basis, will help us in forecastingprobable changes between current spot prices and those observed at the delivery T. Thus,the following analysis has been performed
S(T ) − S(t) = α + β (F (t, T ) − S(t)) + εT
where S(T ) is the future spot price at delivery date, S(t) is the spot price at time t,F (t, T ) is the forward price observed at time t for delivery at time T , εT is the error andα and β are real coefficients with optimal conditions of α = 0 and β = 1.
If β > 0, then the current spot and forward prices contain information about thepossible change in spot prices, or in other words that forward prices have some predictivevalue. We define the following degrees of predictability: if the simultaneous conditions
1Definitions of peak periods vary, i.e. 09–20 for Germany and France, 09–00 for Spain, 08–22 for TheNetherlands and 07–19 for UK.
2See Gianfreda (2005).3However the French market started its operations on 26 November 2001.4Some researchers consider daily closing prices but we believe that this could produce loss of informa-
tion and moreover closing market times differ across our set of markets.5Unique exceptions are Spanish base week–ahead, German peak week–ahead and French peak 2
month–ahead prices. These results are in contrast to visual inspection of their respective graphs andalso to the Augmented–Dickey Fuller test. Therefore these prices have been considered non–stationary.This is at 5% significance level. Moreover Spanish peak week–ahead prices only provide 14 observations.
4
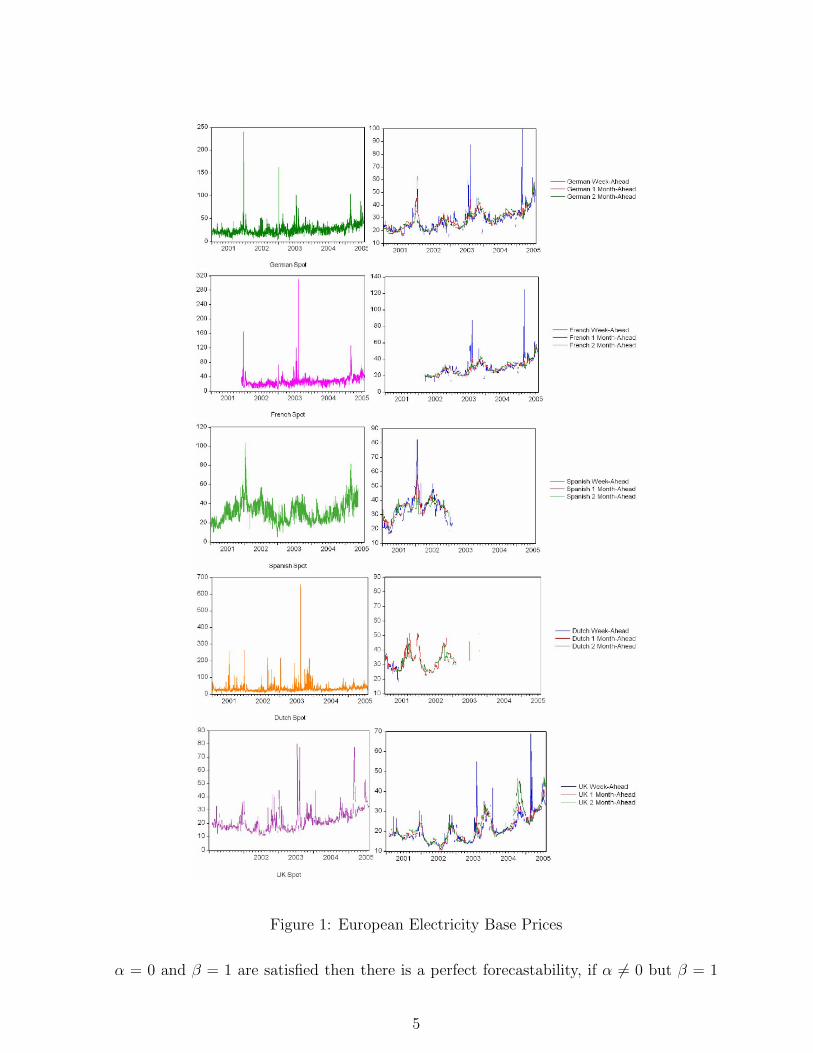
Figure 1: European Electricity Base Prices
α = 0 and β = 1 are satisfied then there is a perfect forecastability, if α 6= 0 but β = 1
5

Base PeakMarkets Statistics Da Wa 1 Ma 2 Ma Da Wa 1 Ma 2 MaGermany Mean 28.7 29.5 29.6 29.6 37.0 43.0 43.0 43.5
Median 27.8 28.0 28.8 28.8 34.8 41.0 42.5 43.0Maximum 240.3 100.0 57.8 57.0 445.0 170.0 92.8 84.5Minimum 3.1 15.0 17.0 19.5 0.8 19.3 25.5 25.9Std. Dev. 13.4 8.8 6.7 6.8 23.4 15.8 10.3 10.0Skewness 5.0 2.2 0.9 1.0 7.9 3.1 1.4 1.2Kurtosis 63.3 13.5 4.6 4.6 114.0 18.6 6.3 5.7Observations 1462 975 1000 1000 1045 804 799 737
France Mean 28.8 29.5 29.4 29.6 36.2 44.8 43.2 44.7Median 27.2 28.1 28.4 29.4 33.6 42.0 43.3 44.0Maximum 310.4 125.0 57.8 56.5 606.2 180.0 92.0 233.6Minimum 4.9 12.6 18.1 18.6 5.1 15.9 21.7 26.0Std. Dev. 15.1 9.8 7.3 7.6 25.4 17.4 11.7 14.6Skewness 6.8 3.2 0.8 0.7 10.9 3.4 1.1 5.3Kurtosis 104.7 26.2 4.2 3.7 214.0 21.2 5.5 65.5Observations 1327 819 819 798 1249 545 515 443
Spain Mean 33.7 35.9 36.8 36.0 39.3 37.3 37.8 naMedian 33.1 35.6 36.6 36.1 38.1 35.5 38.0 naMaximum 103.8 82.5 64.0 57.9 121.4 52.0 39.0 naMinimum 5.5 19.0 25.7 27.5 5.5 26.5 36.5 naStd. Dev. 11.5 9.8 5.8 4.3 15.7 8.6 1.3 naSkewness 1.0 1.3 1.2 1.4 1.2 0.4 -0.2 naKurtosis 5.9 7.0 6.2 7.8 5.6 1.9 1.5 naObservations 1412 496 435 398 1042 14 3 0
Netherlands Mean 36.7 NA 35.5 35.5 47.3 NA 54.3 55.9Median 30.7 NA 34.9 34.6 37.0 NA 51.6 54.2Maximum 660.3 NA 82.5 66.0 923.8 NA 93.0 110.5Minimum 6.8 NA 22.7 24.7 8.2 NA 31.0 34.8Std. Dev. 33.4 NA 7.5 7.1 53.3 NA 12.4 12.4Skewness 10.3 NA 1.0 1.2 9.7 NA 1.3 1.5Kurtosis 166.8 NA 6.3 5.8 140.2 NA 4.7 6.1Observations 1462 0 500 464 1045 0 169 141
UK Mean 22.0 21.1 21.5 22.0 30.0 30.2 33.0 34.0Median 20.4 19.8 19.9 20.4 27.5 28.2 30.8 31.4Maximum 80.0 69.0 41.0 47.1 167.5 107.5 58.2 60.7Minimum 10.4 10.7 11.3 12.3 13.3 14.3 16.0 15.9Std. Dev. 8.4 6.8 6.5 7.3 14.0 10.8 9.7 10.5Skewness 2.3 1.4 0.6 1.1 3.5 2.0 0.5 0.5Kurtosis 12.8 7.2 2.5 3.9 24.6 11.4 2.3 2.4Observations 1009 1006 959 1007 721 698 670 631
Table 1: Descriptive Statistics for All Base and Peak Forward Prices
6

then there is a strong forecastability and situations with α = 0 but β 6= 1 or α 6= 0 andβ 6= 1 identify a weak and an imperfect forecastability respectively.
Estimates are reported in table (4) in appendix (A.1) and results are summarized intable (2). They show clearly6 that only in the Dutch base and peak 1 month-ahead prices,we find a perfect forecastability. We first conclude that generally the forward prices withlonger maturity are better predictors than those with shorter maturity given that alphatends to become insignificant and beta tends to one as time increases and secondly thatthere is an efficiency problem in all these markets since generally the optimal conditionsare never satisfied simultaneously and we observe a perfect forecastability only in onemarket and just for one type of price.
Perfect Strong Weak ImperfectDE wa XX
1ma XX2ma X· · X
FR wa X· · X1ma · X X·2ma X· · X
ES wa X·1ma X·2ma X·
NL wa1ma XX2ma · X X·
UK wa · X X·1ma X· · X2ma XX
Table 2: Forecastability of Forward Prices where XX means forecastability in base andpeak periods; X· means forecastability only in base period and · X means forecastabilityonly in peak period.
3 Cross–Market Interactions
As a second aspect of efficiency, we have considered the analysis of spatial integration. Inthis case efficiency would be manifest in the ease with which shocks in one location gettransferred to its neighbouring locations. Therefore we first looked at the 10 pairs of spotprices, for base and peak periods, using Granger causality tests and cointegration analysis.Studying the correlation of spot prices (table 3 displays correlations for instances whereall 5 market observations were available), we see that all markets are positively related
6The basis differences in spot prices, S(T ) − S(t), and the basis differences in current forward andspot prices, F (t, T )−S(t), were tested stationary for all forward levels considered, that is week–ahead, 1month–ahead and 2 month–ahead. Given the overlapping problem (see Bystrom (2001)) all estimationshave been obtained by the Newey–West estimation procedure.
7
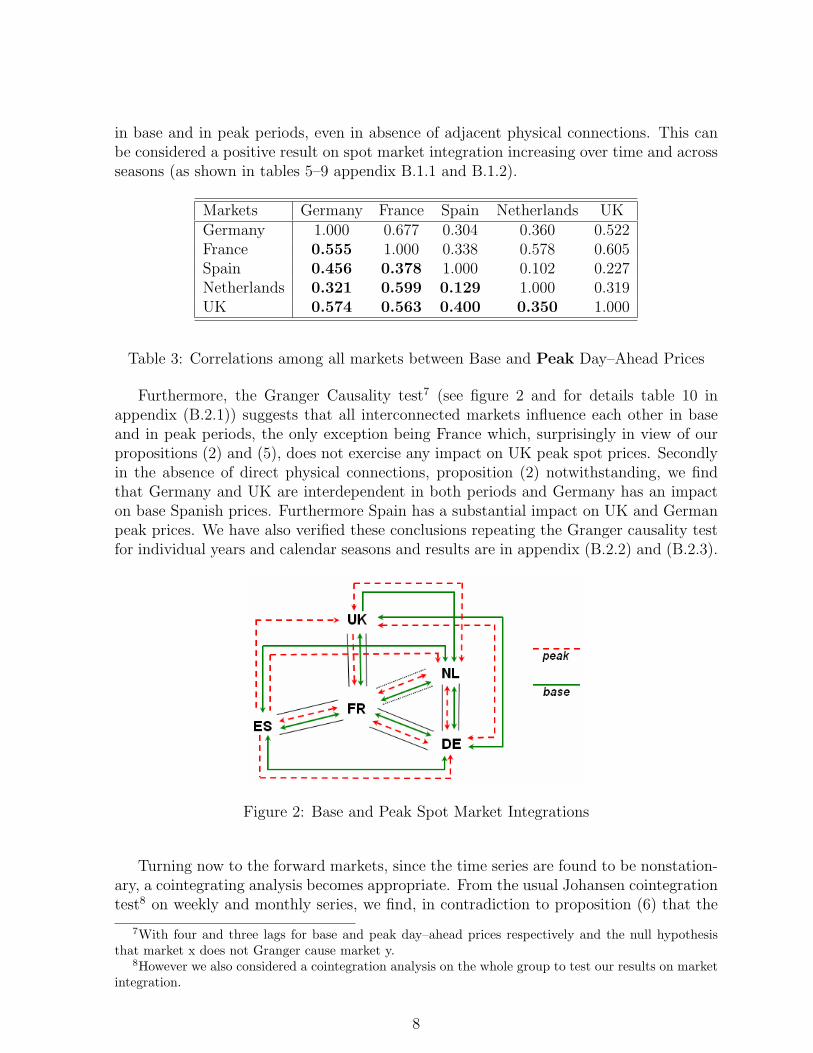
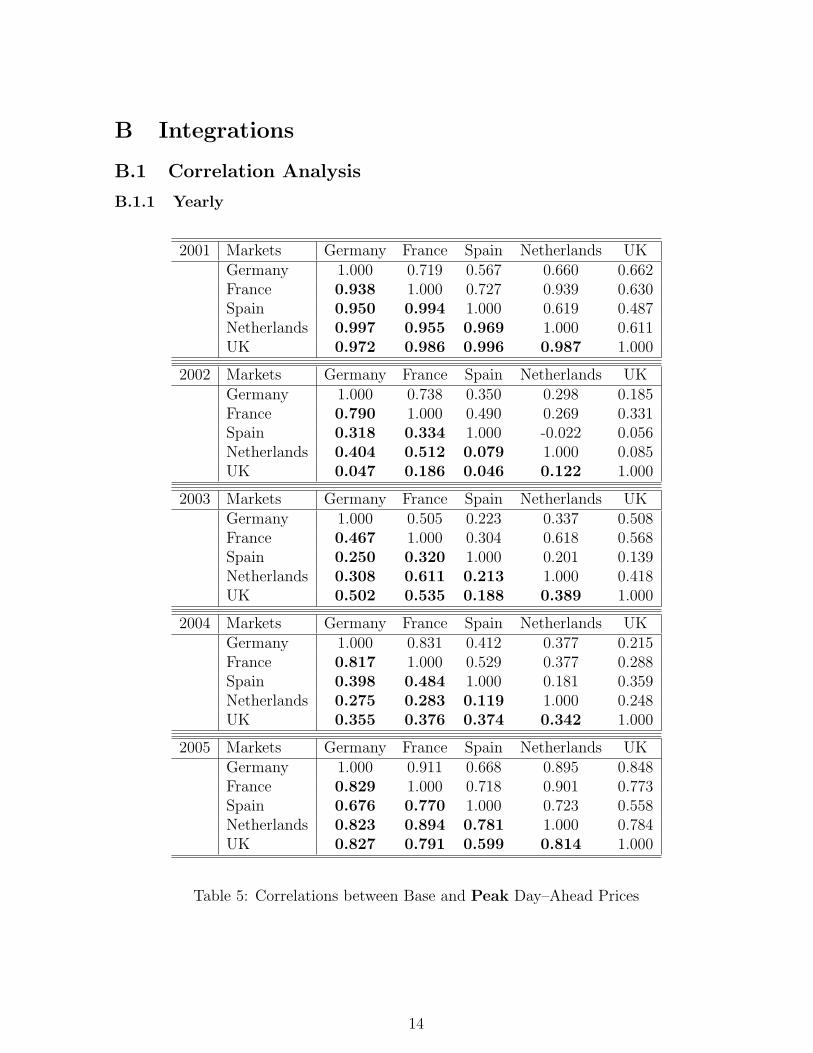
in base and in peak periods, even in absence of adjacent physical connections. This canbe considered a positive result on spot market integration increasing over time and acrossseasons (as shown in tables 5–9 appendix B.1.1 and B.1.2).
Markets Germany France Spain Netherlands UKGermany 1.000 0.677 0.304 0.360 0.522France 0.555 1.000 0.338 0.578 0.605Spain 0.456 0.378 1.000 0.102 0.227Netherlands 0.321 0.599 0.129 1.000 0.319UK 0.574 0.563 0.400 0.350 1.000
Table 3: Correlations among all markets between Base and Peak Day–Ahead Prices
Furthermore, the Granger Causality test7 (see figure 2 and for details table 10 inappendix (B.2.1)) suggests that all interconnected markets influence each other in baseand in peak periods, the only exception being France which, surprisingly in view of ourpropositions (2) and (5), does not exercise any impact on UK peak spot prices. Secondlyin the absence of direct physical connections, proposition (2) notwithstanding, we findthat Germany and UK are interdependent in both periods and Germany has an impacton base Spanish prices. Furthermore Spain has a substantial impact on UK and Germanpeak prices. We have also verified these conclusions repeating the Granger causality testfor individual years and calendar seasons and results are in appendix (B.2.2) and (B.2.3).
Figure 2: Base and Peak Spot Market Integrations
Turning now to the forward markets, since the time series are found to be nonstation-ary, a cointegrating analysis becomes appropriate. From the usual Johansen cointegrationtest8 on weekly and monthly series, we find, in contradiction to proposition (6) that the
7With four and three lags for base and peak day–ahead prices respectively and the null hypothesisthat market x does not Granger cause market y.
8However we also considered a cointegration analysis on the whole group to test our results on marketintegration.
8

European Forward markets are, in general, less integrated than the spot ones (see figure3), and that there are only significant interactionsfor base and peak across the forwardcurve between the UK, French and German markets (see propositions (1) and (3)). ACointegration test over the full sample of forward prices cannot be performed becausethere were no Dutch observations at base weekly level. Using a reduced sample we havefound a cointegrating equation among Germany, France, Spain and UK. For peak periods,we did a further reduction excluding Spain, and found 2 cointegrating equations amongGermany France and UK. Considering 1 month–ahead prices, there is a cointegratingequation among all markets in base periods, with Spain and The Netherlands playing amarginal role. In peak periods, excluding Spain and The Netherlands, we again found acointegrating equation between Germany, France and UK. At 2 month–ahead levels, inbase periods we found a cointegrating equation among all markets but a strong relation-ship only between Germany and France. In peak period, again there is a cointegratingequation between Germany France and UK with marginal role of UK this time.
Figure 3: Base and Peak Forward Market Integrations from Pairwise Cointegration Tests
More revealing perhaps than the longer term cointegration tests are the short-termtransmissions of shocks in price levels and volatility. Hence we have investigated thedynamics of shocks for prices and squared logarithmic returns (as proxy of volatility9),using impulse response functions in Vector Autoregressive (VAR) for spot prices andVector Error Correction (VEC) models for the forward prices10. The VAR(i) model can
9It is known that squared returns and absolute values of returns can be used as proxy for volatility,as in Fiorenzani (2006).
10Given the documented problems of convergence of multivariate Garch models, see Karolyi (1995),Bunn and Karakatsani (2005) and Fontana, Gianfreda and Reno (2006), we have decided simply to adoptthe VAR models with impulse-response functions, see also Park et al. (2006) for spot price dynamics inUS.
9

be expressed as follows
Gt = aGGt−i + bGFt−i + cGSt−i + eGNt−i + hGUt−i + lG
Ft = aF Gt−i + bF Ft−i + cF St−i + eF Nt−i + hF Ut−i + lF
St = aSGt−i + bSFt−i + cSSt−i + eSNt−i + hSUt−i + lS
Nt = aNGt−i + bNFt−i + cNSt−i + eNNt−i + hNUt−i + lN
Ut = aUGt−i + bUFt−i + cUSt−i + eUNt−i + hUUt−i + lU
where G, F , S, N , U are day–ahead prices of German, French, Spanish, Dutch and UKmarkets at time t and at time (t − i) and where aj, bj, cj, ej, hj, lj are coefficients forj = G, F, S,N, U . However given the non-stationarity of forward prices we follow Engleand Granger (1987) and seek more appropriately to implement a VEC(1) specified asfollows, considering only three markets and a significant cointegrating equation amongthem,
∆waGt = γ1∆waF
t + φ1∆waUt + α1
(waG
t−1 − β1waFt−1 − β2waU
t−1 − c)
+ c1 + ε1,t
∆waFt = γ2∆waG
t + φ2∆waUt + α2
(waG
t−1 − β1waFt−1 − β2waU
t−1 − c)
+ c2 + ε2,t
∆waUt = γ3∆waF
t + φ3∆waGt + α3
(waG
t−1 − β1waFt−1 − β2waU
t−1 − c)
+ c3 + ε3,t
where waG, waF and waU represent week–ahead prices of German, French and UK mar-kets at time t and at time (t− 1), ∆wa are the differentiated series of week–ahead priceswith φ’s and γ’s impacts and the c’s represent constants or trends. The αi terms are theerror correction terms which become zero in the long–run equilibrium and measure thespeed of adjustment of each market price.
Then we inspect shock transmissions between these five European markets, as impliedby the estimated VARs and VECs. The impulse is usually a shock of one standard de-viation and the responses relate to the price affected by the shock and all other prices.Moreover shocks are usually correlated, and therefore the Cholesky’s transformation, ad-justed for degrees of freedom, has been applied to the shocks as proposed by Shawky etal(2003). This technique orthogonalizes the impulses and the chosen order is the reverseof time of market closure. Thus, moving from the most to the less informed market wehave the sequence UK, Germany, France, Spain and The Netherlands. The results aresummarized in figure (4) in which a significant shock transmission11 is represented by anarrow from the shocked market to the affected markets. Shock price transmissions are onthe left side and shock volatility transmissions are on the right side.
Overall we see an integration in both spot and forward markets, but, surprisinglyrather less in forward than spot. Indeed we have found that spot markets are well inte-grated in base and peak periods even without direct links between markets. Furthermore,the analysis of shock transmissions emphasizes this result since shocks in day–ahead pricesare generally transmitted to all other markets for both price and volatility levels. Consid-ering the forward markets, although we can see an integration of the forward markets fromthe shocks in forward prices, this is not observed in the volatility shock transmissions.
11In the VEC models for forward prices, if a market is not significant in the system of dynamic equationswe assume that its impulses and responses are not significant in the subsequent analysis.
10
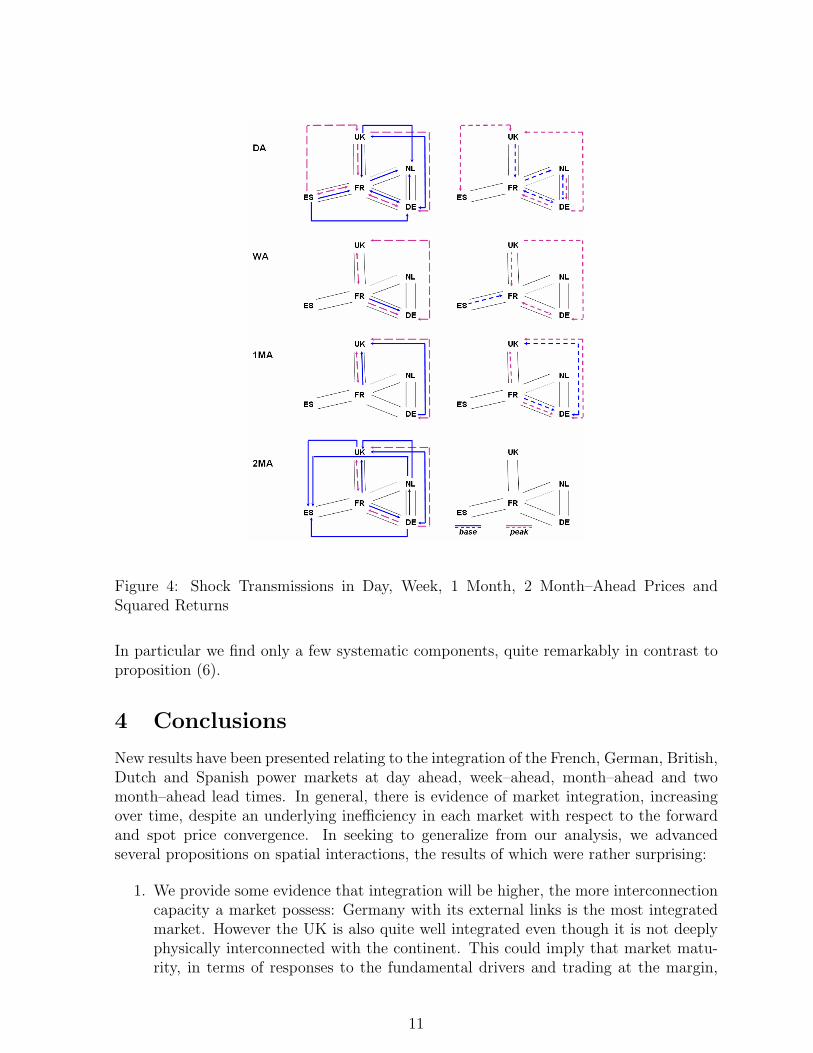
Figure 4: Shock Transmissions in Day, Week, 1 Month, 2 Month–Ahead Prices andSquared Returns
In particular we find only a few systematic components, quite remarkably in contrast toproposition (6).
4 Conclusions
New results have been presented relating to the integration of the French, German, British,Dutch and Spanish power markets at day ahead, week–ahead, month–ahead and twomonth–ahead lead times. In general, there is evidence of market integration, increasingover time, despite an underlying inefficiency in each market with respect to the forwardand spot price convergence. In seeking to generalize from our analysis, we advancedseveral propositions on spatial interactions, the results of which were rather surprising:
1. We provide some evidence that integration will be higher, the more interconnectioncapacity a market possess: Germany with its external links is the most integratedmarket. However the UK is also quite well integrated even though it is not deeplyphysically interconnected with the continent. This could imply that market matu-rity, in terms of responses to the fundamental drivers and trading at the margin,
11

could be as much, if not more important than the simple physical capacity to tradevolumes.
2. Our evidence shows that it is not simply that integration will be higher for thegeographically closer market. We have found for example good integration betweenGermany and UK and also between Germany and Spain in price shock transmis-sions in spot and some forwards. Since all these markets produce their electricitymainly with thermal power, then electricity price shock transmissions could be dueto common shocks affecting gas prices. This, again, suggests common fundamen-tal drivers rather than simple physical arbitrage, and/or that traders look at basisspreads financially rather than in terms of physical transmission across intermediatemarkets.
3. We, surprisingly, found that a large exporting market, France, does not create shocktransmissions from this market to the others. An explanation for this could be thatFrench baseload nuclear exports are low cost and do not generally set the prices inthe importing markets. This price-seting aspect could also explain why, in general,markets appear to react in different ways and shocks are transmitted with differentsizes. However we do find evidence that integration will be higher, the larger theimport market since the largest importing market, Germany, always shows thisdependency even from countries not directly related.
4. We have not found clear evidence for the proposition regarding higher integrationduring seasonal demand and peak periods, since we have found only a few interac-tions at price and even less at volatility levels. This would appear to be an importantdeficiency because markets need integration especially during peaks and high sea-sonal demands in order to avoid sudden spikes in prices as well as possible physicaloutages.
5. Finally, and surprisingly, we have shown that integration is not higher in the forwardthan the spot market. This could be a market maturity and liquidity issue, orit could relate to system management issues such as the release of more physicalinterconnector capacity closer to real time.
Overall, electricity markets present complex regional co–ordination problems as wellas local idiosyncracies, which can preclude a high achievement of spatial, temporal andcross commodity arbitrage. It seems inevitable that there will always be a substantialbehavioural element to the dynamics of price and volatility interactions, especially withthe oligopolies and market power characteristics of the industry structure, for which inter–regional and inter–temporal trading offer further opportunities to exploit inefficiencies.Nevertheless, a significant degree of market integration has emerged in Europe, and thedynamics of price interaction are beginning to show plausible patterns. In the future,we would expect to see even more convergence, not just through market maturity andfurther harmonization of trading procedures, but also as a result of intergovernmentalco–ordination of measures to price environmental externalities. The emergence of carbontrading, for example, adds a common factor to the prices within all EU member states.
12

A Data Sets
A.1 Efficiency – Forecast Power of Forward Prices
Base Peakα β α β
Germany wa -1.1 (0.006) 0.9 (0.000) -2.6 (0.000) 0.8 (0.000)1ma -0.5 (0.178) 0.9 (0.000) -2.5 (0.000) 0.9 (0.000)2ma 0.1 (0.908) 1.0 (0.000) -2.2 (0.000) 0.9 (0.000)
France wa -0.3 (0.482) 1.1 (0.000) -2.7 (0.000) 1.1 (0.000)1ma -0.1 (0.766) 0.9 (0.000) -2.4 (0.000) 1.0∗ (0.000)2ma 0.3 (0.561) 0.9 (0.000) -1.9 (0.000) 0.7 (0.000)
Spain wa -1.1 (0.024) 0.7 (0.000) -2.8 (0.482)+ -0.2 (0.692)+
1ma -0.9 (0.186) 0.7 (0.000) neo (neo) neo (neo)2ma -0.7 (0.501) 0.8 (0.000) neo (neo) neo (neo)
Nether wa neo (neo) neo (neo) neo (neo) neo (neo)1ma -0.6 (0.423) 1.0∗ (0.000) -3.7 (0.101) 1.0∗ (0.000)2ma 0.3 (0.687) 0.9 (0.000) -1.7 (0.583) 0.8∗ (0.001)
UK wa -0.4 (0.134) 0.9 (0.000) -1.0 (0.020) 1.1∗ (0.000)1ma -0.3 (0.338) 0.8 (0.000) -2.1 (0.000) 0.9 (0.000)2ma -0.4 (0.264) 0.8 (0.000) -2.2 (0.000) 0.9 (0.000)
Table 4: Forecast Power of Forward Prices. P-values are reported in brackets. ∗ meansbeta statistically equal to one at 5% and + means that there are only few observations.
13
B Integrations
B.1 Correlation Analysis
B.1.1 Yearly
2001 Markets Germany France Spain Netherlands UKGermany 1.000 0.719 0.567 0.660 0.662France 0.938 1.000 0.727 0.939 0.630Spain 0.950 0.994 1.000 0.619 0.487Netherlands 0.997 0.955 0.969 1.000 0.611UK 0.972 0.986 0.996 0.987 1.000
2002 Markets Germany France Spain Netherlands UKGermany 1.000 0.738 0.350 0.298 0.185France 0.790 1.000 0.490 0.269 0.331Spain 0.318 0.334 1.000 -0.022 0.056Netherlands 0.404 0.512 0.079 1.000 0.085UK 0.047 0.186 0.046 0.122 1.000
2003 Markets Germany France Spain Netherlands UKGermany 1.000 0.505 0.223 0.337 0.508France 0.467 1.000 0.304 0.618 0.568Spain 0.250 0.320 1.000 0.201 0.139Netherlands 0.308 0.611 0.213 1.000 0.418UK 0.502 0.535 0.188 0.389 1.000
2004 Markets Germany France Spain Netherlands UKGermany 1.000 0.831 0.412 0.377 0.215France 0.817 1.000 0.529 0.377 0.288Spain 0.398 0.484 1.000 0.181 0.359Netherlands 0.275 0.283 0.119 1.000 0.248UK 0.355 0.376 0.374 0.342 1.000
2005 Markets Germany France Spain Netherlands UKGermany 1.000 0.911 0.668 0.895 0.848France 0.829 1.000 0.718 0.901 0.773Spain 0.676 0.770 1.000 0.723 0.558Netherlands 0.823 0.894 0.781 1.000 0.784UK 0.827 0.791 0.599 0.814 1.000
Table 5: Correlations between Base and Peak Day–Ahead Prices
14
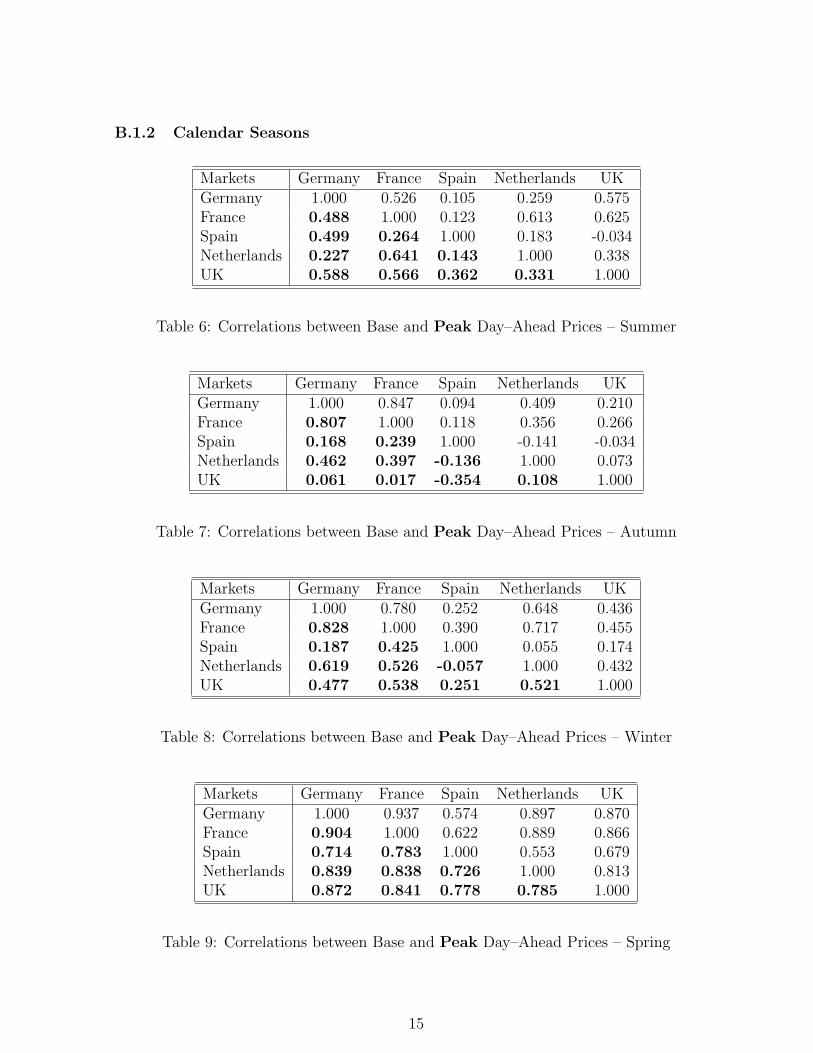
B.1.2 Calendar Seasons
Markets Germany France Spain Netherlands UKGermany 1.000 0.526 0.105 0.259 0.575France 0.488 1.000 0.123 0.613 0.625Spain 0.499 0.264 1.000 0.183 -0.034Netherlands 0.227 0.641 0.143 1.000 0.338UK 0.588 0.566 0.362 0.331 1.000
Table 6: Correlations between Base and Peak Day–Ahead Prices – Summer
Markets Germany France Spain Netherlands UKGermany 1.000 0.847 0.094 0.409 0.210France 0.807 1.000 0.118 0.356 0.266Spain 0.168 0.239 1.000 -0.141 -0.034Netherlands 0.462 0.397 -0.136 1.000 0.073UK 0.061 0.017 -0.354 0.108 1.000
Table 7: Correlations between Base and Peak Day–Ahead Prices – Autumn
Markets Germany France Spain Netherlands UKGermany 1.000 0.780 0.252 0.648 0.436France 0.828 1.000 0.390 0.717 0.455Spain 0.187 0.425 1.000 0.055 0.174Netherlands 0.619 0.526 -0.057 1.000 0.432UK 0.477 0.538 0.251 0.521 1.000
Table 8: Correlations between Base and Peak Day–Ahead Prices – Winter
Markets Germany France Spain Netherlands UKGermany 1.000 0.937 0.574 0.897 0.870France 0.904 1.000 0.622 0.889 0.866Spain 0.714 0.783 1.000 0.553 0.679Netherlands 0.839 0.838 0.726 1.000 0.813UK 0.872 0.841 0.778 0.785 1.000
Table 9: Correlations between Base and Peak Day–Ahead Prices – Spring
15

B.2 Granger’s Causality Tests
B.2.1 Day–Ahead Prices
Hypothesis Obs F-Stat ProbDE – FR 1323 (378) 53.760 (43.177) 0.000 (0.000)FR – DE 5.917 (9.890) 0.000 (2.7E-06)DE – ES 1603 (471) 7.328 (2.370) 7.6E-06 (0.070)ES – DE 2.501 (15.462) 0.041 (1.3E-09)DE – NL 1653 (473) 16.792 (12.228) 1.7E-13 (1.0E-07)NL – DE 2.934 (2.930) 0.020 (0.033)DE – UK 197 (122) 3.053 (8.314) 0.018 (4.7E-05)UK – DE 12.087 (10.085) 9.2E-09 (6.0E-06)FR – ES 1273 (376) 6.176 (3.167) 6.4E-05 (0.024)ES – FR 3.084 (6.877) 0.015 (0.000)FR – NL 1323 (378) 24.718 (27.332) 0.000 (5.4E-16)NL – FR 4.988 (5.176) 0.001 (0.002)FR – UK 161 (247) 3.170 (1.203) 0.016 (0.309)UK – FR 26.602 (65.345) 0.000 (0.000)ES – NL 1603 (471) 2.753 (2.753) 0.027 (0.042)NL – ES 5.529 (0.814) 0.000 (0.486)ES – UK 190 (122) 0.690 (13.448) 0.600 (1.4E-07)UK – ES 2.007 (2.167) 0.095 (0.096)NL – UK 197 (122) 1.477 (2.964) 0.211 (0.035)UK – NL 9.561 (5.267) 4.7E-07 (0.002)
Table 10: Granger’s Causality Tests on Base (Peak) Day–Ahead Prices
16

B.2.2 Yearly Tests on Day–Ahead Prices – Summaries
Figure 5: Base and Peak Spot Market Integrations
17

B.2.3 Seasonal Tests on Day–Ahead
Let us consider calendar seasons, that is Summer (June, July and August), Autumn(September, October and November), Winter (December, January and February) andSpring (March, April and May) to verify if these relationships in spot markets evolve insome way.
Figure 6: Seasonal Base and Peak Spot Market Integrations
18

References
[1] Bachmeier L.J. and Griffin J.M., (2006), Testing for Market Integration Crude Oil,Coal and Natural Gas, The Energy Journal, 27, 2, pp. 55–71.
[2] Bailey E.M. , (1998), The Geographic Expanse of the market for wholesale Electricity,Massachusetts Institute of Technology, http://web.mit.edu/ceepr/www/98003.pdf.
[3] Bessembinder H. and Lemmon M., (2002), Equilibrium pricing and optimal hedgingin equilibrium electricity foward markets, Journal of finance, vol. 57, pp. 1347-1382.
[4] Boisselau F., (2004), The role of Power Exchanges for the Creation of a SingleEuropean Electricity Market: market design and market regulation, Delft UniversityPress
[5] Borenstein S., Bushnell J., Knittel C.R. and Wolfram C., (2004), Inefficiencies andMarket Power in Financial Arbitrage: a study of California’s Electricity Markets,http://www.ucei.berkeley.edu/PDF/csemwp138.pdf.
[6] Boisselau F., (2004), The role of Power Exchanges for the Creation of a SingleEuropean Electricity Market: market design and market regulation, Delft University,summary athttp://www.dauphine.fr/cgemp/Publications/Theses/BoisseleauTheseFr.pdf
[7] Bower J., (2002), Seeking the Single European Electricity Market: Evidence from anEmpirical Analysis of Wholesale Market Prices, Economics Working Paper Archive atWUSTL
[8] Bystrom H., (2001), Estreme value theory and extremely large electricity pricechanges, Technical Report 19, Department of Economics, Lund University, Sweden.Forthcoming in International Review of Economics and Finance
[9] Bunn D.W. (2004), Modelling Prices in Competitive Electricity Markets, Wiley,ISBN13 9780470848609
[10] Bunn D.W. and Karakatsani N., (2005), Diurnal Reversals of Electricity ForwardPremia, Department of Decision Sciences, London Business School, EMG workingpaper,http://www.london.edu/assets/documents/Karakatsani-and-Bunn-ForwardPremium.pdf
19

[11] Chinn M., LeBlanc M. and Coibion O., (2001), The predictive Characteristics of EnergyFutures: Recent Evidence for Crude Oil, Natural Gas and Heating Oil, University ofCalifornia, working paper at http://econ.ucsc.edu/faculty/chinn/energyfutures.pdf
[12] De Vany A. S. and Walls W.D., (1999), Cointegration analysis of spot electricity prices:insights on transmission efficiency in the western US, Energy Economics, 21, pp. 435–448
[13] De Vany A. S. and Walls W.D., (1999), Price Dynamics in a Network of DecentralizedPower Markets, Journal of Regulatory Economics, 15, pp.123–140
[14] European Commission, (2006), Competition - ”Energy Sector Inquiry”, Brussels athttp://ec.europa.eu/comm/competition/sectors/energy/inquiry/index.html
[15] Escribano A., Pena J.I. and Villaplana P., (2002), Modelling electricity prices: internationalevidence, Departamento de Economia, Universidad Carlos III de Madrid, working paper 02-27
[16] Ewing B.T., Malik F. and Ozfidan O. (2002), Volatility Transmission in the Oil andNatural Gas Markets, Energy Economics, 24, pp. 525–538
[17] Fama E.F., (1970), Efficient capital markets: a review of theory and empirical work,Journal of Finance, 23 March, pp. 383–417
[18] Fama E.F., (1986), Detecting Spot Price Forecasts in Futures Prices, The Journal ofBusiness, vol.59, no.2, pp. S39–S54
[19] Fama E.F. and French K.R., (1987), Commodity Futures Prices: some evidence on ForecastPower, Premiums and the Theory of Storage, The Journal of Business, vol.60, no.1, pp. 55–73
[20] Fiorenzani, (2006), Quantitative Methods for Electricity Trading and Risk Management,Palgrave Macmillan, ISBN 1403943575
[21] Fontana F., Gianfreda A. and Reno R., (2006), Does it take volume to moveElectricity Prices?, Dipartimento di Economia Politica, Universita di Siena,http://www.econ-pol.unisi.it/~reno/electricity.pdf
[22] Garcia R.C., Contreras J., Van Akkeren M. and Garcia J.B., (2005), A GARCH forecastingmodel to predict day-ahead electricity prices, IEEE Transactions on Power Systems, vol. 20,no. 2, pp. 867- 874
20

[23] Gianfreda A., (2006), Forward Prices and Premia in European Electricity Markets, PhDThesis, mimeo
[24] Hadsell L. and Shawky H., (2007), One day forward premiums and the impact of virtualbidding on the New York wholesale Electricity Market using Hourly Data, Journal of FuturesMarkets, vol 27, no.11, pp. 1107-1125
[25] Heren, (2003), Methodologies and definitions, The Heren Report, available on line atwww.heren.com
[26] Huisman R., Huurmann C. and Mahieu R., (2006), Hourly electricity prices in day–aheadmarkets, Energy Economics, 29, 2, pp. 240–248
[27] Jerko C. A., Mjelde J.W. and Bessler D. A., (2004), Identifying Dynamic Interactions inthe Western US, in Bunn D. (2004), part III section 9
[28] Karolyi G.A., (1995), A Multivariate Garch Model of International Transmissions ofStock Returns and Volatility: the case of the United States and Canada, Americal StatisticalAssociation, 13, (1), pp.11–25
[29] Knittel C.R. and Roberts M., (2005), An empirical examination of restructured electricityprices, Energy Economics, 27, 5, pp. 791–817
[30] Koekebakker S. and Ollmar F., (2001), Forward curve dynamics in the Nordicelectricity market, Department of Finance and Management Science, NorwegianSchool of Economics and Business Administration, dsiscussion paper 2001/21 athttp://www.nhh.no/for/dp/2001/2101.pdf
[31] Longstaff F.A. and Wang A.W., (2004), Electricity Forward Prices: a High-FrequencyEmpirical Analysis, The Journal of Finance, vol. LIX, no.4, pp. 1877-1900
[32] Lucia J. and Schwartz E., (2002), Electricity prices and power derivatives: evidence fromthe Nordic Power Exchange, Review of Derivatives Research, 5, p.5-50
[33] Movassagh N. and Modjtahedi B., (2005), Bias and Backwardation in Natural Gas FuturesPrices, Journal of Futures Markets, vol.25, no.3, pp. 281–308
[34] Park H., Mjelde J.W. and Bessler D.A., (2006), Price Dynamics among US ElectricitySpot Markets, Energy Economics, 28, pp.81–101
21

[35] Shawky H.A., Marathe A. and Barret C.L., (2003), A first look at the empirical relationbetween spot and futures electricity prices in the United States, Journal of Futures Markets,vol.23, no. 10, pp. 931–955
[36] Silverstovs B., L’Hegaret G., Neumann A. and von Hirschhausen C., (2005), Internationalmarket integration for natural gas? A cointegration analysis of prices in Europe, NorthAmerica and Japan, Energy Economics, 27, pp. 603–615
[37] Walls W.D. (1995), An econometric analysis of the markets for Natural Gas futures, TheEnergy Journal, 71–83
[38] Weron R., (2006), Modeling and Forecasting Electricity Loads and Prices: A StatisticalApproach, Wiley, ISBN: 978-0-470-05753-7
[39] Weron R., Simonsen I. and Wilman P., (2003), Modelling highly volatile and seasonalmarkets: evidence from the Nord Pool electricity market, Economics Working Paper,Washington University
[40] Wilkens S. and Wimschulte J., (2007), The Pricing of Electricity Futures: Evidence fromthe European Energy Exchange, The Journal of Futures Markets, vol.27, issue 4, 387–410
[41] Worthington A., Kay–Spratley A. and Higgis H., (2005), Transmission of prices andprice volatility in Australian electricity spot markets: a multivariate Garch analysis, EnergyEconomics, 27, pp.337–350
[42] Zachmann G., (2007), Electricity wholesale market prices in Europe: Convergence?, EnergyEconomics, doi:10.1016/j.eneco.2007.07.002 (article in press)
22