integration and efficiency in health and social care
TRANSCRIPT

Lessons from the UK and abroad Anne Mason
Senior Research Fellow Centre for Health Economics, University of York, UK
CHESS, Helsinki, 26 November 2015
Integration and efficiency in health and social care

Hitting the headlines…
Real-terms budget cuts of 31% over five years.. hard evidence of crisis…the social care system is starting to give way and the impact is being felt by the NHS
..more than 5,000 patients in England were occupying beds, even though they could have been discharged…
“the most difficult winter for 30 years…There is now clear evidence that the cuts to social care are not only devastating for the lives of vulnerable older people, but are
having a knock-on effect on the NHS.” Heidi Alexander, shadow health secretary

Overview
England’s health & social care systems Evidence - mostly from England
Effects of primary care services on utilization of specialist care
Effects of care home supply on hospital discharge
Financial mechanisms for integrating funds across health & social care
Policy implications Note that these are my personal views
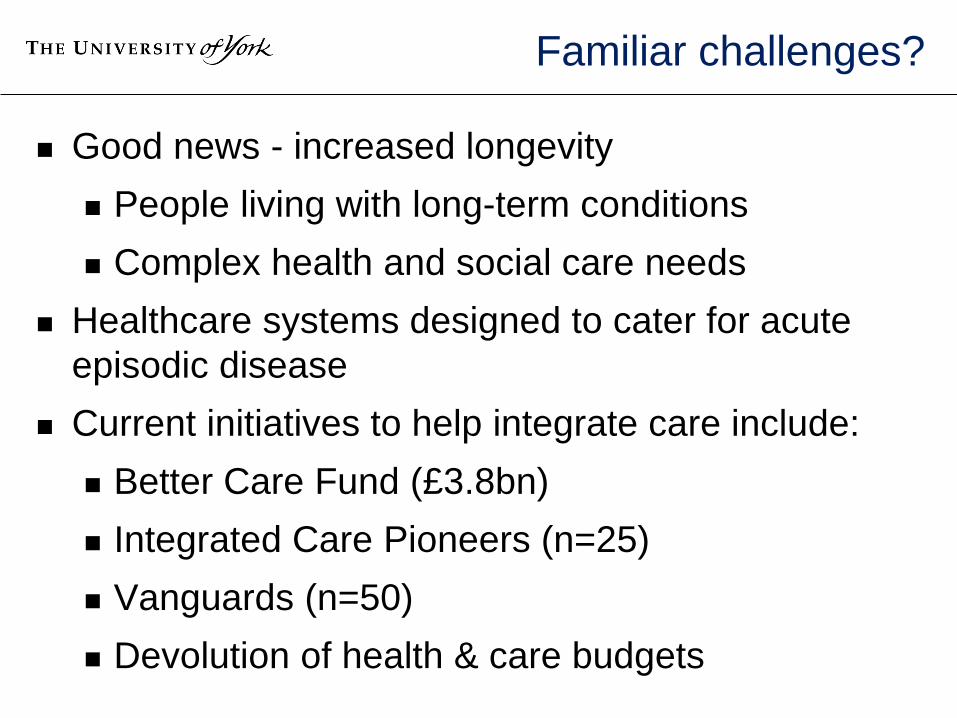
Familiar challenges?
Good news - increased longevity People living with long-term conditions Complex health and social care needs
Healthcare systems designed to cater for acute episodic disease
Current initiatives to help integrate care include: Better Care Fund (£3.8bn) Integrated Care Pioneers (n=25) Vanguards (n=50) Devolution of health & care budgets

England’s health & social care systems
What do we mean by ‘social care’? Support to deal with consequences of cognitive
or physical impairment In England, health and social care systems are
separate and rarely jointly co-ordinated i.e. administration, staff, culture, finances
Integration important if services are interdependent / interrelated e.g. both health and social care needed for
recovery from hip replacement

NHS structure – official view

152 Local Authorities (LAs)
£14bn – adult social care
SOCIAL CARE HEALTH CARE
Informal (unpaid) carers
Local authorities
Voluntary, community and social enterprise (VCSE) organisations
Private providers
NHS Trusts
155 acute 56 mental health 18 community +
others
209 Clinical Commissioning Groups (CCGs)
£70bn – health care
Independent sector
850 For-profit /
not-for-profit organisations
NHS / social care – simpler view
NHS England £102bn
English electorate
8000 GP practices Specialist services Prison services etc.

Partnership working
Health Act 1999 s.31, NHS Act 2006 s.75 Legislative enabling framework ‘Flexibilities’ to support partnership working
between health bodies and health-related LA services E.g. pooled budgets, lead commissioning,
integrated provision £200m investment for partnership working 2015: proposals to extend partnership
arrangements to primary care

Effects of primary care services
Quality and Outcomes Framework (QOF) Covers most chronic conditions amendable to
primary care, but is still partial picture Focuses where capacity to benefit is greatest Regularly updated / revised P4P scheme or complex intervention?
Financial incentives Computerized prompts, decision support Encourages team-based care Reputational effects

Effects of primary care services
One aim of the QOF is to reduce emergency hospital admissions
Emergency admissions for QOF conditions =11% total – so partial solution at best
Annual payments are £1bn = 25% general practice income
What is the evidence on the QOF? Systematic review: 94 studies Selected studies published since this review

Review of QOF – Gillam 2012 Effects Studies Key findings
Effectiveness 47 Better recording, better processes QOF conditions: better intermediate outcomes esp. for diabetes Non-QOF conditions: not improved, worsened in latter years Modest mortality reduction: 11 lives per 100,000 people per year (across all QOF indicators)
Efficiency 5 Limited evidence of lower admission rates and hence costs for some conditions. Cost-effectiveness – only for subset of indicators and ignoring administration costs linked to QOF
Equity 25 Some reduction in inequalities in process of care for deprived Improvements in care for older groups (narrowing gap) Gender disparities persisted or even increased Ethnic variations reduced
Patient experience
7 No changes in communication, nursing care, coordination, or overall satisfaction Continuity of care worse – see usual doctor less often
Professionals and Team Working
6 Improved team working and practice organisation Enhanced role for nurses, increased internal surveillance Regrets loss of relational continuity and patient-centeredness Care more ‘biomedical’ ?

Selected studies on primary care
Study Condition No. GP practices
Years Key findings
Dusheiko et al. (2011a)
Diabetes 8223 2001-2007
Small decrease in emergency admissions
Dusheiko et al. (2011b)
10 chronic conditions
8200-8300
2004 -2007
Small decrease in emergency admissions and OP visits, but only for stroke or composite measure
Dusheiko et al. (2015)
10 chronic conditions
8200-8300
2004 -2007
Small decrease in mortality for stroke or composite measure

Selected studies on primary care
Study Condition No. GP practices
Years Key findings
Harrison 2014
All QOF conditions
6975 1998-2010
Emergency admissions for QOF conditions decreased compared with admissions for non-QOF conditions
Kasteridis et al 2015
Dementia 8034 2006-2010
Small decrease in emergency admissions linked to annual dementia review
Gutacker et al 2015
Serious mental illness
8234 2006-2010
Small increase in psychiatric admissions linked to annual review

Dusheiko 2011b
Effects of primary care for 10 chronic conditions asthma, CHD, CKD, COPD, dementia,
diabetes, hypertension, hypothyroidism, mental health, stroke
Outcomes: admissions, outpatient visits, costs, mortality
Linked data: demographic, hospital, practice, local health authorities
10% sample of national population data i.e. 5 million observations

Dusheiko 2011b
No independent effect for 9 conditions Quality of stroke care improved by 10% on
average between 2004 and 2007 £130m (€185m) lower hospital expenditure on
stroke in 2007 ≈ 5% total annual NHS stroke costs Cost savings mostly due to lower rates of
emergency admissions & outpatient visits ‘Savings’ take no account of QOF payments,
treatment / drug costs, co-ordination costs etc. Finding does not imply reduced lifetime care
costs
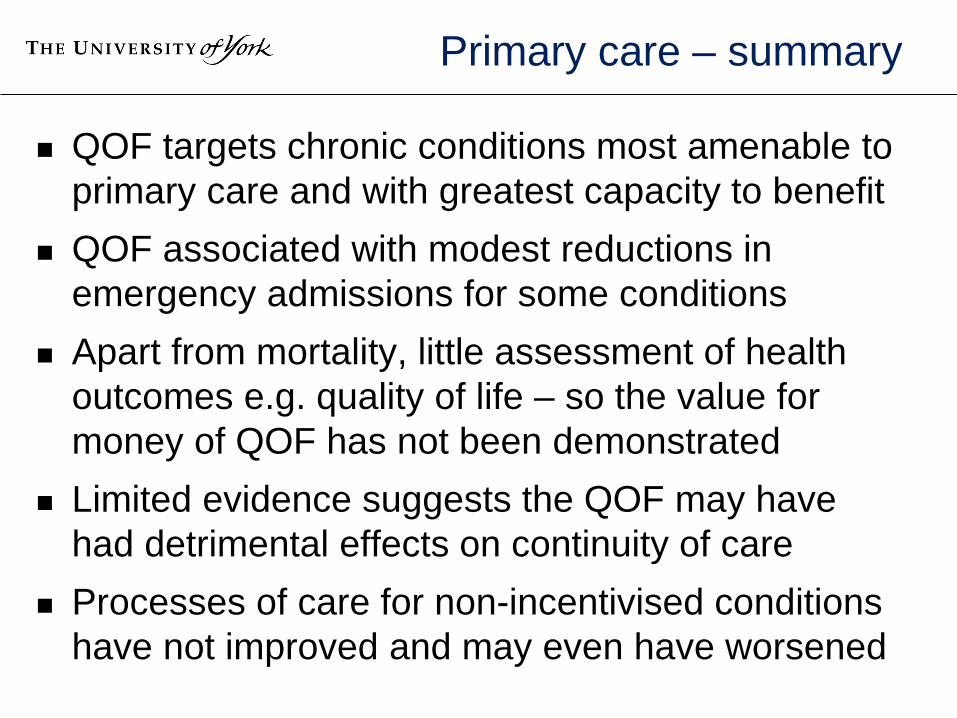
Primary care – summary
QOF targets chronic conditions most amenable to primary care and with greatest capacity to benefit
QOF associated with modest reductions in emergency admissions for some conditions
Apart from mortality, little assessment of health outcomes e.g. quality of life – so the value for money of QOF has not been demonstrated
Limited evidence suggests the QOF may have had detrimental effects on continuity of care
Processes of care for non-incentivised conditions have not improved and may even have worsened

Effects of care home supply
Care homes: residential institutions in the community that provide social and (sometimes) nursing care
Effects: focus is on ‘bed blocking’ = Delayed discharge / delayed transfer of care Patient medically ready to be discharged from
hospital, but appropriate care services unavailable
Potentially inefficient: hospital bed is a more costly substitute for a care home bed / home care

Delayed Discharges Act 2003
Community Care (Delayed Discharges) Act 2003 Reimbursement (cross charging) for delays in
discharging patients from hospital where local authorities are responsible
Monthly census day for all hospitals Number of patients delayed that month Total number days delayed per month Reason for delay: NHS / social services / both
NHS plan (2000): £900m investment in community-based health and social care services
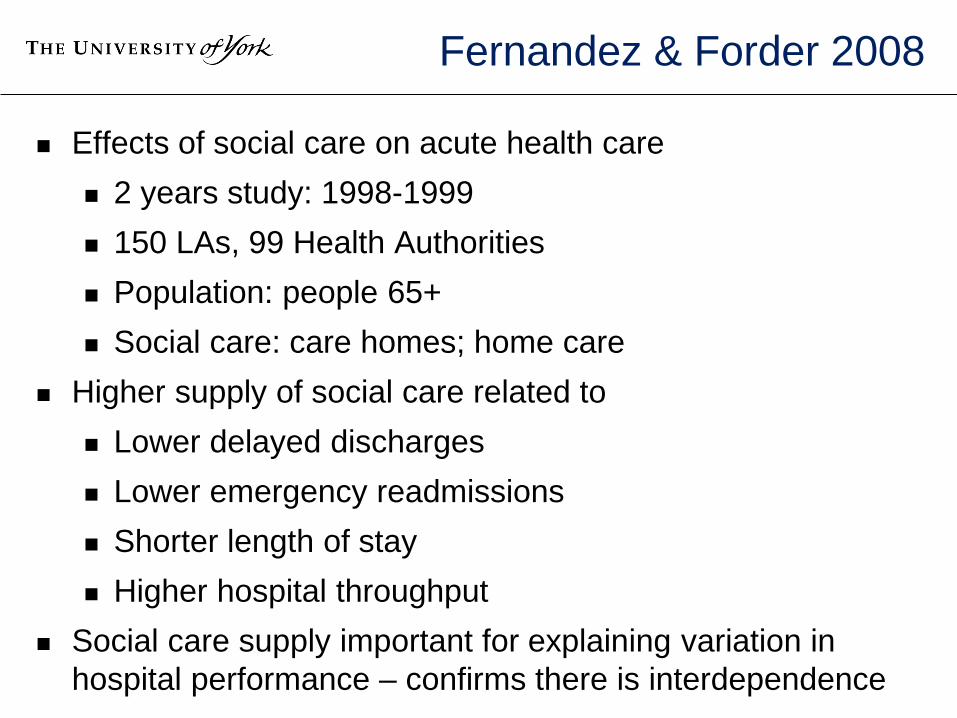
Fernandez & Forder 2008
Effects of social care on acute health care 2 years study: 1998-1999 150 LAs, 99 Health Authorities Population: people 65+ Social care: care homes; home care
Higher supply of social care related to Lower delayed discharges Lower emergency readmissions Shorter length of stay Higher hospital throughput
Social care supply important for explaining variation in hospital performance – confirms there is interdependence

Forder 2009
Impact of long-term care on hospitals 1 year study: 2004/5 7640 electoral wards, 247 NHS trusts,
‘numerous’ care homes Population: people 75+
Return on investment: £1 invested in care homes associated with
£0.35 less in hospitals – and vice versa Efficiency depends on net change in outcomes
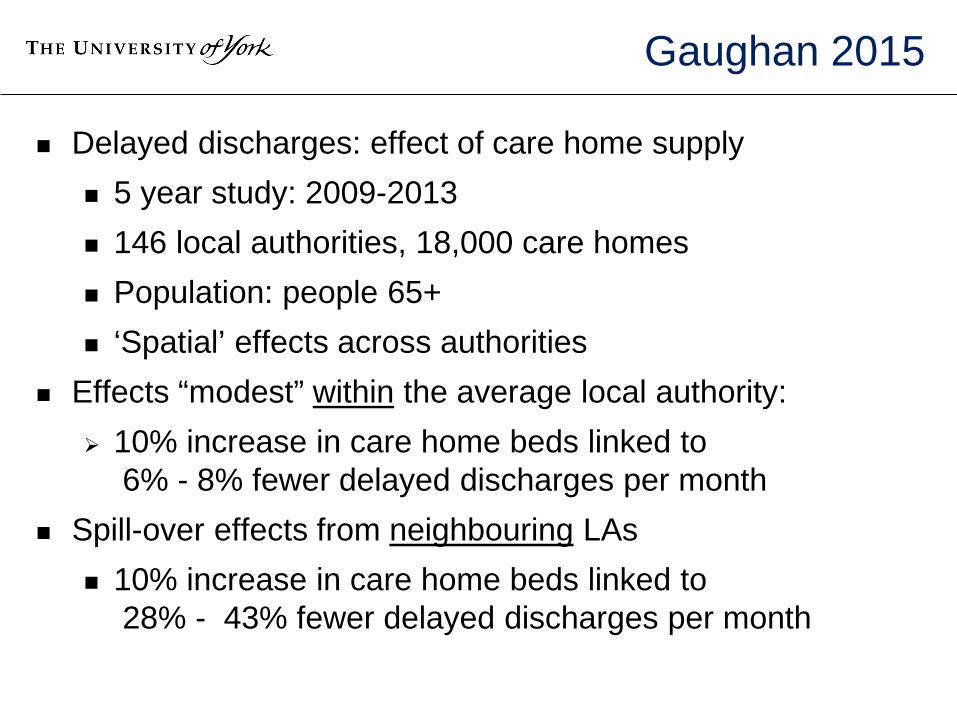
Gaughan 2015
Delayed discharges: effect of care home supply 5 year study: 2009-2013 146 local authorities, 18,000 care homes Population: people 65+ ‘Spatial’ effects across authorities
Effects “modest” within the average local authority: 10% increase in care home beds linked to
6% - 8% fewer delayed discharges per month Spill-over effects from neighbouring LAs
10% increase in care home beds linked to 28% - 43% fewer delayed discharges per month

Care homes - summary
Increase in supply of care home beds linked to small reduction in delayed discharges Unlikely to be cost reducing Cost effectiveness unclear
Not assessed health outcomes / QoL
Wider system effects Change in readmissions, LoS, throughput Need to consider cross-boundary impacts
What happens in one area has knock-on effects for its neighbours – and vice versa

Integrating H&SC funds
Mason et al, 2015: systematic review of the international literature
Funded by a grant from the English Department of Health to the Policy Research Unit in the Economics of Social and Health Care (ESHCRU)
Financial mechanisms for integrating resources across health and social care
Evidence of effectiveness or cost-effectiveness and barriers to their use

Methods
8 databases, websites, bibliographies Inclusion criteria
H&SC funding streams Empirical evaluation English language Adults
Exclusion criteria Studies from low-income countries Personal budgets
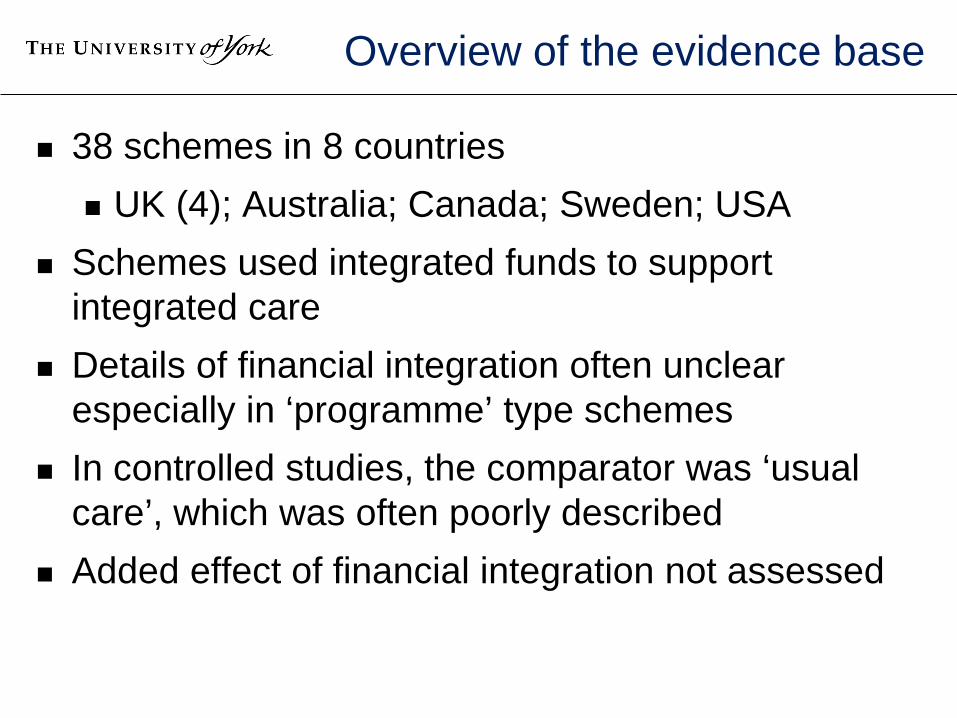
Overview of the evidence base
38 schemes in 8 countries UK (4); Australia; Canada; Sweden; USA
Schemes used integrated funds to support integrated care
Details of financial integration often unclear especially in ‘programme’ type schemes
In controlled studies, the comparator was ‘usual care’, which was often poorly described
Added effect of financial integration not assessed

Study designs
0%
10%
20%
30%
40%
50%
60%
70%
80%
90%
100%
Randomisedcontrolled trials
Quasi-experimental(non-randomised
controls)
Analysis ofroutine data
Mixed methods(within a single
study)
Qualitative Uncontrolled
Kaavion otsikko All schemes (N=38)
English schemes (N=13)
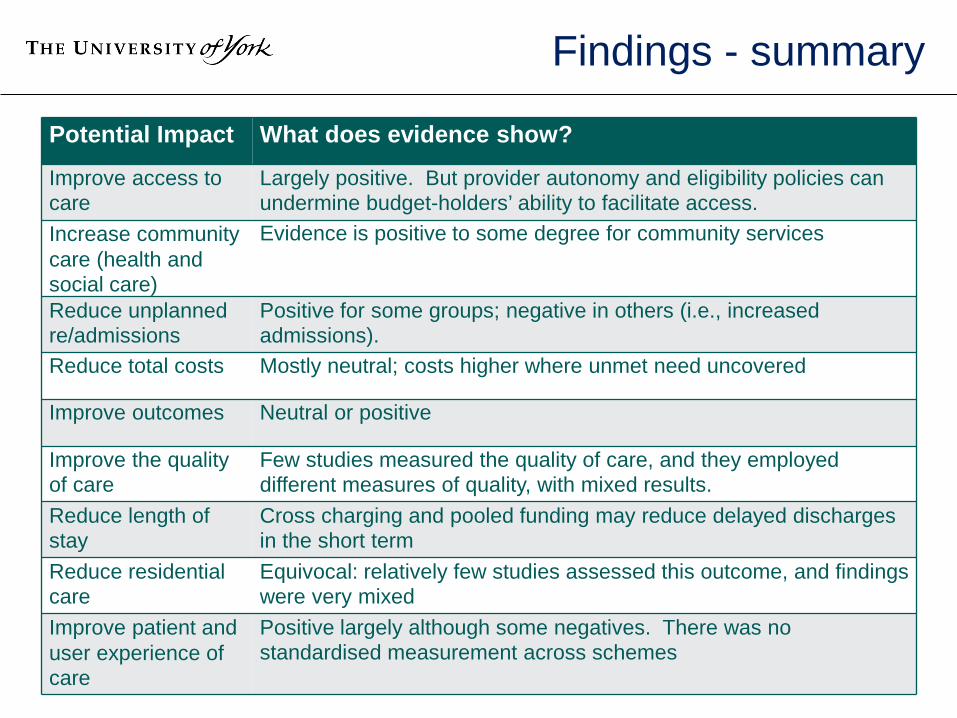
Findings - summary
Potential Impact What does evidence show?
Improve access to care
Largely positive. But provider autonomy and eligibility policies can undermine budget-holders’ ability to facilitate access.
Increase community care (health and social care)
Evidence is positive to some degree for community services
Reduce unplanned re/admissions
Positive for some groups; negative in others (i.e., increased admissions).
Reduce total costs Mostly neutral; costs higher where unmet need uncovered
Improve outcomes Neutral or positive
Improve the quality of care
Few studies measured the quality of care, and they employed different measures of quality, with mixed results.
Reduce length of stay
Cross charging and pooled funding may reduce delayed discharges in the short term
Reduce residential care
Equivocal: relatively few studies assessed this outcome, and findings were very mixed
Improve patient and user experience of care
Positive largely although some negatives. There was no standardised measurement across schemes

Australian Coordinated Care Trials
CCT1 – round 1 CCT2 – round 2 Years 1997-1999
2002-2005
Funding for coordination
AUS$120m
AUS$33m
No. trials 13 trials (9+4) 5 trials (2+3) Aims Improve health / wellbeing;
Cost neutral Improve outcomes Improve service efficiency
Components • Comprehensive assessment
• Care plan • 3 models of primary care
1. GP coordinator 2. GP coordinator +
service coordinator 3. non-GP coordinator
• Financial integration
Same as for CCT1 + risk-based capitation model

Barriers – Australian CCT1
GPs solely responsible for service substitution, but had no control over admissions or discharges
GPs did not receive information on pooled expenditure and were not liable for overspend
Some services identified in the written care plan were accessible only if clients met pre-existing eligibility criteria …so money did not follow the patient…

Australian CCT2
Team Care Health II: 2 year RCT, 12m intervention Population: 50+ with chronic and complex conditions
Cardiovascular, musculoskeletal, endocrine / metabolic, psychological, respiratory
2720 patients randomised 2 : 1 Integrated management with pooled funds
Model 2: GP care coordinator + service coordinator AUS$ 21.5m pooled funds + $2.6m for care
coordination ≈ $8000 per person Risk-based capitation budget ≈ cost of usual care

Effects – Team Care Health II
Intervention participants had significantly better general health, less depression, higher quality of life
Some service substitution achieved - less inpatient care, more primary care
Intervention participants had significantly higher total costs
“Had the trial progressed for longer, evidence suggests that it would have been at least cost neutral in achieving these outcomes, even after incorporating the cost of care coordination…”

Barriers – Australian CCT2
GPs agreed that unless the financial reimbursement system was simplified and co-ordinator support was continued, care planning …would be unlikely to occur in future
“While flexible funding arrangements were
pursued by all trials neither of the mainstream trials achieved a true pooling of funds…”

Integrated funding - summary
Few schemes improved health outcomes and fewer still reported cost savings
Some succeeded in improving access to care, and shifting care into the community
Despite substantial resourcing, the Australian coordinated care trials did not succeed in delivering improved outcomes within ‘usual care’ budgets
But there were signs that cost neutrality could have been achieved in the longer term – had the trials continued
Integrating finances is difficult; it is likely to require legal, institutional and cultural changes

Policy implications - 1
Better quality primary care for people with LTCs can reduce emergency hospital admissions Care can be shifted closer to home
Increasing the supply of care home beds can reduce delayed hospital discharges, free up beds and so increase hospital throughput If vacated beds are filled by other patients, total
costs are likely to rise, not fall Integrating finances is difficult; but integrating
care within and across different professional groups may be even more difficult!

Policy implications - 2
No ‘magic bullet’ for improving care for people with chronic / complex care needs
Benefits of integration are rarely assessed; so its cost-effectiveness is unknown
Does integrated care resonate with our core values – is it worth doing in its own right?
Look for health and social care interdependencies – focus efforts here
Beware / be aware of wider system effects / unintended consequences
Expectations need to be realistic

References Dusheiko, M et al. 2011a. Does Higher Quality of Diabetes Management in Family Practice
reduce Unplanned Hospital Admissions? Health Services Research 46: 27–46. Dusheiko, M et al. 2011b. Does better disease management in primary care reduce hospital
costs? Evidence from English primary care. Journal of Health Economics 30: 919–32 Dusheiko, M et al 2015. Quality of disease management and risk of mortality in English
primary care practices. Health Services Research;doi:10.1111/1475-6773.12283 Fernandez JL & Forder J. 2008. Consequences of local variations in social care on the
performance of the acute health care sector. Applied Economics;40(10-12):1503-18 Forder J. 2009. Long-term care and hospital utilisation by older people: an analysis of
substitution rates. Health Econ. 18(11): 1322-1338 Gaughan J et al 2015: Testing the bed-blocking hypothesis: does nursing and care home
supply reduce delayed hospital discharges? Health Econ. 24 (S1): 32-44 Gillam SJ et al. 2012. Pay-for-performance in the United Kingdom: impact of the quality and
outcomes framework: a systematic review. Ann Fam Med;10(5):461-8. Gutacker N et al. 2015. Does the quality and outcomes framework reduce psychiatric
admissions in people with serious mental illness? A regression analysis. BMJ Open; 5(4):e007342
Kasteridis P et al. 2015. The influence of primary care quality on hospital admissions for people with dementia in England: a regression analysis. PLoS One.10(3): e0121506
Mason A et al. 2015. Integrating funds for health and social care: an evidence review. JHSR&P. 20(3):177-188.

Any questions?