integration and concentration of european air …
TRANSCRIPT

204
Mantecchini L. et al. Integration and Concentration of European Air Transport Market
INTEGRATION AND CONCENTRATION OF EUROPEAN AIR TRANSPORT MARKET
Luca Mantecchini1, Nicola Gualandi2, Filippo Paganelli3
1, 2, 3 DICAM – Transportation, Faculty of Engineering, University of Bologna, Italy
Received 12 November 2012; accepted 22 March 2013
Abstract: During the last years air transport stakeholder’s behaviors have witnessed deep modifications. Airlines competition has been exacerbated by economic downturns, while airport competition emerged as a result of the less governmental intervention in airport investments. The first result of this process is a mix-model adopted by EU airlines in the domestic market, which implies that network airlines have adopted few of the strategies that have guaranteed the establishment of the low fares carriers, while low cost carriers have been continuously increasing the number of major airport served. The volatility of the air transport deregulated market has been analysed in the scientific literature and these aspects can be perceived as further evidences of the increased volatility. In order to limit the negative effects of volatility in the EU market, air transport players have been sought manners to enhance stability. Airlines mergers or acquisitions, buyout of airport operator’s shares by airlines, airport-airline partnership for ad-hoc infrastructure development or buyout of airport’s shares by other airport operators are examples of this will for a greater stability of the system. This paper analyses all these aspects highlighting the pursuing of greater stability by the fragile EU air transport system.
Keywords: air transport, deregulation, market concentration, volatility.
1 Corresponding author: [email protected]
1. Introduction and Evolution of Air Carrier’s Strategies
The demand for air traffic has always been growing very fast if compared with the demand for other transportation systems. Airline demand depends strongly on both endogenous an exogenous factors like wars, terrorism, fuel prices and economic scenarios. A growth in GWP results in more attitude towards economic exchanges and business travels; moreover the improved economic conditions have a favourable impact on the number of leisure trips.
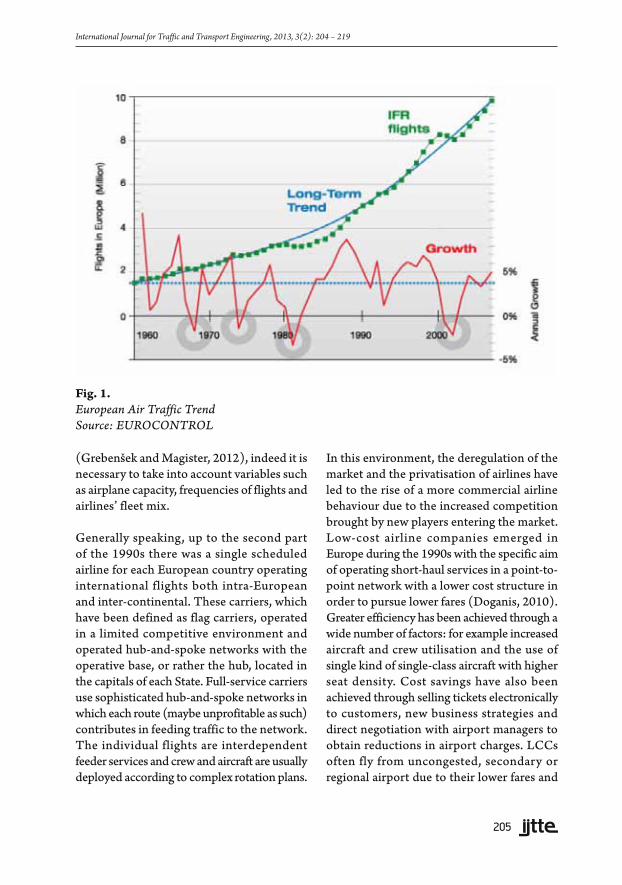
From the analysis of Fig. 1, it is possible to detect the impacts on air traffic demand of
the oil crises in the 1970s and 1980s and of the terroristic attack of Al Qaeda in New York on 11th September 2001.
It has been demonstrated that air traffic concentration and airports accessibility are simple indicators to analyse the main trends in the air traffic industry. In this paper, the attention is focused on the number of movements (i.e. take-offs or landings) and on the number of destinations attainable from a sample of airports in five EU countries to analyse the level of congestion at these airports. It is not necessarily true that a high number of passenger handled results in high number of movements and, therefore, in airport congestion
UDC: 656.7:339.43(4) DOI: http://dx.doi.org/10.7708/ijtte.2013.3(2).08
205
(Grebenšek and Magister, 2012), indeed it is necessary to take into account variables such as airplane capacity, frequencies of flights and airlines’ fleet mix.
Generally speaking, up to the second part of the 1990s there was a single scheduled airline for each European country operating international flights both intra-European and inter-continental. These carriers, which have been defined as flag carriers, operated in a limited competitive environment and operated hub-and-spoke networks with the operative base, or rather the hub, located in the capitals of each State. Full-service carriers use sophisticated hub-and-spoke networks in which each route (maybe unprofitable as such) contributes in feeding traffic to the network. The individual flights are interdependent feeder services and crew and aircraft are usually deployed according to complex rotation plans.
In this environment, the deregulation of the market and the privatisation of airlines have led to the rise of a more commercial airline behaviour due to the increased competition brought by new players entering the market. Low-cost airline companies emerged in Europe during the 1990s with the specific aim of operating short-haul services in a point-to-point network with a lower cost structure in order to pursue lower fares (Doganis, 2010). Greater efficiency has been achieved through a wide number of factors: for example increased aircraft and crew utilisation and the use of single kind of single-class aircraft with higher seat density. Cost savings have also been achieved through selling tickets electronically to customers, new business strategies and direct negotiation with airport managers to obtain reductions in airport charges. LCCs often fly from uncongested, secondary or regional airport due to their lower fares and
International Journal for Traffic and Transport Engineering, 2013, 3(2): 204 – 219
Fig. 1. European Air Traffic Trend Source: EUROCONTROL
206
the possibility to have shorter turn-around times. LCC place different demands on airport facilities than traditional carriers: They don’t need business lounges or high levels of service of terminal facilities (check-in, baggage services and security checks); moreover they would like to obtain parking stands adjacent to the terminal to avoid the use of air bridges or fingers. The development of low-cost carriers during the last decade had a dramatic effect on the European airline market. Low-cost carriers are expected to grow their market share in short-haul services up to 25-35% (Francis et al., 2004). Low-cost carriers maintain relationship with their base airport, stationing there planes in night stop, personnel and supporting services; thus establishing a connection lightly similar to that existing between hub and dominant scheduled airline.
Recently a convergence of the two business model has been observed. Ex flag carriers have undergone deeply reorganization processes in order to reduce the cost base, to be more competitive on the market and to offer lower fares in the liberalized market, while low cost carriers have increased the service quality standards or tend to adopt simple hubbing models (i.e. Aer Lingus, Air Berlin or Germanwings).
Ex flag carriers, in order to increase their market share, have enhanced the practice of airline alliances, because they are intent on increasing the number of passengers (Iatrou and Alamdari, 2005). Two definitive characteristics of strategic alliances are exclusive memberships and a joint marketing entity (IATA). Airline alliances should be fostered by different factors, such as increased globalisation in air transport, increasing interaction, economic incentives for airline consolidation, liberalisation and anti-trust
concerns. Many authors have studied the economic implication of airline consolidation; the findings show that total costs increase 20% slower than the total traffic generated by the merged airlines. Airline alliances take many forms and not only generate various benefits and risks to the members but also to other stakeholders such as passengers, communities and travel agencies. The alliances could result in new route options, extension of frequent flyers program (Fan et al., 2001) and common reservation systems and creation of new market shares. On the other hand, there could be a potential tendency for reduced both competition and level of services and higher fares. Historically alliances have been most evident in international aviation where the governments offered the airlines antitrust immunity for transoceanic alliances – for example the open skies agreements between US and European countries – that allows the partners to discuss schedules, fares and frequency of flights (Ash, 2002).
Direct acquisition can be both in the form of a 100% ownership or in the form of a major shareholding (> 50%). Direct acquisition is less viable nowadays both for the huge amount of money implied and for legal restriction to foreign ownership posed by some countries (U.S. legislation provides a ceiling to foreign carriers owning a stake in US carriers).
Airline demand depends strongly on both endogenous and exogenous factors like wars, terrorism, fuel prices and economic scenarios. A growth in GWP results in more attitude towards economic exchanges and business travels; moreover the improved economic conditions have a favourable impact on the number of leisure trips. Some example of merging and alliances between scheduled carriers at European level are:
Mantecchini L. et al. Integration and Concentration of European Air Transport Market

207
• Air France-KLM (May 2004); 18% of shares are owned by French government, the rest has been privatized. After the merging, AF-KL registered a +10% in revenues, +5.5% in passengers carried and +1% in load factor (Air France-KLM, full year results 2005-06),
• Lufthansa; totally privatized. It owns now Swiss Airlines, Austrian Airlines, Germanwings and Brussels Airlines,
• British Airways is due to merge with Iberia in a new entity named International Airlines Group. “The merged company will provide customers with a larger combined network. It will also have greater potential for further growth by optimizing the dual hubs of London Heathrow and Madrid” (W. Walsh, BA CEO). Both airlines will retain their current operations and individual brands. The combined fleet will total 408 aircraft operating to 200 destinations and carrying more than 58 million passengers per year. The definitive agreement is conditional on regulatory approval from the relevant competition authorities including the European Commission and approval by both BA and IB shareholders. BA and IB added that they have received regulatory confirmation from UK and Spanish civil aviation authorities to ensure that the ownership and governance structure of both companies would permit retention of existing national route licenses and traffic rights.
• Merging between Alitalia and Airone and selling of 25% of shares fo Air France – KLM.
Currently there are four main global alliances: Wings, Star Alliance, Oneworld and SkyTeam. Consolidation seems to have started also in the low-cost market: Easyjet purchased his competitor airline GO and Ryanair took over
Buzz in February 2003 and tried twice to do the same with Aer Lingus (Francis et al., 2004) but in both the cases the acquisition has been thwarted because judged as potentially restrictive of the concurrence. Other possible forms of cooperation between airlines exist in addition to the merging, the acquisitions and alliances, but they are characterised by a more operative connotation. These forms of cooperation are the code-sharing agreements and the franchising.
Code sharing is an aviation agreement between two or more airlines; a seat can be purchased on one airline as if actually operated by a cooperating airline under a different flight number or code. It allows greater access to cities through a given airline’s network without having to offer extra flights, and makes connections simpler by allowing single bookings across multiple planes. Under a code sharing agreement, the airline that actually operates the flight is called the operating carrier. The company or companies that sell tickets for that flight but do not actually operate it are called validating carriers. A further advantage to passengers is shared responsibility between the carriers. If the flights are not code shared, then the second airline has no responsibility if the passenger or luggage misses the second flight due to a delay with the first. Criticism has been levelled against code sharing by consumer organizations and national departments of trade since it is claimed it is confusing and not transparent to passengers.
Franchising consists of an airline flying with the colours of another airline, maintaining independence apart from the obligation to provide the franchiser’s level of standards. The advantage for franchisees is that they are given access to logo, products and service standards of the franchiser. Franchiser’s
International Journal for Traffic and Transport Engineering, 2013, 3(2): 204 – 219
208
advantage lays in the possibility to quickly expand its network without devoting too many resources. Franchising is especially used in smaller markets, for example the domestic market to provide feeder services to a scheduled carrier’s hub. It also includes taking franchiser’s flight code, ground handling, selling, revenue accounts, computer systems and services, and the frequent flyer package. For example, British Airways has franchising agreements with Gatwick based City Flyer Express and Scottish carrier Loganair, which operate as British Airways Express and Maersk, which operates from Birmingham as British Airways and Manx Airlines. A form of franchising technically called “wet lease” consists in franchisee’s aircraft and crew with franchisers’ liveries and uniforms. The last tendency in airline market is forward integration, namely the airline gains control on the distributors (tour operator, travel agencies and car rental services).
2. Evolution of Airport’s Strategies
The traditional view of most airports acting as natural monopolies is increasingly being questioned because of the improved forces of competition which have occurred after the airline liberalization and airport commercialization (Graham, 2004). Airports have traditionally considered the airlines as their main customers as they have legal agreements and pay the aeronautical charges (landing fees, charge per passenger / ton. of freight, use of air bridges, air-traffic control, aircraft parking, etc.). The deregulation of the aviation industry led to more aggressive market strategies adopted by airports (Tretheway and Kincaid, 2005). In fact, until mid-1990s, little had been done by airport operators to draw revenues from airline passengers. From the introduction of this new commercial business model onwards, airports placed more emphasis on non-aeronautical revenues such
as concessions, rents, catering, car parking. The improved financial performance could allow airport operators to reduce aviation user charges to airlines and passengers (Oum and Fu, 2008), further gaining in attractiveness. Nowadays, non-aeronautical revenues represent approximately 50% of all income of European airports (Graham, 2008). Examples of competition between airports consist in shared markets between close airports, connecting traffic and non-aeronautical services. Growing attention should be given to the project and use of terminal infrastructures, passenger facilities, incentive pricing and service provision. For example, many airports decided to focus their attention on passenger facilities by increasing the number and the mix of retail operators and caterers, expanding the space allocated to commercial also dealing with the expectations of the passengers and of the other stakeholders (discounts, loyalty cards, duty free sales, economic support to the improvements to achieve better surface access to the airport, developing shopping or leisure facilities also for nearby residents such as conference halls, offices, etc.). Privatization also enabled airports to buy other airports: that is horizontal integration. BAA-Ferrovial in UK, Fraport in Germany, Schipol in Netherlands nowadays are operating more than one single airport; doing so they introduce their brand and know-how in new market areas. For example, BAA-Ferrovial owns four English airports, Cerro Moreno Antofagasta Airport in Chile and 65% of Naples’s airport. There are issues, however, whether different close airport should be operated as individual entities or as a group. Cooperation and coordination may improve customer services and the operational efficiency of the airports, but it is also likely to reduce competition between both airports and airlines. Another method of strategic development which doesn’t imply the transfer of control and ownership is alliances, meaning shared
Mantecchini L. et al. Integration and Concentration of European Air Transport Market
209
International Journal for Traffic and Transport Engineering, 2013, 3(2): 204 – 219
knowledge, market support, quicker exchange of information, joint actions for international projects (Graham, 2004).
Airport managers need to reconsider their business strategies to deal with low-cost airlines that propose a reduction in the amount they pay to use airport facilities as a prerequisite to start operations. At medium sized airports, for example, low-cost airlines could be attracted to use the spare capacity at under-utilized existing infrastructure but there is the danger that they would act as substitute for the scheduled airlines resulting in an economic loss to the airport operator. A feasible strategy should be providing unbundled services and offering a differentiated product (e.g. converting old structures into low-cost terminal facilities with lower fares per passenger carried) to different airline types as it has been done in some cases (Marseille, Geneva, etc.).
3. Vertical Integration Airport-Airline
The characteristics of airport’s development strategies strongly depend on airlines’ decision to operate services; for example low-cost airlines have forced airport revenues down thanks to their bargaining position during the negotiation with airport managers: LCC can decide to fly elsewhere unless discounts in charges or commercial incentives are not granted by the airport (Doganis, 2010; Graham, 2008). It has become clear that economic advantages may be obtained if airports and airlines work together jointing the forces: “...closer cooperation will be increasingly necessary for the simple reason that if customers don’t have a good perception of the situation, it will obviously impact on the image of both partners...” ( J.C. Spinetta, CEO Air France, 2005). Large airports are in a better negotiating position than smaller airports, as size indicates a large catchment area. The same happens for large
airlines that can almost dictate the conditions towards regional airports. The majority of relationships involve hub airports and its hub carrier, but alternative combinations are also reliable (for example, hub carrier and regional airport). In the aviation context there are various forms of specific investments on both sides: airports may adapt their infrastructure to carriers’ needs and, on the other hand, airlines can consider their airport choice when making strategic decisions. The longer the duration of the relationship, the more likely it become that each party will show each other commitment through long-term contracts, shared performance measure indexes and trust (Goetsch and Albers, 2007). In fact, there are benefits for both airports and airlines from entering into long-term relationships: airports can obtain financial support and secure business volume, on the other and airlines can secure key airport facilities on favorable terms; this provides incentives for the airport and the dominant carrier to strike exclusive deals (Oum and Fu, 2008).
Vertical relationship between airport and airline may happen in these scenarios: privatization of hub airport (Lufthansa now holds 9% of shares in Frankfurt airport, thus being able to influence strategic and investment’s decisions and to have control on airport’s cost development policy), terminal expansion at hub airport (terminal 2 at Munich airport was built and operated by a joint company of Lufthansa and Munich airport; Lh wanted a feasible terminal layout to support his double-hub and spoke operations and T2 was also intended to become a premium facility for Star alliance members’ passengers) or terminal expansion at a base airport (the low cost carrier commits itself to grant the airport a certain amount of passengers versus lease or rearrangement of airport’s structures). The weak point of vertical integration consists in the potential rise to
210
anticompetitive practices aimed at displacing competing airlines such as diminution of quality of service, potential discrimination, increasing charges, cross-subsidies between airport and airline. This could happen if the airport operator is allowed to control somehow at least one airline. Therefore international experience suggests that airport concessions should impose vertical separation between the airport and the airline (Serebrisky, 2003).
Airport management have to evaluate both the volatility of low-cost market and the growth expectations before concluding airport-airline agreements: long term agreements and investments in infrastructure to accommodate low-cost airlines must be assessed regarding the degree of risk that services may be withdrawn (Francis et al., 2004). Airport management should be also aware of the necessity of equity issues between traditional and low cost carriers as the social and economic status of a region may be harmed if scheduled services are withdrawn. The volatility of traffic at an airport is defined as a percentage change around the long term, according to the following formula (Eq. (1)):
100 tra�c tra�c
tra�c
actual trendVolatility
trend−
= ⋅ (1)
Traffic is much more volatile both at secondary airports and in a deregulated environment than under strict regulation; the regulation cap prevents airlines from rapidly changing their routes, fares or frequency of service.
4. Analysis of Airport Concentration and Accessibility
The value of a national air network concentration gives information on the air traffic distribution among the different airports: a low value of concentration means that the
air traffic is equally distributed between airports while the opposite suggests that the air traffic is gathered at a few airports. The former situation is typical of point to point network while the latter, in association with temporal coordination, is typical of a hub and spoke network.
In this paper, the attention is focused on the concentration at some European airports, evaluated with the help of the Gini coefficient. Given n observations of the variable X, if:
.,...,11 niXX ii =∀≤−
niXCi
jji ,...1
1
=∀= ∑=
nC
Xn
nn
ii == ∑
=1
1µ
nini
pi ,...,1=∀=
niCC
qn
ii ,...,1=∀=
The Gini Coefficient (R) is given by the following formula (Eq. (2)):
( )1
11
1
n
i ii
n
ii
p qR
p
−
=−
=
−=∑
∑
(2)
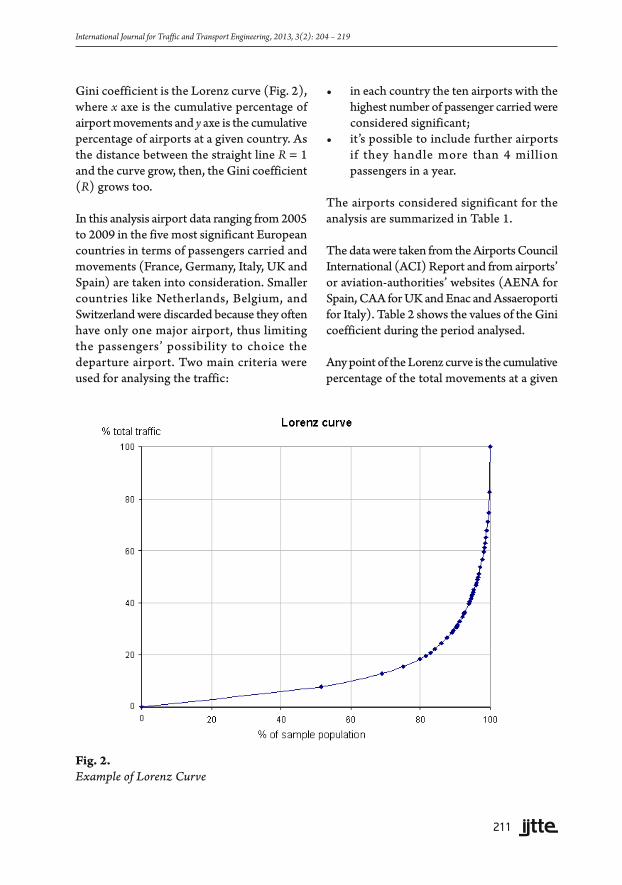
The Gini concentration index ranges between 0 and 1. If all takeoffs and landings were concentrated on a single airport, R would be equal to 1; if they were equally distributed between the airports, R would be equal to 0. A useful graphic representation of the
Mantecchini L. et al. Integration and Concentration of European Air Transport Market
211
Gini coefficient is the Lorenz curve (Fig. 2), where x axe is the cumulative percentage of airport movements and y axe is the cumulative percentage of airports at a given country. As the distance between the straight line R = 1 and the curve grow, then, the Gini coefficient (R) grows too.
In this analysis airport data ranging from 2005 to 2009 in the five most significant European countries in terms of passengers carried and movements (France, Germany, Italy, UK and Spain) are taken into consideration. Smaller countries like Netherlands, Belgium, and Switzerland were discarded because they often have only one major airport, thus limiting the passengers’ possibility to choice the departure airport. Two main criteria were used for analysing the traffic:
• in each country the ten airports with the highest number of passenger carried were considered significant;
• it’s possible to include further airports if they handle more than 4 million passengers in a year.
The airports considered significant for the analysis are summarized in Table 1.
The data were taken from the Airports Council International (ACI) Report and from airports’ or aviation-authorities’ websites (AENA for Spain, CAA for UK and Enac and Assaeroporti for Italy). Table 2 shows the values of the Gini coefficient during the period analysed.
Any point of the Lorenz curve is the cumulative percentage of the total movements at a given
International Journal for Traffic and Transport Engineering, 2013, 3(2): 204 – 219
Fig. 2. Example of Lorenz Curve

212
Table 1 Sample of Airports Considered in this Study
France Germany Italy UK Spain
Bordeaux Berlin Schoenefeld Bologna Belfast International Alicante
Lyon Berlin Tegel Catania Birmingham Barcelona
Marseille Cologne/Bonn Milan Linate Bristol Bilbao
Nantes Düsseldorf Bergamo/Orio al Serio Edinburgh Fuerteventura
Nice Frankfurt Milan-Malpensa Glasgow Girona
Paris Beauvais Hahn Naples Liverpool Gran Canaria
Paris Orly Hamburg Palermo London Gatwick Ibiza
Paris Roissy Hanover Rome-Ciampino London Heathrow Lanzarote
Strasbourg Munich Rome-Fiumicino London Luton Madrid
Toulouse Nuremberg Venice London Stansted Malaga
Stuttgart Manchester Palma de Mallorca
Newcastle SevillaNottingham East Midlands Tenerife North
Tenerife South
Valencia
Table 2 Gini Coefficient (2005-2009) for Each Country
2005 2006 2007 2008 2009
France 0,506 0,511 0,506 0,511 -
Germany 0,407 0,403 0,403 0,407 0,409
Italy 0,404 0,401 0,394 0,398 0,384
UK 0,399 0,392 0,399 0,397 -
Spain 0,456 0,455 0,454 0,440 0,452
number of airports considered. As could be derived from Table 2, France is the European country with the highest value of the Gini coefficient. The Lorenz curve may have a dualistic interpretation: when the variable X grows, it is possible to get the percentage of movements handled by small-medium sized airports; a reduction in the X variable gives information on the movements’ percentage handled by the biggest country airports. Fig. 3
shows the Lorenz curve for France in 2008: it shows that the 80% of the total movements is handled by the 40% of the French airports, while the remaining 20% of airports (notably the two biggest French airports, Paris Roissy and Orly) handles the 60% of movements. This is why the concentration value is quite elevated.
Spain has the second highest value of the Gini coefficient. The three biggest airports in the
Mantecchini L. et al. Integration and Concentration of European Air Transport Market

213
International Journal for Traffic and Transport Engineering, 2013, 3(2): 204 – 219
0
0,1
0,2
0,3
0,4
0,5
0,6
0,7
0,8
0,9
1
0 0,1 0,2 0,3 0,4 0,5 0,6 0,7 0,8 0,9 1
Cumulative % of passenger
Cum
ulat
ive
% o
f airp
orts
Fig. 3. Lorenz Curve for France (2008)
0
0,1
0,2
0,3
0,4
0,5
0,6
0,7
0,8
0,9
1
0 0,1 0,2 0,3 0,4 0,5 0,6 0,7 0,8 0,9 1
Cumulative % of passenger
Cum
ulat
ive
% o
f airp
orts
Fig. 4. Lorenz Curve for Spain (2009)
country (Madrid, Barcelona and Palma de Mallorca) alone, handle almost the 60% of the total movements in 2009 (Fig. 4).
Going further to Germany, it is possible to note that the distance between the straight line R = 1
and the Lorenz curve diminishes, so does the value of the Gini coefficient. In Germany, from January to July 2009, the airports of Frankfurt and Munich together handled almost 47% of the total movements (Fig. 5). In UK, the 23% of airports (London Heathrow, London

214
Gatwick and Manchester), handled the 51% of the total movements in 2008 (Fig. 6).
Finally, Italy is the country with the lowest value of the Gini coefficient (only 0,38 in 2008). This is because the two most
important Italian airports (Rome Fiumicino and Milan Malpensa) together handle only 50% of the total movements (Fig. 7). The Italian air transport network is, in conclusion, very spread and it is possible to notice that the concentration is still further diminishing.
0
0,1
0,2
0,3
0,4
0,5
0,6
0,7
0,8
0,9
1
0 0,1 0,2 0,3 0,4 0,5 0,6 0,7 0,8 0,9 1
Cumulative % of passenger
Cum
ulat
ive
% o
f airp
orts
Fig. 5. Lorenz Curve for Germany (2009)
0
0,1
0,2
0,3
0,4
0,5
0,6
0,7
0,8
0,9
1
0 0,1 0,2 0,3 0,4 0,5 0,6 0,7 0,8 0,9 1
Cumulative % of passenger
Cum
ulat
ive
% o
f airp
orts
Fig. 6. Lorenz Curve for UK (2008)
Mantecchini L. et al. Integration and Concentration of European Air Transport Market

215
International Journal for Traffic and Transport Engineering, 2013, 3(2): 204 – 219
It can be observed that low-cost carriers, thanks to their lowest fares, underwent less severe losses or little gains in terms of movements and passengers carried than full service airlines. At the same time, the traffic at secondary airport remained quite unchanged while main hubs experiment strong traffic losses. Moreover, low cost carriers are going on opening new routes from underused secondary and regional airports, thus diminishing the concentration degree of the Italian air traffic network. This phenomenon is less remarkable in the other countries; Table 2 actually shows that the Gini coefficient remains quite steady in the period analysed, because the difference between movements and passenger carried in both main hubs and secondary airports is similar (both gained in 2007, both lost traffic in 2008 and 2009).
The second important index investigated in this paper is airport accessibility. This parameter refers to the number of destination which is possible to attain departing from a target
airport. Again, the countries analysed are France, Germany, Italy, Spain and UK; two main criteria have been used to define the sample of significative airports:
• top six airports for each country with reference to the total movements handled;
• significant percentage of low cost traffic.
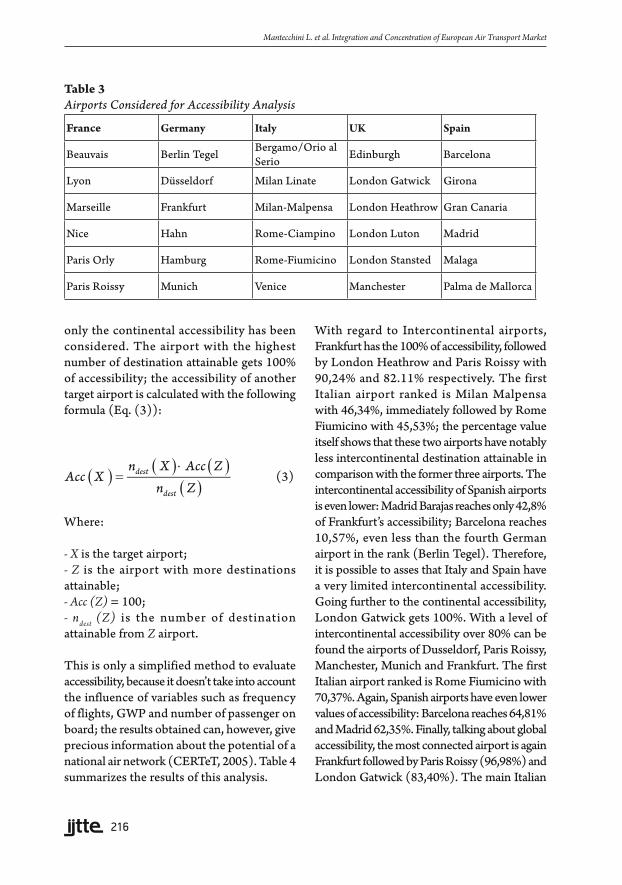
Table 3 shows the 30 airports chosen for this analysis.
The destinations attainable from these airports have been classified as domestic, i n t e r c o n t i n e n t a l a n d c o n t i n e n t a l , considering the latter as the traffic having the EU countries and along with Morocco, Algeria and Tunisia as destinations. The destinations have been derived from airports web sites in the period of fall 2009 and the frequencies have not been considered. For International Airports intercontinental, continental and total accessibility has been evaluated, while for the remaining airports
0
0,1
0,2
0,3
0,4
0,5
0,6
0,7
0,8
0,9
1
0 0,1 0,2 0,3 0,4 0,5 0,6 0,7 0,8 0,9 1
Cumulative % of passenger
Cum
ulat
ive
% o
f airp
orts
Fig. 7. Lorenz Curve for Italy (2009)
216
only the continental accessibility has been considered. The airport with the highest number of destination attainable gets 100% of accessibility; the accessibility of another target airport is calculated with the following formula (Eq. (3)):
( ) ( ) ( )( )
dest
dest
n X Acc ZAcc X
n Z⋅
= (3)
Where:
- X is the target airport;- Z is the airport with more destinations attainable;- Acc (Z) = 100;- ndest (Z) is the number of destination attainable from Z airport.
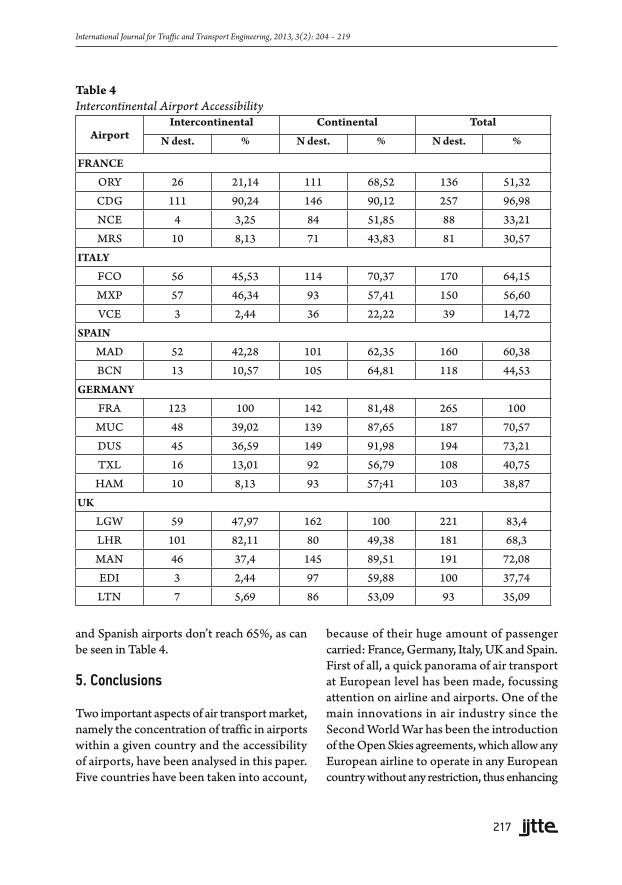
This is only a simplified method to evaluate accessibility, because it doesn’t take into account the influence of variables such as frequency of flights, GWP and number of passenger on board; the results obtained can, however, give precious information about the potential of a national air network (CERTeT, 2005). Table 4 summarizes the results of this analysis.
With regard to Intercontinental airports, Frankfurt has the 100% of accessibility, followed by London Heathrow and Paris Roissy with 90,24% and 82.11% respectively. The first Italian airport ranked is Milan Malpensa with 46,34%, immediately followed by Rome Fiumicino with 45,53%; the percentage value itself shows that these two airports have notably less intercontinental destination attainable in comparison with the former three airports. The intercontinental accessibility of Spanish airports is even lower: Madrid Barajas reaches only 42,8% of Frankfurt’s accessibility; Barcelona reaches 10,57%, even less than the fourth German airport in the rank (Berlin Tegel). Therefore, it is possible to asses that Italy and Spain have a very limited intercontinental accessibility. Going further to the continental accessibility, London Gatwick gets 100%. With a level of intercontinental accessibility over 80% can be found the airports of Dusseldorf, Paris Roissy, Manchester, Munich and Frankfurt. The first Italian airport ranked is Rome Fiumicino with 70,37%. Again, Spanish airports have even lower values of accessibility: Barcelona reaches 64,81% and Madrid 62,35%. Finally, talking about global accessibility, the most connected airport is again Frankfurt followed by Paris Roissy (96,98%) and London Gatwick (83,40%). The main Italian
Table 3 Airports Considered for Accessibility Analysis
France Germany Italy UK Spain
Beauvais Berlin Tegel Bergamo/Orio al Serio Edinburgh Barcelona
Lyon Düsseldorf Milan Linate London Gatwick Girona
Marseille Frankfurt Milan-Malpensa London Heathrow Gran Canaria
Nice Hahn Rome-Ciampino London Luton Madrid
Paris Orly Hamburg Rome-Fiumicino London Stansted Malaga
Paris Roissy Munich Venice Manchester Palma de Mallorca
Mantecchini L. et al. Integration and Concentration of European Air Transport Market
217
International Journal for Traffic and Transport Engineering, 2013, 3(2): 204 – 219
and Spanish airports don’t reach 65%, as can be seen in Table 4.
5. Conclusions
Two important aspects of air transport market, namely the concentration of traffic in airports within a given country and the accessibility of airports, have been analysed in this paper. Five countries have been taken into account,
because of their huge amount of passenger carried: France, Germany, Italy, UK and Spain. First of all, a quick panorama of air transport at European level has been made, focussing attention on airline and airports. One of the main innovations in air industry since the Second World War has been the introduction of the Open Skies agreements, which allow any European airline to operate in any European country without any restriction, thus enhancing
Table 4 Intercontinental Airport Accessibility
AirportIntercontinental Continental Total
N dest. % N dest. % N dest. %
FRANCE
ORY 26 21,14 111 68,52 136 51,32
CDG 111 90,24 146 90,12 257 96,98
NCE 4 3,25 84 51,85 88 33,21
MRS 10 8,13 71 43,83 81 30,57
ITALY
FCO 56 45,53 114 70,37 170 64,15
MXP 57 46,34 93 57,41 150 56,60
VCE 3 2,44 36 22,22 39 14,72
SPAIN
MAD 52 42,28 101 62,35 160 60,38
BCN 13 10,57 105 64,81 118 44,53
GERMANY
FRA 123 100 142 81,48 265 100
MUC 48 39,02 139 87,65 187 70,57
DUS 45 36,59 149 91,98 194 73,21
TXL 16 13,01 92 56,79 108 40,75
HAM 10 8,13 93 57;41 103 38,87
UK
LGW 59 47,97 162 100 221 83,4
LHR 101 82,11 80 49,38 181 68,3
MAN 46 37,4 145 89,51 191 72,08
EDI 3 2,44 97 59,88 100 37,74
LTN 7 5,69 86 53,09 93 35,09
218
competition between airlines and further innovation. As a result, new strategies such as low cost airlines, alliances, airlines merging and vertical integration between airport and airlines have been emerged and developed.
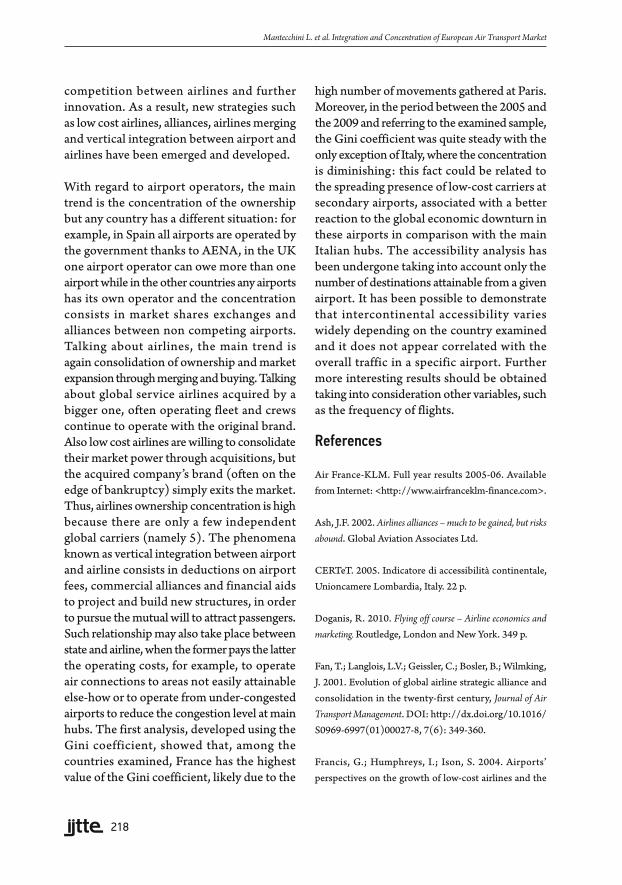
With regard to airport operators, the main trend is the concentration of the ownership but any country has a different situation: for example, in Spain all airports are operated by the government thanks to AENA, in the UK one airport operator can owe more than one airport while in the other countries any airports has its own operator and the concentration consists in market shares exchanges and alliances between non competing airports. Talking about airlines, the main trend is again consolidation of ownership and market expansion through merging and buying. Talking about global service airlines acquired by a bigger one, often operating fleet and crews continue to operate with the original brand. Also low cost airlines are willing to consolidate their market power through acquisitions, but the acquired company’s brand (often on the edge of bankruptcy) simply exits the market. Thus, airlines ownership concentration is high because there are only a few independent global carriers (namely 5). The phenomena known as vertical integration between airport and airline consists in deductions on airport fees, commercial alliances and financial aids to project and build new structures, in order to pursue the mutual will to attract passengers. Such relationship may also take place between state and airline, when the former pays the latter the operating costs, for example, to operate air connections to areas not easily attainable else-how or to operate from under-congested airports to reduce the congestion level at main hubs. The first analysis, developed using the Gini coefficient, showed that, among the countries examined, France has the highest value of the Gini coefficient, likely due to the
high number of movements gathered at Paris. Moreover, in the period between the 2005 and the 2009 and referring to the examined sample, the Gini coefficient was quite steady with the only exception of Italy, where the concentration is diminishing: this fact could be related to the spreading presence of low-cost carriers at secondary airports, associated with a better reaction to the global economic downturn in these airports in comparison with the main Italian hubs. The accessibility analysis has been undergone taking into account only the number of destinations attainable from a given airport. It has been possible to demonstrate that intercontinental accessibility varies widely depending on the country examined and it does not appear correlated with the overall traffic in a specific airport. Further more interesting results should be obtained taking into consideration other variables, such as the frequency of flights.
References
Air France-KLM. Full year results 2005-06. Available from Internet: <http://www.airfranceklm-finance.com>.
Ash, J.F. 2002. Airlines alliances – much to be gained, but risks abound. Global Aviation Associates Ltd.
CERTeT. 2005. Indicatore di accessibilità continentale, Unioncamere Lombardia, Italy. 22 p.
Doganis, R. 2010. Flying off course – Airline economics and marketing. Routledge, London and New York. 349 p.
Fan, T.; Langlois, L.V.; Geissler, C.; Bosler, B.; Wilmking, J. 2001. Evolution of global airline strategic alliance and consolidation in the twenty-first century, Journal of Air Transport Management. DOI: http://dx.doi.org/10.1016/S0969-6997(01)00027-8, 7(6): 349-360.
Francis, G.; Humphreys, I.; Ison, S. 2004. Airports’ perspectives on the growth of low-cost airlines and the
Mantecchini L. et al. Integration and Concentration of European Air Transport Market

219
International Journal for Traffic and Transport Engineering, 2013, 3(2): 204 – 219
remodelling of the airport-airline relationship, Tourism Management. DOI: http://dx.doi.org/10.1016/S0261-5177(03)00121-3, 25(4): 507-514.
Goetsch, B.; Albers, S. 2007. Towards a model of airport-airline interaction. In Proceedings of the 11th ATRS World Conference, Berkeley, USA. 1-20.
Graham, A. 2004. Airport strategies to gain competitive advantage. In Proceedings of German Aviation Research Society – Slots, airport competition and benchmarking of airports, Bremen, Germany. 1-16.
Graham, A. 2008. Managing airports – An international perspective. Elsevier/Butterworth-Heinemann, Oxford UK. 333 p.
Grebenšek, A.; Magister, T. 2012. Traffic variability in benchmarking of air navigation services providers cost-effectiveness, International Journal for Traffic and Transport Engineering. DOI: http://dx.doi.org/10.7708/ijtte.2012.2(3).03, 2(3): 185-201.
Iatrou, K.; Alamdari, F. 2005. The empirical analysis of the impact of alliances on airline operations, Journal of Air Transport Management. DOI: http://dx.doi.org/10.1016/j.jairtraman.2004.07.005, 11(3): 127-134.
Oum, T.H.; Fu, X. 2008. Impacts of airports on airline competition: focus on airport performance and airport-airline vertical relations. Discussion paper no. 17, International Transport Forum. 37 p.
Serebrisky, T. 2003. Market power: airports – vertical integration between airports and airlines, The World Bank group, note n° 259. Available from Internet: <https://openknowledge.worldbank.org/handle/10986/11304>.
Tretheway, M.; Kincaid, I. 2005. Competition Between Airports in the New Millennium: What Works, What Doesn’t Work and Why. In Proceedings of the 8th Hamburg Aviation Scientific Workshop, Hamburg, Germany. 1-18.
INTEGRACIJA I KONCENTRACIJA EVROPSKOG TRŽIŠTA VAZDUŠNOG SAOBRAĆAJA
Luca Mantecchini, Nicola Gualandi, Filippo Paganelli
Sažetak: Tokom poslednjih godina pružaoci usluga u vazdušnom saobraćaju bili su svedoci značajnih promena. Konkurencija među aviokompanijama se zaoštrila zbog pada ekonomije, dok je konkurencija između aerodroma nastala kao posledica sve manjih državnih intervencija u aerodromskim investicijama. Prvi rezultat ovog procesa je usvajanje mešovitog modela od strane evropskih aviokompanija na domaćem tržištu, on podrazumeva prihvatanje strategija koje su omogućile osnivanje niskotarifnih avioprevozilaca, dok se sa druge strane konstantno povećava broj velikih aerodroma koje oni koriste za svoje operacije. Nestabilnost deregulisanog tržišta vazdušnog saobraćaja bila je predmet istraživanja u naučnoj literaturi i ovi aspekti mogu se uzeti kao dokazi daljeg povećanja nestabilnosti. U cilju ograničavanja negativnih posledica nestabilnosti na evropsko tržište, pružaoci usluga u vazdušnom saobraćaju pronalaze načine za povećanje stabilnosti. Udruživanje ili akvizicija aviokompanija, otkup akcija operatora aerodroma od strane aviokompanija, partnerstva između aerodroma i aviokompanija u cilju razvoja infrastrukture ili otkup aerodromskih akcija od strane drugih aerodromskih operatora, primeri su težnje za većom stabilnošću sistema. U ovom radu su analizirani svi navedeni aspekti koji se odnose na uspostavljanje veće stabilnosti osetljivog sistema vazdušnog saobraćaja u Evropskoj uniji.
Ključne reči: vazdušni saobraćaj, deregulacija, koncentracija tržišta, nestabilnost.