integrating writing and computer graphics to improve...
TRANSCRIPT
Integrating Writing and Computer Graphics to Improve Technical
Communication Across Disciplines
Daniel Keefe, Assistant ProfessorDavid Schroeder, Graduate Research Assistant
Department of Computer Science and Engineering
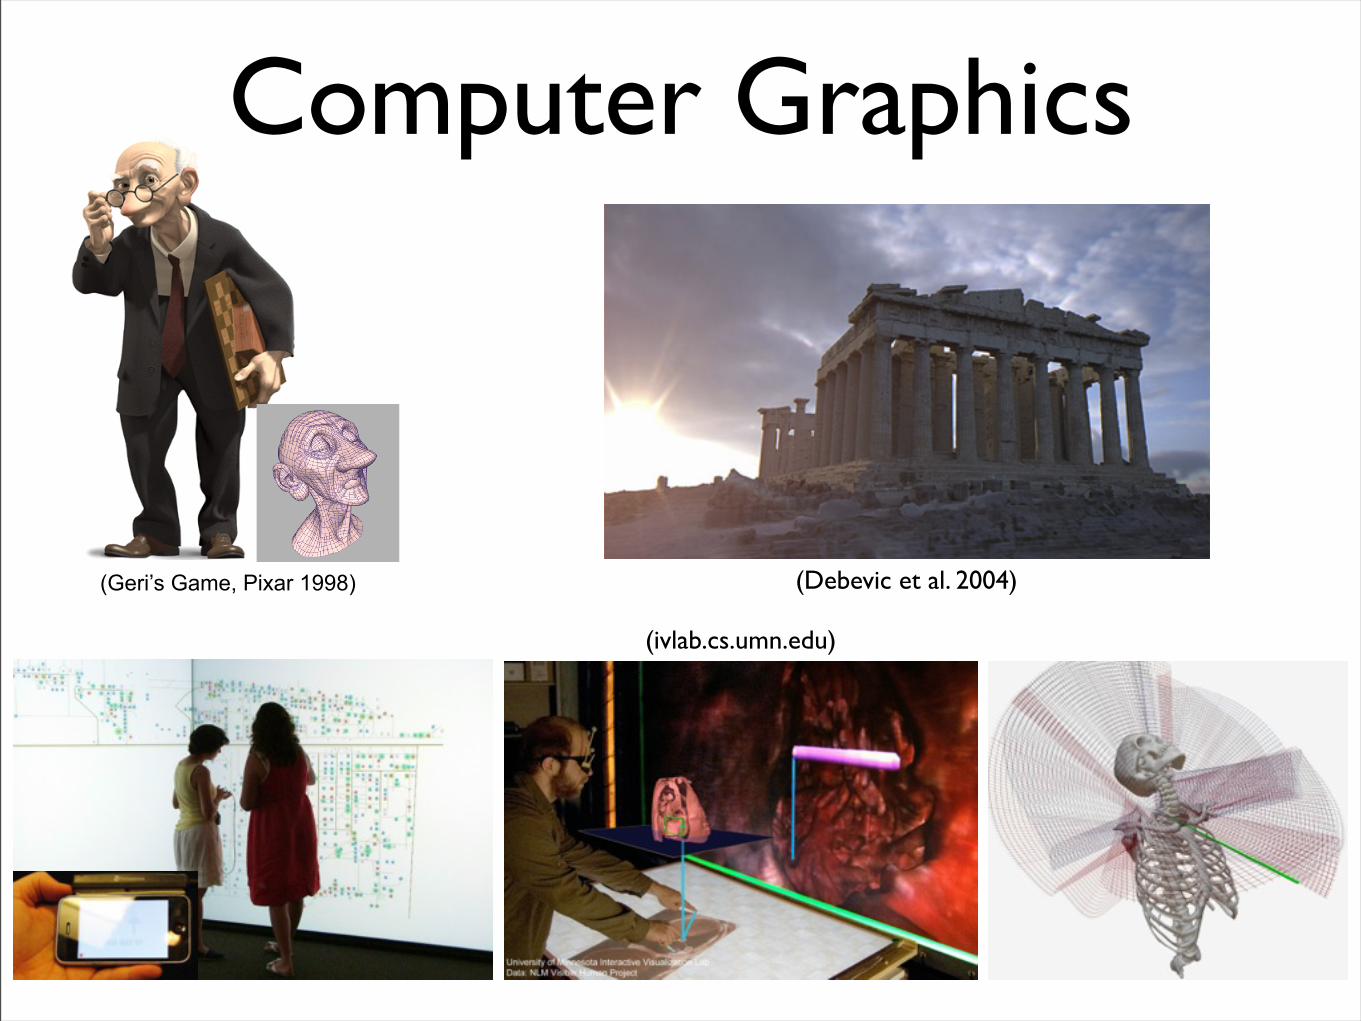
(Geri’s Game, Pixar 1998)
Computer Graphics
(Debevic et al. 2004)
(ivlab.cs.umn.edu)
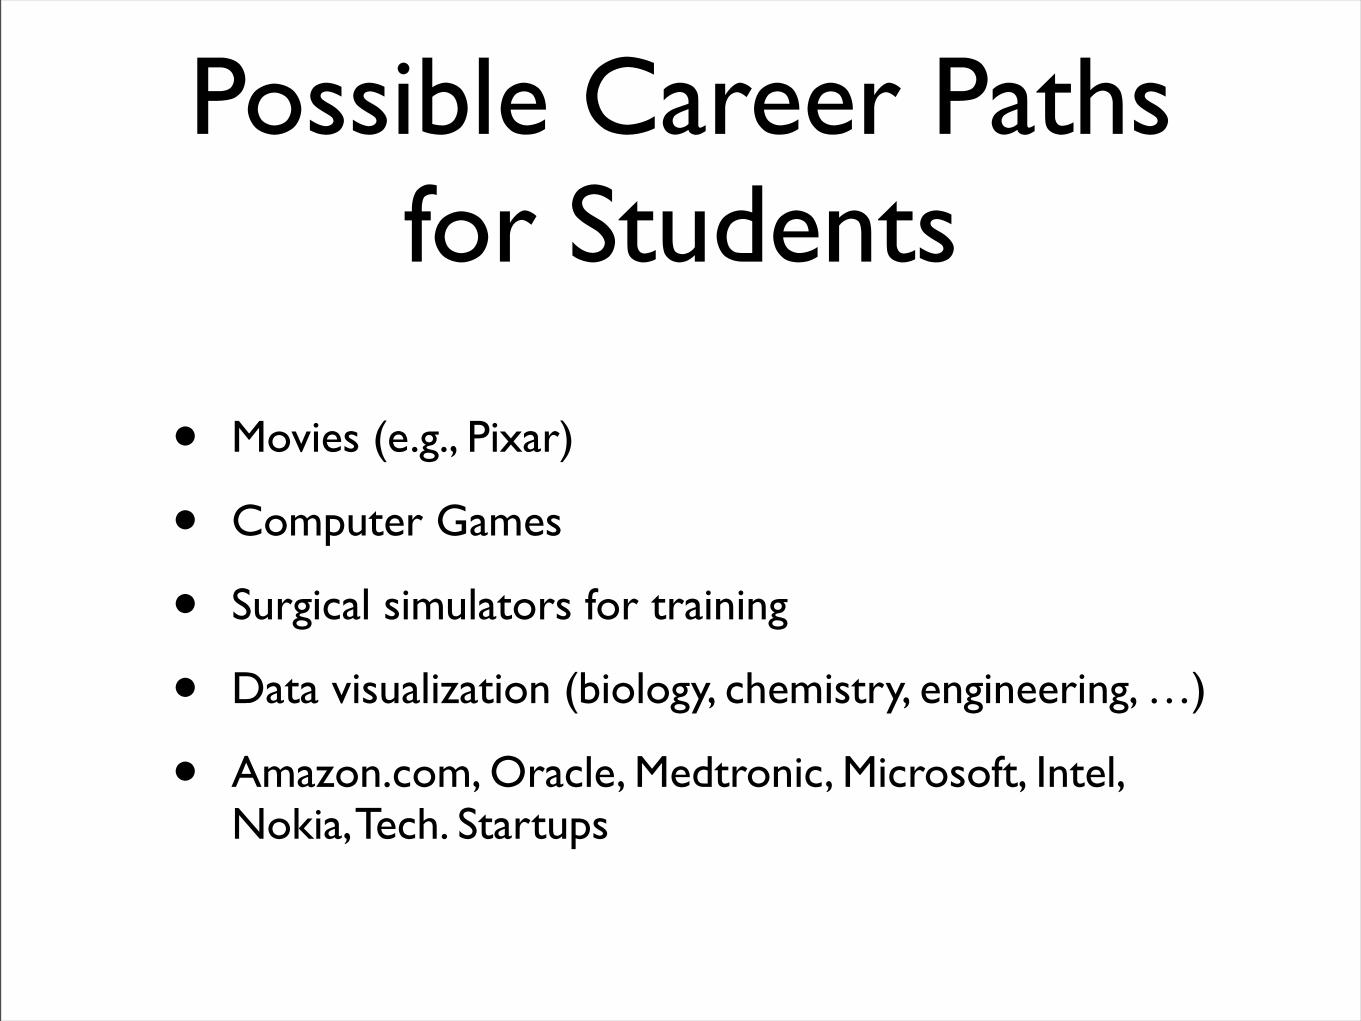
Possible Career Paths for Students
• Movies (e.g., Pixar)
• Computer Games
• Surgical simulators for training
• Data visualization (biology, chemistry, engineering, …)
• Amazon.com, Oracle, Medtronic, Microsoft, Intel, Nokia, Tech. Startups
Research question
To what extent can reinterpreting and supporting important modes of communication in our field (e.g., posters, talks, demos) as important forms of writing improve students’ abilities to communicate with broad interdisciplinary audiences?
Outline
• Key types of writing in computer science
• Current writing support
• Re-envisioned role of writing
• Writing in Computer Graphics Wiki and other efforts to engage with writing
• Future work
Types of writing in Computer Science
• Papers.
• Documentation, Websites, Technical Emails, Code.
• Especially important for Computer Graphics:
• Communicating with reference to imagery.
• Communicating across disciplines.
• Papers with AWESOME figures, Posters, Videos, Talks, Demos.
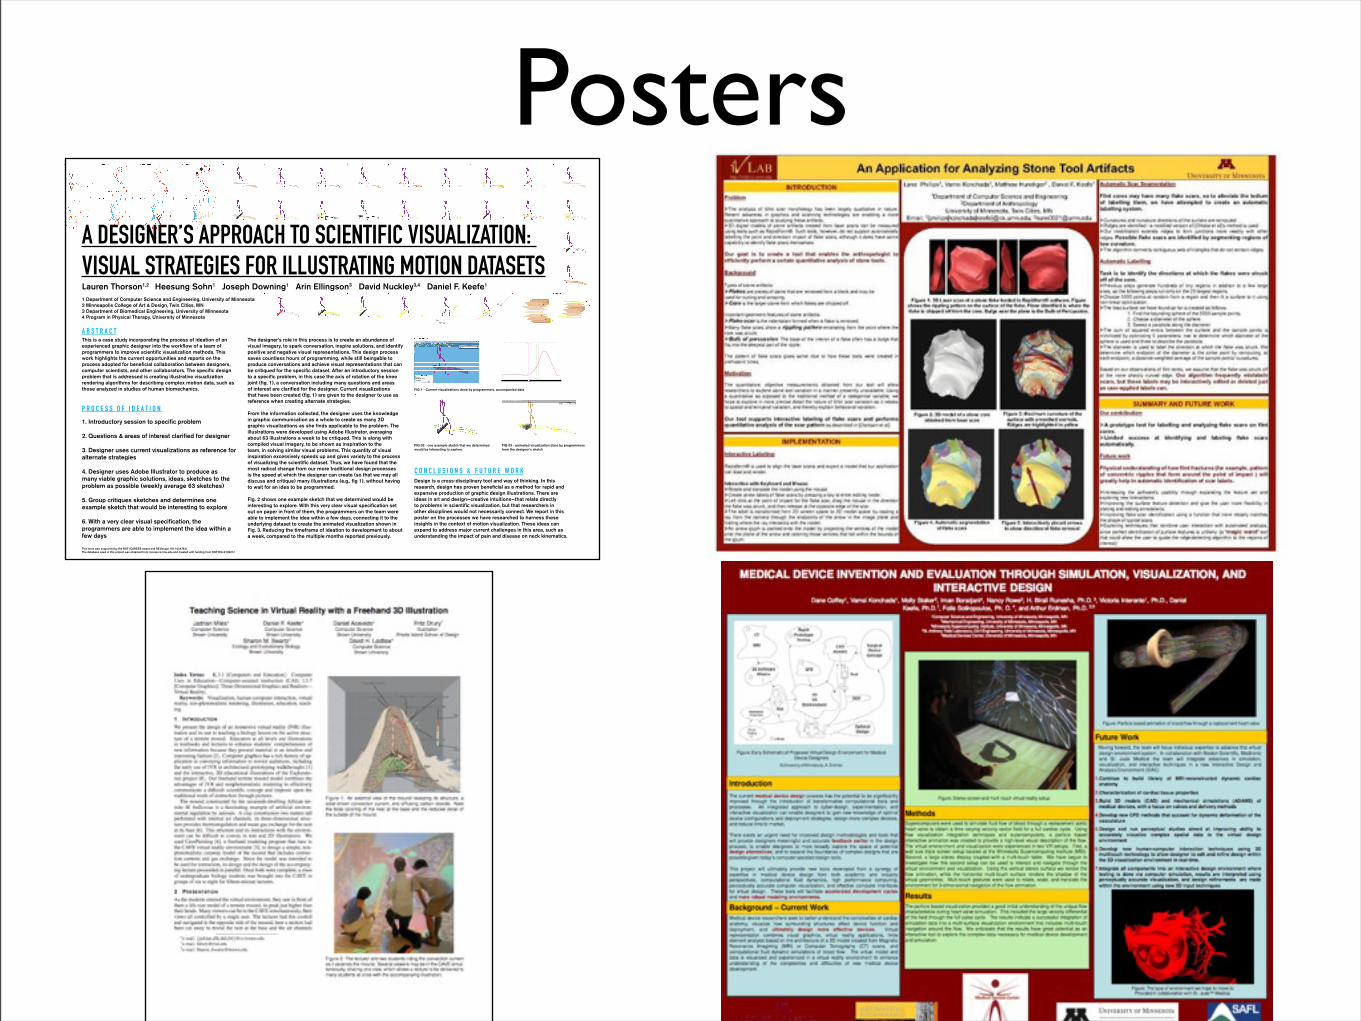
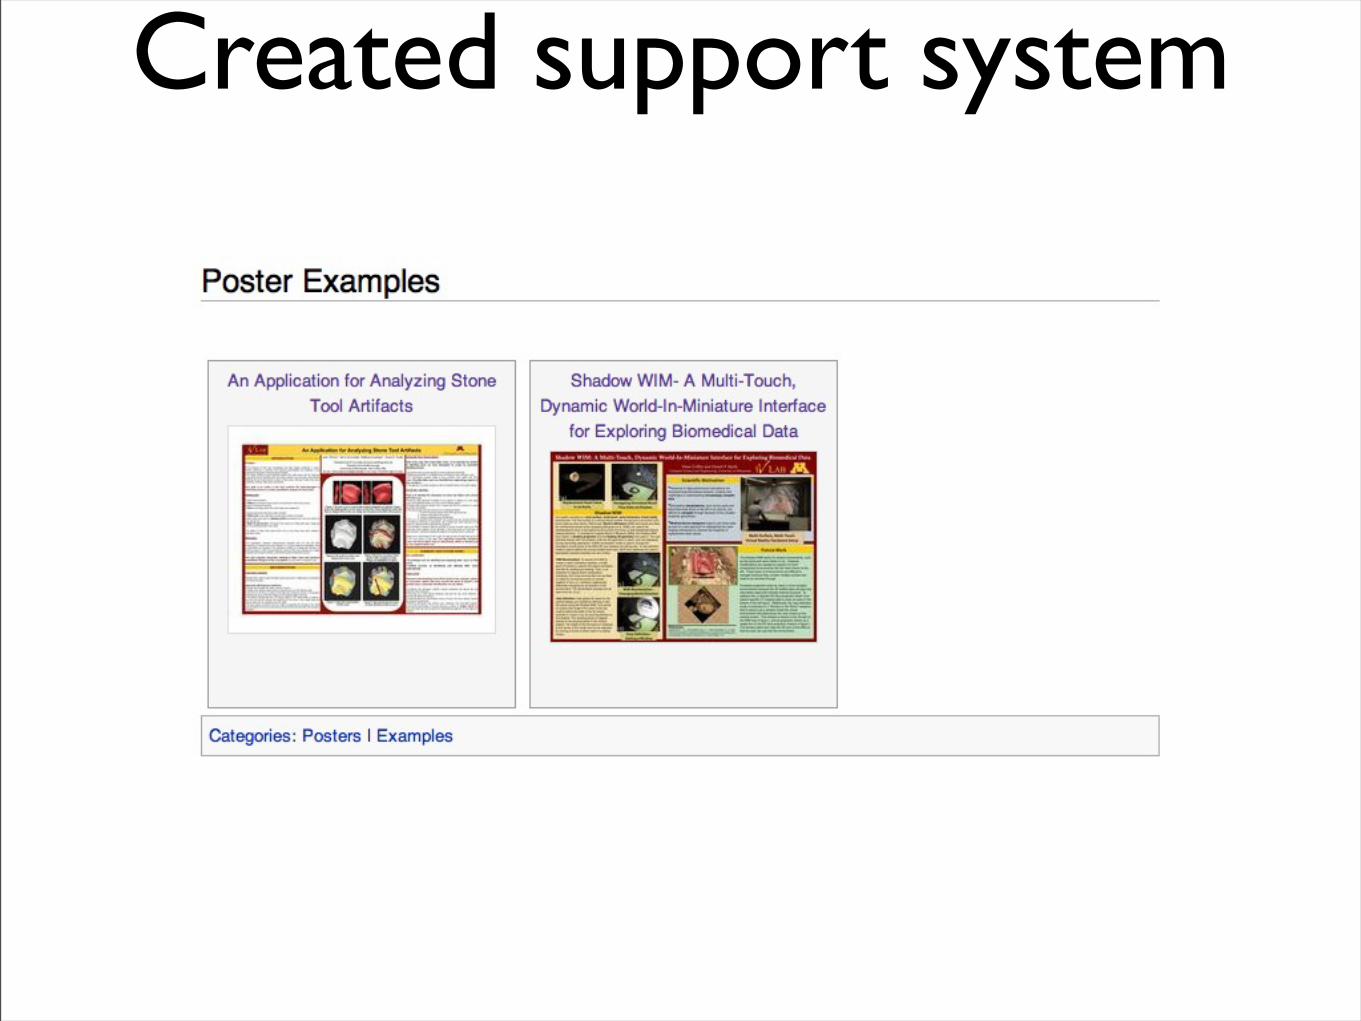
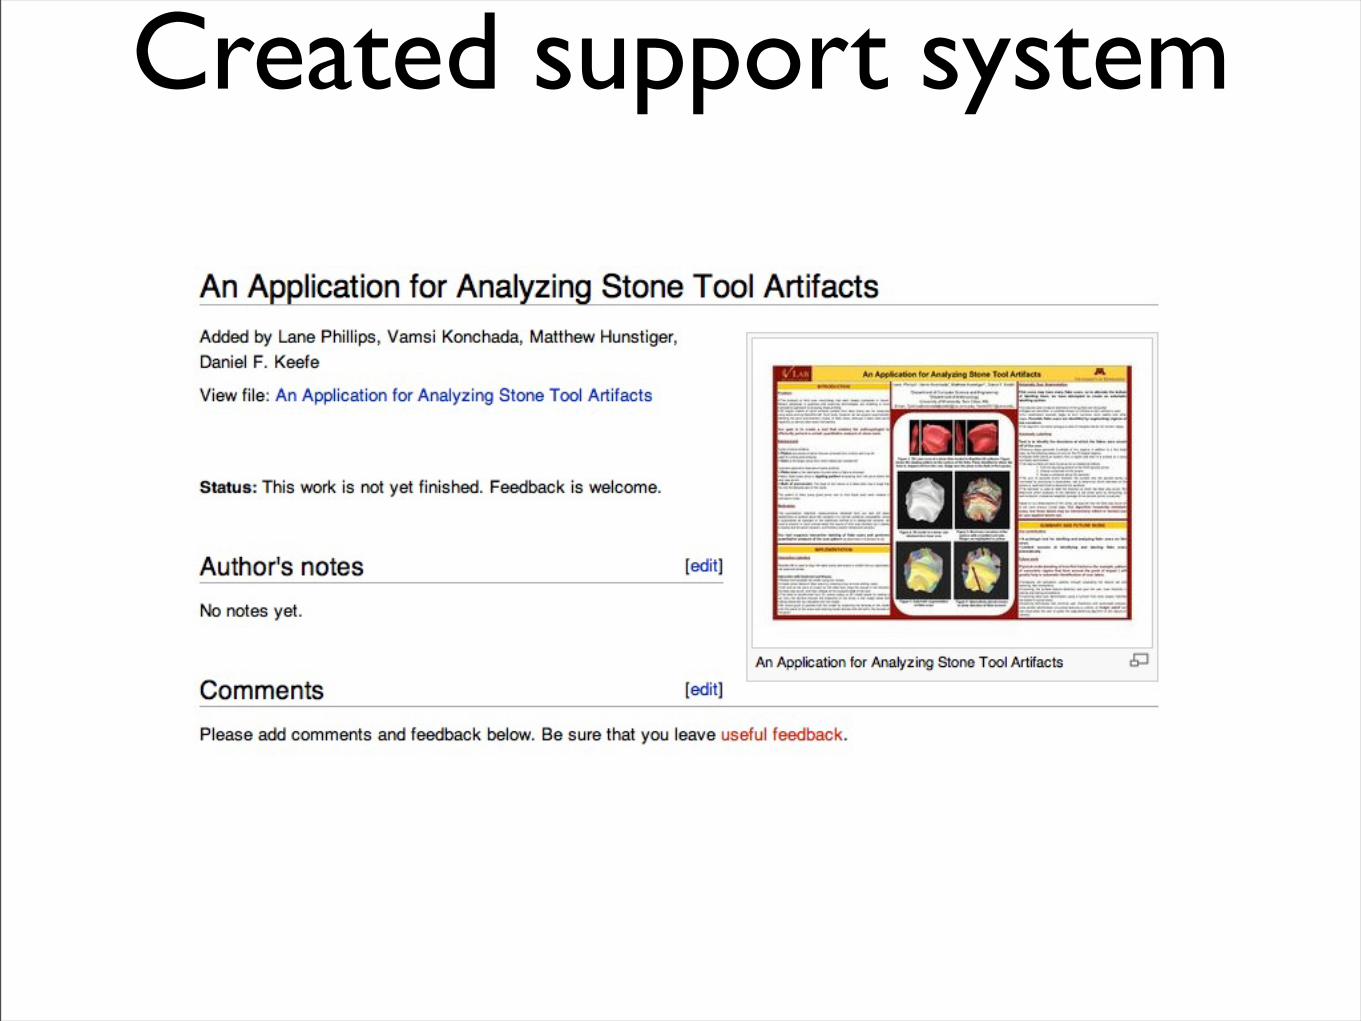
Posters
This work was supported by the NSF (CAREER award and REUsuppl. IIS-1054783). The database used in this project was obtained from mocap.cs.cmu.edu and created with funding from NSF EIA-0196217.
This is a case study incorporating the process of ideation of an experienced graphic designer into the workflow of a team of programmers to improve scientific visualization methods. This work highlights the current opportunities and reports on the process adopted for beneficial collaboration between designers, computer scientists, and other collaborators. The specific design problem that is addressed is creating illustrative visualization rendering algorithms for describing complex motion data, such as those analyzed in studies of human biomechanics.
A B S T R A C T
P R O C E S S O F I D E A T I O N
The designer’s role in this process is to create an abundance of visual imagery, to spark conversation, inspire solutions, and identify positive and negative visual representations. This design process saves countless hours of programming, while still beingable to produce conversations and achieve visual representations that can be critiqued for the specific dataset. After an introductory session to a specific problem, in this case the axis of rotation of the knee joint (fig. 1), a conversation including many questions and areas of interest are clarified for the designer. Current visualizations that have been created (fig. 1) are given to the designer to use as reference when creating alternate strategies.
From the information collected, the designer uses the knowledge in graphic communication as a whole to create as many 2D graphic visualizations as she finds applicable to the problem. The illustrations were developed using Adobe Illustrator, averaging about 63 illustrations a week to be critiqued. This is along with compiled visual imagery, to be shown as inspiration to the team, in solving similar visual problems. This quantity of visual inspiration excessively speeds up and gives variety to the process of visualizing the scientific dataset. Thus, we have found that the most radical change from our more traditional design processes is the speed at which the designer can create (so that we may all discuss and critique) many illustrations (e.g., fig 1), without having to wait for an idea to be programmed.
Fig. 2 shows one example sketch that we determined would be interesting to explore. With this very clear visual specification set out on paper in front of them, the programmers on the team were able to implement the idea within a few days, connecting it to the underlying dataset to create the animated visualization shown in Fig. 3. Reducing the timeframe of ideation to development to about a week, compared to the multiple months reported previously.
1. Introductory session to specific problem
2. Questions & areas of interest clarified for designer
3. Designer uses current visualizations as reference for alternate strategies
4. Designer uses Adobe Illustrator to produce as many viable graphic solutions, ideas, sketches to the problem as possible (weekly average 63 sketches)
5. Group critiques sketches and determines one example sketch that would be interesting to explore
6. With a very clear visual specification, the programmers are able to implement the idea within a few days
C O N C L U S I O N S & F U T U R E W O R KDesign is a cross-disciplinary tool and way of thinking. In this research, design has proven beneficial as a method for rapid and expansive production of graphic design illustrations. There are ideas in art and design—creative intuitions—that relate directly to problems in scientific visualization, but that researchers in other disciplines would not necessarily connect. We report in this poster on the processes we have researched to harness these insights in the context of motion visualization. These ideas can expand to address major current challenges in this area, such as understanding the impact of pain and disease on neck kinematics.
FIG 1 - Current visualizations done by programmers, accompanied data
FIG 02 - one example sketch that we determined would be interesting to explore.
FIG 03 - animated visualization done by programmers from the designer’s sketch
!" !# $" $# %" %# &" &# '" '# #" ## (" (# )" )# *" *# +" +# $"",$"
!"
$"
%"
&"
'"
#"
("
)"
*"
-./01 23456 !785 /95: ;<
=:>25!765>/55?<
@25A
BA;
C:55 !@25A3.: DBA;5:?3.:
E 5 2F 39 !G H 23I J 3;K L 38 != H D = 6 6 J 9 ;3. : C : 5 5 != H D = 6 6 J 9 ;3. : E 5 2F 39 !M 32; L 38 !@ 25 A 3. : D B A;5 : ?3. : C : 5 5 !@ 25 A 3. : D B A;5 : ?3. : = : N 25 !O . /? 3D E 21 : ;1 / E 5 2F 39 !P . ;1 ;3. : L 38 !P . ;1 ;3. : C : 5 5 !P . ;1 ;3. : @ . . ;!E /. > /5 ??!= : > 25 ?
A DESIGNER’S APPROACH TO SCIENTIFIC VISUALIZATION: VISUAL STRATEGIES FOR ILLUSTRATING MOTION DATASETSLauren Thorson1,2 Heesung Sohn1 Joseph Downing1 Arin Ellingson3 David Nuckley3,4 Daniel F. Keefe1
1 Department of Computer Science and Engineering, University of Minnesota2 Minneapolis College of Art & Design, Twin Cities, MN3 Department of Biomedical Engineering, University of Minnesota4 Program in Physical Therapy, University of Minnesota
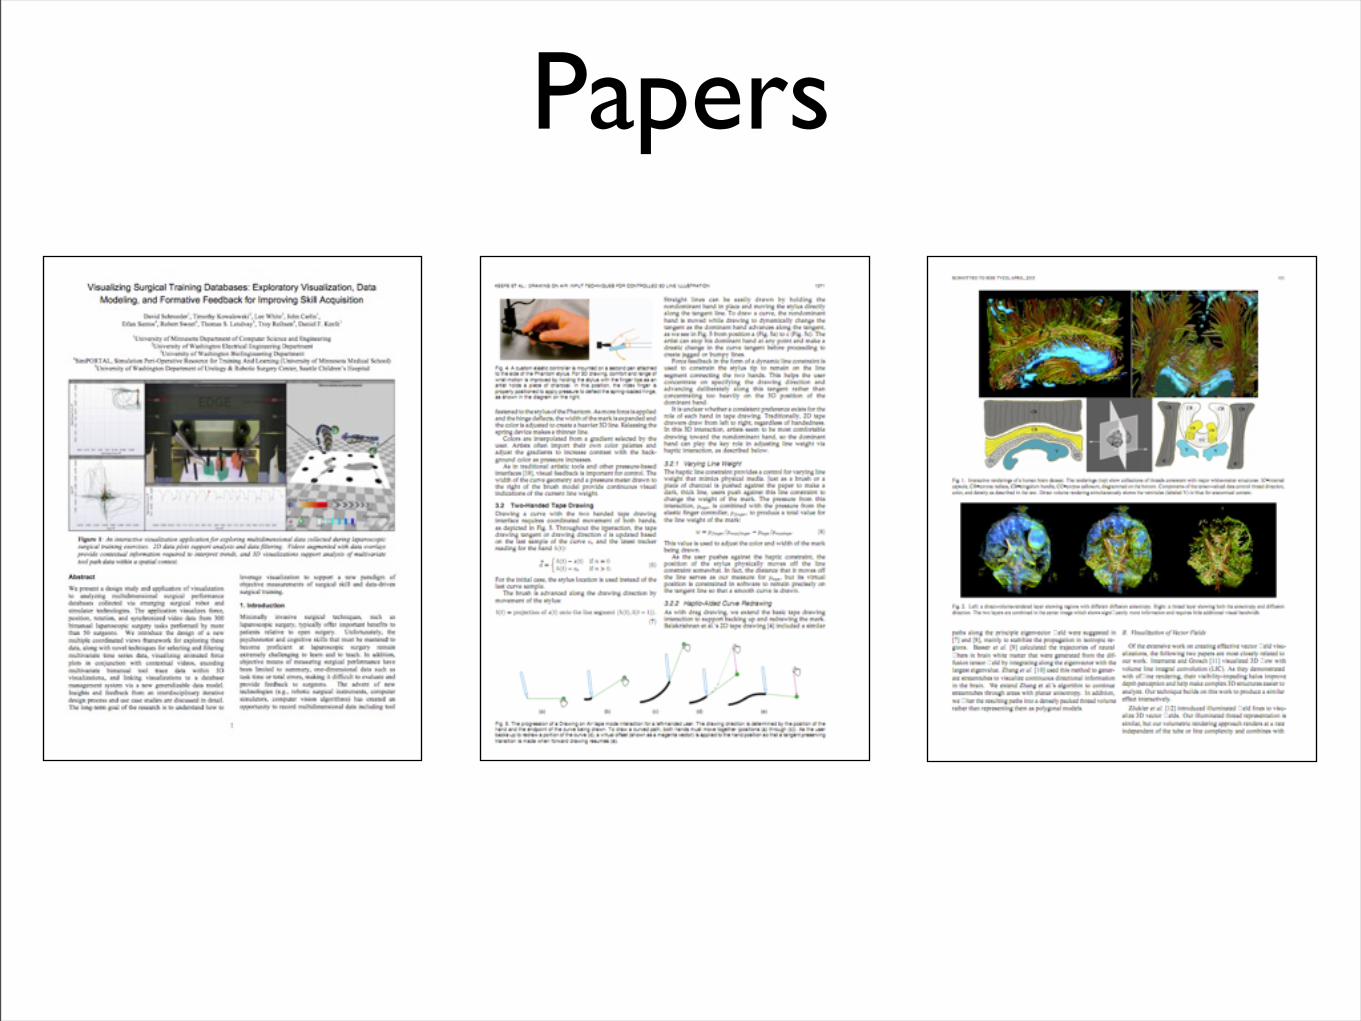
Papers
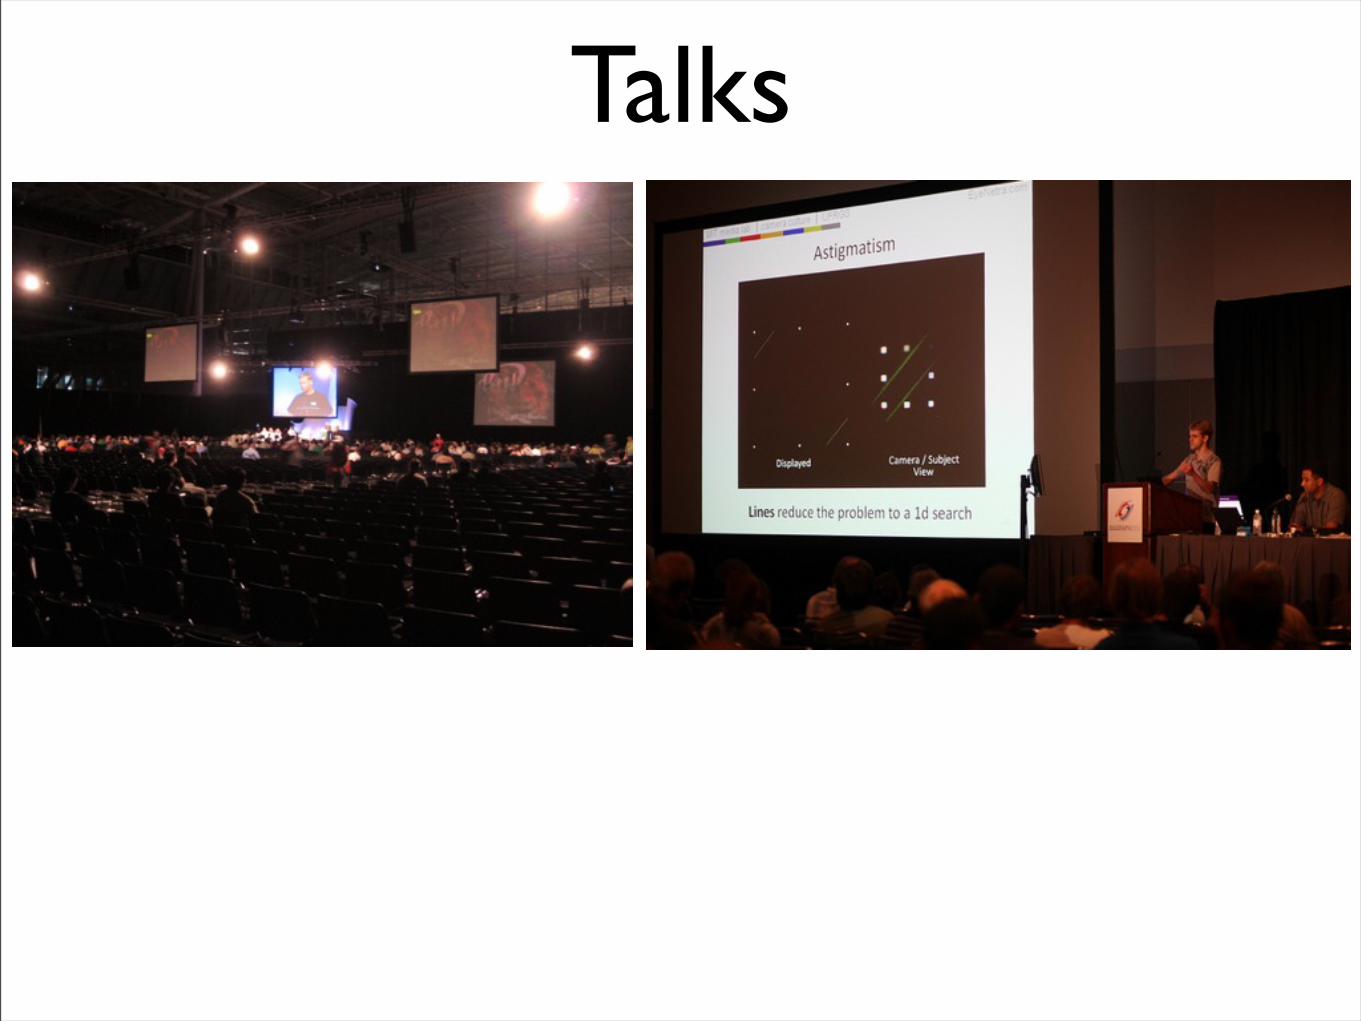
Talks

Videos
Video not yet published
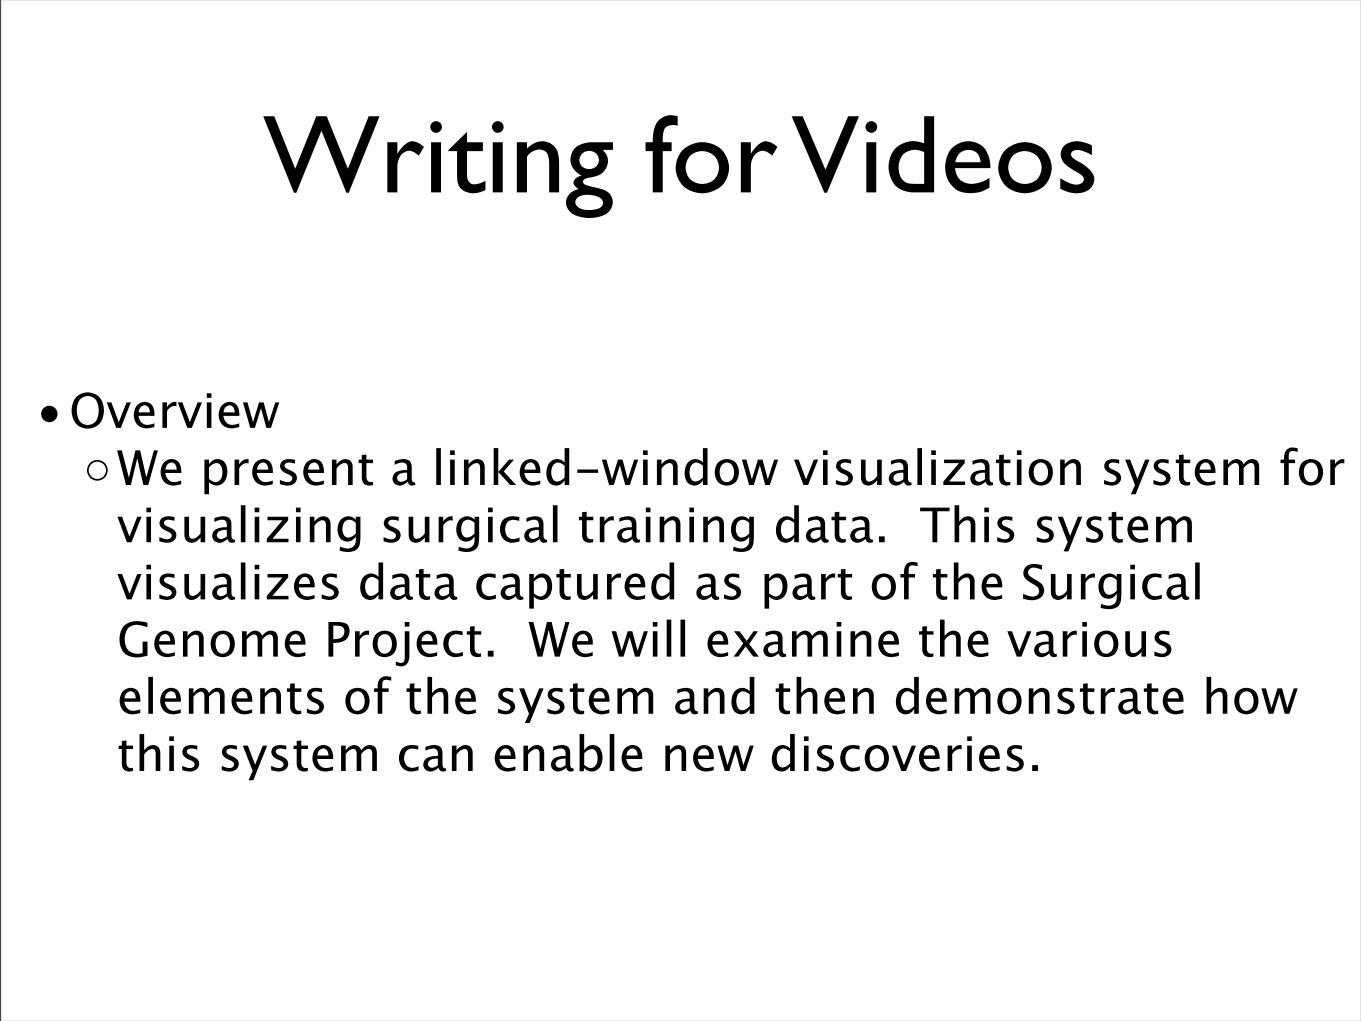
Writing for Videos
•Overview◦We present a linked-window visualization system for
visualizing surgical training data. This system visualizes data captured as part of the Surgical Genome Project. We will examine the various elements of the system and then demonstrate how this system can enable new discoveries.
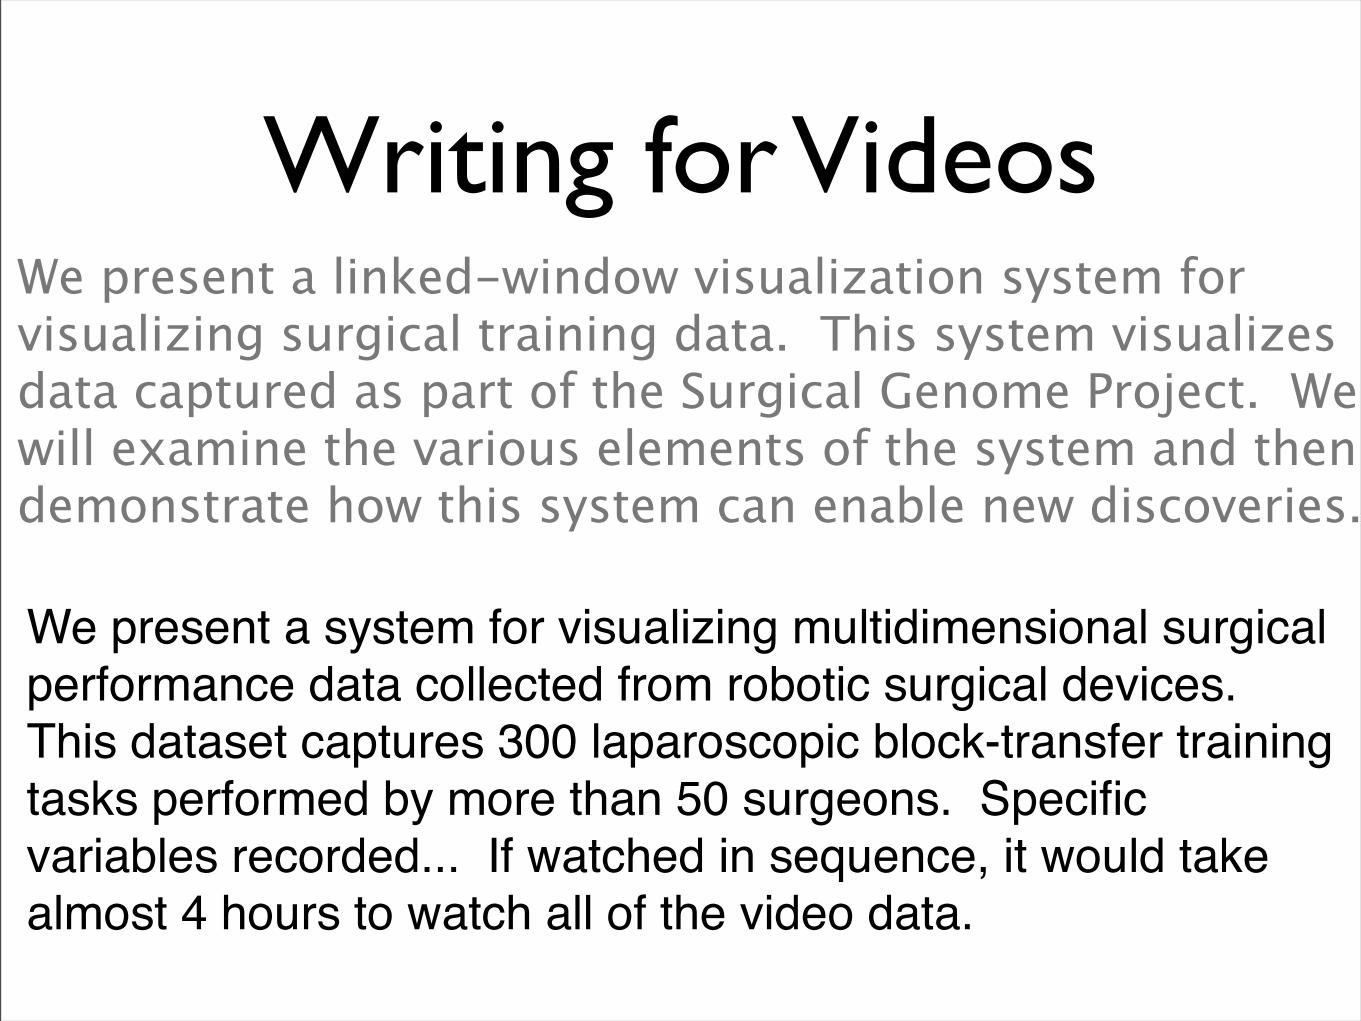
Writing for Videos
We present a system for visualizing multidimensional surgical performance data collected from robotic surgical devices. This dataset captures 300 laparoscopic block-transfer training tasks performed by more than 50 surgeons. Specific variables recorded... If watched in sequence, it would take almost 4 hours to watch all of the video data.
We present a linked-window visualization system for visualizing surgical training data. This system visualizes data captured as part of the Surgical Genome Project. We will examine the various elements of the system and then demonstrate how this system can enable new discoveries.
Demos
Thank you Dane Coffey (one of our VERY BEST demoers) for being the guinea pig...
https://research.cs.umn.edu/mw_writing/index.php/BioWim_(demo)

Current writing support
• Mentoring.
• Word of mouth.
• Trial and error.
• Copy an example.
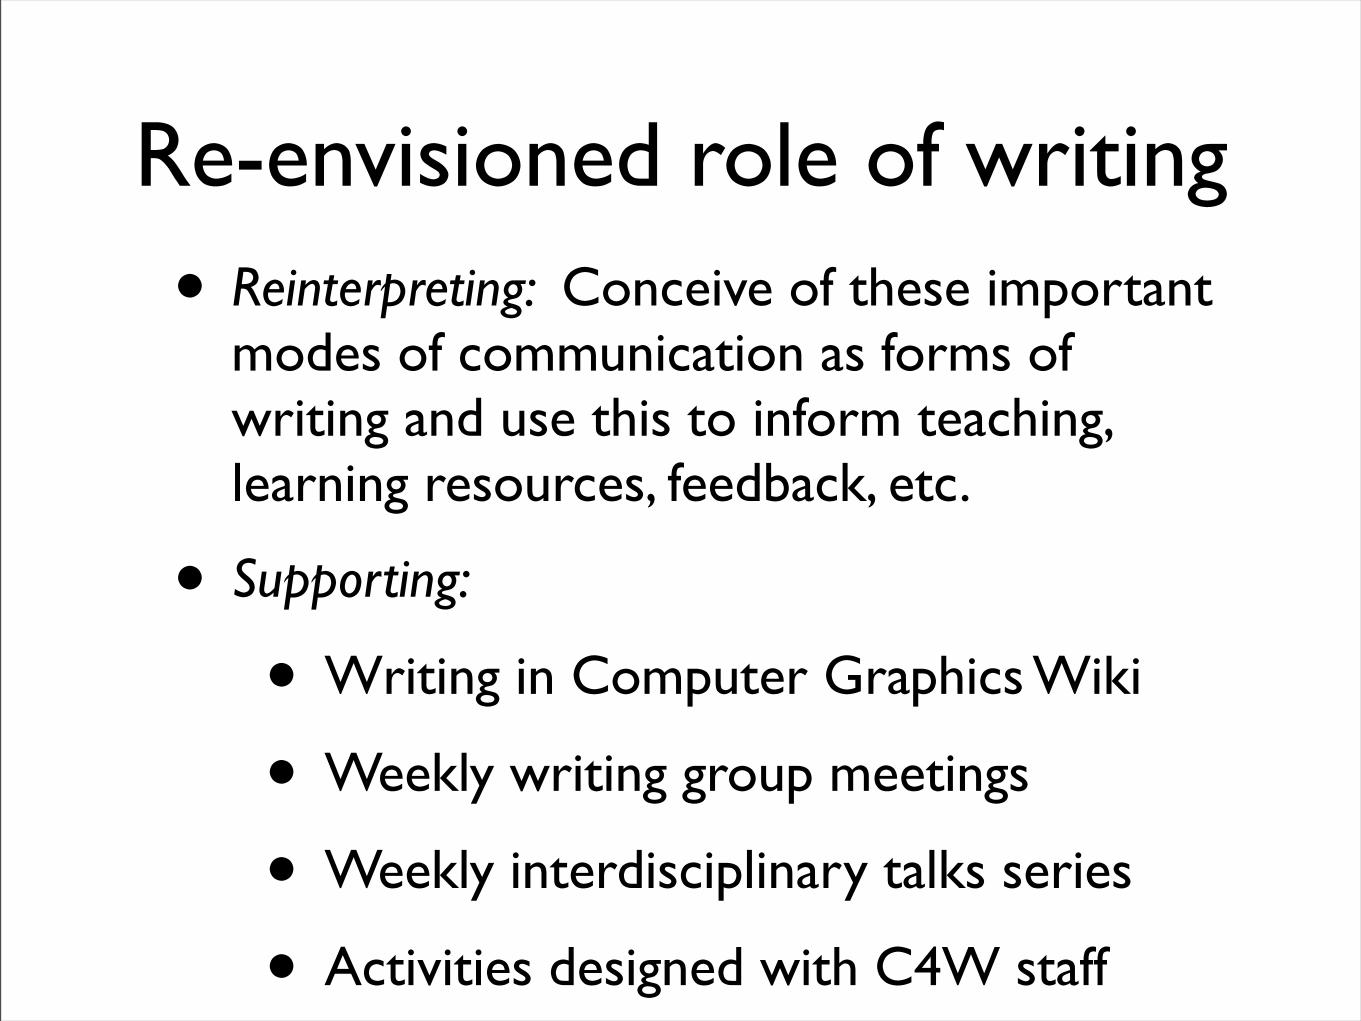
Re-envisioned role of writing• Reinterpreting: Conceive of these important
modes of communication as forms of writing and use this to inform teaching, learning resources, feedback, etc.
• Supporting:
• Writing in Computer Graphics Wiki
• Weekly writing group meetings
• Weekly interdisciplinary talks series
• Activities designed with C4W staff
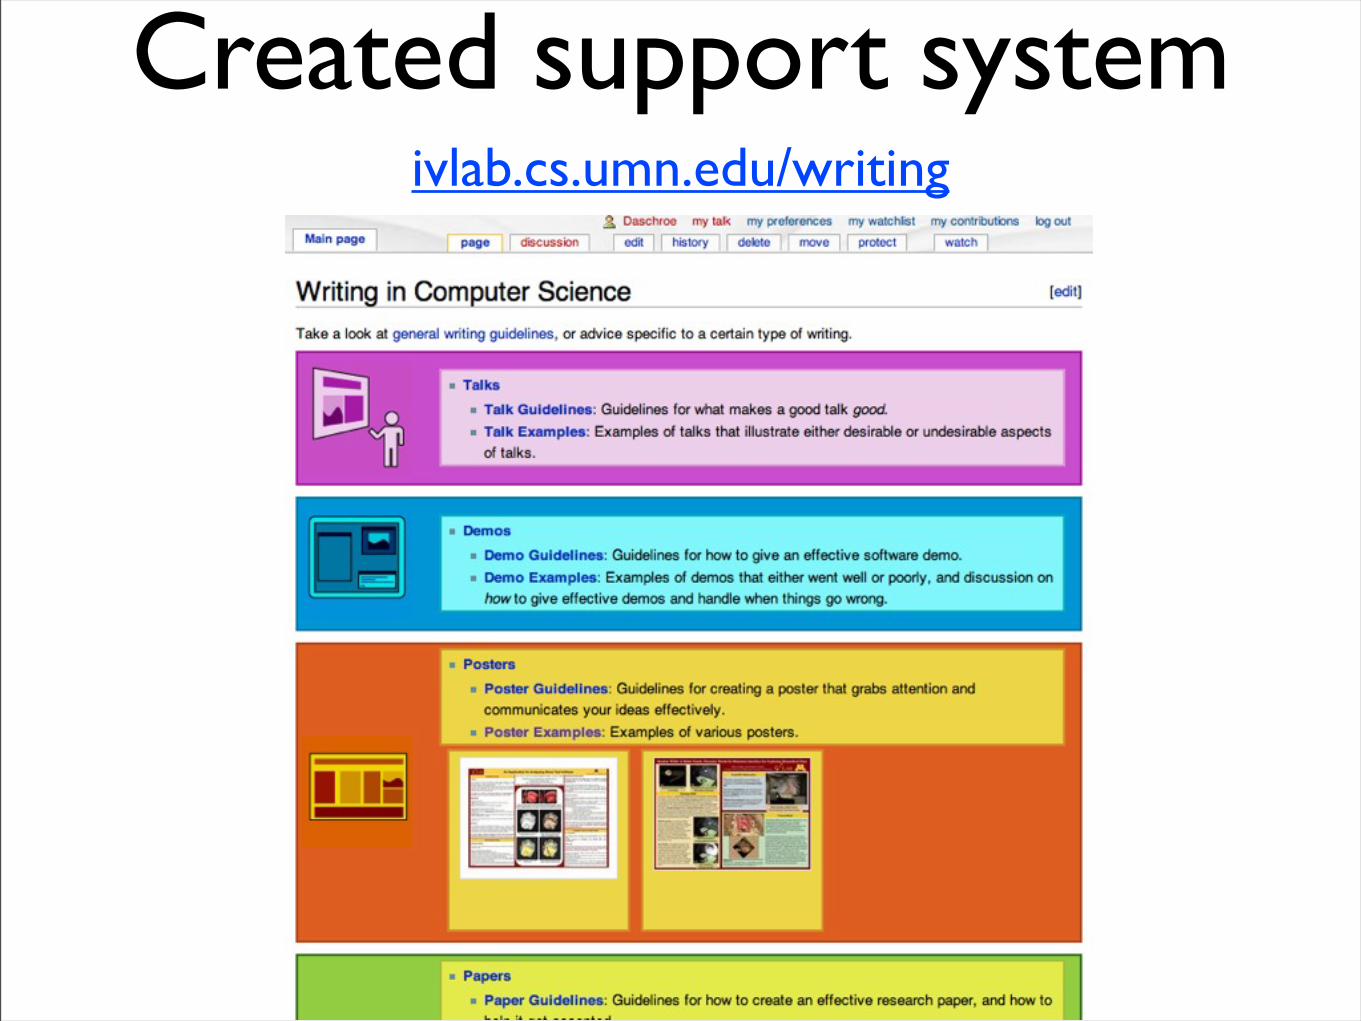
Created support systemivlab.cs.umn.edu/writing
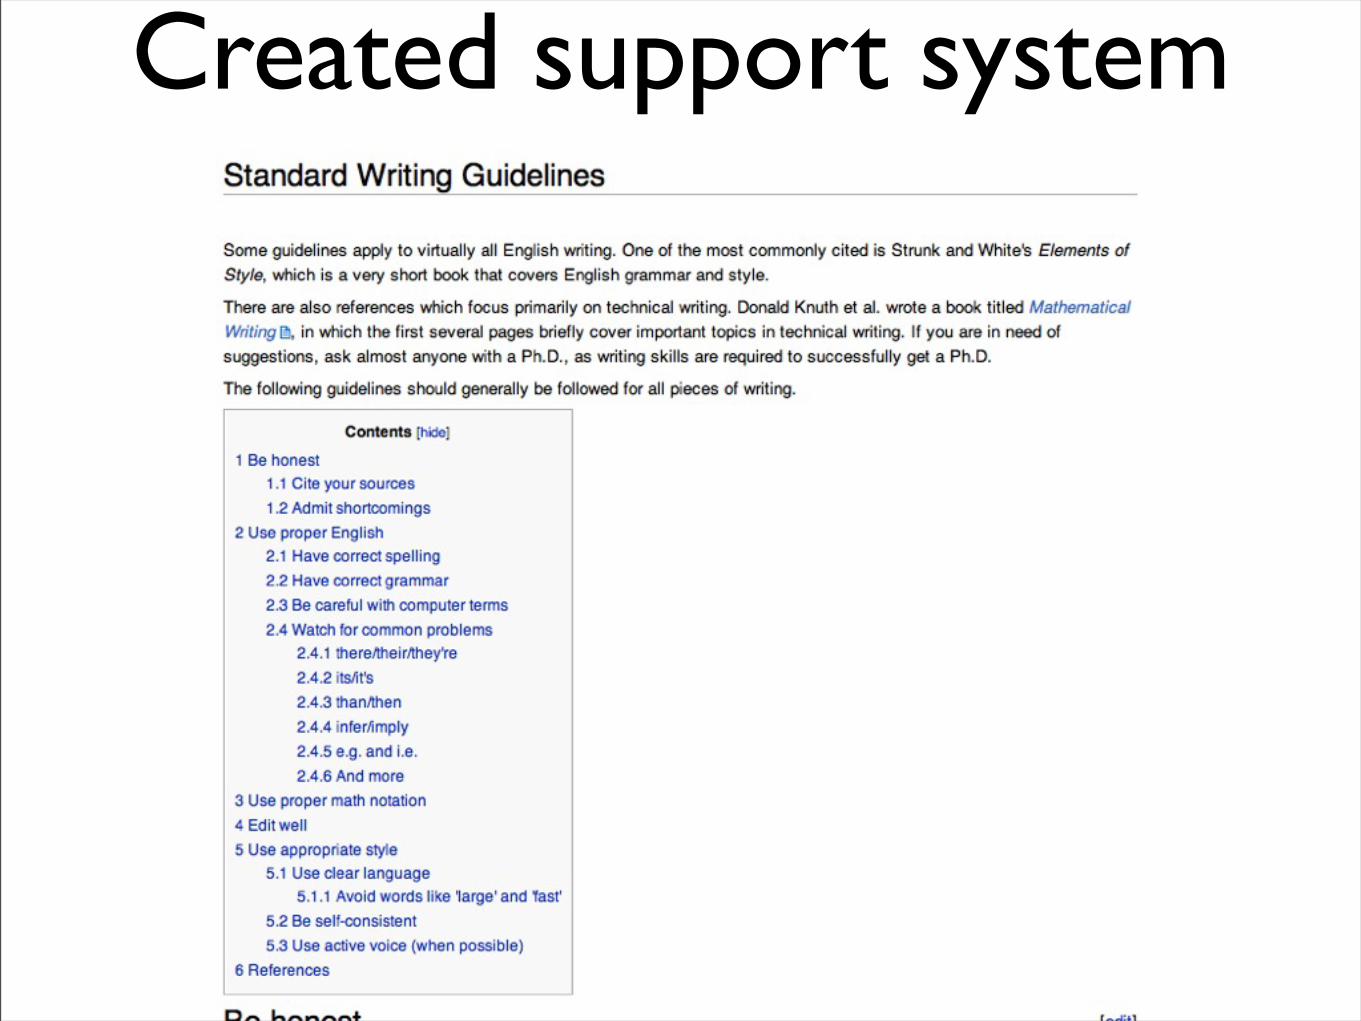
Created support system
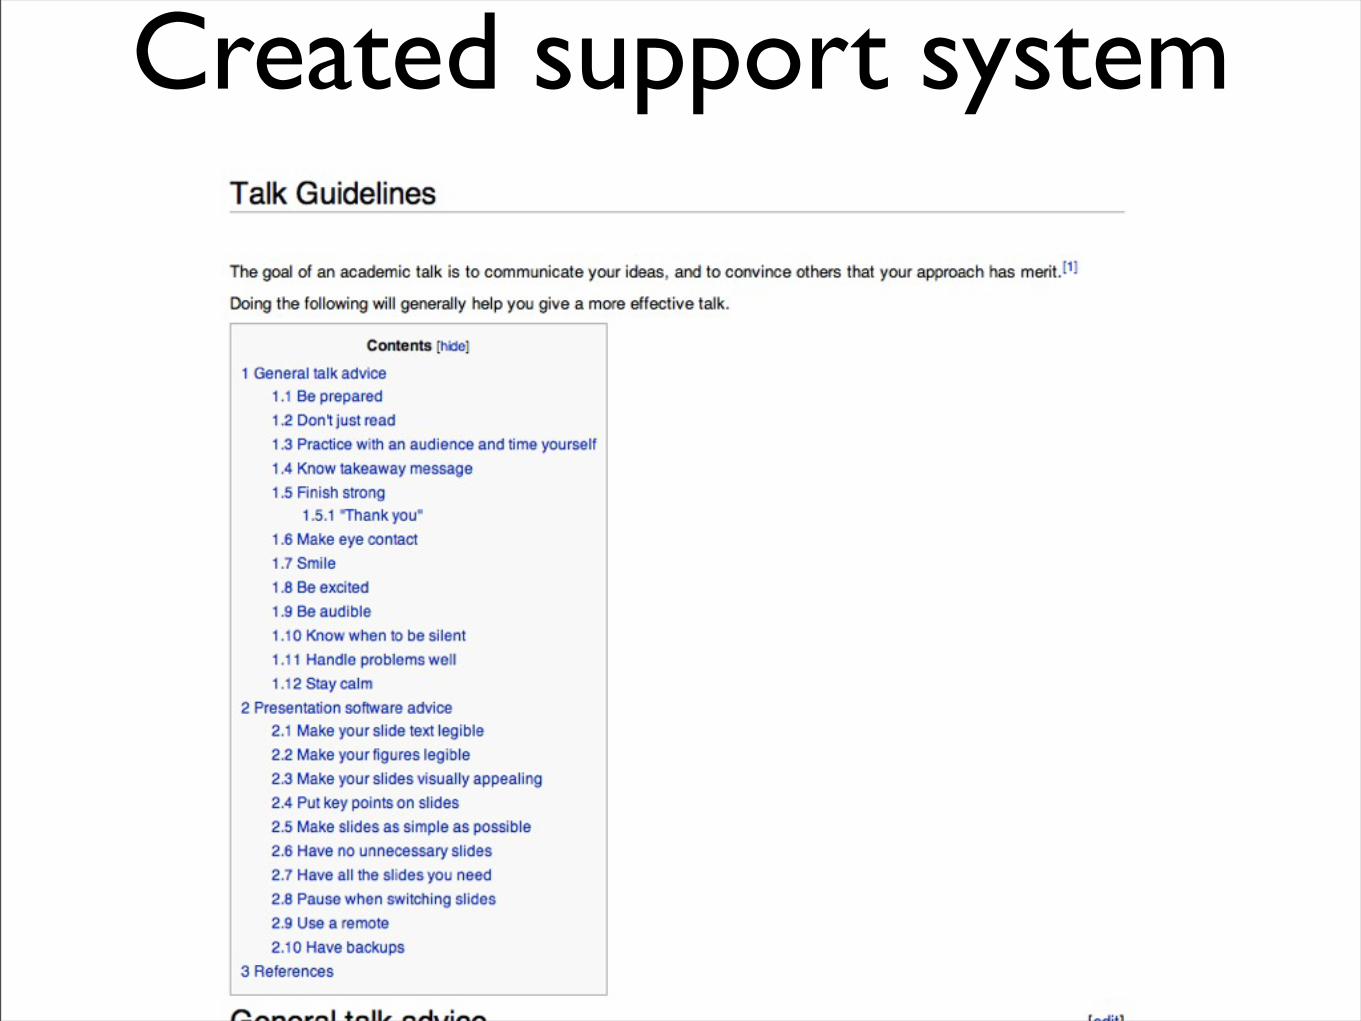
Created support system
Created support system
Created support system
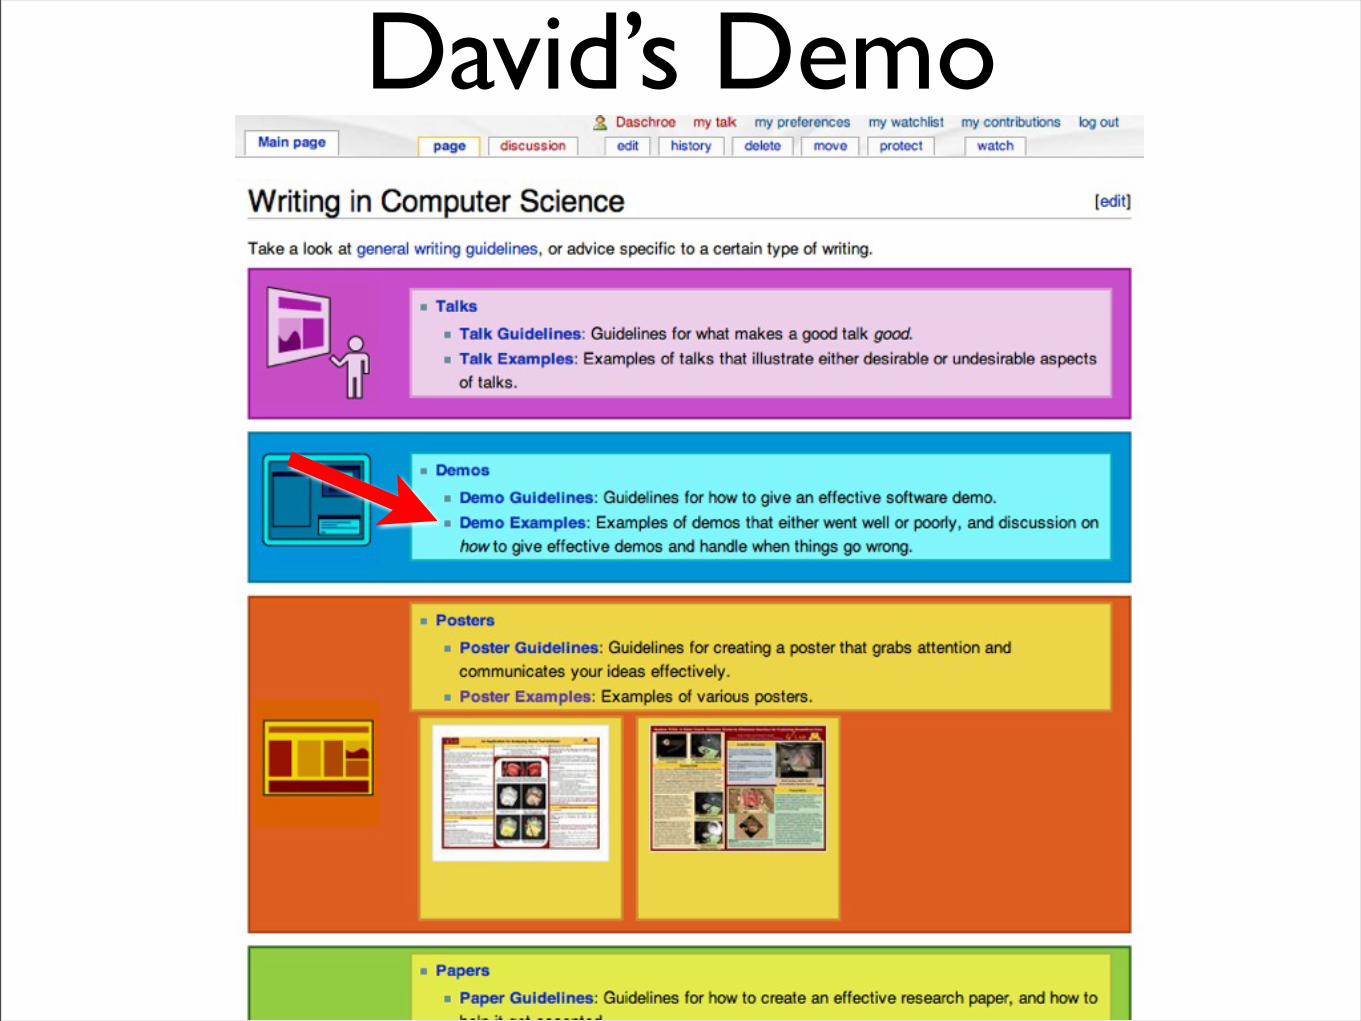
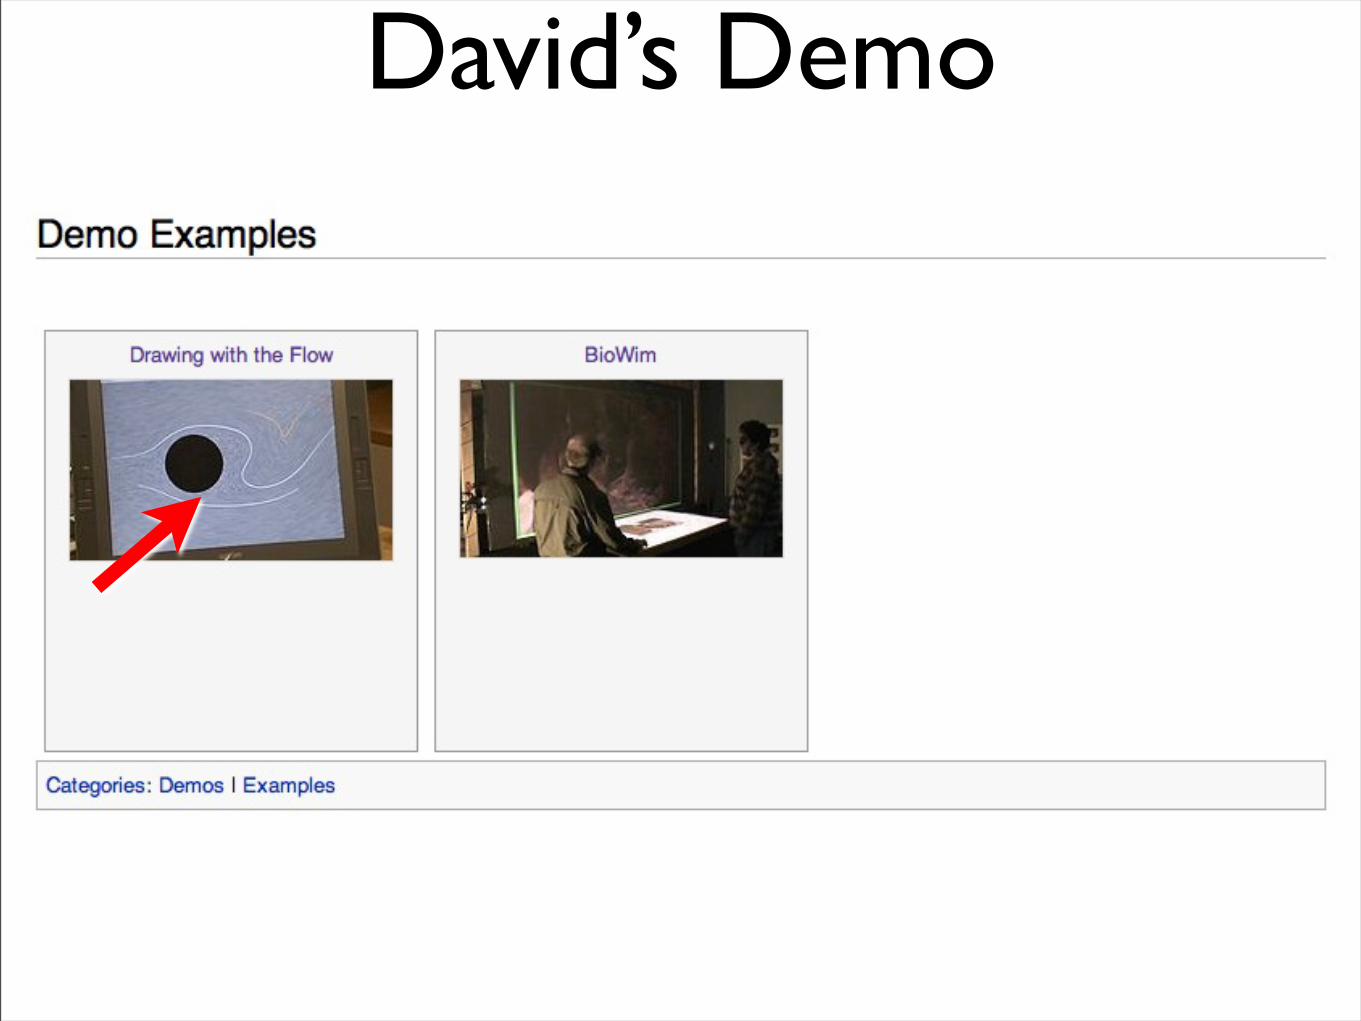
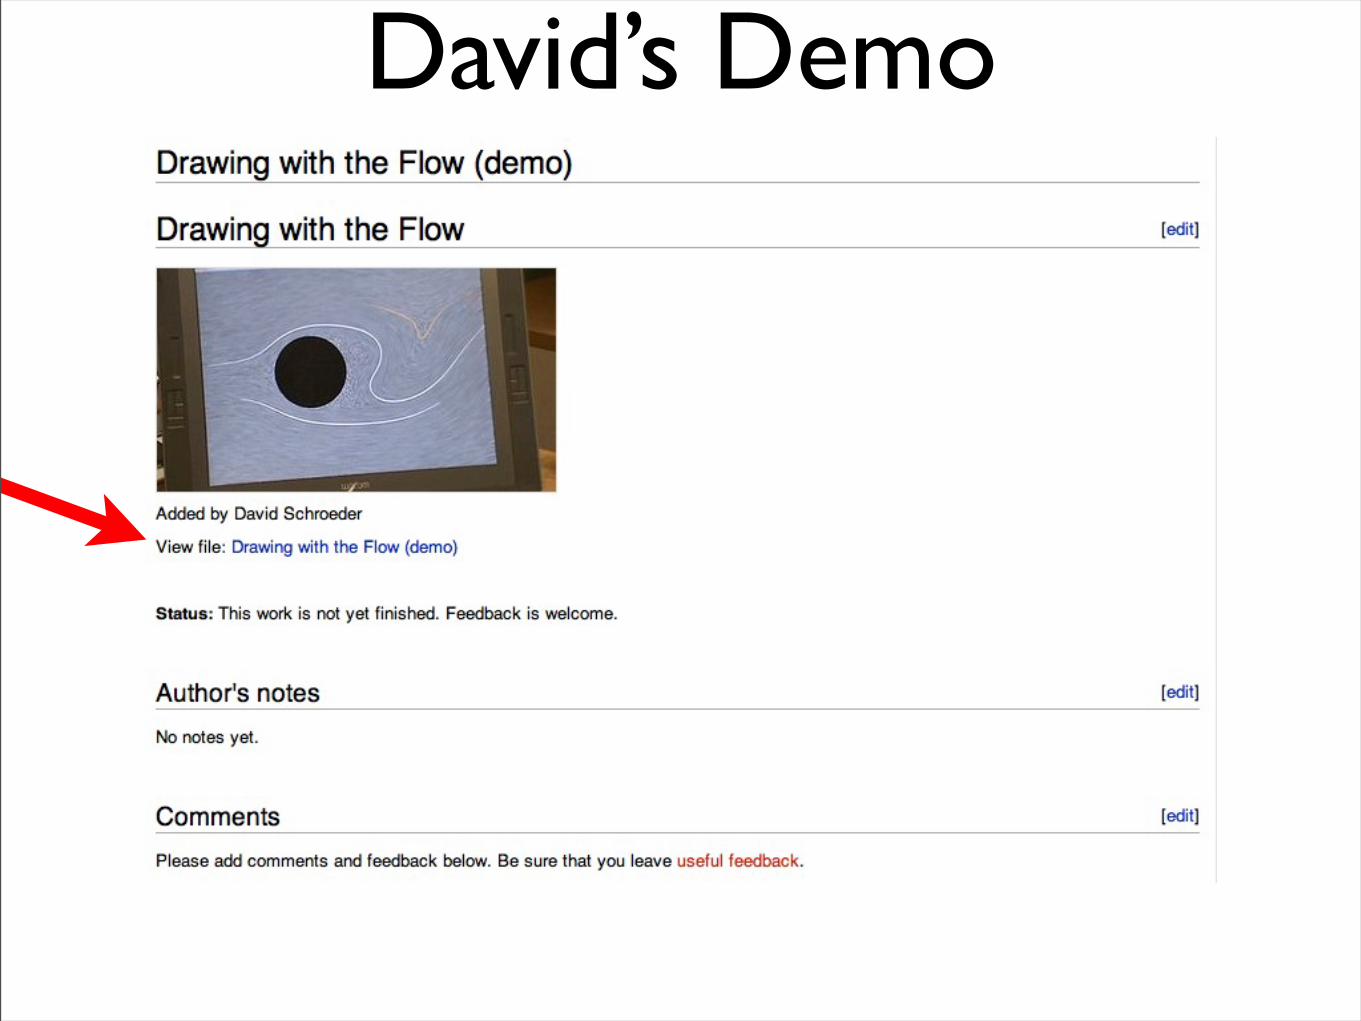
David’s Demo
David’s Demo
David’s Demo
David’s Demo
https://research.cs.umn.edu/mw_writing/index.php/Drawing_with_the_Flow_(demo)
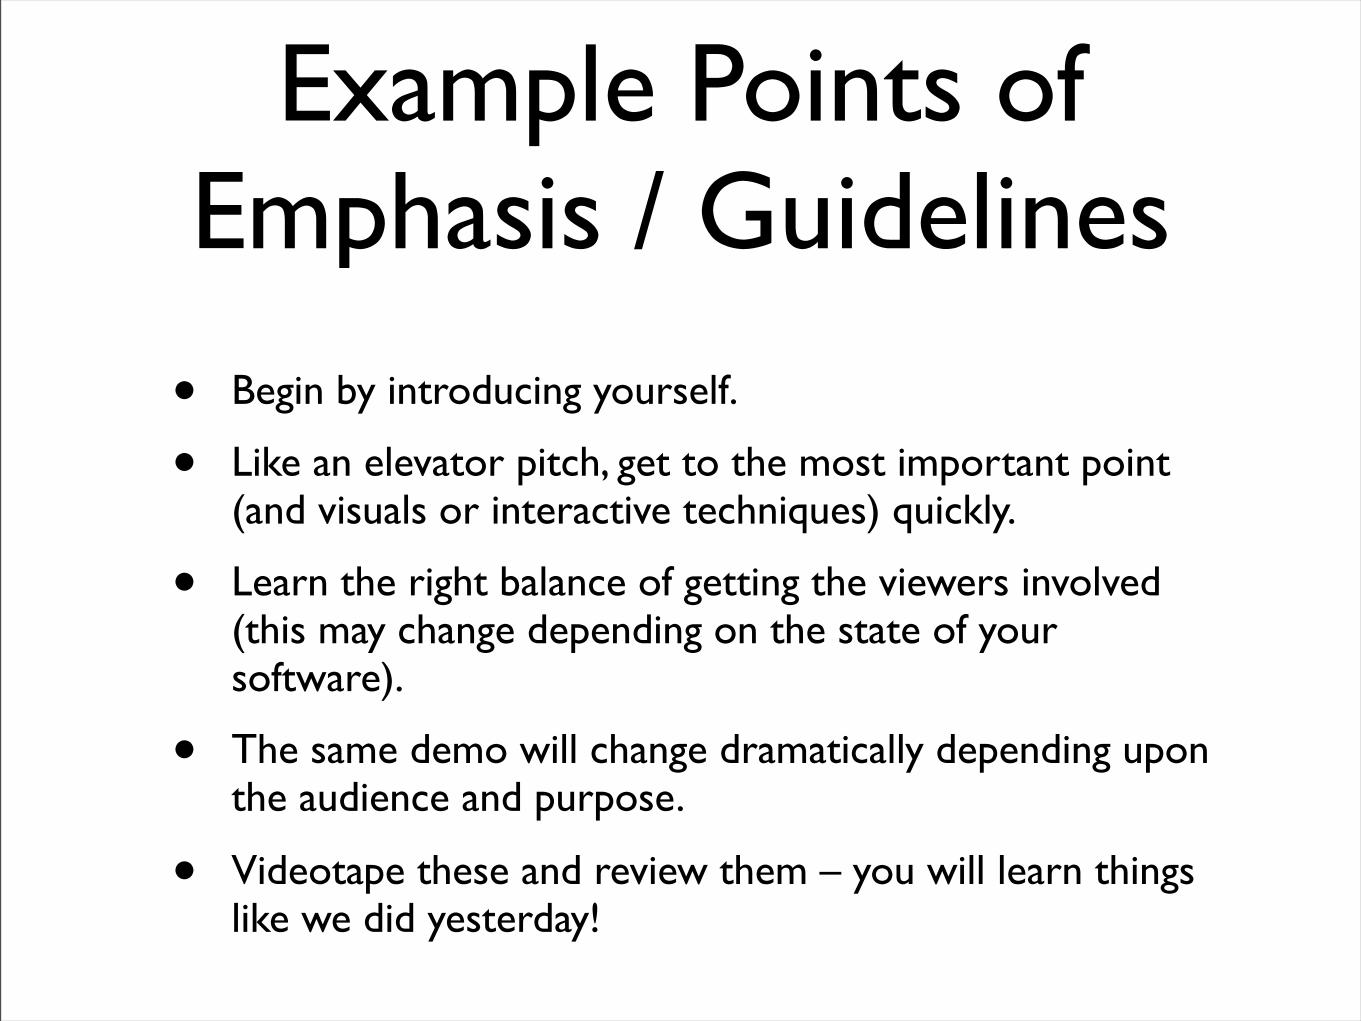
Example Points of Emphasis / Guidelines
• Begin by introducing yourself.
• Like an elevator pitch, get to the most important point (and visuals or interactive techniques) quickly.
• Learn the right balance of getting the viewers involved (this may change depending on the state of your software).
• The same demo will change dramatically depending upon the audience and purpose.
• Videotape these and review them – you will learn things like we did yesterday!
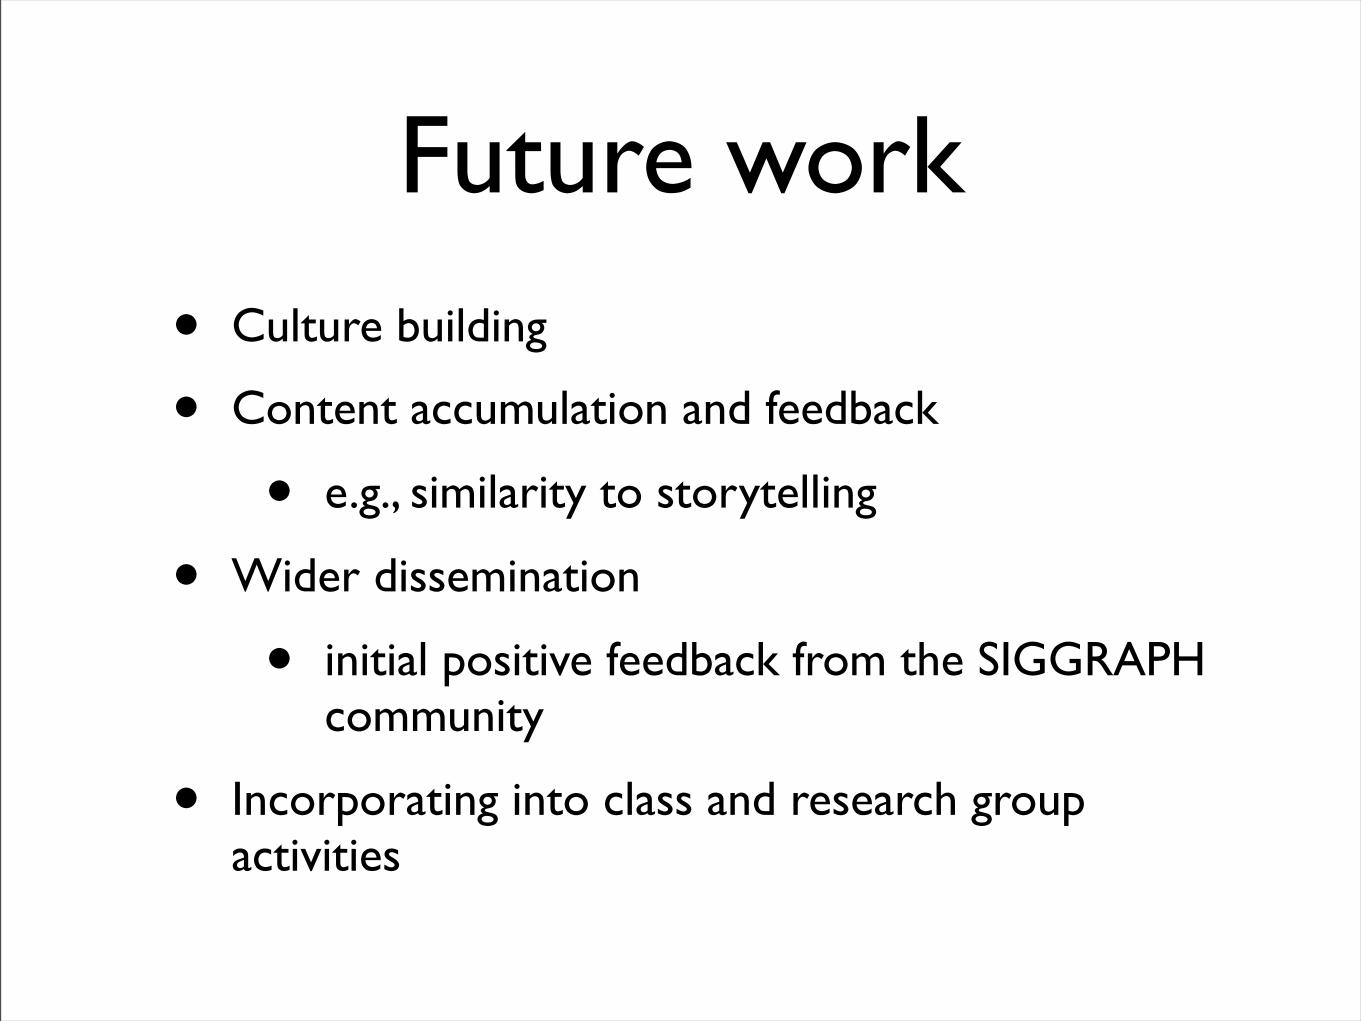
Future work• Culture building
• Content accumulation and feedback
• e.g., similarity to storytelling
• Wider dissemination
• initial positive feedback from the SIGGRAPH community
• Incorporating into class and research group activities

Thank you