integrating research findings across studies - sage publications
TRANSCRIPT
1Integrating Research Findings
Across Studies
Before we delve into an abstract discussion of methods, we would like to considera concrete example. The next section presents a set of studies to be reviewed, thena sample narrative review, followed by a critique of this review. It has been ourexperience that personal experience with the problems of such a review greatlyquickens the learning process.
General Problem and an Example
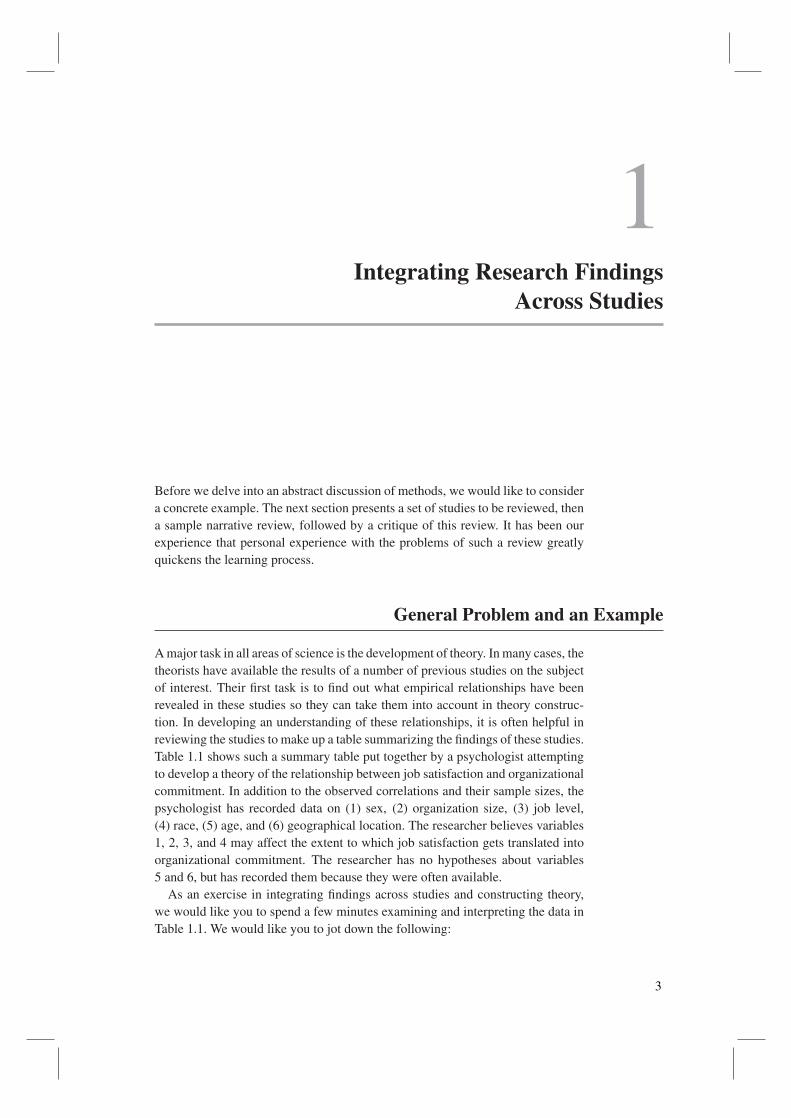
A major task in all areas of science is the development of theory. In many cases, thetheorists have available the results of a number of previous studies on the subjectof interest. Their first task is to find out what empirical relationships have beenrevealed in these studies so they can take them into account in theory construc-tion. In developing an understanding of these relationships, it is often helpful inreviewing the studies to make up a table summarizing the findings of these studies.Table 1.1 shows such a summary table put together by a psychologist attemptingto develop a theory of the relationship between job satisfaction and organizationalcommitment. In addition to the observed correlations and their sample sizes, thepsychologist has recorded data on (1) sex, (2) organization size, (3) job level,(4) race, (5) age, and (6) geographical location. The researcher believes variables1, 2, 3, and 4 may affect the extent to which job satisfaction gets translated intoorganizational commitment. The researcher has no hypotheses about variables5 and 6, but has recorded them because they were often available.
As an exercise in integrating findings across studies and constructing theory,we would like you to spend a few minutes examining and interpreting the data inTable 1.1. We would like you to jot down the following:
3
4 INTRODUCTION TO META-ANALYSIS
Table 1.1 Correlations between organizational commitment and jobsatisfaction
White Under NorthSize of vs. vs. vs.
Study N r Sex Organization Blue Collar Race Over 30 South
1 20 .46* F S WC B U N2 72 .32** M L BC Mixed Mixed N3 29 .10 M L WC W O N4 30 .45** M L WC W Mixed N5 71 .18 F L BC W O N6 62 .45** F S BC W U N7 25 .56** M S BC Mixed U S8 46 .41** F L WC W Mixed S9 22 .55** F S WC B U N
10 69 .44** F S BC W U N11 67 .34** M L BC W Mixed N12 58 .33** M S BC W U N13 23 .14 M S WC B O S14 20 .36 M S WC W Mixed N15 28 .54** F L WC W Mixed S16 30 .22 M S BC W Mixed S17 69 .31** F L BC W Mixed N18 59 .43** F L BC W Mixed N19 19 .52* M S BC W Mixed S20 44 –.10 M S WC W O N21 60 .44** F L BC Mixed Mixed N22 23 .50** F S WC W Mixed S23 19 –.02 M S WC B O S24 55 .32** M L WC W Mixed Unknown25 19 .19 F S WC B O N26 26 .53** F S BC B U S27 58 .30* M L WC W Mixed S28 25 .26 M S WC W U S29 28 .09 F S BC W O N30 26 .31 F S WC Mixed U S
*p < .05.
**p < .01.
1. The tentative conclusions you reached about the relationship between jobsatisfaction and organizational commitment and the variables that do and donot moderate that relationship
2. An outline of your resulting theory of this relationship
A Typical Interpretation of the Example Data
A typical report on the findings shown in Table 1.1 would run like this: Thecorrelation between occupational commitment and job satisfaction varies fromstudy to study with the correlation varying between −.10 and .56. Although
Integrating Research Findings Across Studies 5
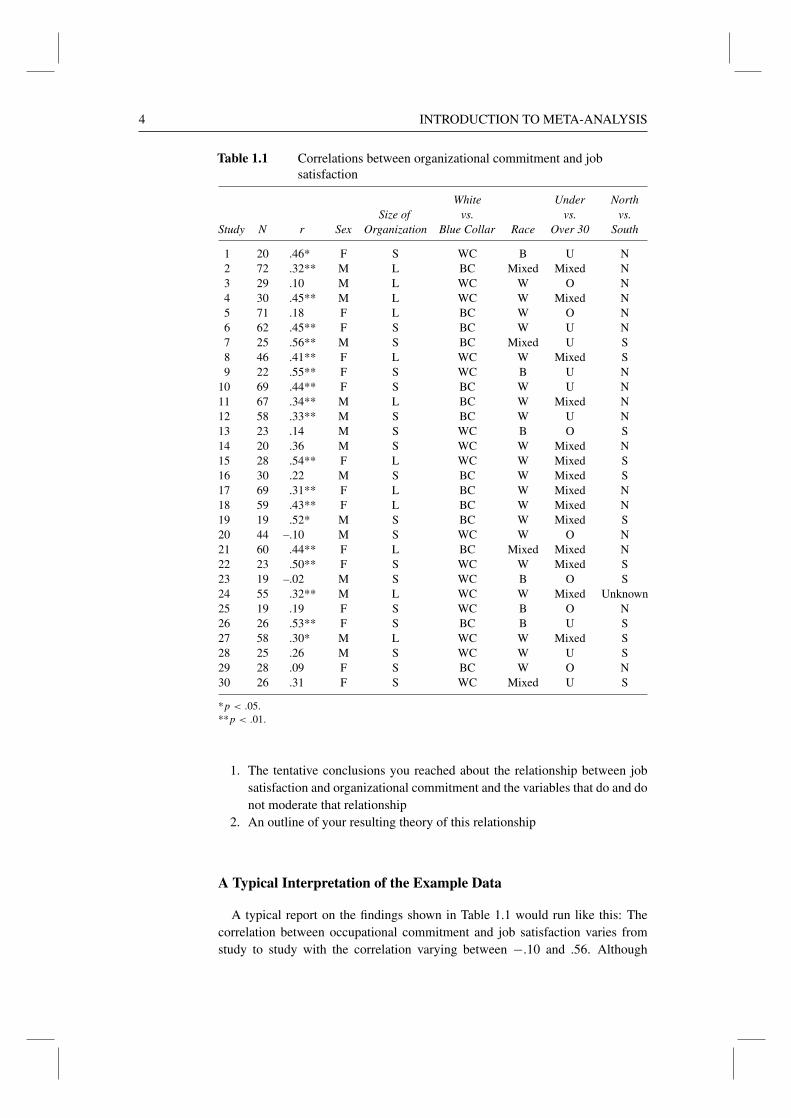
Table 1.2 Existence of correlation between organizational commitment and job satisfactionunder various conditions as shown by the studies in Table 1.1
OrganizationSize
Not SignificantSignificant
Job Level Race
Not SignificantSignificant
Not SignificantSignificant
Not SignificantSignificant
Not SignificantSignificant
Not SignificantSignificant
GeographicalLocation
Young
Age
Sex
M
BC
S
S
F
WC W B
N
L99
7
7
3 13313
20 6
6 5
17 12
4
210
7
8
2 7 27 0 12
9 7 14
38 11
16 14
48 11
1119
30
1119
301218
1118
29
11
1930
111930
11
11
1930
15 15
χ2 = 1.64
χ2 = .12χ2 = 16.12
χ2 = 2.62
Old Mix
Mix
χ2 = 3.44χ2 = 1.29
19 out of 30 studies found a significant correlation, 11 of 30 studies found norelationship between commitment and satisfaction. Why are commitment andsatisfaction correlated within some organizations and not within others?
Table 1.2 presents a breakdown of the findings according to the features ofthe organization and the nature of the work population being studied. For exam-ple, for male work populations, commitment and satisfaction were correlated in8 studies and not correlated in 7 (i.e., correlated in 53% of the studies), whilefor women there was a correlation in 11 of 15 cases (or in 73% of the studies).Correlation was found in 83% of the large organizations, but in only 50% ofthe small organizations. Correlation was found in 79% of the blue-collar popu-lations, but in only 50% of the white-collar populations. Correlation was foundin 67% of the populations that were all white or mixed race, while correlationwas found in only 50% of those work populations that were all black. Corre-lation was found in 83% of the cases in which the workforce was all under 30or a mixture of younger and older workers, while not a single study with onlyolder workers found a significant correlation. Finally, 65% of the studies done inthe North found a correlation, while only 58% of the southern studies found acorrelation.
6 INTRODUCTION TO META-ANALYSIS
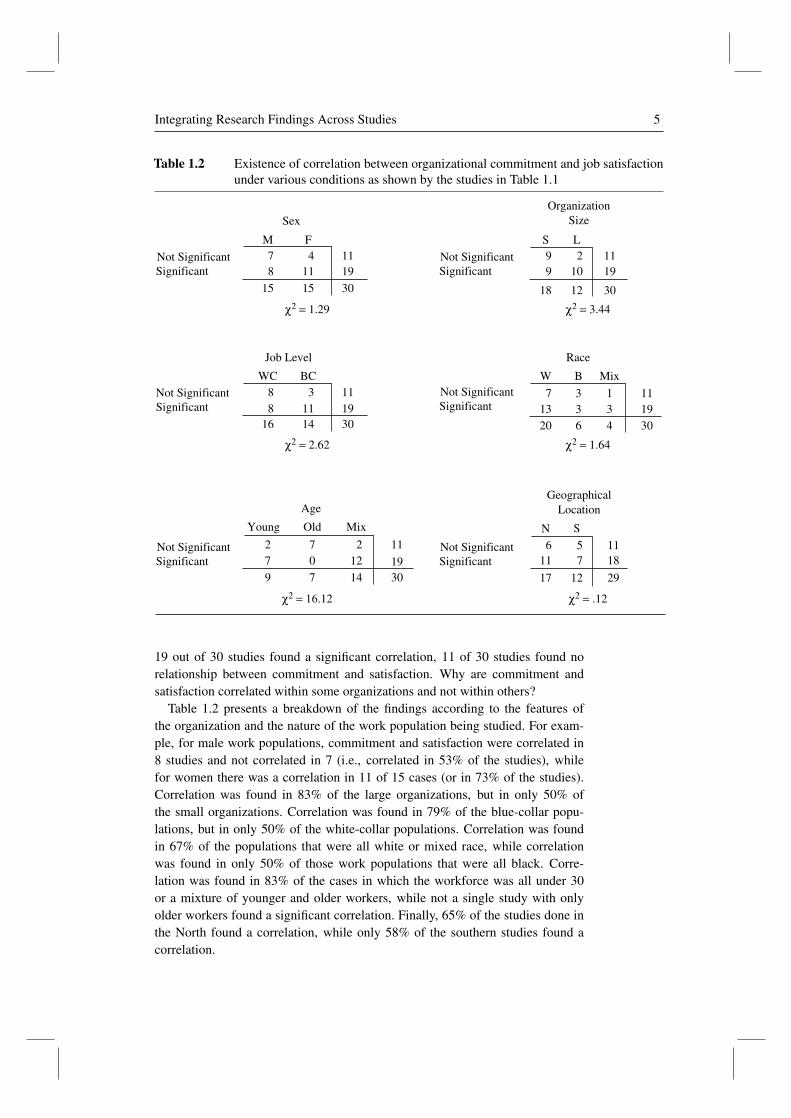
Table 1.3 Analysis of correlations from studies based on younger or mixed-age subjects
OrganizationSize
Not SignificantSignificant
Job Level Race
Not SignificantSignificant
Not SignificantSignificant
Not SignificantSignificant
Not SignificantSignificant
GeographicArea
Sex
M
BC
SF
WC W B
L49
3 0 13313
16 3 4
010
3
3 18 11
11 12
18 11
419
23
419
231013
41923
SN1 3
11 712 10
41822
41923
11 12
χ2 = .81; df = 2
χ2 = 1.72
χ2 = 1.43
Mix
χ2 = 3.72χ2 = 1.43
Each of the differences between work populations could be taken as the basisfor a hypothesis that there is an interaction between that characteristic and orga-nizational commitment in the determination of job satisfaction. However, somecaution must be urged because the only chi-square value that is significant inTable 1.2 is that for age. That is, the difference in the frequency of correlationbetween older and younger workers is significant (χ2 = 16.52; df = 2; p < .01),while the other differences can only be regarded as trends.
If the studies done on older workers are removed, then significant correlationis found for 19 of the remaining 23 studies. If these 23 cases are examinedfor relationship to organizational characteristics, then all of the chi squares arenonsignificant. These results are shown in Table 1.3. However, the chi squarefor size of organization is very close (χ2 = 3.72; 3.84 required). Within the 23studies with younger or mixed-age work populations, all 10 correlations for largeorganizations were significant.
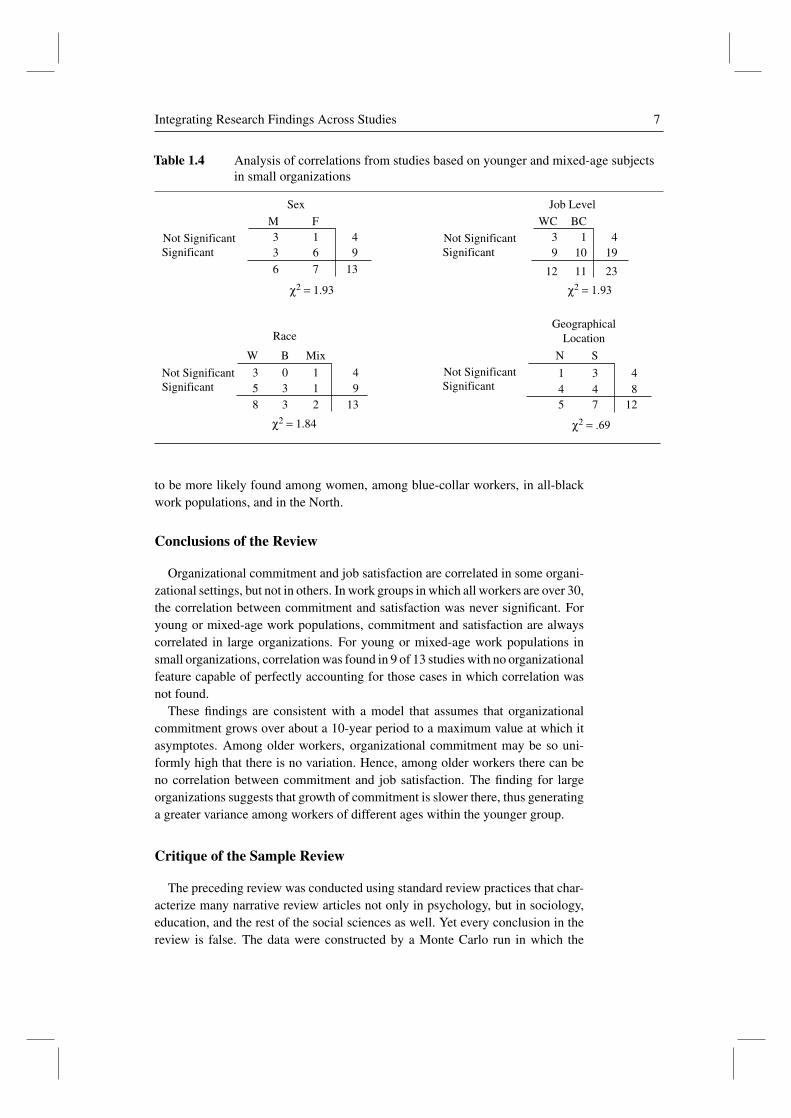
There are 13 studies of younger or mixed-age work populations in small orga-nizations. None of the chi-square values even approaches significance on thisset of studies, although with 13 cases the power of the chi-square test is low.These results are shown in Table 1.4. Within this group of studies, there is atendency for correlation between organizational commitment and job satisfaction
Integrating Research Findings Across Studies 7
Table 1.4 Analysis of correlations from studies based on younger and mixed-age subjectsin small organizations
Not SignificantSignificant
Job Level
Race
Not SignificantSignificant
Not SignificantSignificant
Not SignificantSignificant
GeographicalLocation
Sex
M WCF
W B N S
BC39
3 0 1135
8 3 2
110
3
1 34 45 7
13 6
49
13
419
231112
48
12
49
13
6 7
χ2 = 1.84 χ2 = .69
Mix
χ2 = 1.93χ2 = 1.93
to be more likely found among women, among blue-collar workers, in all-blackwork populations, and in the North.
Conclusions of the Review
Organizational commitment and job satisfaction are correlated in some organi-zational settings, but not in others. In work groups in which all workers are over 30,the correlation between commitment and satisfaction was never significant. Foryoung or mixed-age work populations, commitment and satisfaction are alwayscorrelated in large organizations. For young or mixed-age work populations insmall organizations, correlation was found in 9 of 13 studies with no organizationalfeature capable of perfectly accounting for those cases in which correlation wasnot found.
These findings are consistent with a model that assumes that organizationalcommitment grows over about a 10-year period to a maximum value at which itasymptotes. Among older workers, organizational commitment may be so uni-formly high that there is no variation. Hence, among older workers there can beno correlation between commitment and job satisfaction. The finding for largeorganizations suggests that growth of commitment is slower there, thus generatinga greater variance among workers of different ages within the younger group.
Critique of the Sample Review
The preceding review was conducted using standard review practices that char-acterize many narrative review articles not only in psychology, but in sociology,education, and the rest of the social sciences as well. Yet every conclusion in thereview is false. The data were constructed by a Monte Carlo run in which the
8 INTRODUCTION TO META-ANALYSIS
population correlation was always assumed to be .33. After a sample size wasrandomly chosen from a distribution centering about 40, an observed correlationwas chosen using the standard distribution for r with mean ρ = .33 and variance
(1 − ρ2)2
N − 1
That is, the variation in results in Table 1.1 is entirely the result of samplingerror. Each study is assumed to be conducted on a small sample and hence willgenerate an observed correlation that will depart by some random amount fromthe population value of .33. The size of the departure depends on the sample size.Note that the largest and smallest values found in Table 1.1 are all from studieswith very small samples. The larger sample size studies tend to be found in thecentral part of the range; that is, they tend to show less of a random departurefrom .33.
The moderator effects appear to make sense, yet they are purely the resultsof chance. The values for the organizational characteristics were assigned to thestudies randomly. The fact that one of the six was highly significant is due solelyto capitalization on sampling error.
The crucial lesson to be learned from this exercise is this: “Conflicting resultsin the literature” may be entirely artifactual. The data in Table 1.1 were generatedby using one artifact for generating false variation across studies, sampling error.There are other artifacts that are found in most sets of studies: Studies vary in termsof the quality of measurement in their scales; researchers make computationalor computer errors; people make typographical errors in copying numbers fromcomputer output or in copying numbers from handwritten tables onto manuscriptsor in setting tables into print; people study variables in settings with greater orsmaller ranges of individual differences; and so on. In our experience (to bedescribed later), many of the interactions hypothesized to account for differences infindings in different studies are nonexistent; that is, they are apparitions composedof the ectoplasm of sampling error and other artifacts.
Problems With Statistical Significance Tests
In the data set given in Table 1.1, all study population correlations are actually equalto .33. Of the 30 correlations, 19 were found to be statistically significant. However,11 of the 30 correlations were not significant. That is, the significance test gavethe wrong answer 11 out of 30 times, an error rate of 37%. In oral presentations,many express shock that the error rate can be greater than 5%. The significancetest was derived in response to the problem of sampling error, and many believethat the use of significance tests guarantees an error rate of 5% or less. This isjust not true. Statisticians have pointed this out for many years; the possibility ofhigh error rates is brought out in discussions of the “power” of statistical tests.However, statistics teachers are all well aware that this point is missed by moststudents. The 5% error rate is guaranteed only if the null hypothesis is true. If thenull hypothesis is false, then the error rate can go as high as 95%.
Integrating Research Findings Across Studies 9
Let us state this in more formal language. If the null hypothesis is true for thepopulation and our sample data lead us to reject it, then we have made a Type Ierror. If the null hypothesis is false for the population and our sample data lead usto accept it, then we have made a Type II error. The statistical significance test isdefined in such a way that the Type I error rate is at most 5%. However, the Type IIerror rate is left free to be as high as 95%. The question is which error rate appliesto a given study. The answer is that the relevant error rate can only be known ifwe know whether the null hypothesis is true or false for that study. If we knowthat the null hypothesis is true, then we know that the significance test has an errorrate of 5%. Of course, if we know that the null hypothesis is true and we still doa significance test, then we should wear a dunce cap, because if we know the nullhypothesis to be true, then we can obtain a 0% error rate by ignoring the data.That is, there is a fundamental circularity to the significance test. If you do notknow whether the null hypothesis is true or false, then you do not know whetherthe relevant error rate is Type I or Type II; that is, you do not know if your errorrate is 5% or some value as high as 95%. There is only one way to guarantee a 5%error rate in all cases: Abandon the significance test and use a confidence interval.
Consider our hypothetical example from Table 1.1. However, let us simplifythe example still further by assuming that the sample size is the same for allstudies, say N = 40. The one-tailed significance test for a correlation coefficientis
√N − 1 r ≥ 1.64; in our case,
√39r ≥ 1.64 or r ≥ .26. If the population
correlation is .33 and the sample size is 40, the mean of the sample correlations is.33, while the standard deviation is (1 − ρ2)/
√N − 1 = (1 − .332)/
√39 = .14.
Thus, the probability that the observed correlation will be significant is the proba-bility that the sample mean correlation will be greater than .26 when it has a meanof .33 and a standard deviation of .14:
P {r ≥ .26} = P
{r − .33
.14≥ .26 − .33
.14
}= P {z ≥ −.50} = .69
That is, if all studies were done with a sample size of 40, then a populationcorrelation of .33 would mean an error rate of 31% (i.e., 1 − .69 = .31).
Suppose we alter the population correlation in our hypothetical example from.33 to .20. Then the probability that the observed correlation will be significantdrops from .69 to
P {r ≥ .26} = P
{z ≥ .26 − .20
.15= .39
}= .35
That is, the error rate rises from 31% to 65%. In this realistic example, we seethat the error rate can be over 50%. A two-to-one majority of the studies can findthe correlation to be not significant despite the fact that the population correlationis always .20.
Error rates of over 50% have been shown to be the usual case in the personnelselection research literature. Thus, reviewers who count the number of significantfindings are prone to incorrectly conclude that a given procedure does not predictjob performance. Furthermore, as Hedges and Olkin (1980) pointed out, this situ-ation will only get worse as more studies are done. The reviewer will become evermore convinced that the majority of studies show no effect and that the effect thus
10 INTRODUCTION TO META-ANALYSIS
does not exist. Statistical power has been examined in many research literaturesin psychology, starting with Cohen (1962) and extending up to the present. Inmost literatures, the mean statistical power is in the .40 to .60 range and is as lowas .20 in some areas (Hunter, 1997; Schmidt, 1996; Schmidt & Hunter, 2003;Sedlmeier & Gigerenzer, 1989).
If the null hypothesis is true in a set of studies, then the base rate for significanceis not 50% but 5%. If more than 1 in 20 studies finds significance, then the nullhypothesis must be false in some studies. We must then avoid an error madeby some of the reviewers who know the 5% base rate. Given 35% significantfindings, some have concluded that “because 5% will be significant by chance,this means that the number of studies in which the null hypothesis is truly false is35 − 5 = 30%.” Our hypothetical example shows this reasoning to be false. If thepopulation correlation is .20 in every study and the sample size is always 40, thenthere will be significant findings in only 35% of the studies, even though the nullhypothesis is false in all cases.
The typical use of significance test results leads to gross errors in traditionalreview studies. Most such reviews falsely conclude that further research is neededto resolve the “conflicting results” in the literature. These errors in review studiescan only be eliminated if errors in the interpretation of significance tests can beeliminated. Yet those of us who have been teaching power to generation aftergeneration of graduate students have been unable to change the reasoning processesand the false belief in the 5% error rate (Sedlmeier & Gigerenzer, 1989).
This example illustrates a critical point. The traditional reliance on statisticalsignificance tests in interpreting studies leads to false conclusions about what thestudy results mean; in fact, the traditional approach to data analysis makes itvirtually impossible to reach correct conclusions in most research areas (Hunter,1997; Schmidt, 1996).
A common reaction to this critique of traditional reliance on significance testinggoes something like this: “Your explanation is clear but I don’t understand howso many researchers (and even some methodologists) could have been so wrongso long on a matter as important as the correct way to analyze data? How couldpsychologists and others have failed to see the pitfalls of significance testing?”Over the years, a number of methodologists have addressed this question (Carver,1978; Cohen, 1994; Guttman, 1985; Meehl, 1978; Oakes, 1986; Rozeboom,1960). For one thing, in their statistics classes young researchers have typicallybeen taught a lot about Type I error and very little about Type II error and statisticalpower. Thus, they are unaware that the error rate is very large in the typicalstudy; they tend to believe the error rate is the alpha level used (typically .05or .01). In addition, empirical research suggests that most researchers believethat the use of significance tests provides them with many nonexistent benefits inunderstanding their data. Most researchers believe that a statistically significantfinding is a “reliable” finding in the sense that it will replicate if a new study isconducted (Carver, 1978; Oakes, 1986; Schmidt, 1996). For example, they believethat if a result is significant at the .05 level, then the probability of replication insubsequent studies (if conducted) is 1.00 − .05 = .95. This belief is completelyfalse. The probability of replication is the statistical power of the study and is almostinvariably much lower than .95 (e.g., typically .50 or less). Most researchers also
Integrating Research Findings Across Studies 11
falsely believe that if a result is nonsignificant, one can conclude that it is probablyjust due to chance, another false belief, as illustrated in our example. There areother widespread but false beliefs about the usefulness of information providedby significance tests (Carver, 1978; Oakes, 1986). A recent discussion of thesebeliefs can be found in Schmidt (1996).
Another fact is relevant at this point: The physical sciences, such as physicsand chemistry, do not use statistical significance testing in interpreting their data(Cohen, 1990). It is no accident, then, that these sciences have not experienced thedebilitating problems described here that are inevitable when researchers rely onsignificance tests. Given that the physical sciences regard reliance on significancetesting as unscientific, it is ironic that so many psychologists defend the use of sig-nificance tests on grounds that such tests are the objective and scientifically correctapproach to data analysis and interpretation. In fact, it has been our experience thatpsychologists and other behavioral scientists who attempt to defend significancetesting usually equate null hypothesis statistical significance testing with scientifichypothesis testing in general. They argue that hypothesis testing is central to sci-ence and that the abandonment of significance testing would amount to an attemptto have a science without hypothesis testing. They falsely believe that significancetesting and hypothesis testing in science is one and the same thing. This belief istantamount to stating that physics, chemistry, and the other physical sciences arenot legitimate sciences because they are not built on hypothesis testing. Anotherlogical implication of this belief is that prior to the introduction of null hypothesissignificance testing by Fisher (1932) in the 1930s, no legitimate scientific researchwas possible. The fact is, of course, that there are many ways to test scientifichypotheses—and that significance testing is one of the least effective methods ofdoing this (Schmidt & Hunter, 1997).
Is Statistical Power the Solution?
Some researchers believe that the only problem with significance testing is lowpower and that if this problem could be solved there would be no problems withreliance on significance testing. These individuals see the solution as larger samplesizes. They believe that the problem would be solved if every researcher, beforeconducting each study, would calculate the number of subjects needed for “ade-quate” power (usually taken as power of .80) and then use that sample size. Whatthis position overlooks is that this requirement would make it impossible for moststudies ever to be conducted. At the start of research in a given area, the questionsare often of the form, “Does Treatment A have an effect?” (e.g., Does interpersonalskills training have an effect? Does this predictor have any validity?). If TreatmentA indeed has a substantial effect, the sample size needed for adequate power maynot be prohibitively large. But as research develops, subsequent questions tend totake the form, “Is the effect of Treatment A larger than the effect of TreatmentB?” (e.g., Is the effect of the new method of training larger than that of the oldmethod? Is Predictor A more valid than Predictor B?). The effect size then becomesthe difference between the two effects. Such effect sizes will often be small, and
12 INTRODUCTION TO META-ANALYSIS
the required sample sizes are therefore often quite large—1,000 or 2,000 or more(Schmidt & Hunter, 1978). And this is just to attain power of .80, which stillallows a 20% Type II error rate when the null hypothesis is false—an error ratemost would consider high. Many researchers cannot obtain that many subjects,no matter how hard they try; either it is beyond their resources or the subjectsare just unavailable at any cost. Thus, the upshot of this position would be thatmany—perhaps most—studies would not be conducted at all.
People advocating the power position say this would not be a loss. They arguethat a study with inadequate power contributes nothing and therefore should notbe conducted. Such studies, however, contain valuable information when com-bined with others like them in a meta-analysis. In fact, precise meta-analysisresults can be obtained based on studies that all have inadequate statistical powerindividually. The information in these studies is lost if these studies are neverconducted.
The belief that such studies are worthless is based on two false assumptions:(1) the assumption that every individual study must be able to justify a conclusionon its own, without reference to other studies, and (2) the assumption that everystudy should be analyzed using significance tests. One of the contributions ofmeta-analysis has been to show that no single study is adequate by itself to answera scientific question. Therefore, each study should be considered as a data pointto be contributed to a later meta-analysis. In addition, individual studies shouldbe analyzed using not significance tests but point estimates of effect sizes andconfidence intervals.
How, then, can we solve the problem of statistical power in individual studies?Actually, this problem is a pseudoproblem. It can be “solved” by discontinuingthe significance test. As Oakes (1986, p. 68) noted, statistical power is a legitimateconcept only within the context of statistical significance testing. If significancetesting is not used, then the concept of statistical power has no place and is notmeaningful. In particular, there need be no concern with statistical power whenpoint estimates and confidence intervals are used to analyze data in studies andmeta-analysis is used to integrate findings across studies.
Our critique of the traditional practice of reliance on significance testing inanalyzing data in individual studies and in interpreting research literatures mightsuggest a false conclusion, namely, that if significance tests had never been used,the research findings would have been consistent across different studies examininga given relationship. Consider the correlation between job satisfaction and jobperformance. Would these studies have all had the same findings if researchers hadnot relied on significance tests? Absolutely not: The correlations would have variedwidely (as indeed they did). The major reason for such variability in correlations issimple sampling error—caused by the fact that the small samples used in individualresearch studies are randomly unrepresentative of the populations from which theyare drawn. Most researchers severely underestimate the amount of variability infindings that is caused by sampling error.
The law of large numbers correctly states that large random samples are repre-sentative of their populations and yield parameter estimates that are close to the real(population) values. Many researchers seem to believe that the same law appliesto small samples. As a result, they erroneously expect statistics computed on
Integrating Research Findings Across Studies 13
small samples (e.g., 50 to 300) to be close approximations to the real (population)values. In one study we conducted (Schmidt, Ocasio, Hillery, & Hunter, 1985),we drew random samples (small studies) of N = 30 from a much larger data setand computed results on each N = 30 sample. These results varied dramaticallyfrom “study” to “study”—and all this variability was due solely to sampling error(Schmidt, Ocasio, et al., 1985). Yet when we showed these data to researchers,they found it hard to believe that each “study” was a random draw from thelarger study. They did not believe simple sampling error could produce that muchvariation. They were shocked because they did not realize how much variationsimple sampling error produces in research studies.
If there is an alternative analysis, then maybe it is time to abandon the signifi-cance test. There are two alternatives to the significance test. At the level of reviewstudies, there is meta-analysis. At the level of single studies, there is the confidenceinterval.
Confidence Intervals
Consider Studies 17 and 30 from our hypothetical example in Table 1.1. Study 17,with r = .31 and N = 69, finds the correlation to be significant at the .01 level.Study 30, with r = .31 and N = 26, finds the correlation to be not significant.That is, two authors with an identical finding, r = .31, come to opposite conclu-sions. Author 17 concludes that organizational commitment is highly related tojob satisfaction, while Author 30 concludes that they are independent. Thus, twostudies with identical findings can lead to a review author claiming “conflictingresults in the literature.”
The conclusions are quite different if the results are interpreted with confidenceintervals. Author 17 reports a finding of r = .31 with a 95% confidence intervalof .10 ≤ ρ ≤ .52. Author 30 reports a finding of r = .31 with a 95% confidenceinterval of −.04 ≤ ρ ≤ .66. There is no conflict between these results; the twoconfidence intervals overlap substantially. On the other hand, the fact recorded bythe significance test is still given in the two confidence intervals. Study 17 findsthat ρ = 0 is not a reasonable possibility, while Study 30 finds that ρ = 0 cannotbe ruled out. Thus, the two separate studies do not draw conclusions inconsistentwith the significance test. The two studies considered together, however, lead tothe correct conclusion if confidence intervals are used.
Consider now Studies 26 and 30 from Table 1.1. Study 26 finds r = .53 withN = 26, which is significant at the .01 level. Study 30 finds r = .31 with N = 26,which is not significant. That is, we have two studies with the same sample size butapparently widely divergent results. Using significance tests, one would concludethat there must be some moderator that accounts for the difference. This conclusionis false.
Had the two studies used confidence intervals, the conclusion would have beendifferent. The confidence interval for Study 26 is .25 ≤ ρ ≤ .81 and the confidenceinterval for Study 30 is −.04 ≤ ρ ≤ .66. It is true that the confidence interval forStudy 30 includes ρ = 0, while the confidence interval for Study 26 does not; this
14 INTRODUCTION TO META-ANALYSIS
is the fact registered by the significance test. The crucial thing, however, is that thetwo confidence intervals show an overlap of .25 ≤ ρ ≤ .66. Thus, considerationof the two studies together leads to the correct conclusion that it is possible thatboth studies could imply the same value for the population correlation ρ. Indeed,the overlapping intervals include the correct value, ρ = .33.
Two studies with the same population value can have nonoverlapping confidenceintervals, but this is a low-probability event (about 5%). But, then, confidenceintervals are not the optimal method for looking at results across studies; thatdistinction belongs to meta-analysis.
Confidence intervals are more informative than significance tests for tworeasons. First, the interval is correctly centered on the observed value rather than onthe hypothetical value of the null hypothesis. Second, the confidence interval givesthe author a correct image of the extent of uncertainty in small-subsample studies.It may be disconcerting to see a confidence interval as wide as −.04 ≤ ρ ≤ .66,but that is far superior to the frustration produced over the years by the false beliefin “conflicting results.”
Confidence intervals can be used to generate definitions for the phrase “smallsample size.” Suppose we want the confidence interval for the correlation coeffi-cient to define the correlation to the first digit, that is, to have a width of ±.05.Then, for small population correlations, the minimum sample size is approximately1,538. For a sample size of 1,000 to be sufficient, the population correlation mustbe at least .44. Thus, under this standard of accuracy, for correlational studies“small sample size” includes all studies with less than a thousand persons andoften extends above that.
There is a similar calculation for experimental studies. If the statistic used isthe d statistic (by far the most frequent choice), then small effect sizes will bespecified to their first digit only if the sample size is 3,076. If the effect size islarger, then the sample size must be even greater than 3,076. For example, if thedifference between the population means is .3 standard deviations or more, thenthe minimum sample size to yield accuracy to within ±.05 of .30 is 6,216. Thus,given this standard of accuracy, for experimental studies, “small sample size”begins with 3,000 and often extends well beyond that.
Since the publication of the first edition of this book in 1990, recognition ofthe superiority of confidence intervals and point estimates of effect sizes oversignificance tests has grown exponentially. The report of the task force on sig-nificance testing of the American Psychological Association (APA; Wilkinson &The APA Task Force on Statistical Inference, 1999) stated that researchers shouldreport effect size estimates and confidence intervals. The latest (5th) edition ofthe APA Publication Manual stated that it is almost always necessary for pri-mary studies to report effect size estimates and confidence intervals (AmericanPsychological Association, 2001). Twenty-one research journals in psychologyand education now require that these statistics be reported (Thompson, 2002).Some have argued that information on the methods needed to compute confidenceintervals is not widely available. However, there are now at least two helpful andinformative statistics textbooks designed around point estimates of effect size andconfidence intervals instead of significance testing (Lockhart, 1998; Smithson,2000). Thompson (2002) presented considerable information on computation of
Integrating Research Findings Across Studies 15
confidence intervals and cited many useful references that provide more detail(e.g., Kirk, 2001; Smithson, 2001). The August 2001 issue of Educational andPsychological Measurement was devoted entirely to methods of computing andinterpreting confidence intervals. There are now many other such publications(e.g., Borenstein, 1994, is an excellent reference on this).
Confidence intervals give a correct picture of the extent of uncertainty thatsurrounds results computed from small-sample studies (Hunter, 1997; Schmidt,1996). However, the only way to eliminate uncertainty is either to run large-samplesingle studies or to use meta-analysis to combine results across many small-samplestudies. Given the limited resources available to social scientists, this means thatthe only possible answer in most areas is meta-analysis.
Meta-Analysis
Is there a quantitative analysis that would have suggested that all the differences inTable 1.1 might stem from sampling error? Suppose we compute the variance ofthe correlations, weighting each by its sample size. The value we obtain is .02258(SD = .150). We can also compute the variance expected solely on the basis ofsampling error. The formula for the sampling error variance of each individualcorrelation ri is
(1 − .3312)2/(Ni − 1)
where .331 is the sample-size-weighted mean of the correlations in Table 1.1. Ifwe weight each of these estimates by its sample size (as we did when we computedthe observed variance), the formula for variance expected from sampling error is
S2e =
∑i=30i=1 [Ni(1 − .3312)2/Ni − 1]∑
Ni
This value is .02058 (SD = .144). The ratio of variance expected from samplingerror to actual (observed) variance is .02058/.02258 = .91. Thus, sampling erroralone accounts for an estimated 91% of the observed variance in the correlations.The best conclusion is probably that the relationship between job satisfactionand organizational commitment is constant across sexes, races, job levels, ages,geographical locations, and size of organization. (The remaining 9% of the vari-ance, a tiny value of only .00203, is probably due to other statistical artifacts—asdiscussed later.) The best estimate of this constant value is .331, the sample-size-weighted mean of the 30 correlations. Our analysis indicates that thisrelationship holds across ages, sexes, races, geographical locations, job levels,and different-sized organizations. When people in oral presentations analyzedthe data from these 30 studies qualitatively, different people came to differentconclusions. In contrast, all researchers applying the quantitative method usedhere would (barring arithmetic errors) come to exactly the same conclusion.
For theoretical purposes, the value .331 is not the one we want, because it isbiased downward by unreliability in both measures. That is, the effect of mea-surement error is to reduce all the observed correlations, and hence the mean
16 INTRODUCTION TO META-ANALYSIS
correlation, below the actual correlation between the two constructs. What weare interested in scientifically is the construct-level correlation. Suppose frominformation in the 30 studies we estimate the average reliability of job satisfac-tion measures at .70 and the average reliability of organizational commitmentmeasures at .60. Then the estimated correlation between true scores on the mea-sures is .331/
√.70(.60) = .51. This is the best estimate of the construct-level
correlation.Most artifacts other than sampling error that distort study findings are systematic
rather than random. They usually create a downward bias on the obtained studyr or d value. For example, all variables in a study must be measured and allmeasures of variables contain measurement error. (There are no exceptions to thisrule.) The effect of measurement error is to downwardly bias every correlation ord value. Measurement error can also contribute differences between studies: If themeasures used in one study have more measurement error than those used in anotherstudy, the observed rs or ds will be smaller in the first study. Thus, meta-analysismust correct both for the downward bias and for the artifactually created differencesbetween different studies. Corrections of this sort are discussed in Chapters 2 to 7.
Traditional review procedures are inadequate to integrate conflicting findingsacross large numbers of studies. As Glass (1976, p. 4) pointed out, the results ofhundreds of studies “can no more be grasped in our traditional narrative discursivereview than one can grasp the sense of 500 test scores without the aid of techniquesfor organizing, depicting and interpreting data.” In such areas as the effects ofclass size on student learning, the relationship of IQ to creativity, and the effectsof psychotherapy on patients, literally hundreds of studies can accumulate over aperiod of only a few years. Glass (1976) noted that such studies collectively containmuch more information than we have been able to extract from them to date. Hepointed out that because we have not exploited these gold mines of information,“we know much less than we have proven.” What is needed are methods thatwill integrate results from existing studies to reveal patterns of relatively invariantunderlying relationships and causalities, the establishment of which will constitutegeneral principles and cumulative knowledge.
At one time in the history of psychology and the social sciences, the pressingneed was for more empirical studies examining the problem in question. In manyareas of research, the need today is not for additional empirical data but for somemeans of making sense of the vast amounts of data that have been accumulated.Because of the increasing number of areas within psychology and the othersocial sciences in which the number of available studies is quite large and theimportance to theory development and practical problem solving of integratingconflicting findings to establish general knowledge, meta-analysis has come toplay an increasingly important role in research. Such methods can be built aroundstatistical and psychometric procedures that are already familiar to us. As Glass(1976, p. 6) stated,
Most of us were trained to analyze complex relationships among variables in the primaryanalysis of research data. But at the higher level, where variance, nonuniformity anduncertainty are no less evident, we too often substitute literary exposition for quantitativerigor. The proper integration of research requires the same statistical methods that areapplied in primary data analysis.
Integrating Research Findings Across Studies 17
Role of Meta-Analysis in the Behavioraland Social Sciences
The small-sample studies typical of psychological research produce seeminglycontradictory results, and reliance on statistical significance tests causes studyresults to appear even more conflicting. Meta-analysis integrates the find-ings across such studies to reveal the simpler patterns of relationships thatunderlie research literatures, thus providing a basis for theory development.Meta-analysis can correct for the distorting effects of sampling error, mea-surement error, and other artifacts that produce the illusion of conflictingfindings.
The goal in any science is the production of cumulative knowledge. Ultimately,this means the development of theories that explain the phenomena that are thefocus of the scientific area. One example would be theories that explain howpersonality traits develop in children and adults over time and how these traitsaffect their lives. Another would be theories of what factors cause job and careersatisfaction and what effects job satisfaction in turn has on other aspects of one’slife. Before theories can be developed, however, we need to be able to preciselycalibrate the relationships between variables. For example, what is the relationshipbetween peer socialization and level of extroversion? The relationship between jobsatisfaction and job performance?
Unless we can precisely calibrate such relationships among variables, we donot have the raw materials out of which to construct theories. There is nothingfor a theory to explain. For example, if the relationship between extrover-sion and popularity of children varies capriciously across different studies froma strong positive to a strong negative correlation and everything in between,we cannot begin to construct a theory of how extroversion might affect pop-ularity. The same applies to the relationship between job satisfaction and jobperformance.
The unfortunate fact is that most research literatures do show conflicting findingsof this sort. Some studies find statistically significant relationships and some donot. In many research literatures, this split is approximately 50–50 (Cohen, 1962,1988; Schmidt, Hunter, & Urry, 1976; Sedlmeier & Gigerenzer, 1989). This hasbeen the traditional situation in most areas of the behavioral and social sciences.Hence, it has been very difficult to develop understanding, theories, and cumulativeknowledge.
The Myth of the Perfect Study
Before meta-analysis, the usual way in which scientists attempted to makesense of research literatures was by use of the narrative subjective review. Inmany research literatures, however, there were not only conflicting findings, therewere also large numbers of studies. This combination made the standard narrativesubjective review a nearly impossible task—one shown by research on humaninformation processing to be far beyond human capabilities. How does one sitdown and make sense of, say, 210 conflicting studies?
18 INTRODUCTION TO META-ANALYSIS
The answer as developed in many narrative reviews was what came to be calledthe myth of the perfect study. Reviewers convinced themselves that most—usuallythe vast majority—of the studies available were “methodologically deficient” andshould not even be considered in the review. These judgments of methodologicaldeficiency were often based on idiosyncratic ideas: One reviewer might regard thePeabody Personality Inventory as “lacking in construct validity” and throw out allstudies that used that instrument. Another might regard use of that same inventoryas a prerequisite for methodological soundness and eliminate all studies not usingthis inventory. Thus, any given reviewer could eliminate from consideration allbut a few studies and perhaps narrow the number of studies from 210 to, say, 7.Conclusions would then be based on these 7 studies.
It has long been the case that the most widely read literature reviews arethose appearing in textbooks. The function of textbooks, especially advanced-level textbooks, is to summarize what is known in a given field. No textbook,however, can cite and discuss 210 studies on a single relationship. Textbookauthors would often pick out what they considered to be the one or two “best”studies and then base textbook conclusions on just those studies, discarding thevast bulk of the information in the research literature. Hence, the myth of theperfect study.
In fact, there are no perfect studies. All studies contain measurement error in allmeasures used, as discussed later. Independent of measurement error, no study’smeasures have perfect construct validity. Furthermore, there are typically otherartifacts that distort study findings. Even if a hypothetical (and it would have to behypothetical) study suffered from none of these distortions, it would still containsampling error—typically a substantial amount of sampling error—because samplesizes are rarely very large. Hence, no single study or small selected subgroup ofstudies can provide an optimal basis for scientific conclusions about cumulativeknowledge. As a result, reliance on “best studies” did not provide a solution to theproblem of conflicting research findings. This procedure did not even successfullydeceive researchers into believing it was a solution—because different narrativereviewers arrived at different conclusions because they selected a different subsetof “best” studies. Hence, the “conflicts in the literature” became “conflicts betweenthe reviews.”
Some Relevant History
By the mid-1970s, the behavioral and social sciences were in serious trouble.Large numbers of studies had accumulated on many questions that were importantto theory development or social policy decisions. Results of different studies onthe same question typically were conflicting. For example, are workers moreproductive when they are satisfied with their jobs? The studies did not agree.Do students learn more when class sizes are smaller? Research findings were con-flicting. Does participative decision making in management increase productivity?Does job enlargement increase job satisfaction and output? Does psychotherapyreally help people? The studies were in conflict. As a consequence, the public andgovernment officials were becoming increasingly disillusioned with the behavioral
Integrating Research Findings Across Studies 19
and social sciences, and it was becoming more and more difficult to obtain fundingfor research. In an invited address to the American Psychological Association in1970, then Senator Walter Mondale expressed his frustration with this situation:
What I have not learned is what we should do about these problems. I had hoped to findresearch to support or to conclusively oppose my belief that quality integrated educationis the most promising approach. But I have found very little conclusive evidence. Forevery study, statistical or theoretical, that contains a proposed solution or recommenda-tion, there is always another, equally well documented, challenging the assumptionsor conclusions of the first. No one seems to agree with anyone else’s approach.But more distressing I must confess, I stand with my colleagues confused and oftendisheartened.
Then, in 1981, the Director of the Federal Office of Management and Budget,David Stockman, proposed an 80% reduction in federal funding for research in thebehavioral and social sciences. (This proposal was politically motivated in part,but the failure of behavioral and social science research to be cumulative createdthe vulnerability to political attack.) This proposed cut was a trial balloon sent upto see how much political opposition it would arouse. Even when proposed cutsare much smaller than a draconian 80%, constituencies can usually be counted onto come forward and protest the proposed cuts. This usually happens, and manybehavioral and social scientists expected it to happen. But it did not. The behavioraland social sciences, it turned out, had no constituency among the public; the publicdid not care (see “Cuts Raise New Social Science Query,” 1981). Finally, out ofdesperation, the American Psychological Association took the lead in forming theConsortium of Social Science Associations to lobby against the proposed cuts.Although this superassociation had some success in getting these cuts reduced(and even, in some areas, getting increases in research funding in subsequentyears), these developments should make us look carefully at how such a thingcould happen.
The sequence of events that led to this state of affairs was much the samein one research area after another. First, there was initial optimism about usingsocial science research to answer socially important questions. Do government-sponsored job-training programs work? We will do studies to find out. Does HeadStart really help disadvantaged kids? The studies will tell us. Does integrationincrease the school achievement of black children? Research will provide theanswer. Next, several studies on the question are conducted, but the results areconflicting. There is some disappointment that the question has not been answered,but policymakers—and people in general—are still optimistic. They, along withthe researchers, conclude that more research is needed to identify the supposedinteractions (moderators) that have caused the conflicting findings. For example,perhaps whether job training works depends on the age and education of thetrainees. Maybe smaller classes in the schools are beneficial only for lower IQchildren. It is hypothesized that psychotherapy works for middle-class but notworking-class patients. That is, the conclusion at this point is that a search formoderator variables in needed.
In the third phase, a large number of research studies are funded and conductedto test these moderator hypotheses. When they are completed, there is now a largebody of studies, but instead of being resolved, the number of conflicts increases.
20 INTRODUCTION TO META-ANALYSIS
The moderator hypotheses from the initial studies are not borne out, and no onecan make sense out of the conflicting findings. Researchers conclude that thequestion that was selected for study in this particular case has turned out to behopelessly complex. They then turn to the investigation of another question, hopingthat this time the question will turn out to be more tractable. Research sponsors,government officials, and the public become disenchanted and cynical. Researchfunding agencies cut money for research in this area and in related areas. After thiscycle has been repeated enough times, social and behavioral scientists themselvesbecome cynical about the value of their own work, and they publish articlesexpressing doubts about whether behavioral and social science research is capable,in principle, of developing cumulative knowledge and providing general answersto socially important questions. Examples of this include Cronbach (1975),Gergen (1982), and Meehl (1978).
Clearly, at this point, there was a critical need for some means of making senseof the vast number of accumulated study findings. Starting in the late 1970s, newmethods of combining findings across studies on the same subject were developed.These methods were referred to collectively as meta-analysis, a term coined byGlass (1976). Applications of meta-analysis to accumulated research literatures(e.g., Schmidt & Hunter, 1977) showed that research findings were not nearlyas conflicting as had been thought and that useful and sound general conclusionscould, in fact, be drawn from existing research. The conclusion was that cumulativetheoretical knowledge is possible in the behavioral and social sciences, and sociallyimportant questions can be answered in reasonably definitive ways. As a result, thegloom and cynicism that had enveloped many in the behavioral and social scienceshas been lifting.
In fact, meta-analysis has even produced evidence that cumulativeness ofresearch findings in the behavioral sciences is probably as great as that in thephysical sciences. We have long assumed that our research studies are less replica-ble than those in the physical sciences. Hedges (1987) used meta-analysis methodsto examine variability of findings across studies in 13 research areas in particlephysics and 13 research areas in psychology. Contrary to common belief, hisfindings showed that there was as much variability across studies in physics asthere was in psychology. Furthermore, he found that the physical sciences usedmethods to combine findings across studies that were “essentially identical” tometa-analysis. The research literature in both areas—psychology and physics—yielded cumulative knowledge when meta-analysis was properly applied. Hedges’smajor finding is that the frequency of conflicting research findings is probably nogreater in the behavioral and social sciences than in the physical sciences. Thefact that this finding has been so surprising to many social scientists points upthe fact that we have long overestimated the consistency of research findings inthe physical sciences. In the physical sciences also, no research question can beanswered by a single study, and physical scientists must use meta-analysis to makesense of their research literature, just as we do (and, as noted earlier, the physicalsciences do not use significance tests).
Other changes have also been produced by meta-analysis. The relative status ofreviews has changed dramatically. Journals that formerly published only primarystudies and refused to publish reviews now publish meta-analytic reviews in large
Integrating Research Findings Across Studies 21
numbers. In the past, research reviews were based on the narrative subjectivemethod, and they had limited status and gained little credit for one in academicraises or promotions. Perhaps this was appropriate because such reviews rarelycontributed to cumulative knowledge. The rewards went to those who did primaryresearch. Not only is this no longer the case, but there has been a more importantdevelopment. Today, many discoveries and advances in cumulative knowledgeare being made not by those who do primary research studies, but by those whouse meta-analysis to discover the latent meaning of existing research literatures.A behavioral or social scientist today with the needed training and skills canmake major original discoveries and contributions by mining the untapped veinsof information in accumulated research literatures.
The meta-analytic process of cleaning up and making sense of researchliteratures not only reveals the cumulative knowledge that is there, but also providesclearer directions about what the remaining research needs are. That is, we alsolearn what kinds of primary research studies are needed next. However, some haveraised the concern that meta-analysis may be killing the motivation and incentive toconduct primary research studies. Meta-analysis has clearly shown that no singleprimary study can ever resolve an issue or answer a question. Research findingsare inherently probabilistic (Taveggia, 1974), and, therefore, the results of anysingle study could have occurred by chance. Only meta-analytic integration offindings across studies can control sampling error and other artifacts and provide afoundation for conclusions. And yet meta-analysis is not possible unless the neededprimary studies are conducted. In new research areas, this potential problem is notof much concern. The first study conducted on a question contains 100% of theavailable research information, the second contains roughly 50%, and so on. Thus,the early studies in any area have a certain status. The 50th study, however, containsonly about 2% of the available information, and the 100th, about 1%. Will we havedifficulty motivating researchers to conduct the 50th or 100th study? If we do, wedo not believe this will be due to meta-analysis. When the narrative review was thedominant method of research integration, reviewers did not base their conclusionson single studies, but on multiple studies. So no researcher could reasonably hopethen—as now—that his or her single study could decide an issue. In fact, meta-analysis represents an improvement for the primary researcher in one respect—allavailable relevant studies are included in a meta-analysis and hence every studyhas an effect. As we saw earlier, narrative reviewers often threw out most relevantstudies and based their conclusions on a handful of their favorite studies. Also,it should be noted that those who raise this question overlook a beneficial effectthat meta-analysis has had: It prevents the diversion of valuable research resourcesinto truly unneeded research studies. Meta-analysis applications have revealedthat there are questions on which additional research would waste scientificallyand socially valuable resources. For example, already as of 1980, 882 studies basedon a total sample of 70,935 had been conducted relating measures of perceptualspeed to the job performance of clerical workers. Based on these studies, our meta-analytic estimate of this correlation is .47 (SDρ = .22; Pearlman, Schmidt, &Hunter, 1980). For other abilities, there were often 200 to 300 cumulative studies.Clearly, further research on these relationships is not the best use of availableresources.
22 INTRODUCTION TO META-ANALYSIS
Role of Meta-Analysis in Theory Development
As noted earlier, the major task in the behavioral and social sciences, as in othersciences, is the development of theory. A good theory is simply a good expla-nation of the processes that actually take place in a phenomenon. For example,what actually happens when employees develop a high level of organizationalcommitment? Does job satisfaction develop first and then cause the developmentof commitment? If so, what causes job satisfaction to develop and how does itaffect commitment? How do higher levels of mental ability cause higher levels ofjob performance? Only by increasing job knowledge? Or also by directly improv-ing problem solving on the job? The social scientist is essentially a detective;his or her job is to find out why and how things happen the way they do. Toconstruct theories, however, we must first know some of the basic facts, such asthe empirical relationships among variables. These relationships are the buildingblocks of theory. For example, if we know there is a high and consistent populationcorrelation between job satisfaction and organization commitment, this will sendus in particular directions in developing our theory. If the correlation betweenthese variables is very low and consistent, theory development will branch indifferent directions. If the relationship is highly variable across organizations andsettings, we will be encouraged to advance interactive or moderator-based theories.Meta-analysis provides these empirical building blocks for theory. Meta-analyticfindings tell us what it is that needs to be explained by the theory. Meta-analysishas been criticized because it does not directly generate or develop theory (Guzzo,Jackson, & Katzell, 1986). This is akin to criticizing word processors because theydo not generate books on their own. The results of meta-analysis are indispensablefor theory construction; but theory construction itself is a creative process distinctfrom meta-analysis.
As implied in the language used in our discussion, theories are causal explana-tions. The goal in every science is explanation, and explanation is always causal. Inthe behavioral and social sciences, the methods of path analysis (see, e.g., Hunter &Gerbing, 1982) and structural equation modeling (SEM) can be used to test causaltheories when the data meet the assumptions of the method. The relationshipsrevealed by meta-analysis—the empirical building blocks for theory—can be usedin path analysis and SEM to test causal theories. Experimentally determinedrelationships can also be entered into path analyses along with observationallybased relationships. It is only necessary to transform d values to correlations (seeChapters 6 and 7). Thus, path analyses can be “mixed.” Path analysis and SEMcannot demonstrate that a theory is correct but can disconfirm a theory, that is, showthat it is not correct. Path analysis can therefore be a powerful tool for reducingthe number of theories that could possibly be consistent with the data, sometimesto a very small number, and sometimes to only one theory (Hunter, 1988). Foran example, see Hunter (1983f). Every such reduction in the number of possibletheories is an advance in understanding.
Application of path analysis or SEM requires either the correlations amongthe theoretically relevant variables (correlation matrix) or the covariances amongthe variables (variance-covariance matrix). Meta-analysis can be used to createcorrelation matrices for the variables of interest. Because each meta-analysis can
Integrating Research Findings Across Studies 23
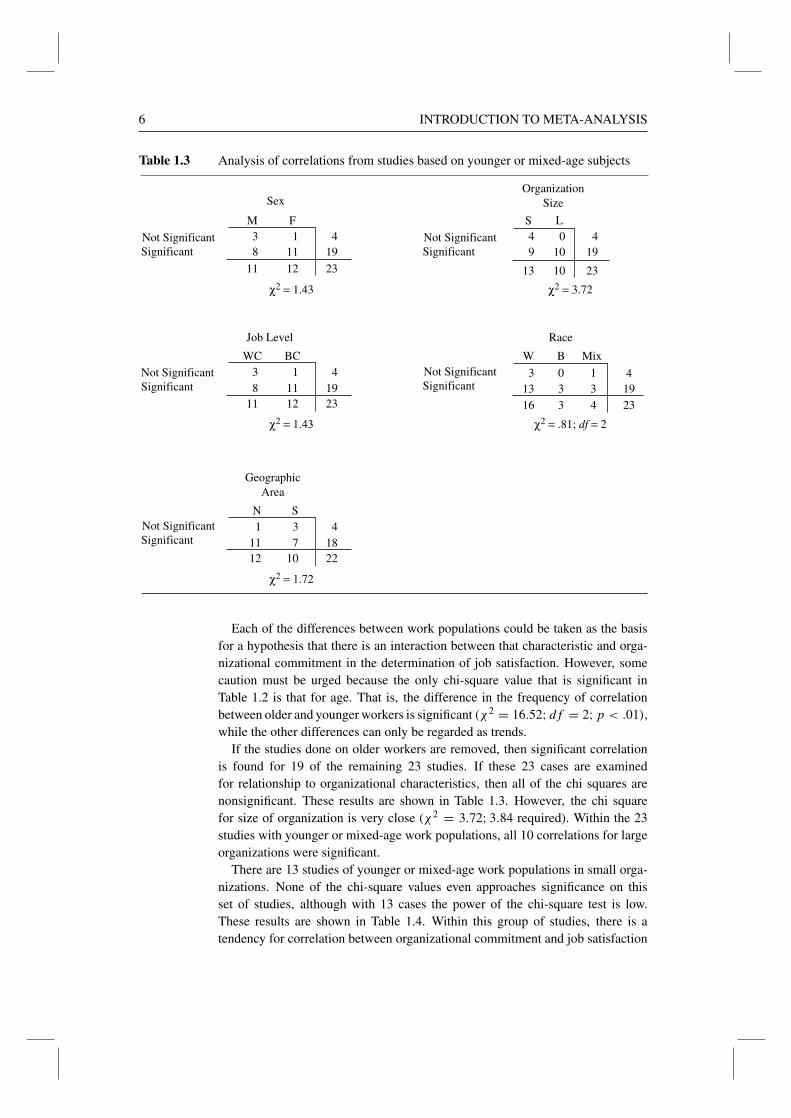
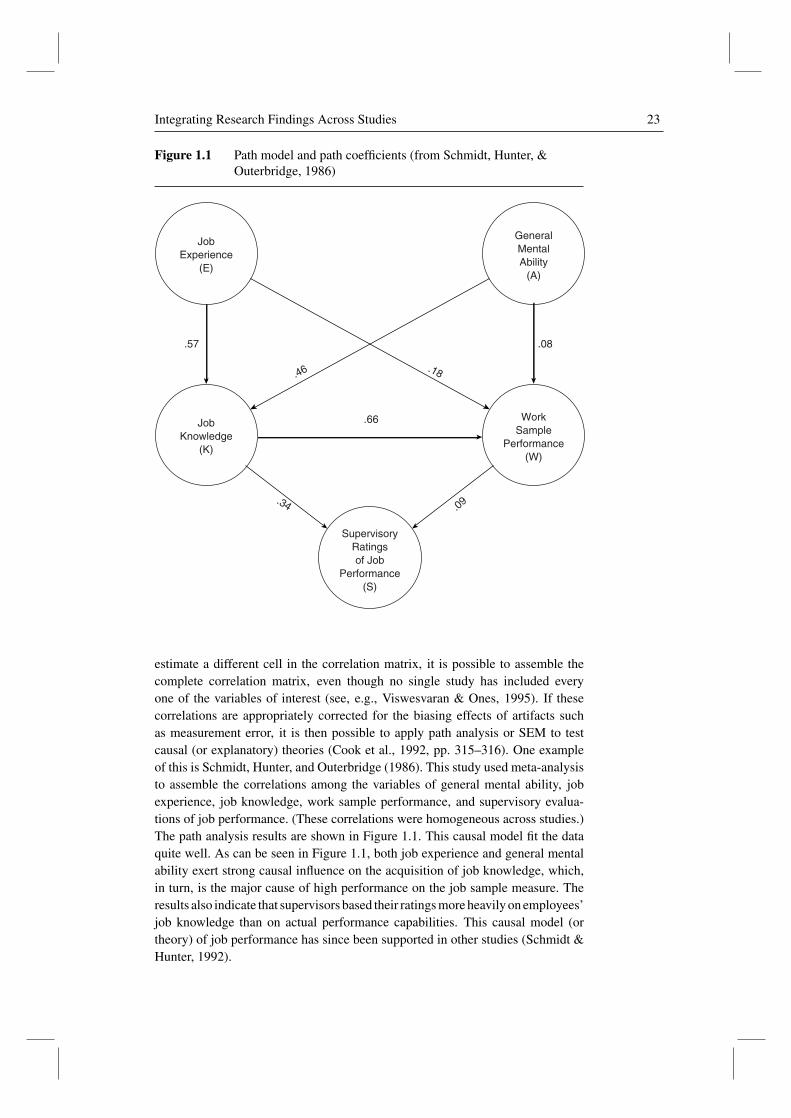
Figure 1.1 Path model and path coefficients (from Schmidt, Hunter, &Outerbridge, 1986)
.57 .08
.66
.46
.34 .09
.18
JobKnowledge
(K)
JobExperience
(E)
WorkSample
Performance(W)
SupervisoryRatingsof Job
Performance(S)
GeneralMentalAbility
(A)
estimate a different cell in the correlation matrix, it is possible to assemble thecomplete correlation matrix, even though no single study has included everyone of the variables of interest (see, e.g., Viswesvaran & Ones, 1995). If thesecorrelations are appropriately corrected for the biasing effects of artifacts suchas measurement error, it is then possible to apply path analysis or SEM to testcausal (or explanatory) theories (Cook et al., 1992, pp. 315–316). One exampleof this is Schmidt, Hunter, and Outerbridge (1986). This study used meta-analysisto assemble the correlations among the variables of general mental ability, jobexperience, job knowledge, work sample performance, and supervisory evalua-tions of job performance. (These correlations were homogeneous across studies.)The path analysis results are shown in Figure 1.1. This causal model fit the dataquite well. As can be seen in Figure 1.1, both job experience and general mentalability exert strong causal influence on the acquisition of job knowledge, which,in turn, is the major cause of high performance on the job sample measure. Theresults also indicate that supervisors based their ratings more heavily on employees’job knowledge than on actual performance capabilities. This causal model (ortheory) of job performance has since been supported in other studies (Schmidt &Hunter, 1992).
24 INTRODUCTION TO META-ANALYSIS
Becker (1989) and Becker and Schram (1994) discussed the possibilities of usingmeta-analysis in this manner. Becker (1992) used this approach in examining amodel of the variables affecting the achievement in science of male and femalehigh school and college students. In that case, there were insufficient studiesavailable to obtain meta-analytic estimates of some of the needed correlations;nevertheless, progress was made and the information needed from future researchwas pinpointed. Becker (1996) and Shadish (1996) provided additional discussion.Although there are technical complexities that must be dealt with in using meta-analysis in this manner (Cook et al., 1992, pp. 328–330), it is a promising approachto accelerating cumulative knowledge in the social sciences. Recent examplesof application of this approach include Colquitt, LePine, and Noe (2002), Hom,Caranikas-Walker, Prussia, and Griffeth (1992), and Whiteside and Becker (2000).
Increasing Use of Meta-Analysis
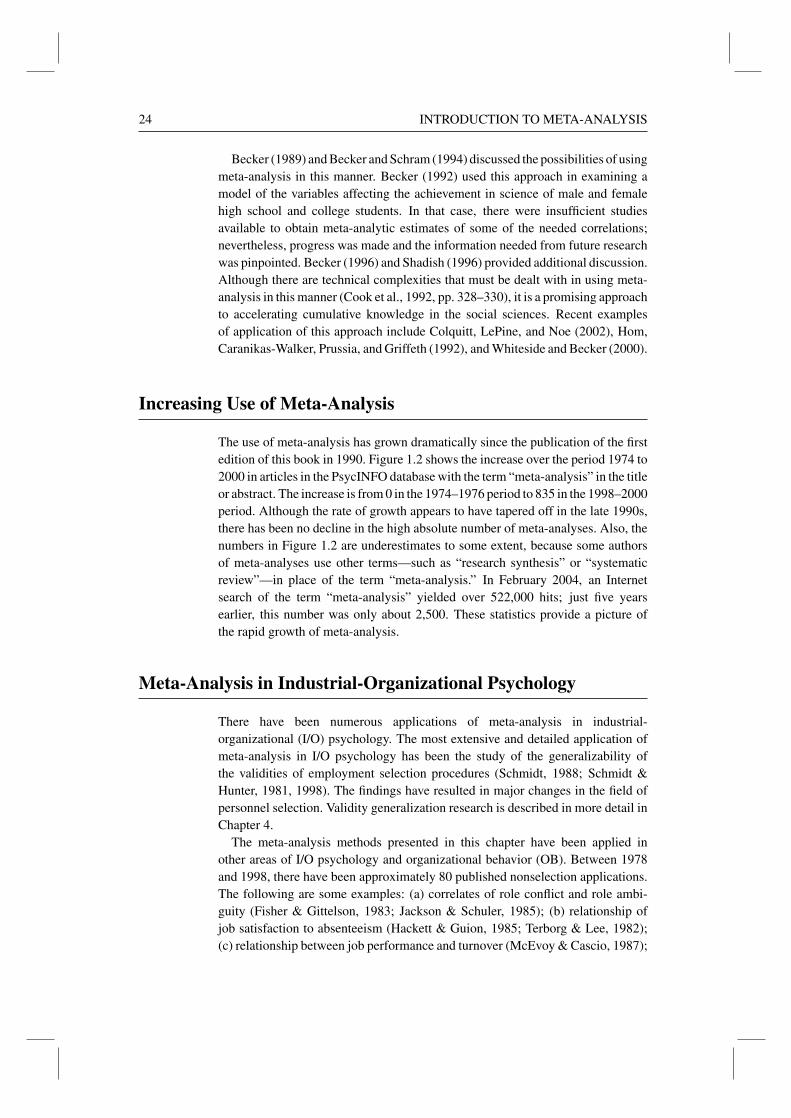
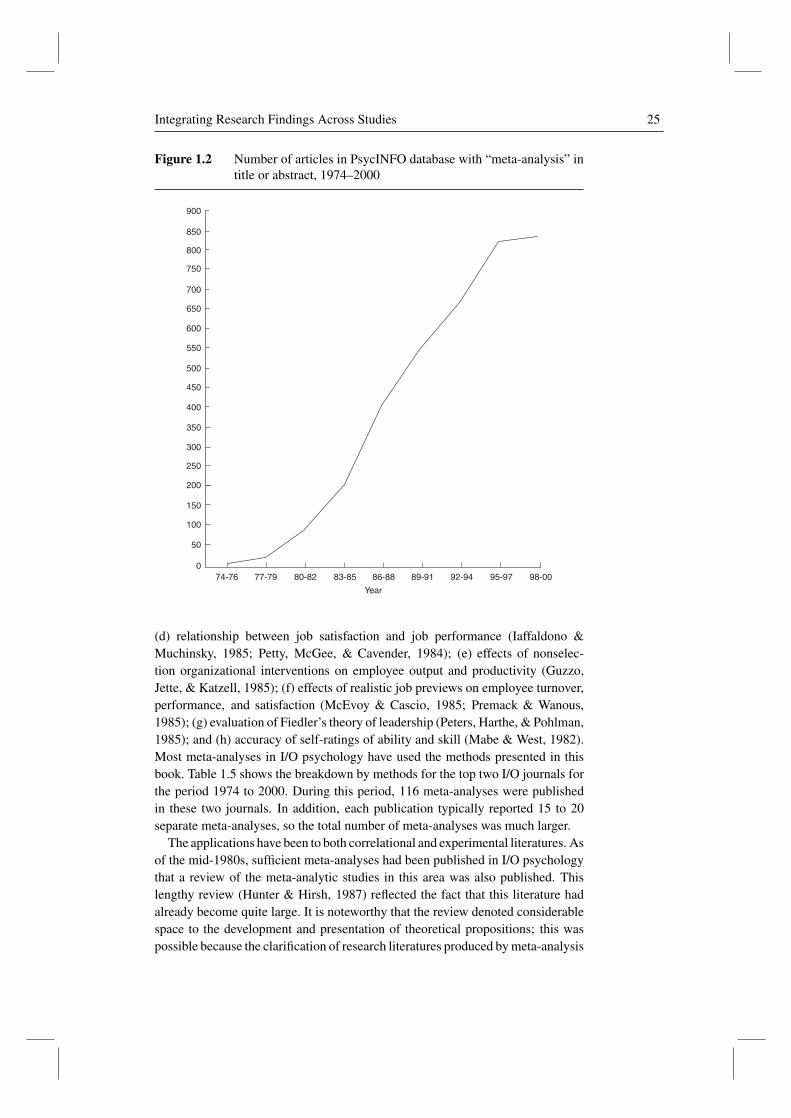
The use of meta-analysis has grown dramatically since the publication of the firstedition of this book in 1990. Figure 1.2 shows the increase over the period 1974 to2000 in articles in the PsycINFO database with the term “meta-analysis” in the titleor abstract. The increase is from 0 in the 1974–1976 period to 835 in the 1998–2000period. Although the rate of growth appears to have tapered off in the late 1990s,there has been no decline in the high absolute number of meta-analyses. Also, thenumbers in Figure 1.2 are underestimates to some extent, because some authorsof meta-analyses use other terms—such as “research synthesis” or “systematicreview”—in place of the term “meta-analysis.” In February 2004, an Internetsearch of the term “meta-analysis” yielded over 522,000 hits; just five yearsearlier, this number was only about 2,500. These statistics provide a picture ofthe rapid growth of meta-analysis.
Meta-Analysis in Industrial-Organizational Psychology
There have been numerous applications of meta-analysis in industrial-organizational (I/O) psychology. The most extensive and detailed application ofmeta-analysis in I/O psychology has been the study of the generalizability ofthe validities of employment selection procedures (Schmidt, 1988; Schmidt &Hunter, 1981, 1998). The findings have resulted in major changes in the field ofpersonnel selection. Validity generalization research is described in more detail inChapter 4.
The meta-analysis methods presented in this chapter have been applied inother areas of I/O psychology and organizational behavior (OB). Between 1978and 1998, there have been approximately 80 published nonselection applications.The following are some examples: (a) correlates of role conflict and role ambi-guity (Fisher & Gittelson, 1983; Jackson & Schuler, 1985); (b) relationship ofjob satisfaction to absenteeism (Hackett & Guion, 1985; Terborg & Lee, 1982);(c) relationship between job performance and turnover (McEvoy & Cascio, 1987);
Integrating Research Findings Across Studies 25
Figure 1.2 Number of articles in PsycINFO database with “meta-analysis” intitle or abstract, 1974–2000
900
800
750
700
650
600
550
500
450
400
350
300
250
200
150
100
50
0
850
74-76 83-8580-8277-79
Year
86-88 89-91 92-94 95-97 98-00
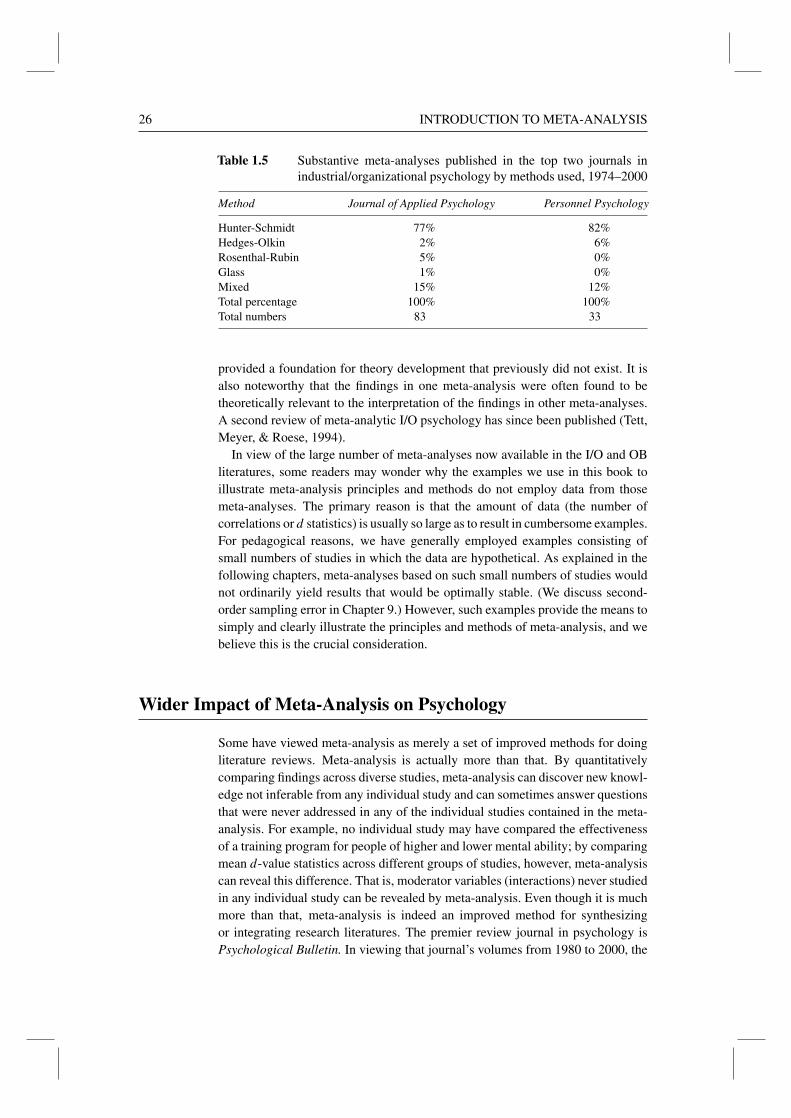
(d) relationship between job satisfaction and job performance (Iaffaldono &Muchinsky, 1985; Petty, McGee, & Cavender, 1984); (e) effects of nonselec-tion organizational interventions on employee output and productivity (Guzzo,Jette, & Katzell, 1985); (f) effects of realistic job previews on employee turnover,performance, and satisfaction (McEvoy & Cascio, 1985; Premack & Wanous,1985); (g) evaluation of Fiedler’s theory of leadership (Peters, Harthe, & Pohlman,1985); and (h) accuracy of self-ratings of ability and skill (Mabe & West, 1982).Most meta-analyses in I/O psychology have used the methods presented in thisbook. Table 1.5 shows the breakdown by methods for the top two I/O journals forthe period 1974 to 2000. During this period, 116 meta-analyses were publishedin these two journals. In addition, each publication typically reported 15 to 20separate meta-analyses, so the total number of meta-analyses was much larger.
The applications have been to both correlational and experimental literatures. Asof the mid-1980s, sufficient meta-analyses had been published in I/O psychologythat a review of the meta-analytic studies in this area was also published. Thislengthy review (Hunter & Hirsh, 1987) reflected the fact that this literature hadalready become quite large. It is noteworthy that the review denoted considerablespace to the development and presentation of theoretical propositions; this waspossible because the clarification of research literatures produced by meta-analysis
26 INTRODUCTION TO META-ANALYSIS
Table 1.5 Substantive meta-analyses published in the top two journals inindustrial/organizational psychology by methods used, 1974–2000
Method Journal of Applied Psychology Personnel Psychology
Hunter-Schmidt 77% 82%Hedges-Olkin 2% 6%Rosenthal-Rubin 5% 0%Glass 1% 0%Mixed 15% 12%Total percentage 100% 100%Total numbers 83 33
provided a foundation for theory development that previously did not exist. It isalso noteworthy that the findings in one meta-analysis were often found to betheoretically relevant to the interpretation of the findings in other meta-analyses.A second review of meta-analytic I/O psychology has since been published (Tett,Meyer, & Roese, 1994).
In view of the large number of meta-analyses now available in the I/O and OBliteratures, some readers may wonder why the examples we use in this book toillustrate meta-analysis principles and methods do not employ data from thosemeta-analyses. The primary reason is that the amount of data (the number ofcorrelations or d statistics) is usually so large as to result in cumbersome examples.For pedagogical reasons, we have generally employed examples consisting ofsmall numbers of studies in which the data are hypothetical. As explained in thefollowing chapters, meta-analyses based on such small numbers of studies wouldnot ordinarily yield results that would be optimally stable. (We discuss second-order sampling error in Chapter 9.) However, such examples provide the means tosimply and clearly illustrate the principles and methods of meta-analysis, and webelieve this is the crucial consideration.
Wider Impact of Meta-Analysis on Psychology
Some have viewed meta-analysis as merely a set of improved methods for doingliterature reviews. Meta-analysis is actually more than that. By quantitativelycomparing findings across diverse studies, meta-analysis can discover new knowl-edge not inferable from any individual study and can sometimes answer questionsthat were never addressed in any of the individual studies contained in the meta-analysis. For example, no individual study may have compared the effectivenessof a training program for people of higher and lower mental ability; by comparingmean d-value statistics across different groups of studies, however, meta-analysiscan reveal this difference. That is, moderator variables (interactions) never studiedin any individual study can be revealed by meta-analysis. Even though it is muchmore than that, meta-analysis is indeed an improved method for synthesizingor integrating research literatures. The premier review journal in psychology isPsychological Bulletin. In viewing that journal’s volumes from 1980 to 2000, the
Integrating Research Findings Across Studies 27
impact of meta-analysis is apparent. Over this time period, a steadily increasingpercentage of the reviews published in this journal are meta-analyses and a steadilydecreasing percentage are traditional narrative subjective reviews. It is not uncom-mon for narrative review manuscripts to be returned by editors to the authorswith the request that meta-analysis be applied to the studies reviewed. Most ofthe remaining narrative reviews published today in Psychological Bulletin focuson research literatures that are not well enough developed to be amenable toquantitative treatment.
Most of the meta-analyses appearing in Psychological Bulletin have employedfixed-effects methods, resulting, in many cases, in overstatement of the precisionof the meta-analysis findings. (See Chapters 5 and 9 for discussions of fixed vs.random meta-analysis models.) Despite this fact, these meta-analyses producefindings and conclusions that are far superior to those produced by the traditionalnarrative subjective method. Many other journals have shown the same increaseover time in the number of meta-analyses published. Many of these journals hadtraditionally published only individual empirical studies and had rarely publishedreviews up until the advent of meta-analysis in the late 1970s. These journalsbegan publishing meta-analyses because meta-analyses came to be viewed not as“mere reviews” but as a form of empirical research in themselves. As a resultof this change, the quality and accuracy of conclusions from research literaturesimproved in a wide variety of journals and in a corresponding variety of researchareas in psychology. This improvement in the quality of conclusions from researchliteratures has expedited theory development in many areas in psychology.
The impact of meta-analysis on psychology textbooks has been positive anddramatic. Textbooks are important because their function is to summarize the stateof cumulative knowledge in a given field. Most people—students and others—acquire most of their knowledge about psychological theory and findings from theirreading of textbooks. Prior to meta-analysis, textbook authors faced with hundredsof conflicting studies on a single question subjectively and arbitrarily selected asmall number of their preferred studies from the literature and based the textbookconclusions on only those few studies. Today, most textbook authors base theirconclusions on meta-analysis findings (Myers, 1991), making their conclusionsand their textbooks much more accurate. We cannot overemphasize the importanceof this development in advancing cumulative knowledge in psychology.
Because multiple studies are needed to solve the problem of sampling error, itis critical to ensure the availability of all studies on each topic. A major problem isthat many good replication articles are rejected by the primary research journals.Journals currently put excessive weight on innovation and creativity in evaluatingstudies and often fail to consider either sampling error or other technical problemssuch as measurement error. Many journals will not even consider “mere replica-tion studies” or “mere measurement studies.” Many persistent authors eventuallypublish such studies in journals with lower prestige, but they must endure manyletters of rejection and publication is often delayed for a long period of time.
To us, this clearly indicates that we need a new type of journal—whether hardcopy or electronic—that systematically archives all studies that will be neededfor later meta-analyses. The American Psychological Association’s ExperimentalPublication System in the early 1970s was an attempt in this direction. However,
28 INTRODUCTION TO META-ANALYSIS
at that time, the need subsequently created by meta-analysis did not yet exist;the system apparently met no real need at that time and hence was discontinued.Today, the need is so great that failure to have such a journal system in place isretarding our efforts to reach our full potential in creating cumulative knowledge inpsychology and the social sciences. The Board of Scientific Affairs of the AmericanPsychological Association is currently studying the feasibility of such a system.
Impact of Meta-Analysis Outside Psychology
Impact in Medicine
The impact of meta-analysis may be even greater in medical research than in thebehavioral and social sciences (Hunt, 1997, Chap. 4). Hundreds of meta-analyseshave been published in leading medical research journals such as the New EnglandJournal of Medicine and the Journal of the American Medical Association. (Asof 1995, the medical literature contained between 962 and 1,411 meta-analyses,depending on the method of counting; Moher & Olkin, 1995.) In medical research,the preferred study is the randomized controlled trial (RCT), in which participantsare assigned randomly to receive either the treatment or a placebo, with theresearchers being blind as to which treatment the participants are receiving. Despitethe strengths of this research design, it is usually the case that different RCTs onthe same treatment obtain conflicting results. This is partly because the underlyingpopulation effect sizes are often small and partly because (contrary perhaps to ourperceptions) RCTs are often based on small sample sizes. In addition, the problemof information overload is even greater in medicine than in the social sciences;over a million medical research studies are published every year. No practitionercan possibly keep up with the medical literature in his or her area.
The leader in introducing meta-analysis to medical research was ThomasChalmers. In addition to being a researcher, Chalmers was also a practicinginternist who became frustrated with the inability of the vast, scattered, andunfocused medical research literature to provide guidance to practitioners. Startingin the mid-1970s, Chalmers developed his initial meta-analysis methods indepen-dently of those developed in the social and behavioral sciences. Despite being wellconducted, his initial meta-analyses were not well accepted by medical researchers,who were critical of the concept of meta-analysis. In response, he and his associatesdeveloped “sequential meta-analysis”—a technique that reveals the date by whichenough information had become available to show conclusively that a treatmentwas effective. Suppose, for example, that the first RCT for a particular drug hadbeen conducted in 1975 but had a wide confidence interval, one that spanned zeroeffect. Now, suppose three more studies had been conducted in 1976, providing atotal of four studies to be meta-analyzed—and the confidence interval for the meta-analytic mean of these studies was still wide and still included 0. Now, supposefive more RCTs had been conducted in 1977, providing nine studies for a meta-analysis up to this date. Now, if that meta-analysis yielded a confidence intervalthat excluded 0, then we conclude that, given the use of meta-analysis, enoughinformation was already available in 1977 to begin using this drug. Chalmers andhis associates then computed, based on the meta-analysis finding and statistics on
Integrating Research Findings Across Studies 29
the disease, how many lives would have been saved to date had use of the drugbegun in 1977. It turned out that, considered across different treatments, diseases,and areas of medical practice, a very large number of lives would have been savedhad medical research historically relied on meta-analysis. The resulting article(Antman, Lau, Kupelnick, Mosteller, & Chalmers, 1992) is widely consideredthe most important and influential meta-analysis ever published in medicine. Itwas even reported and discussed widely in the popular press (for example, TheNew York Times, Science Section). It assured a major role for meta-analysis inmedical research from that point on (Hunt, 1997, Chap. 4).
Chalmers was also one of the driving forces behind the establishment of theCochrane Collaboration, an organization that applies sequential meta-analysis inmedical research in real time. This group conducts meta-analyses in a wide varietyof medical research areas—and then updates each meta-analysis as new RCTsbecome available. That is, when a new RCT becomes available, the meta-analysis isrerun with the new RCT included. Hence, each meta-analysis is always current. Theresults of these updated meta-analyses are available on the Internet to researchersand medical practitioners around the world. It is likely that this effort has savedhundreds of thousands of lives by improving medical decision making. TheCochrane Collaboration Web site is www.update-software.com/ccweb/cochrane/general.htm.
Impact in Other Disciplines
Meta-analysis has also become important in research in finance, marketing,sociology, and even wildlife management. In fact, it would probably be difficult tofind a research area in which meta-analysis is unknown today. In the broad areasof education and social policy, the Campbell Collaboration is attempting to do forthe social sciences what the Cochrane Collaboration (on which it is modeled) hasdone for medical practice (Rothstein, 2003; Rothstein, McDaniel, & Borenstein,2001). Among the social sciences, perhaps the last to assign an important role tometa-analysis has been economics. However, meta-analysis has recently becomeimportant in economics, too (see, e.g., Stanley, 1998, 2001; Stanley & Jarrell,1989, 1998). There is even a doctoral program in meta-analysis in economics(http://www.feweb.vu.nl/re/Master-Point/). Meta-analysis is also beginning to beused in political science (see, e.g., Pinello, 1999).
Meta-Analysis and Social Policy
By providing the best available empirically based answers to socially impor-tant questions, meta-analysis can influence public policy making (Hoffert, 1997;Hunter & Schmidt, 1996). This can be true for any public policy question forwhich there is a relevant research literature—which today includes virtually allpolicy questions. Examples range from the Head Start program to binary chem-ical weapons (Hunt, 1997, Chap. 6). The purpose of the recently establishedCampbell Collaboration, described previously, is specifically to provide policy-relevant information to policymakers in governments and other organizations by
30 INTRODUCTION TO META-ANALYSIS
applying meta-analysis to policy-relevant research literatures. For over 20 years,the U.S. General Accounting Office (GAO), a research and evaluation arm ofthe U.S. Congress, has used meta-analysis to provide answers to questions posedby senators and representatives. For example, Hunt (1997, Chap. 6) describedhow a GAO meta-analysis of the effects of the Women, Infants, and Children(WIC) program, a federal nutritional program for poor pregnant women, apparentlychanged the mind of Senator Jesse Helms and made him a (reluctant) supporterof the program. The meta-analysis found evidence that the program reduced thefrequency of low-birth-weight babies by about 10%.
This meta-analysis was presented to Senator Helms by Eleanor Chelimsky, foryears the director of the GAO’s Division of Program Evaluation and Methodology.In that position, she pioneered the use of meta-analysis at GAO. Chelimsky (1994)stated that meta-analysis has proven to be an excellent way to provide Congresswith the widest variety of research results that can hold up under close scrutinyunder the time pressures imposed by Congress. She stated that GAO has found thatmeta-analysis reveals both what is known and what is not known in a given topicarea and distinguishes between fact and opinion “without being confrontational.”One application she cited as an example was a meta-analysis of studies on themerits of producing binary chemical weapons (nerve gas in which the two keyingredients are kept separate for safety until the gas is to be used). The meta-analysis did not support the production of such weapons. This was not what theDepartment of Defense (DOD) wanted to hear, and DOD disputed the methodologyand the results. The methodology held up under close scrutiny, however, and inthe end Congress eliminated funds for these weapons.
By law, it is the responsibility of GAO to provide policy-relevant research infor-mation to Congress. So the adoption of meta-analysis by GAO is a clear exampleof the impact that meta-analysis can have on public policy. Although most policydecisions probably depend as much on political as on scientific considerations, it ispossible for scientific considerations to have an impact with the aid of meta-analysis(Hoffert, 1997).
Meta-Analysis and Theories of Data
Every method of meta-analysis is of necessity based on a theory of data. It isthis theory (or understanding) of data that determines the nature of the resultingmeta-analysis methods. A complete theory of data includes an understanding ofsampling error, measurement error, biased sampling (range restriction and rangeenhancement), dichotomization and its effects, data errors, and other causal factorsthat distort the raw data we see in research studies. Once a theoretical understandingof how these factors affect data is developed, it becomes possible to developmethods for correcting for their effects. In the language of psychometrics, the firstprocess—the process by which these factors (artifacts) bias data—is modeled asthe attenuation model. The second process—the process of correcting for theseartifact-induced biases—is called the disattenuation model. If the theory of dataon which a method of meta-analysis model is based is incomplete, that methodwill fail to correct for some or all of these artifacts and will thus produce biased
Integrating Research Findings Across Studies 31
results. For example, a theory of data that fails to recognize measurement error willlead to methods of meta-analysis that do not correct for measurement error. Suchmethods will then perforce produce biased meta-analysis results. Some currentmethods of meta-analysis do not, in fact, correct for measurement error (seeChapter 11).
Sampling error and measurement error have a unique status among the statis-tical and measurement artifacts with which meta-analysis must deal: They arealways present in all real data. Other artifacts, such as range restriction, artificialdichotomization of continuous variables, or data transcription errors, may be absentin a particular set of studies being subjected to meta-analysis. There is alwayssampling error, however, because sample sizes are never infinite. Likewise, thereis always measurement error, because there are no perfectly reliable measures.In fact, as we will see in subsequent chapters, it is the requirement of dealingsimultaneously with both sampling error and measurement error that makes evenrelatively simple meta-analyses seem complicated. We are used to dealing withthese two types of error separately. For example, when psychometric texts (e.g.,Lord & Novick, 1968; Nunnally & Bernstein, 1994) discuss measurement error,they assume an infinite (or very large) sample size, so that the focus of attention canbe on measurement error alone, with no need to deal simultaneously with samplingerror. Similarly, when statistics texts discuss sampling error, they implicitly assumeperfect reliability (the absence of measurement error), so that they and the readercan focus solely on sampling error. Both assumptions are highly unrealistic becauseall real data simultaneously contain both types of error. It is admittedly morecomplicated to deal with both types of error simultaneously, yet this is whatmeta-analysis must do to be successful (see, e.g., Cook et al., 1992, pp. 315–316,325–328).
The question of what theory of data underlies a method of meta-analysis isstrongly related to the question of what the general purpose of meta-analysis is.Glass (1976, 1977) stated that the purpose is simply to summarize and describe thestudies in a research literature. As we will see in this book, our view (the alternativeview) is that the purpose is to estimate as accurately as possible the construct-levelrelationships in the population (i.e., to estimate population values or parameters),because these are the relationships of scientific interest. This is an entirely differenttask; this is the task of estimating what the findings would have been if all studieshad been conducted perfectly (i.e., with no methodological limitations). Doingthis requires correction for sampling error, measurement error, and other artifacts(if present) that distort study results. Simply describing the contents of studiesin the literature requires no such corrections but does not allow estimation of theparameters of scientific interest.
Rubin (1990) critiqued the common, descriptive concept of the purpose ofmeta-analysis and proposed the alternative offered in this book. He stated that,as scientists, we are not really interested in the population of imperfect studiesper se, and hence an accurate description or summary of these studies is not reallyimportant. Instead, he argued that the goal of meta-analysis should be to estimatethe true effects or relationships—defined as “results that would be obtained in aninfinitely large, perfectly designed study or sequence of such studies.” Accordingto Rubin,
32 INTRODUCTION TO META-ANALYSIS
Under this view, we really do not care scientifically about summarizing this finitepopulation (of observed studies). We really care about the underlying scientific process—the underlying process that is generating these outcomes that we happen to see—that we,as fallible researchers, are trying to glimpse through the opaque window of imperfectempirical studies. (p. 157; emphasis in original)
This is an excellent summary of the purpose of meta-analysis as we see it and asembodied in the methods presented in this book.
Conclusions
Until recently, psychological research literatures were conflicting and contradic-tory. As the number of studies on each particular question became larger andlarger, this situation became increasingly frustrating and intolerable. This situationstemmed from reliance on defective procedures for achieving cumulative knowl-edge: the statistical significance test in individual primary studies in combinationwith the narrative subjective review of research literatures. Meta-analysis princi-ples have now correctly diagnosed this problem and have provided the solution. Inarea after area, meta-analytic findings have shown that there is much less conflictbetween studies than had been believed; that coherent, useful, and generalizableconclusions can be drawn from research literatures; and that cumulative knowledgeis possible in psychology and the social sciences. These methods have also beenadopted in other areas such as medical research. A prominent medical researcher,Thomas Chalmers (as cited in Mann, 1990), has stated, “[Meta-analysis] is goingto revolutionize how the sciences, especially medicine, handle data. And it is goingto be the way many arguments will be ended” (p. 478). In concluding his oft-citedreview of meta-analysis methods, Bangert-Drowns (1986, p. 398) stated:
Meta-analysis is not a fad. It is rooted in the fundamental values of the scientific enterprise:replicability, quantification, causal and correlational analysis. Valuable information isneedlessly scattered in individual studies. The ability of social scientists to deliver gen-eralizable answers to basic questions of policy is too serious a concern to allow us totreat research integration lightly. The potential benefits of meta-analysis method seemenormous.