integrating renewable energy sources by electric vehicle
TRANSCRIPT

Integrating renewable energy sources by electric vehicle fleets underuncertainty
Katrin Seddig*, Patrick Jochem, Wolf FichtnerKarlsruhe Institute of Technology (KIT), Institute for Industrial Production (IIP), Chair of Energy Economics, Hertzstr. 16, D-76187, Karlsruhe, Germany
Keywords:Electric vehicle fleetsRenewable energy sourcesUncertaintyLoad managementStochastic optimization
a b s t r a c t
Electric vehicles are one of the concepts towards green and sustainable transportation systems. However,several uncertainties with respect to electricity demand and availability of electric vehicles as well aselectricity supply by renewable energy sources influence an optimal scheduling through smart chargingstrategies. This paper investigates the possibilities to integrate additionally loads of uncertain renewableenergy sources by smart charging strategies of three different electric vehicle fleets namely, commercial customers, commuters, and opportunity parkers. Therefore, data from an empiric field test witha public charging infrastructure in a parking garage with a photovoltaic system is taken. Various strategies are analyzed, considering the changing individual electricity demand, restrictions and parkingtimes of electric vehicle fleets by combining a Monte Carlo simulation approach with different methodologies like a heuristic algorithm, an optimization model and stochastic programming. The numericalresults indicate that the domestic photovoltaic generation of the car park can be fully used by the electricvehicle fleets for charging and the utilization of photovoltaic can be doubled when comparing uncontrolled and optimized charging strategies. The commuter fleet has the highest CO2 emission reductionpotential of all three electric vehicle fleets. Moreover, load management decreases costs, even whenuncertainties are considered.
1. Introduction
Overall, there is a decreasing trend of CO2 emissions in the European Union (EU). However, the transport sector is the only onewhich has not lowered its CO2 emissions since 1990 [1]. Hence,alternative vehicles technologies can play an important role inreducing these and other local emissions. Especially a transition toelectric vehicles (EV) can support this objective. This would alsoresult in a diminishing oil dependency.
Apart from that, an increasing share of electricity generationfrom renewable energy sources (RES) has a positive impact on theoverall reduction of EU's CO2 emissions. In Germany, the ongoingenergy transition leads already to a significant shift from electricitygeneration by fossil fuels to RES. However, the power generation byRES comes along with an undesired fluctuation of the supply side.In this context charging strategies from EV e i.e. flexible loads e
could support a smooth integration of RES and stabilization of thegrid e especially due to their long idle times [2].
This aspect on integrating RES through EV exists already in theliterature. There are many approaches to increase the share of RESthrough scheduled EV charging e. g. Tabatabaee et al. (2017) [3]elaborates the combination of RES and EV in the context of thelocal distribution system or Sehar et al. (2017) [4], apply demandmanagement for an integration of photovoltaic (PV) in the chargingprocess of EVs and therefore, reducing peak demand in the environment of a retail building. The main driver for most research inthis field is that EVs can provide a double dividend: the flexibility ofelectricity demand is increased and the environmental impact of EVis decreased when charging them with RES generated power.Thereby the cost awareness could be analyzed from different perspectives such as car users (e.g. to reduce costs), electricity providers (e.g. to increase profit) or grid operators (e.g. reducegeneration costs). Theminimization of charging costs is the focus ofthis paper, additionally to the RES integration and the corresponding CO2 reduction potential.
The analysis of this paper is based on data from an empiric fieldtest with a public charging infrastructure in a parking garagewith aPV system [5] and analyzes various strategies with and without thestochastic components of RES provision. The individual changing* Corresponding author.
E-mail address: [email protected] (K. Seddig).

electricity demand, restrictions and parking times of EV fleets areconsidered by combining aMonte Carlo simulation (MCS) approachwith different methodologies like a heuristic algorithm, a mixedinteger linear program (MILP) and a stochastic MILP (SMILP) whichconsists of a two stage stochastic optimization model with sampleaverage approximation method. The resulting different costs foreach approach are compared to each other.
The objective of this paper is to maximize the utilization of PVgeneration through smart charging strategies of EV fleets in aparking garage at minimal charging costs. Additionally, uncertainties in PV generation, charging behavior characteristics(time and amount) of different EV fleets are considered in themodeling.
The remainder of this paper is organized as follows: Section 2‘Related work’ gives a literature overview, section 3 ‘Data andresearch design’ presents the structure of the use case as well as thesources and the uncertainties from the data used. In section 4‘Methods’ the applied three main approaches and their algorithms are introduced. In section 5 the results are reported anddiscussed as well as some policy implications are given. Section 6draws conclusions, shows limitations, summarizes the paper andgives an outlook for potential future research.
2. Related work
The reduction of charging costs can be one of the main driversfor EV owners to schedule their chargings. Only a few contributionsin the research field are found, which address stochastic programming. Li et al. (2012) account for the stochastic variables butthey reproduce the stochastic terms within scenarios [6]. In Soareset al. (2017) stochastic programming is used to evaluate electricitypricing schemes for EVs. Their study indicates that with anadequate demand response scheme the profitability of a businessmodel based on energy aggregation can be improved [7].
When it comes to different methodological approaches used inthe EV charging context, the review paper of Rahman et al. (2016)gives a broad insight of existing optimization models [8]. Severalpapers compare different charging strategies, including heuristicsvs. smart charging strategies with respect to self consumption ofelectricity from own PV systems, e.g. Refs. [9], [10]. Not only optimized scheduling strategies are applied, but also different algorithm can be used to determine optimized schedules, e. g. Ref. [11].In Jochem et al. (2015b) a MILP approach is compared to a twostage greedy algorithm in the setting of the combination of EVsand micro combined heat and power units. The MILP solutionmight be more accurate, however, the benefit of the algorithmicapproach is that the computational time is reduced [12].
Utilization of RES through smart charging of EVs is anothercommon topic. For instance, Gottwalt et al. (2013) show that EVcharging load can be shifted towards RES generated electricity.They use a MILP with full information and as a result, they couldshow that they can double the share of RES through an optimizedcharging schedule [13]. Especially the literature on solar energy ismuchmore diverse thanwind as the local generation and afterwarddirectly usage through EVs provides interesting methods [14].Agent based modeling is also a widely used approach for modelinge. g. the load curves of EV and showing the interaction on a nationalenergy system. For instance, Novosel et al. (2015) apply MATSim toidentify the impact of EVs and the intermittent RES penetration onCroatia's energy system [15].
However, adding the interplay of the stochastic characteristicsof EVs and RES generation, this should be considered carefully asthere is still little research in this area. Uncertainties for the RES arecovered by using different stochastic approaches like Markovchains [16] or time series modelling [17] to have a forecast for the
electricity generation by PV. In Tushar et al. (2014) additionally tothe PV prediction for the next 24 h with Markov Chains, the EVsarrival time is modeled as a Poisson Process. Their model is appliedin amicrogrid including home appliances with the goal tominimizethe needed imported electricity from the microgrid. Saber andVenayagamoorthy (2012) had a closer look into resource scheduling of EVs and RES under uncertainty in a smart grid. In theirpaper, they use a Particle Swarm Optimization to minimize emissions and costs and for the uncertainties, scenarios are considered[18].
Honarmand et al. (2014) propose already a method for integrating EVs into a smart grid with RES in a context of a parking lot[19] and additionally taking the battery condition into consideration [20]. They have a closer look on reserve and energy scheduling using a MILP to minimize the operating costs. They do notconsider the probabilistic nature of EVs with respect to arrival anddeparture time [19]. In Figueiredo et al. (2017) the charging processof EVs through solar energy in a car park is examined by applying aGenetic Algorithm Optimization to test different business models[21]. The methodology of game theory is also represented in thecontext of an EV parking lot with respect to maximizing the profitof a car park operator by Ref. [22]. Through managing the chargingand discharging process of plug in hybrid EVs accordingly thehighest profits for the utility owners can be achieved. Braam et al.(2016) apply a MILP to evaluate the load shift potential for EVs for aparking garage. They account for several restrictions of this environment and use PV generated power for charging, however, theirsystem only includes 13 EVs. They do not take into considerationany uncertainties involved (neither RES generation nor EV drivingprofiles [23]). Furthermore, other research had been done in thecontext of charging of EVs in parking garageswith the interaction ofRES, however, they consider one homogenous type of EV fleet only[24] or no uncertainties [25].
This paper extends the existing literature by considering thecharging behavior of the EV according to its field of application:commercial customers, commuters, and opportunity parkers.These three different EV fleets are characterized by different drivingand charging profiles using at the same time a common publiccharging infrastructure. Therein empirical data is used. Theapproach of this paper is to identify the corresponding load shiftpotentials of these different fleets in the context of maximizingown consumption of electricity from PV under uncertain environmental parameters using stochastic programming and additionally minimize the charging costs.
3. Data and research design
This section presents the use case set up with the three EV fleetsand PV generation in the parking garage (section 3.1) and the dataincluding their underlying uncertainties (section 3.2) .
3.1. Use case
The use case of this paper is a mid size car garage for about 650cars located in central Stuttgart, Germany. The generic set up of theuse case can be seen in Fig. 1.
The first considered fleet category is the commercial fleet, whichconsists of a carpool of different commercial EVs, i.e. a companyfleet. Thereby, only day trips are considered for business concern.Typically, the cars are available for charging overnight.
The second fleet is operated by commuters, i.e. usually longterm customers living or working nearby. This includes peoplewho drive regularly, mainly on weekdays, from home to work andback with their private car. Looking at their driving profiles, theyusually depart (arrive) between 6 and 9 a.m. and arrive (depart)

around 6 p.m. at weekdays. Therefore, commuters have twodifferent time slots for charging the EV. The first one is at home,looking at around 14 h of parking time during the night. The secondpossibility for charging is during work time having round about 8 hfor charging during daytime. In this paper, the focus is on thesecond group of commuters, which park during the day in a parkinggarage and do not consider the other sub group.
Thirdly, the other fleet of private cars which is looked at isreferred to as short term or opportunity customers. In this context,their characteristics are that they drive shorter distance and usuallypark at public or semi public places. This applies usually to leisuretimes and activities like shopping, cinema, sports, etc.
It is assumed that the charging infrastructure is shared betweenall the three types of EV fleets and every EV can charge at everycharging point. More details regarding the data analysis can befound in Ref. [5].
3.2. Data and uncertainties
For this field test, comprehensive real data is available and usedwithin the simulation model. The data consists of driving profilesfrom short term and long term customers of parking garage usersin terms of arriving and departure time from a parking garage. Thisdata is expanded and as a reference for the covered distances theGerman KiD data [28] was taken. This data is based on trips ofcombustion based engines vehicles. Hence, to adapt the data for anEV usage, an algorithm for decision support is used to select thetrips which are possible to drive with an EV. The algorithm takesseveral assumed parameters for an EV into consideration e.g. battery capacity of 24 kWh and average electricity consumption of0.2 kWh/km.1 This results in a maximum range of 120 km for thetrips. The resulting driving patterns seem relative homogenousamong the three EV fleets and most of the trips are shorter than20 km [5]. The local charging power is set to a maximum of 11 kWand the batteries have a linear charging behavior.
For the PV, solar radiation data from the region Stuttgart for the
year 2013 is compiled. These data are used to generate syntheticdriving profiles as well as feed in of RES with stochastically derivedpatterns.
To account for the uncertainties of the model the stochasticbehavior of EV usage is described by a probability distribution ofthe different parameters. An EV driving pattern consists of threeparameters, arrival time (ta), departure time (td) and trip distance(r) taken from several data sources as mentioned above.
Based on these three parameters depending on the EV fleet aparticular dataset is used to generate a probability density function(PDF). Kernel density estimation (KDE) is used to estimate in a nonparametric way the PDF of the random variables. All PDFs of thethree fleets are created with the same method. The distinguishingbetween the modelling of the three EV fleets is, that the short andlong term customers have each a two dimensional KDE from thereal time values of the car park concerning arrival time and parkingduration. Additional they have a one dimensional KDE for thedistances. The fleet customers have a three dimensional KDE for allthree parameters (ta, td, r). The 90 queries of a day for each fleet arecreated by pulling out random triples (for the three parameters) ofthe generated PDFs. The number of queries (270 in total, 90 queriesof each fleet) is a priori predetermined and the information isavailable before the 1000 simulations of each of the appliedmethodologies starts. The number of each EV fleet remains thesame for each simulation run.
In general, the energy demand of each charging query v aboutthe energy needed for one trip is calculated by using the information of the trip distance r from each EV i in combination with theassumed electricity consumption b of 0.2 kWh/km, as specified inthe following equation (1).
vi ri$b c i (1)
It is assumed that the EVs have originally a battery state ofcharge (SOC) of 100% and then make one trip to the parking garageand afterward they will charge again until the SOC is full by 100% atthe departure of the EV.
Uncertainties of electricity generation by PV rely mainly onclouds. Fig. 2 shows the intermittent character of the solargenerated energy over the course of a day in the year 2013 forthe Stuttgart region. There is an unpredictable nature of the PV
Fig. 1. Model of the parking garage use case.
1 As a reference EV the Nissan Leaf was chosen with a battery capacity of 24 kWhand an average electricity consumption of 20.39 kWh per 100 km [33].

generation and the resulting energy output.For the 1000 simulation runs every time one random day is
taken out of the samples which are divided into summer (threemonths) and winter (three months) generated PV of the year 2013.In the following three different characteristics of PV generationwillbe used to represent the complexity of the integration of PV:
� Perfect Foresight: As a first strategy, (unrealistic) a prioriknown PV curves are used. The data source is taken from realobservations for PV generation of one year from the TransnetBW, which provides information for the region in the south ofGermany [29].
� Day-Ahead Foresight: For the second strategy, again the datasource from Transnet BW is used, however, they also providedata for prediction of the day ahead PV generation. Hence, theinformation of the expected day ahead PV generation in relationto the real observed PV generation of the same day is used.
� Historic Foresight: For the last strategy, empirical perturbedforecast curves reflecting the uncertainty are created. Therefore,data from over the last seven years of PV generation from theday ahead forecasts in comparison to the real observation aretaken. Resulting from the time series data analysis are timedependent normal distribution which is applied as a noise tothe expected day ahead forecast curves and create therewiththe stochastic scenarios.
After identifying these three different characteristics of PVgeneration the utilization of the PV usage for charging the EVs canbe analyzed in detail. Thereby, the application of different strategiesincluding the various methodologies capture the uncertaintieswhich are involved.
4. Methods
In this section, the focus is on the three main methodologyapproaches of the paper with a closer look on the applied algorithms. Therein the content will include the developed heuristic,the simulation model, the optimization model without and withstochastic variables including the sample average approximationmethod.
4.1. Simulation setup
The parking garage and its rooftop have a potential for PV panelsof about 100 kWpeak. A further assumption is that up to 90 customers of each EV fleet exist and with charging queries of each fleetthe parking garage utilization is modeled for every day. The modelaccounts for power limits within the vehicle itself (11 kW), thecharging infrastructure of each charging point (11 kW) and the gridconnection (200 kW). Restrictions regarding the availability ofcharging stations are not considered. It is assumed that there existas many charging points as EVs. However, there might arise a restriction due to the grid connection reflected through transformerlimitations of the parking garage. Therefore, to consider the possibility of congestion of the parking garage, that no car is either ableto enter or has no possibility for connecting to a charging point, anacceptance rate of the queries is introduced. The value is set by 95%of all the placed charging queries of the three EV fleets. Hence, notall charging queries will be accepted.
Furthermore, two power sources are considered with diversesupply costs. On the one hand, PV generated energy is valuedwith aprice of zero as the marginal production costs of PV are zero. Thereis no feed in of the PV power to the grid. It is only used for selfconsumption to charge the EVs and it can be used instead of theelectricity from the grid. This means the overall grid connectionrestriction of 200 kW remains all the time the same. On the otherhand, the external needed electricity from the grid is weightedwithprices from the whole sale electricity markets. They are taken fromthe year 2013 of the EEX spot intradaymarket, divided into summerand winter prices [26].
As described above, the three EV fleets are studied in a simulation model to account for all the uncertain parameter involved.Several uncertainties of input variables are considered e departureand arrival time, the energy demand of each trip of each EV fleetand the EEX price which is linked to the electricity generation byPV (time and energy per day). Thereby, the potential of using ownconsumption from the PV system under cost minimization of theexternal needed charging power is identified. The implementedsmart charging strategies consider different scenarios of an optimalintegration of RES and hence achieve a high reduction of CO2emissions. As a reference case, the average specific CO2 emissions ofthe German electricity grid of about 500 gr. CO2 per kWh isconsidered [27]. Therefore, during a sunny day, the specific CO2emissions per kWh range between this extreme during the nightand zero gram during noon (due to the PV system).
For evaluating the impact of RES eight different strategies areapplied (see Table 1). This is due to the used methodologiesincluding the different characteristics of PV as well as the deviationin summer and winter. Consistent with the existing approachesfrom the literature there are two main distinctions considered e
uncontrolled (i) as well as coordinated charging (ii e iv). The latteris divided in three different optimization models with respect tothe PV inclusion through EV fleets and minimizing thereby thecharging costs. This is used to optimally schedule the chargingprocesses of the different EV fleets. Asmentioned in section 3.2, it isdistinguished between Perfect Foresight PV (ii), Day Ahead Foresight PV (iii) and Historic Foresight PV (iv) generation. All the fourstrategies are evaluated for summer (a) and winter (b) season (i.e.different EEX prices and PV generation) leading to eight differentresults (i.e. costs for electricity demand from the grid).
For the charging coordination, all the information are availableat the beginning of the simulation. To map the possibility of overnight charging for the commercial fleet it is assumed that about halfof the queries start the charging window from midnight to departure and the other half from arrival to midnight. This is since thesimulation time horizon is 24 h and it should be possible to cover
Fig. 2. Distribution of global radiation from the year 2013 over the length of a day forthe Stuttgart region; Data source [34].

the low price times for charging for each fleet.The optimization models consist of time slots of 15 min repre
senting 24 h of one working day (representative data for analysiswas Tuesday to Thursday), starting at 0:00 and finishing at 24:00.Hence, the model compromises 96 time slots. The simulation andoptimization are focused onworking days as two out of three of theconsidered EV fleets have mainly driving patterns during workingdays. The benchmark strategy (i) is the heuristic model of uncontrolled charging. The charging process starts as soon as the EV arrives at the parking garage. Moreover, the charging power isconstant over the charging process and considers the local as wellas global wattage limitations. The overall costs are calculated bymultiplication of the needed external charging power with thecorresponding EEX prices during that time of day.
For all the models (heuristic and three optimization models)additionally, a MCS is applied to identify the impact of the variationof the three parameters (ta, td, r) involved due to the underlyingPDFs. Therefore, 1000 runs of the MCS are done for each of themodels. For every run of the MCS, there is a new set of queries (90queries for each fleet) used for each of the three EV fleets as well asnew daily PV generation to cope with the underlying PDFs of theregarding parameters. Moreover, the advantage of the MCS is thatusing the underlying PDFs of all the parameters a variety ofdifferent possible days are covered even though the simulation isonly for 24 h.
As mentioned above, the optimization models are combinedwith a simulation model to cover several days. Different EEX pricesare respectively chosen for winter and summer days and one day ispicked randomly out of about 90 possible summer days and thepredicted PV forecast generation is chosen accordingly. Thisassumption is based on works of e. g. Ref. [30], where the authorsfound out that renewable energy generation has a linkage to theEEX price and is reflected in the curve shape of the EEX prices. Forensuring the comparability between the different models, initiallyan acceptance rate of the charging queries are set to 95% as abenchmark strategy. This is introduced as the possibility exists thatnot all EVs can be charged due to limitation of the global power orrestrictions of the local power. If the queries of the three EV fleetsare managed to be charged in the benchmark strategy (which is theheuristic model and no charging coordination takes place) they canalso be charged in the optimization models. Hence, the sameacceptance rate of queries has to be fulfilled by the optimizationmodels.
4.2. Optimization model
The general objective function (2) minimizes the expendituresfor electricity demand xt from the grid, evaluated with EEX pricesct. This problem is formulated as a MILP.
minx
CXt
ðct$xtÞ (2)
For strategy (ii) the optimal costs with a priori known PV generation can be determined. This is the benchmark case for the PVintegration as there will only be one optimization. This result of the
optimization is the global optimum as perfect information isassumed. Table 2 provides an overview of the model parameters.
For a comprehensive comparison of the different strategies (ii)e(iv) a 2nd optimization step objective (3) is introduced. This accounts for the deviation from day ahead forecasted and realized PVgeneration.
minx
CXt
�a$ct$
���xrealt xt����
(3)
The 1st stage objective remains the same corresponding to theobjective function (2). Costs for the planned external neededcharging power are calculated based on the day ahead forecastedPV. In a second step as the day with its PV generation is realized the2nd optimization step objective kicks in. The alreadymade decisionregarding the purchase of electricity is taken as input in comparison to the real needed external electricity. Thereby, deviation inwhich additional external charging power is needed is evaluatedwith penalty costs. The deviation penalty a is a factor which isassumed to be two and is multiplied with the corresponding EEXprices. This deviation calculation is based on the assumption thatit will be more expensive to buy the remaining external electricityintraday than day ahead. The summation of both objectives leadsto the final costs for the strategy (iii).
The optimization programs (ii e iv) are subject to the followingconstraints:
Xt
14$pi;t di c i (4)
di qi$vi c i (5)
pi;t � 0 c i; t (6)
Xi
pi;t � GW c t (7)
Table 1Overview of the eight strategies within the used approaches.
Strategy Uncontrolled Perfect Foresight Day-Ahead Foresight Historic Foresight
Method Summer Winter Summer Winter Summer Winter Summer Winter
MCS Heuristic (i)a (i)b
MILP (ii)a (ii)b (iii)a (iii)bSMILP (iv)a (iv)b
Table 2Definitions of variables, parameters and indices.
Variables, Parameter,Indices
Description Unit
c Intraday EEX-Price ct/kWhx External charging power kWq Binary if query is served Dimensionlessd Demand kWhp Charging power kWv Query demand kWha Deviation penalty DimensionlessPV PV power kWGW Global Wattage of transformer of
parking garagekW
LW Local Wattage of charging points as w kWt Index for time steps Dimensionlessi Index for number of vehicles Dimensionless

pi;t � LW c i; t (8)
xt � 0 c t (9)
xt �Xi
pi;t PVt c t (10)
Constraint (4) ensures that the sum of all the charging's (reflected by the charging power pi,t) equals the demand di of all theaccepted queries (introduced through the binary variable qi and thecorresponding query demand vi), which is described by constraint(5). Charging power pi,t of each EV i is a limit at all times t to thelocal wattage LW (constraint (8)) and in the model set by 11 kW.Further constraints are that the charging power pi,t as well asexternal needed charging power xt is positive (constraints (6) and(9), respectively). The charging power pi,t of each vehicle i is limitedat all times t through the global wattage GW of the transformerfrom the parking garage which is enforced via constraint (7). Thisleads to an upper limit in the summation of all parallel executedcharging processes. The external needed charging power xt isintroduced by constraint (10) and results from the difference between the overall charging demand and the PV power output PVt.
4.3. Two stage stochastic optimization with sample averageapproximation method
Adding now uncertainties to the MILP can lead to different approaches to solving the stochastic problem. It is assumed that thereare two stages, first the purchase of electricity day ahead andsecond after the realization of the intraday. Therefore, the approachof the two stage stochastic optimization is used and includes thesample average approximation method [31].
The objective of strategy (iv) is to minimize the cost of the 1ststage decision plus the expected cost of the 2nd stage decision,which can be formalized as follows:
minx
Xtððct$xtÞ þ EuQðx;uÞÞ (11)
The latter expression is the recourse term. This is the expectation E of the 2nd stage objective function Q. Therein, the recoursecosts of the stochastic variable for the PV generation areminimized.There is a recourse decision variable for the missing externalneeded charging amount x. The expectation function of the expected cost can be approximated by the sample average
qNðxÞ1N
XN
j 1
Q�x;uj
�(12)
with scenarios uj , j 1;…;N with uniform probability pj 1 =N
assumed [32].Herein the scenarios are generated using the time dependent
normal distributed perturbed forecast curves. Thereby, the Latinhypercube sampling technique is utilized for the generation of thescenarios and it is applied for variance reduction. This leads to thefollowing expression:
minx
Xt
ðct$xtÞ þ 1N
XN
j 1
Q�x;uj
�(13)
This formulation is a SMILP. In this use case, 200 scenarios forthe recourse term are applied. The stochastic variable of the PVgeneration is only present in the objective function (11). Hence, theexisting constraints remain the same but the values of the variables
are now depending on the scenarios and the SMILP follows theconstraints (4)e(10).
Similar to strategy (iii) the overall costs are calculated inapplying the objective (2) to account for the deviation of the realization of the day and add this cost to the calculated ones withstochastic programming.
5. Results and discussion
The model is applied to evaluate direct load control to increasethe integration of RES and additionally minimize the charging costsfor the remaining needed charging energy under uncertainty.
5.1. Load characteristics
Fig. 3 shows the load curves of the three EV fleets which includeall accepted charging queries of all the three EV fleets. The line ofthe curves shows the medians of the 1000 simulation runs of thestrategy (i)a and the shaded surface are the areas of the 25% and75% quantiles and this represents the variation of each parameterdue to the underlying PDFs. The uncoordinated charging case reflects the different driving patterns of the EV fleets and the underlying assumptions of the models. As soon as the EVs areconnected and there is enough energy available, they startcharging. Commuters (blue area) arrive in the morning hours andhave their charging peak at that time. Short term customers (greenarea) use a parking garage more often during afternoon hourswhich is reflected by higher charging demand during that time ofthe day. With the underlying assumption of the model that some ofthe commercial fleet customers start charging at midnight andsome of them after the end of their trip, two peaks arise during theday.
In Fig. 4 the different load curves for the strategy (iii)a are displayed. Similar as in the graph before the line of the curves showthe medians of the 1000 MCS runs of the optimization model andthe shaded surface are the areas of the 25% and 75% quantiles. Incomparison to uncoordinated charging load shifting takes placeswith respect to PV utilization and taking advantage of lower electricity prices. All the three EV fleets show the flexibility to shift theirload profile. The commercial fleet customers (pink area) are able tocharge overnight, where electricity prices are low. Not surprisinglydue to the long idle time of long term customers (blue area) canthis fleet be shifted towards the generated PV power during theday. Hence, the long term customers are the fleet which takes thehighest share of PV for charging. This is represented by the highest
Fig. 3. Load distribution for uncontrolled charging, heuristic (with median curve;25% & 75% quantile shaded areas).
load curve and the biggest share of the area underneath the loadcurve of the long term customers during hours of PV generation.The peak from themorning hours of charging is shifted towards thenoon hours. PV power forecast follows close the patterns of the realPV output. Other papers show similar results for the comparison ofuncontrolled and controlled charging for one EV fleet [27].
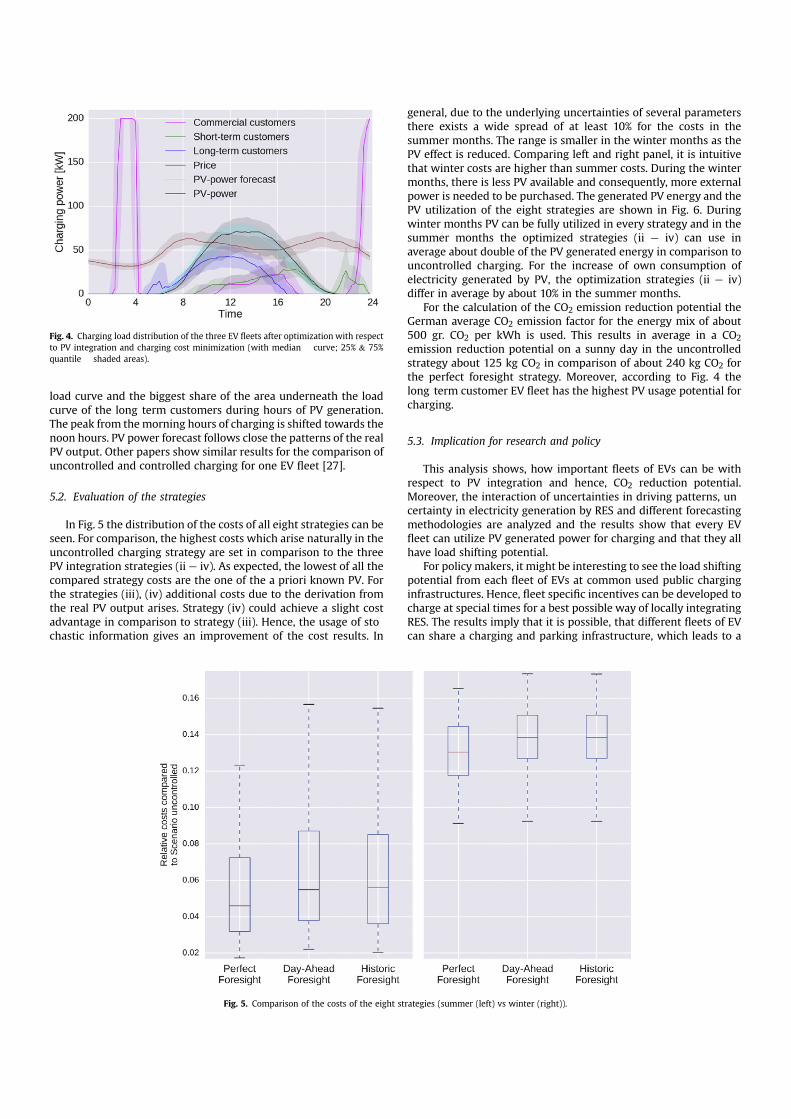
5.2. Evaluation of the strategies
In Fig. 5 the distribution of the costs of all eight strategies can beseen. For comparison, the highest costs which arise naturally in theuncontrolled charging strategy are set in comparison to the threePV integration strategies (ii e iv). As expected, the lowest of all thecompared strategy costs are the one of the a priori known PV. Forthe strategies (iii), (iv) additional costs due to the derivation fromthe real PV output arises. Strategy (iv) could achieve a slight costadvantage in comparison to strategy (iii). Hence, the usage of stochastic information gives an improvement of the cost results. In
general, due to the underlying uncertainties of several parametersthere exists a wide spread of at least 10% for the costs in thesummer months. The range is smaller in the winter months as thePV effect is reduced. Comparing left and right panel, it is intuitivethat winter costs are higher than summer costs. During the wintermonths, there is less PV available and consequently, more externalpower is needed to be purchased. The generated PV energy and thePV utilization of the eight strategies are shown in Fig. 6. Duringwinter months PV can be fully utilized in every strategy and in thesummer months the optimized strategies (ii e iv) can use inaverage about double of the PV generated energy in comparison touncontrolled charging. For the increase of own consumption ofelectricity generated by PV, the optimization strategies (ii e iv)differ in average by about 10% in the summer months.
For the calculation of the CO2 emission reduction potential theGerman average CO2 emission factor for the energy mix of about500 gr. CO2 per kWh is used. This results in average in a CO2emission reduction potential on a sunny day in the uncontrolledstrategy about 125 kg CO2 in comparison of about 240 kg CO2 forthe perfect foresight strategy. Moreover, according to Fig. 4 thelong term customer EV fleet has the highest PV usage potential forcharging.
5.3. Implication for research and policy
This analysis shows, how important fleets of EVs can be withrespect to PV integration and hence, CO2 reduction potential.Moreover, the interaction of uncertainties in driving patterns, uncertainty in electricity generation by RES and different forecastingmethodologies are analyzed and the results show that every EVfleet can utilize PV generated power for charging and that they allhave load shifting potential.
For policy makers, it might be interesting to see the load shiftingpotential from each fleet of EVs at common used public charginginfrastructures. Hence, fleet specific incentives can be developed tocharge at special times for a best possible way of locally integratingRES. The results imply that it is possible, that different fleets of EVcan share a charging and parking infrastructure, which leads to a
Fig. 4. Charging load distribution of the three EV fleets after optimization with respectto PV integration and charging cost minimization (with median curve; 25% & 75%quantile shaded areas).
Fig. 5. Comparison of the costs of the eight strategies (summer (left) vs winter (right)).

reduced demand in charging infrastructure. Moreover, expensivegrid expansions can be reduced. However, for an empirical application of the developed approach different price concepts need tobe introduced and evaluated.
6. Conclusion and outlook
The increasing share of EVs and electricity generated by RESincreases the uncertainty of loads in the distribution grid. This issueis tackled by this paper and compares different developed modelswhich compromise various methodologies from simulation, optimization and stochastic programming in order to maximize theshare of electricity from RES through charging three different EVfleets in a parking garage. This paper addresses the possibility of theload shifting potential from three different EV fleets and theircontribution to a reduction in oil usage in the transport sector andCO2 emissions in the energy sector by supporting the integration ofRES.
Results imply that stochastic programming with perturbedforecast curves of PV can achieve cost reductions in comparison today ahead forecasted PV. All three EV fleets use PV power forcharging e even under uncertainty of the generation by RES. Theutilization of RES can be nearly doubled when comparing uncontrolled to optimized charging strategies. Due to PV generationwinter costs are higher than summer costs. Long term customers(commuters) have the highest CO2 emission reduction potentials ofall three EV fleets which is consistent with the fact that this fleethas the greatest potential for load shifting towards PV generatedpower. During the day, they can offset generated PV energy. Overallthe three EV fleets could reduce the CO2 emissions on an averagesummer day by 240 kg CO2 if the German average CO2 emissionfactor for the energy mix is applied. EV fleets can be used for loadmanagement and with the shown quantification of the load flexibility and the cost savings this could lead to welfare enhancements.
A limitation of the model can be seen in constant batterycharging, not every EV would charge necessarily, as most likelyevery trip is possible as they all have a high SOC and maybe itquestionable that they charge 100%. Moreover, the set of combination of EV fleets at the parking garage can be different elsewhere.This would lead to different results in terms of the PV utilization.Depending on the chosen size of the EV fleets there might not beenough EVs to fully use the electricity from the PV unit. Animprovement of scenario generation for uncertainties can be undertaken if there is more PV data available.
Additionally, an enhancement of the model could be the integration of a battery storage systemwhich could be a new option forenergy services connected to grid balancing.
Another use case could be wind integration through EV fleets asit appears that these three EV fleets provide also during nightsconsiderable load shift potential. Hence, during the nights it is
possible to fill valleys from low demand. The base load would bestabilized. Moreover, developing incentives to charge at specialtimes for integrating local RES should be of special interest. Furtheruser incentives and cost calculation could be applied. For instance,focusing on the cost minimization from the perspective of theparking garage operator might be promising.
References
[1] Eurostat. Smarter, greener, more inclusive? Indicators to support the Europe2020 strategy. 2015.
[2] Ehsani M, Falahi M, Lotfifard S. Vehicle to grid services: potential and appli-cations. Energies 2012;5:4076 90. https://doi.org/10.3390/en5104076.
[3] Tabatabaee S, Mortazavi SS, Niknam T. Stochastic scheduling of local distri-bution systems considering high penetration of plug-in electric vehicles andrenewable energy sources. Energy 2017;121:480 90. https://doi.org/10.1016/j.energy.2016.12.115.
[4] Sehar F, Pipattanasomporn M, Rahman S. Demand management to mitigateimpacts of plug-in electric vehicle fast charge in buildings with renewables.Energy 2017;120:642 51. https://doi.org/10.1016/j.energy.2016.11.118.
[5] Seddig K, Jochem P, Fichtner W. Fleets of electric vehicles as adjustable loads -facilitating the integration of electricity generation by renewable energysources. In: Proc. 37th IAEE int. Conf. New York: Proceedings of the 37th IAEEInternational Conference; 2014. p. 1 16. p.
[6] Li Y, Kaewpuang R, Wang P, Niyato D, Han Z. An energy efficient solution:integrating Plug-In Hybrid Electric Vehicle in smart grid with renewable en-ergy. In: 2012 IEEE conf comput commun work; 2012. p. 73 8. https://doi.org/10.1109/INFCOMW.2012.6193522.
[7] Soares J, Ghazvini MAF, Borges N, Vale Z. Dynamic electricity pricing forelectric vehicles using stochastic programming. Energy 2017;122:111 27.https://doi.org/10.1016/j.energy.2016.12.108.
[8] Rahman I, Vasant PM, Singh BSM, Abdullah-Al-Wadud M, Adnan N. Review ofrecent trends in optimization techniques for plug-in hybrid, and electricvehicle charging infrastructures. Renew Sustain Energy Rev 2016;58:1039 47. https://doi.org/10.1016/j.rser.2015.12.353.
[9] Schuller A, Flath CM, Gottwalt S. Quantifying load flexibility of electric vehi-cles for renewable energy integration. Appl Energy 2015;151:335 44. https://doi.org/10.1016/j.apenergy.2015.04.004.
[10] van der Kam M, van Sark W. Smart charging of electric vehicles withphotovoltaic power and vehicle-to-grid technology in a microgrid; a casestudy. Appl Energy 2015;152:20 30. https://doi.org/10.1016/j.apenergy.2015.04.092.
[11] Rahbari O, Vafaeipour M, Omar N, Rosen MA, Hegazy O, Timmermans J-M,et al. An optimal versatile control approach for plug-in electric vehicles tointegrate renewable energy sources and smart grids. Energy 2017. https://doi.org/10.1016/j.energy.2017.06.007.
[12] Jochem P, Schonfelder M, Fichtner W. An efficient two-stage algorithm fordecentralized scheduling of micro-CHP units. Eur J Oper Res 2015;245:862 74. https://doi.org/10.1016/j.ejor.2015.04.016.
[13] Gottwalt S, Schuller A, Flath C, Schmeck H, Weinhardt C. Assessing loadflexibility in smart grids: electric vehicles for renewable energy integration.In: 2013 IEEE power energy soc gen meet; 2013. p. 1 5. https://doi.org/10.1109/PESMG.2013.6672854.
[14] Richardson DB. Electric vehicles and the electric grid: a review of modelingapproaches, Impacts, and renewable energy integration. Renew Sustain En-ergy Rev 2013;19:247 54. https://doi.org/10.1016/j.rser.2012.11.042.
[15] Novosel T, Perkovi L, Ban M, Keko H, Puk T, Kraja G. Agent based modellingand energy planning e Utilization of MATSim for transport energy demandmodelling. Energy 2015;92:466 75. https://doi.org/10.1016/j.energy.2015.05.091.
[16] Tushar KHM, Assi C, Member S, Maier M. Smart microgrids: optimal jointscheduling for electric vehicles and home appliances. IEEE Trans Smart Grid2014;5:239 50.
[17] Pedro HTC, Coimbra CFM. Assessment of forecasting techniques for solar
Fig. 6. Comparison of the PV utilization of the eight strategies.

power production with no exogenous inputs. Sol Energy 2012;86:2017 28.https://doi.org/10.1016/j.solener.2012.04.004.
[18] Saber AY, Venayagamoorthy GK. Resource scheduling under uncertainty in asmart grid with renewables and plug-in vehicles. IEEE Syst J 2012;6:103 9.https://doi.org/10.1109/JSYST.2011.2163012.
[19] Honarmand M, Zakariazadeh A, Jadid S. Integrated scheduling of renewablegeneration and electric vehicles parking lot in a smart microgrid. EnergyConvers Manag 2014;86:745 55. https://doi.org/10.1016/j.enconman.2014.06.044.
[20] Honarmand M, Zakariazadeh A, Jadid S. Optimal scheduling of electric vehi-cles in an intelligent parking lot considering vehicle-to-grid concept andbattery condition. Energy 2014;65:572 9. https://doi.org/10.1016/j.energy.2013.11.045.
[21] Figueiredo R, Nunes P, Brito MC. The feasibility of solar parking lots for electricvehicles. Energy 2017;140:1182 97. https://doi.org/10.1016/j.energy.2017.09.024.
[22] Aghajani S, Kalantar M. A cooperative game theoretic analysis of electric ve-hicles parking lot in smart grid. Energy 2017;137:129 39. https://doi.org/10.1016/j.energy.2017.07.006.
[23] Braam F, Groß A, Mierau M, Kohrs R, Wittwer C. Coordinated charge man-agement for battery electric vehicles. Comput Sci Res Dev 2016. https://doi.org/10.1007/s00450-016-0307-6.
[24] Heydarian-Forushani E, Golshan MEH, Shafie-khah M. Flexible interaction ofplug-in electric vehicle parking lots for efficient wind integration. Appl Energy2016;179:338 49. https://doi.org/10.1016/j.apenergy.2016.06.145.
[25] Tulpule PJ, Marano V, Yurkovich S, Rizzoni G. Economic and environmental
impacts of a PV powered workplace parking garage charging station. ApplEnergy 2013;108:323 32. https://doi.org/10.1016/j.apenergy.2013.02.068.
[26] EEX. Energy_Spot_History_2013. 2015. https://www.eex.com/de/marktdaten/marktdaten-download. [Accessed 12 January 2015].
[27] Jochem P, Babrowski S, Fichtner W. Assessing CO2 emissions of electric ve-hicles in Germany in 2030. Transp Res Part A 2015;78:68 83. https://doi.org/10.1016/j.tra.2015.05.007.
[28] BMVBS. Mobilitatsstudie. Kraftfahrzeugverkehr in Deutschland 2010, vol.2010; 2010. Braunschweig.
[29] Schierenbeck S, Graeber D. Ein distanzbasiertes Hochrechnungsverfahren fürdie Einspeisung aus Photovoltaik. Energiewirtschaftliche Tagesfr 2010;60:60 4.
[30] Paraschiv F, Erni D, Pietsch R. The impact of renewable energies on EEX day-ahead electricity prices. Energy Policy 2014;73:196 210. https://doi.org/10.1016/j.enpol.2014.05.004.
[31] Ahmed S, Shapiro A. The sample average approximation method for stochasticprograms with integer recourse. Science 2002;12(80):1 24. doi:10.1.1.5.3721.
[32] Verweij B, Ahmed S, Kleywegt AJ, Nemhauser G, Shapiro A. The sampleaverage approximation method applied to stochastic routing problems: acomputational study. Comput Optim Appl 2003;24:289 333. https://doi.org/10.1023/A:1021814225969.
[33] ADACautotest. Nissan Leaf. 2012. https://www.adac.de/_ext/itr/tests/Autotest/AT4719_Nissan_Leaf/Nissan_Leaf.pdf. [Accessed 24 January 2014].
[34] Meteotest. Meteotest. 2014. http://www.meteotest.ch/. [Accessed 1 March2014].

Repository KITopen
Dies ist ein Postprint/begutachtetes Manuskript.
Empfohlene Zitierung:
Seddig, K.; Jochem, P.; Fichtner, W.
Integrating renewable energy sources by electric vehicle fleets under uncertainty.
2017. Energy, 141.
doi:10.554/IR/1000077130
Zitierung der Originalveröffentlichung:
Seddig, K.; Jochem, P.; Fichtner, W.
Integrating renewable energy sources by electric vehicle fleets under uncertainty.
2017. Energy, 141, 2145-2153.
doi:10.1016/j.energy.2017.11.140
Lizenzinformationen: KITopen-Lizenz