integrated waste management - donlin gold eis iii b - waste... · gold integrated waste management...
TRANSCRIPT

July 2012
INTEGRATED WASTE MANAGEMENT
WASTE ROCK
MANAGEMENT PLAN
PLAN OF OPERATIONS—VOLUME III B
Donlin Gold Project
PLAN OF OPERATIONS Integrated Waste Management Plan
WASTE ROCK MANAGEMENT PLAN
Donlin Gold Project
July 2012
4720 Business Park Blvd. Suite G-25
Anchorage, Alaska 99503
Prepared By:
SRK Consulting (U.S.), Inc. 4710 Business Park Blvd. Suite F-40
Anchorage, Alaska 99503

Waste Rock Management Plan Donlin Gold Project Table of Contents
Donlin Gold i July 2012
TABLE OF CONTENTS Table of Contents ................................................................................................................. i
Appendices ................................................................................................................. i Figures ...................................................................................................................... ii Tables ....................................................................................................................... ii Acronyms ................................................................................................................. iii Units of Measure ...................................................................................................... iv Elements and Compounds ......................................................................................... v
1.0 INTRODUCTION ......................................................................................................1-1 1.1 Authors .......................................................................................................1-1 1.2 Project Location and Summary ...................................................................1-1 1.3 Objective and Scope ...................................................................................1-4
2.0 SITE CONDITIONS ..................................................................................................2-1 2.1 Physical Setting...........................................................................................2-1 2.2 Climate ........................................................................................................2-1 2.3 Geology ......................................................................................................2-3
2.3.1 Regional Geology .........................................................................2-3 2.3.2 Project Geology ............................................................................2-5 2.3.3 Major Rock Types .........................................................................2-7 2.3.4 Geology Underlying the Waste Rock Facility ................................2-8
3.0 WASTE ROCK CHARACTERIZATION ....................................................................3-1 3.1 Waste Rock Geochemical Modeling ............................................................3-4 3.2 Development of Waste Rock Classification System ....................................3-6 3.3 Mine Plan and Waste Rock Distribution ......................................................3-8
4.0 WASTE ROCK MANAGEMENT ...............................................................................4-1 4.1 Waste Rock Classification ...........................................................................4-1 4.2 Waste Rock Mining and Segregation ..........................................................4-1 4.3 Waste Rock Designation and Placement ....................................................4-2
4.3.1 American Creek Valley WRF ........................................................4-4 4.3.2 Isolated Cells on WRF ..................................................................4-5 4.3.3 ACMA Pit Backfill ..........................................................................4-7 4.3.4 Tailings Storage Facility ................................................................4-7
5.0 WASTE ROCK FACILITY DESIGN ..........................................................................5-1 5.1 Waste Rock Facility Construction ................................................................5-1 5.2 Waste Rock Facility Reclamation ................................................................5-2
6.0 MONITORING AND REPORTING ............................................................................6-1 6.1 Operational Monitoring and Reporting .........................................................6-1 6.2 Closure and Post-Closure Monitoring and Reporting ...................................6-1
7.0 REFERENCES .........................................................................................................7-1
APPENDICES
Appendix A Summary of Mine Production Schedule Appendix B Block Model Views

Waste Rock Management Plan Donlin Gold Project Table of Contents
Donlin Gold ii July 2012
FIGURES
Figure 1-1: Project Location Map .....................................................................................1-3 Figure 2-1: Regional Geology Map ...................................................................................2-5 Figure 2-2: Geologic Map of the Donlin Gold Area ...........................................................2-6 Figure 3-1: Total Waste Rock Material Distribution...........................................................3-9 Figure 4-1: Waste Rock and Stockpile Locations .............................................................4-3 Figure 4-2: PAG 6 Cell Evolution ......................................................................................4-6
TABLES
Table 2-1: Estimated Monthly Precipitation at Donlin ......................................................2-2 Table 2-2: Potential Evaporation/Sublimation and Mean Temperature ............................2-3 Table 3-1: Characteristics of Samples Tested Using Sequential MWMP .........................3-3 Table 3-2 Site-specific Calculation of ABA Parameters ..................................................3-5 Table 3-3: Donlin Gold Waste Rock Management Categories (SRK 2011) .....................3-7 Table 3-4: Donlin Gold Waste Rock Classification System ..............................................3-8 Table 3-5: Donlin Gold Waste Rock Tonnage Estimates .................................................3-9 Table 4-1: Waste Rock Tonnage by Facility ....................................................................4-4 Table 5-1: Waste Rock Facility Design Parameters ........................................................5-1
Waste Rock Management Plan Donlin Gold Project Table of Contents
Donlin Gold iii July 2012
ACRONYMS
ABA Acid Based Accounting AMEC AMEC Americas Limited AP acid potential ARD acid rock drainage BC British Columbia BGC BGC Engineering Inc. CIL carbon-in-leach CWD Contact Water Dam DF Denali-Farewell Donlin Gold Donlin Gold LLC GPS global positioning system GWK greywacke HCT humidity cell test ICP inductively-coupled plasma INF Iditarod-Nixon Fork LLDPE linear low-density polyethylene MD mafic dykes MDAG Mine Drainage Assessment Group ML metal leaching MWMP Meteoric Water Mobility Procedure NAG non-acid generating NP neutralizing potential OVB overburden PAG Potentially Acid Generating Plan Waste Rock Management Plan RD Rhyodacite RDX oxidation reduction potential SAG semi-autogenous grinding SHL shale SRK SRK Consulting (U.S.), Inc. TSF tailings storage facility VPC volcano-plutonic complexes WRF waste rock facility WRMC waste rock management categories

Waste Rock Management Plan Donlin Gold Project Table of Contents
Donlin Gold iv July 2012
UNITS OF MEASURE
% percent < less than = equal to > greater than °C degree Celsius °F degree Fahrenheit cfs cubic feet per second cm centimeters ft foot/feet g/t grams per tones ha hectares kg kilogram km kilometer Ktonnes thousand metric tonnes Ktons thousand short tons lb pound/pounds m meter Ma million years m3 cubic meters m3/s cubic meters per second mm millimeter Mm3 million cubic meters msl mean sea level Mst million short tons Mt million tonnes MW megawatt oz/st Troy ounces per short ton st short ton stpd short tons per day t tonne (1,000 kg) tpd tonnes per day yd3 cubic yard

Waste Rock Management Plan Donlin Gold Project Table of Contents
Donlin Gold v July 2012
ELEMENTS AND COMPOUNDS
H2SO4 sulfuric acid NPCO3 neutralizing potential from carbonate minerals ST total sulfur concentration CaCO3/t Amount of Calcium Carbonate (or equivalent) per ton (tonne) required to
neutralize acid generating material As/S arsenic/sulfur ratio

Waste Rock Management Plan Donlin Gold Project Introduction
Donlin Gold 1-1 July 2012
1.0 INTRODUCTION
This Waste Rock Management Plan (Plan) has been developed by Donlin Gold LLC1 (Donlin Gold) for the proposed Donlin Gold project to define the procedures and practices associated with the characterization, management, placement of waste (development) rock, and final closure at the proposed Donlin Gold mine. The Plan is one volume of the Donlin Gold Integrated Waste Management Plan.
The Plan may be revised periodically during operations as additional data become available through the monitoring procedures identified in this report.
1.1 Authors
Preparation of this document was coordinated by SRK Consulting (U.S.), Inc. (SRK), using information provided by, AMEC Americas Limited (AMEC), ARCADIS U.S. Inc., BGC Engineering Inc. (BGC), and Barrick Gold U.S.
1.2 Project Location and Summary
Donlin Gold is proposing the development of an open pit, hardrock gold mine in southwestern Alaska, about 277 miles (446 km) west of Anchorage, 145 miles (233 km) northeast of Bethel, and approximately 10 miles (16 km) north of the village of Crooked Creek (Figure 1-1).This document provides an overview of the proposed plans for mining and milling the ore, water management, waste rock management, and the support facilities and infrastructure required to support the operation.
The gold resource is hosted in intrusive and sedimentary rock in two main areas of the property, Lewis and ACMA, with 80% found in intrusive rock. The proven and probable2 resources total 556.5 Mst (504.8 Mt) with an average grade of 0.061 oz/st (2.09 g/t). With mill recovery at approximately 90%, the operation would produce an average of over 1 million ounces of gold annually.
The proposed Donlin Gold project would require three to four years to construct, with the active mine life currently projected to be approximately 27.5 years. The mine is proposed to be a year-round, conventional “truck and shovel” operation, using both bulk and selective mining methods. The operation would have a projected average mining rate of 422,000 stpd (383,000 tpd), or 154 Mst (140 Mt) per year, and an average mill production rate of 59,000
1 Donlin Gold LLC is a limited liability company equally owned by Barrick Gold U.S. Inc. and NovaGold Resources Alaska, Inc. 2 Based on an assessment of qualitative, non-technical factors, Barrick Gold Corporation treats mineralization at Donlin Creek as measured and indicated resources, rather than proven and probable reserves for securities reporting, accounting, and other public disclosure purposes. Mineral reserves are those parts of mineral resources which, after the application of all mining factors, result in an estimated tonnage and grade which is the basis of an economically viable project after taking account of all relevant processing, metallurgical, economic, marketing, legal, environment, socio-economic, and government factors. Mineral reserves are inclusive of diluting material that will be mined in conjunction with the mineral reserves and delivered to the treatment plant or equivalent facility. The term ‘mineral reserve’ need not necessarily signify that extraction facilities are in place or operative, or that all governmental approvals have been received. It does signify that there are reasonable expectations of such approvals.

Waste Rock Management Plan Donlin Gold Project Introduction
Donlin Gold 1-2 July 2012
stpd (53,500 tpd). Milling components include a gyratory crusher, semi-autogenous grinding (SAG) and ball mills, followed by flotation, concentration, pressure oxidation, and carbon-in-leach (CIL) process circuits. Onsite retort and gold furnaces would produce an end-product of gold doré bars, which would be shipped to a custom refinery for further processing.
A tailings storage facility (TSF) would encompass an area of 2,351 acres (951 ha), with a total capacity of approximately 334,298 acre-ft (412.35 Mm3) of mill tailings, decant water, and storm water. Total waste rock material is estimated at 3,048 Mst (2,765 Mt), with approximately 2,460 Mst (2,232 Mt) placed in a waste rock facility (WRF) located outside the mine pit, 114 Mst (103 Mt) used for construction, and the remaining 467 Mst (424 Mt) of waste rock backfilled in the pit.
Electrical power would be supplied by 12 onsite natural-gas fueled reciprocating engines with heat recovery and steam generation (a combined cycle system to supply power for a total connected load of 227 MW, with an average running load of 153 MW, with a peak load of 184 MW.
The natural gas would be transported via a 313-mile (503 km), 14-inch (35.5 cm) diameter buried pipeline from an existing 20-inch (51 cm) natural gas pipeline near Beluga, Alaska, to the proposed Donlin Gold mine site.
General cargo for operations would be transported from terminals in Seattle; Vancouver, British Columbia (BC); or Dutch Harbor via marine barge to Bethel. At Bethel, it is expected that cargo would be transferred to the dock for temporary storage or loaded directly onto river barges for transport up the Kuskokwim River to a port constructed at Jungjuk Creek. A 30-mile (48 km), all-season access road would be constructed from the proposed Jungjuk (Angyaruaq) Port to the mine site.
Fuel would be transported to Dutch Harbor by tanker, then to Bethel via marine barge. At Bethel fuel would either be transferred directly to double-hull river barges, or off-loaded for temporary storage. From Jungjuk Port, fuel would be transferred to the mine site fuel storage facility via tank trucks.

Eek
Flat
Hope
Knik
Akiak
Ekwok
Ophir
Aniak
Anvik
Kenai
Homer
Telida
Bethel
Kipnuk
Newtok
MedfraKotlik
Tyonek
WillowPalmer
Iliamna
Igiugig
NikolaiTakotna McGrath
Emmonak
Kasilof
EklutnaSusitna
HoustonWasilla
NikiskiKasigluk Akiachak
Kwethluk
Napakiak
Tuluksak
Levelock
Newhalen
Shageluk
Marshall
Hamilton
Stebbins
Alakanuk
Soldotna
Seldovia
Cantwell
Iditarod
Big Lake
Skwentna
Portlock
NanwalekKokhanok
Kachemak
Grayling
Napaskiak
Nightmute
Quinhagak
Koliganek
Aleknagik
Nondalton
Red DevilSleetmute
NapaimuteOhogamiut
Talkeetna
Ninilchik
Salamatof
Pedro Bay
Anchorage
Chefornak
Holy Cross
Clam Gulch
Moose PassAtmautluak
Oscarville
NikolaevskKongiganak
Georgetown
Nunapitchuk
Toksook Bay
Stony River
Scammon Bay
Port Graham
Bill Moores Slough
Petersville
Birch Creek
Tuntutuliak
Chuathbaluk
Kwigillingok
Goodnews Bay
New Stuyahok
Lime Village
Pitkas Point
Chuloonawick
Saint Mary's
Anchor Point
Port Alsworth
Crooked Creek
Saint Michael
Nunam Iqua
Pilot Station
Upper KalskagLower Kalskag
Cooper Landing
Russian Mission
Mountain Village
Chena Hot Springs
Beluga
Mertarvik
KUSKOKWIM BAY
CO
OK
IN
L E T
Yukon Delta National Wildlife Refuge
Innoko National Wildlife Refuge
Denali National Park & Preserve
Lake Clark NationalPark & Preserve
Wood-TikchikState Park
Illiamna LakeTogiak National Wildlife Refuge
Yukon River
Kuskokw
im
River
Kusko
kwim
River
Rive r
S us it
n a
Yukon
River
DONLIN GOLD
PROJECT
PROJECT LOCATION MAP0 40 8020 km
FIGURE:SCALE:
DG: PER0130.mxd, 07/11/12, R05
0 25 5012.5 mi
DONLIN GOLD PROJECT
1-1Populated Places
Proposed Natural Gas Pipeline Alignment
Proposed Infrastructure Layout
Federal Administrative Boundaries
State Administrative Boundaries Seward Meridian, UTM Zone 5, NAD83
A L A S K AC A N A D A
R U S S I A
Gulf of AlaskaBering Sea
Chukchi Sea
Nome
Barrow
Bethel Anchorage
Fairbanks
Juneau
Donlin Gold

Waste Rock Management Plan Donlin Gold Project Introduction
Donlin Gold 1-4 July 2012
1.3 Objective and Scope
This Plan documents the procedures for characterizing, classifying, and managing waste rock associated with the proposed Donlin Gold project for surface disposal. The first step in developing a Plan is to characterize the geochemical behavior of the various waste rock material types associated with the project. This characterization defines the potential for the waste rock material to generate acid or leach deleterious constituents. The characterization is used to develop a classification system that can be used during implementation of a waste rock handling plan that manages waste rock materials for different facilities. Specifically, this Plan includes:
• a summary of the geochemical characterization programs that define the geochemical behavior of the waste rock
• the volume of waste rock to be produced according to the current long-range mine plan
• waste rock classification according to operational criteria for waste rock management
• waste rock placement design and procedures to minimize potential oxidation and solute generation
• reclamation and closure activities planned for the waste rock disposal facilities.
This Plan incorporates acid-base accounting and solute generation information, and general waste rock volumes and types, in order to optimize the development of waste rock disposal facilities and minimize the potential for constituent release, while supporting final closure actions.
This Plan will periodically modified to integrate data from ongoing geochemical studies, mine modeling changes, mine planning, WRF performance monitoring, or other information.
Waste Rock Management Plan Donlin Gold Project Site Conditions
Donlin Gold 2-1 July 2012
2.0 SITE CONDITIONS
2.1 Physical Setting
The proposed Donlin Gold project is located in an area of low-lying, well-rounded ridges on the western portion of the Kuskokwim Mountains, with elevations ranging from 500 to 2,100 ft (152 to 640 m). Area vegetation is typically hard shrubs and small trees. Hillsides are forested with black spruce, alder, birch, and larch. Soft muskeg and discontinuous permafrost can be found in poorly drained areas at lower elevations. The current exploration project has an all-season camp with facilities to house a workforce of up to 160 to accommodate exploration, environmental, geotechnical, and engineering studies. There is currently no overland access to the site. All equipment, supplies, and personnel are currently transported by air. An adjacent 5,000 ft (1,524 m) airstrip is capable of handling aircraft as large as a C-130 Hercules. The project is serviced by charter air services out of Anchorage and Aniak.
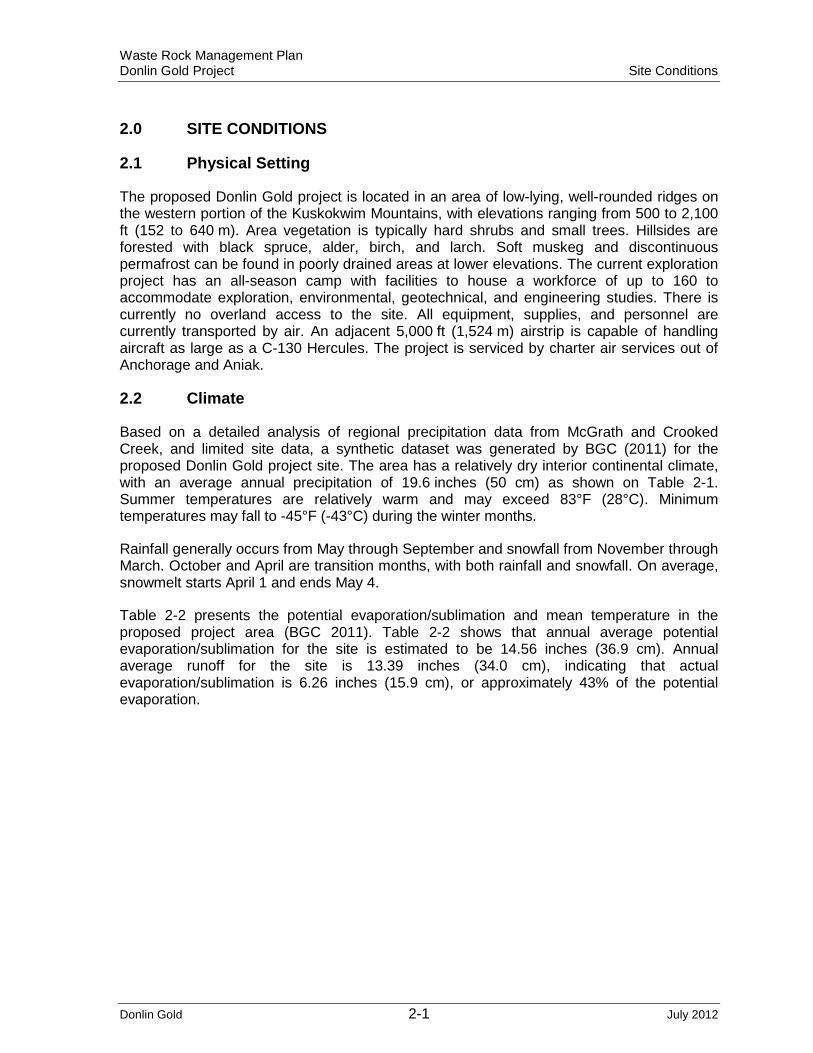
2.2 Climate
Based on a detailed analysis of regional precipitation data from McGrath and Crooked Creek, and limited site data, a synthetic dataset was generated by BGC (2011) for the proposed Donlin Gold project site. The area has a relatively dry interior continental climate, with an average annual precipitation of 19.6 inches (50 cm) as shown on Table 2-1. Summer temperatures are relatively warm and may exceed 83°F (28°C). Minimum temperatures may fall to -45°F (-43°C) during the winter months.
Rainfall generally occurs from May through September and snowfall from November through March. October and April are transition months, with both rainfall and snowfall. On average, snowmelt starts April 1 and ends May 4.
Table 2-2 presents the potential evaporation/sublimation and mean temperature in the proposed project area (BGC 2011). Table 2-2 shows that annual average potential evaporation/sublimation for the site is estimated to be 14.56 inches (36.9 cm). Annual average runoff for the site is 13.39 inches (34.0 cm), indicating that actual evaporation/sublimation is 6.26 inches (15.9 cm), or approximately 43% of the potential evaporation.

Waste Rock Management Plan Donlin Gold Project Site Conditions
Donlin Gold 2-2 July 2012
Table 2-1: Estimated Monthly Precipitation at Donlin
Month
Total Precipitation Snowfall Rainfall
(in) (mm) (in) (mm) (in) (mm)
January 1.16 29.4 1.16 29.4 0.00 0.0
February 0.89 22.6 0.89 22.6 0.00 0.0
March 0.80 20.3 0.64 16.2 0.16 4.1
April 0.40 10.1 0.04 1.1 0.36 9.0
May 1.05 26.7 0.00 0.0 1.05 26.7
June 2.15 54.7 0.00 0.0 2.15 54.7
July 2.61 66.2 0.00 0.0 2.61 66.2
August 3.70 93.9 0.00 0.0 3.70 93.9
September 2.66 67.6 0.00 0.0 2.66 67.6
October 1.74 44.3 0.85 21.7 0.89 22.6
November 1.17 29.7 1.17 29.8 0.00 0.0
December 1.30 33.1 1.30 33.1 0.00 0.0
Annual 19.6 499 6.1 154 13.6 345
Source: BGC 2011

Waste Rock Management Plan Donlin Gold Project Site Conditions
Donlin Gold 2-3 July 2012
Table 2-2: Potential Evaporation/Sublimation and Mean Temperature
Month
Potential Evaporation/Sublimation
(in) Millimeters
(mm) Mean
Temperature (ºF) Centigrade
(ºC)
January 0.09 2.3 -7.4 -21.9
February 0.11 2.8 0.7 -17.4
March 0.19 4.8 10.4 -12.0
April 0.55 14 27.9 -2.3
May 2.84 72 45.3 7.4
June 3.58 91 56.5 13.6
July 3.31 84 59.2 15.1
August 2.09 53 54.5 12.5
September 1.50 38 44.2 6.8
October 0.12 3 25.5 -3.6
November 0.11 2.8 5.9 -14.5
December 0.07 2 -6.0 -21.1
Total 14.56 370 -
2.3 Geology
2.3.1 Regional Geology
The Kuskokwim region of southwestern Alaska is predominately underlain by the Upper Cretaceous Kuskokwim Group. These include coarse- through fine-grained clastic rocks that reach an estimated thickness of greater than 6.2 miles (10 km) (Decker et al., 1994). Minor basin margin andesitic tuff and flows are also present near the top of the sequence and may represent an initiation of volcanism that later culminated in widespread Late Cretaceous and early Tertiary igneous activity (Goldfarb et al., 2004). These basin margin volcanic rocks also suggest that deep penetrating structures controlled basin subsidence. A regional geologic map is provided as Figure 2-1.
Kuskokwim Group sediments were deposited between 100 and 77 million years (Ma) ago in a 93-mile (150 km) long, northeast-trending basin that subsided between a series of amalgamated terranes including Mesozoic marine volcanic rocks, Paleozoic clastic and carbonate rocks, and Proterozoic metamorphic rocks. This basin is interpreted to have formed as a post-accretion foreland basin in a strike-slip environment. Kuskokwim Group rocks show evidence of only the lowest grades of regional burial metamorphism (Goldfarb et al., 2004).
Igneous activity was coeval with Late Cretaceous sedimentation in the Kuskokwim basin and continued into early Tertiary. Intermediate composition volcano-plutonic complexes (VPCs) intrude and overlie Kuskokwim Group rocks throughout the region. The igneous rocks are predominantly tuffs, flows, and composite comagmatic monzonite to granodiorite

Waste Rock Management Plan Donlin Gold Project Site Conditions
Donlin Gold 2-4 July 2012
plutons. Volcanic and plutonic rocks range in age from 76 to 63 Ma and 71 to 66 Ma, respectively. Kuskokwim Group sedimentary rocks are often extensively hornfelsed near plutons. Volumetrically minor Late Cretaceous intermediate to mafic intrusive bodies are also common and often associated with mercury and antimony occurrences (Goldfarb et al., 2004). Felsic to intermediate hypabyssal granite to granodiorite porphyry dikes, sills, and plugs are also widely distributed and often associated with placer and lode gold occurrences (e.g., Donlin Gold deposit). Many dikes were emplaced within or near northeast-trending fault zones. Contacts between porphyry igneous rocks and Kuskokwim Group sedimentary rocks are generally sharp and do not display hornfelsed margins. Age dates range from 70 to 65 Ma, but a genetic association with the VPCs is uncertain.
The proposed Donlin Gold project area lies between two regional, northeast-trending, dextral slip faults that dominate the structural setting of southwest Alaska – the Holitna segment of the Denali−Farewell (DF) fault system to the south and the Iditarod−Nixon Fork (INF) fault system to the north (Goldfarb et al., 2004). The region contains numerous NE to ENE- and NW to WNW-trending lineaments that probably represent steeply dipping strike-slip faults. Fault movement in the Donlin Creek region appears to be right lateral on northeast structures and left lateral on northwest structures. The proposed Donlin Gold project is located along a splay of the INF fault system (Goldfarb et al., 2004). A regional NNE-SSW compression event, lasting from approximately 80 Ma to approximately 65 Ma, caused folding, tilting, and low-angle reverse faulting of Kuskokwim Group sedimentary rocks and culminated with emplacement of granite porphyry dikes and sills. Compressional deformation in the region probably occurred soon after sedimentation, because folds are truncated by the volcano-plutonic complexes. East-trending open folds are prominent east of the proposed Donlin Gold project area but appear truncated to the west by the proposed Donlin Gold project fault, a splay of the INF fault. Local post-intrusion folding developed as accommodation of intrusive events or as drag folds along faults.

Waste Rock Management Plan Donlin Gold Project Site Conditions
Donlin Gold 2-5 July 2012
Figure 2-1: Regional Geology Map
2.3.2 Project Geology
Property-scale geology is largely interpreted from trenches and drill holes because outcrop is limited and of generally poor quality. Figure 2-2 illustrates the property-scale igneous geology, including the resource area, which is located between the Queen deposit area on the northeast and the airstrip on the southwest. Undivided Kuskokwim Group sedimentary rocks (uncolored), and several phases of granite porphyry associated with the 70 to 65 Ma igneous events, are the main rock units. Sedimentary bedding strikes SE and dips moderately to the SW. Overall, sedimentary structure in the northern resource area is monoclinal, while sedimentary rocks in the southern resource area display apparent open easterly-trending folds.

Waste Rock Management Plan Donlin Gold Project Site Conditions
Donlin Gold 2-6 July 2012
Figure 2-2: Geologic Map of the Donlin Gold Area
Note: Shows igneous rocks, faults, and gold prospects. RDA – aphanitic porphyry RDX – crowded porphyry RDXL– lathe rich porphyry RDXB – blue porphyry
The oldest igneous rocks at the proposed Donlin Gold project are 74 to 72 Ma intermediate to mafic dikes and sills. They are not abundant but occur widely throughout the property as generally thin and discontinuous bodies. The later and much more voluminous 70 to 65 Ma granite porphyry dikes and sills vary from a few feet to 200 ft (60 m) wide and intrude the sedimentary rocks along a 5-mile long by 2-mile wide (8 x 3 km) NE- trending corridor. The granite porphyry units occur as WNW-trending sills in the southern resource area and NE-trending dikes farther north. The felsic dikes and sills have similar mineralogy and the porphyry texture indicates relatively shallow emplacement. These rocks belong to the regionally important granite porphyry igneous event and are classified into five textural varieties of rhyodacite. Rhyodacite is a term normally reserved for felsic to intermediate composition volcanic to sub-volcanic rock types, but it is also used informally for igneous rocks emplaced at a shallow depth. These units are chemically similar, temporally and spatially related, and probably reflect textural variations of related intrusive events. Differences include phenocryst size and abundance, groundmass texture, and overall color.
The earliest deformation (pre-74 through 68 Ma) includes flexural slip folding and southward tilting of the sedimentary sequence. Continued compression further advanced the fold-thrust response and formed ESE-trending and plunging folds or monoclinal warps. Shallow to moderately north-dipping reverse or thrust fault structures developed along bedding slips

Waste Rock Management Plan Donlin Gold Project Site Conditions
Donlin Gold 2-7 July 2012
and competency breaks and ramped through fold hinge areas. Mafic dikes and sills (74 to 72 Ma) were intruded into compressional structures prior to intrusion of rhyodacite dikes and sills (72 to 70 Ma) into NE extensional faults and layer-parallel weaknesses, respectively. NE- and NW-striking oblique slip faults formed near the end of the compression event and displaced earlier low-angle reverse faults, as well as intrusive rocks. As intrusive activity decreased, gold bearing hydrothermal fluids utilized NNE fractures formed during ESE-WNW extension (72 to 65 Ma, averaging 70 Ma).
2.3.3 Major Rock Types
The proposed Donlin Gold project deposit is hosted by rhyodacitic sills and dikes intruded into a sedimentary package consisting of calcareous and non-calcareous shale and greywacke. The sedimentary host rocks contain diagenetic iron sulfide mineralization, as well as iron, arsenic, antimony, and mercury sulfide minerals introduced with the gold mineralization. The intrusive rocks contain the same sulfide minerals introduced by mineralizing processes. Mineralogical analyses have shown that carbonate minerals occur variably in both rock type groups. Carbonate minerals are dominated by magnesium- and iron-enriched varieties such as dolomite, ankerite, and siderite, rather than pure calcium carbonates such as calcite.
The following sections provide a description of the major rock types associated with the proposed Donlin Gold project based on observations made by SRK geologists (SRK 2007).
Shale
The majority of shale examined in core contained no visible sulfide minerals. In the intervals where pyrite was observed, it occurred mainly as very fine disseminated grains but also as larger blebs and veinlets. Generally, carbonates did not occur in the matrix of the shale in the intervals examined, but rather as veinlets, which appeared to be zones of weakness that would break preferentially. Sparry dolomite was rarely observed, and no arsenopyrite was observed.
Greywacke
Similar to the shale, the majority of greywacke examined contained no visible sulfide minerals. Pyrite, where observed, was not commonly disseminated, but instead occurred as blebs and veinlets associated with carbonate.
The iron content of carbonates was commonly apparent by iron staining on veinlets in core. Similarly, brown weathering indicative of iron carbonates was also observed in road cuts throughout the project area. In intervals where the carbonate veinlets were not stained by iron, the white carbonate minerals were identified as dolomite, based on its slow reaction with dilute hydrochloric acid. Like the shale, arsenopyrite was not observed in the greywacke. Coarse vuggy stibnite and coarse disseminated realgar were observed.
Rhyodacite
The term “Rhyodacite” is broadly used for the various porphyries that are observed within the project area. Both pyrite and arsenopyrite were observed in the rhyodacite in a variety of forms. Pyrite occurs in finely to coarsely disseminated sulfide veinlets and in mixed carbonate and sulfide veinlets. Carbonates occur mainly as veinlets and rarely as part of the

Waste Rock Management Plan Donlin Gold Project Site Conditions
Donlin Gold 2-8 July 2012
matrix. Natural weathering of rhyodacite in outcrop has resulted in orange brown mottles, suggesting oxidation and leaching of sulfides, but no sulfide minerals were observed in the fractures. In one outcrop of rhyodacite (possibly crowded porphyry), green staining was observed, which appeared to be malachite.
2.3.4 Geology Underlying the Waste Rock Facility
Several field investigations have been carried out within the proposed footprint of the WRF. The investigations started in 2004 and included test pit excavations, auger hole drilling, core drilling, ground reconnaissance, seismic refraction surveys, and resistivity surveys. The overburden consisted of peat, loess, colluviums, alluvium, and terrace gravel deposits to shallow levels. The bedrock in the area consists of greywackes, siltstones, and shales of the Cretaceous Kuskokwim Group.

Waste Rock Management Plan Donlin Gold Project Waste Rock Characterization
Donlin Gold 3-1 July 2012
3.0 WASTE ROCK CHARACTERIZATION
Several extensive geochemical characterization studies have been completed that define the geochemistry of waste rock materials associated with the proposed Donlin Gold project. Geochemical data collected during these waste rock characterization programs were evaluated to characterize and predict the potential reactivity and stability of waste rock that would be extracted from the pit. The two main considerations of the waste rock characterization programs include:
• acid generation due to oxidation of sulfide minerals, which, when mixed with water, can form sulfuric acid (H2SO4), leading to acid rock drainage (ARD)
• potential for leaching of metals and metalloids (e.g., arsenic) and salts (e.g., sulfate).
The processes of acid generation and leaching can operate independently, although the development of acidic conditions enhances the leachability of many constituents.
The characterization programs completed for the proposed Donlin Gold project utilized the following testing methodologies:
• mineralogy, including optical and quantitative (Rietveld method) x-ray diffraction mineralogy on 40 samples and microprobe analysis of 617 carbonate mineral grains
• bulk geochemical analysis using four-acid digest and Inductively-Coupled Plasma (ICP) mass spectrometry analysis to determine total metal and metalloid chemistry
• Acid-Base Accounting (ABA) including paste pH, total sulfur analysis using a LECO sulfur analyzer and neutralization potential (NP) testing by titration using the standard Sobek method (Sobek et al., 1978) of 2,312 samples
• sequential Meteoric Water Mobility Procedure (MWMP) with geochemical analysis of the leachate for specific constituents on 20 composite samples
• kinetic testing using standard humidity cell test (HCT) procedures designed to simulate water-rock interactions and predict the rate of reaction for acid generation and metals mobility.
The ARD and metal leaching potential of the proposed Donlin Gold project waste rock has been characterized in several phases.
In 2005, an initial suite of over 700 widely spaced core samples was collected by Placer Dome from 162 drill holes and analyzed for ABA to evaluate the potential for ARD. Sixteen samples from this suite were selected for kinetic testing using humidity cells to evaluate both ARD and metal leaching (ML) potential. The 16 humidity cell samples were selected to represent the main rock types (host sediments and intrusives), and the range of sulfur and arsenic content in the two main mineralized areas (ACMA and Lewis). The geochemical assessment from this database is described by the Mine Drainage Assessment Group (MDAG) in a report dated February 12, 2006. Subsequent review of the report by SRK (2007) confirmed that a thorough assessment of the ARD and metal leaching potential had been completed for the project.
However, further assessment was recommended to address the following factors considered critical to the project:

Waste Rock Management Plan Donlin Gold Project Waste Rock Characterization
Donlin Gold 3-2 July 2012
• adjustment of ABA parameters (primarily NP) to reflect the minerals expected to contribute to generation and neutralization of acid
• actual criterion or criteria that define potential for ARD and ML
• overall distribution of Potentially Acid Generating (PAG) and Non-Acid Generating (NAG) rock
• feasibility of waste segregation during full-scale mining
• chemistry of runoff in contact with waste rock.
As part of this assessment, an additional set of 360 samples from 12 holes was selected to fill gaps identified in the MDAG characterization. The samples were obtained from continuous intervals to evaluate “mining block-scale” geochemical variations, and were analyzed for similar parameters as the MDAG suite. Data obtained in 2006, under the direction of SRK, were combined with the MDAG database for a comprehensive evaluation.
At the same time, four large composite samples were prepared from drill core to fill large barrels holding approximately 660 lb. (300 kg) each for onsite testing designed to evaluate leaching under site conditions. The sample composites representing the two main lithologic units (sediments and intrusive rocks) have distinctive sulfur and arsenic populations observed in the geochemical dataset (SRK 2007). In 2008, two 1,200 lb. (544 kg) crushed core composite samples, representing two waste rock categories, were prepared. One barrel each was filled with 200 lb. (91 kg), 400 lb. (181 kg), and 600 lb. (272 kg) of each composite resulting in six additional barrels (three for each composite). Assuming the test materials were relatively homogeneous and conditions within the barrels were uniform in terms of exchange with the atmosphere, this design is a surrogate for evaluating concentration changes at three equally spaced points along a flowpath. These new barrels were then monitored on the same schedule as the four existing barrels.
In addition, 20 composite samples containing a representative range of sulfur and arsenic concentrations were tested using a modification of the Nevada Division of Environmental Protection’s MWMP. Table 3-1 show rock types, sulfur, and arsenic content of the 20 composites. The sequential extraction procedure involves re-application of leachate from a single step of the MWMP to a new column loaded with fresh sample; this procedure involves six steps with a full analysis of leachate at each step. The method allows the assessment of the build-up of solutes along a flow path to be made and provides a better indication of the solubility of rock components than the conventional MWMP test that has a single extraction step. The procedure is best performed on weathered or oxidized materials where soluble products are present; therefore, older core was selected for MWMP testing. The results of the supplemental testing and analysis are described in the Waste Rock Metal Leaching and Acid Rock Drainage Assessment for Feasibility Study (SRK 2007) and were factored into predictions of water chemistry for full-scale waste rock facilities and pit walls.
The kinetic geochemical characterization results reported by MDAG (2006), including 16 humidity cells operated for 74 weeks, were used by SRK (2007) to predict waste rock drainage chemistry and determine the potential for segregating and blending NAG rock and PAG rock. In 2008, 24 new humidity cells were started. Twenty samples were selected to provide broader coverage of the range of geochemical characteristics (ARD potential and arsenic content) of waste rock matching the seven waste rock management categories (WRMCs). Two of the new cells were duplicates, and two were the same material used to fill two additional onsite test barrels also installed in 2008 (SRK 2011).

Waste Rock Management Plan Donlin Gold Project Waste Rock Characterization
Donlin Gold 3-3 July 2012
The geochemical prediction calculations were made using Geochemist’s Workbench and provided an estimate of the concentrations of constituents that would likely be released from the waste rock material. It was assumed that the waste rock material would be managed according to the geochemical properties of the material (i.e., NAG versus PAG) for well-mixed and poorly mixed scenarios.
Table 3-1: Characteristics of Samples Tested Using Sequential MWMP
Column Year Rock Type Arsenic (mg/kg) Sulfide (%)
1 1996-2002 GWK
47.3 0.09
2 1996 GWK
77.2 0.12
3 1996 SED 1495 0.18
4 1996-2002 SED 94.8 0.94
5 1996 SED 1020 0.76
6 1996-2002 GWK
2850 1.03
7 1996 ARG 75 0.2
8 1996 ARG 259 0.25
9 1996 SED
1545 0.1
10 1996 SED
145.5 1.1
11 2002 SHL
1785 1.61
12 2002 SHL
3100 1.47
13 1996 RD 79.5 0.27
14 1996-2002 RD 92.2 0.21
15 1996-2002 RD 1685 0.43
16 2002 RD 102 0.64
17 2002 RD 1610 1.19
18 1996 RD 2660 1.05
19 2002 MD 230 0.19
20 1996 MD 619 0.15
GWK = Greywacke, RD = Rhyodacite, SHL = Shale, MD = Mafic dykes
Also as part of the SRK geochemical evaluation (SRK 2007), carbonate mineralogy was characterized using x-ray diffraction from the 16 humidity cells samples from MDAG (2006). The objective of the carbonate mineral characterization was to estimate a correction factor for NP that accounts for NP due to carbonates. Since NP by the Sobek method (Sobek et al., 1978) is determined by reaction of the rock with boiling hydrochloric acid, the resulting NP reflects the dissolution of calcium and magnesium carbonates and silicates. While the former reflects minerals that would contribute NP to buffer pH near neutral under field conditions, the latter is not likely to consume acid until pH drops below 5 if the silicates are associated with aluminum. The resulting correction factor derived from mineralogical interpretation is recommended for the purpose of waste rock classification and management (SRK 2007).
Both the MDAG and SRK suites of ABA samples were drawn largely from rock defined as waste, but in the vicinity of mineralization. This resulted in a slight bias of the assessment toward a higher potential for ARD and metal leaching. During 2006, five additional holes
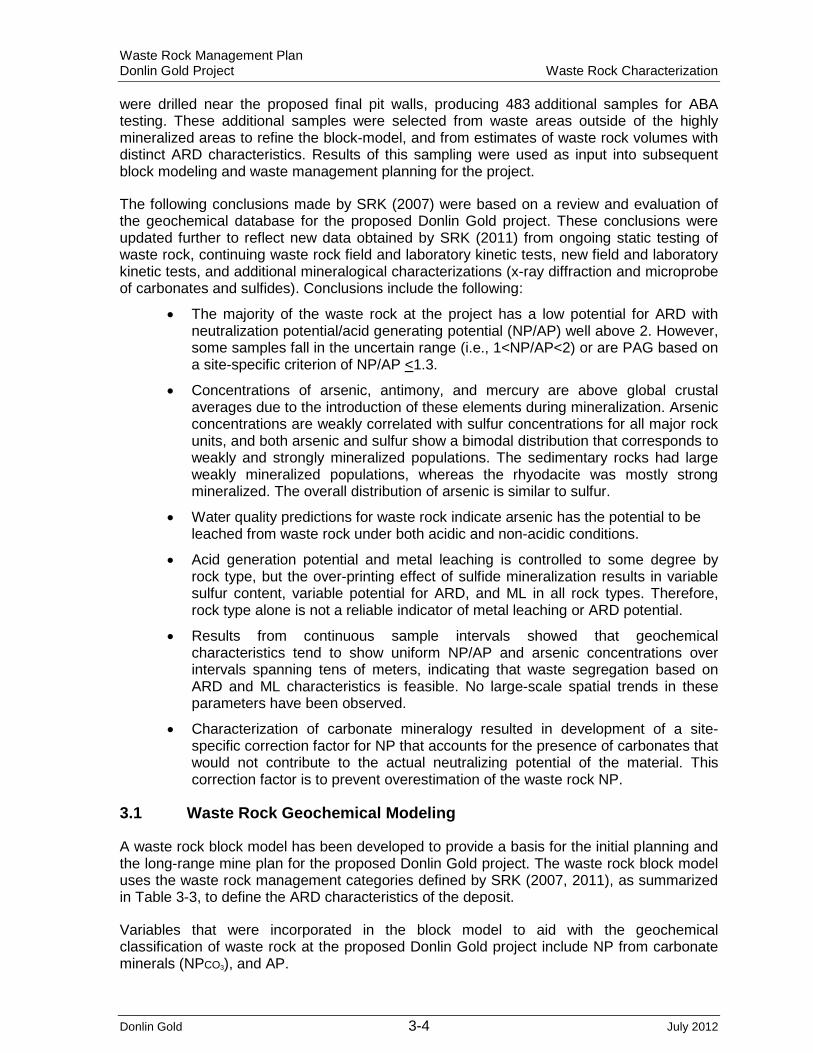
Waste Rock Management Plan Donlin Gold Project Waste Rock Characterization
Donlin Gold 3-4 July 2012
were drilled near the proposed final pit walls, producing 483 additional samples for ABA testing. These additional samples were selected from waste areas outside of the highly mineralized areas to refine the block-model, and from estimates of waste rock volumes with distinct ARD characteristics. Results of this sampling were used as input into subsequent block modeling and waste management planning for the project.
The following conclusions made by SRK (2007) were based on a review and evaluation of the geochemical database for the proposed Donlin Gold project. These conclusions were updated further to reflect new data obtained by SRK (2011) from ongoing static testing of waste rock, continuing waste rock field and laboratory kinetic tests, new field and laboratory kinetic tests, and additional mineralogical characterizations (x-ray diffraction and microprobe of carbonates and sulfides). Conclusions include the following:
• The majority of the waste rock at the project has a low potential for ARD with neutralization potential/acid generating potential (NP/AP) well above 2. However, some samples fall in the uncertain range (i.e., 1<NP/AP<2) or are PAG based on a site-specific criterion of NP/AP <1.3.
• Concentrations of arsenic, antimony, and mercury are above global crustal averages due to the introduction of these elements during mineralization. Arsenic concentrations are weakly correlated with sulfur concentrations for all major rock units, and both arsenic and sulfur show a bimodal distribution that corresponds to weakly and strongly mineralized populations. The sedimentary rocks had large weakly mineralized populations, whereas the rhyodacite was mostly strong mineralized. The overall distribution of arsenic is similar to sulfur.
• Water quality predictions for waste rock indicate arsenic has the potential to be leached from waste rock under both acidic and non-acidic conditions.
• Acid generation potential and metal leaching is controlled to some degree by rock type, but the over-printing effect of sulfide mineralization results in variable sulfur content, variable potential for ARD, and ML in all rock types. Therefore, rock type alone is not a reliable indicator of metal leaching or ARD potential.
• Results from continuous sample intervals showed that geochemical characteristics tend to show uniform NP/AP and arsenic concentrations over intervals spanning tens of meters, indicating that waste segregation based on ARD and ML characteristics is feasible. No large-scale spatial trends in these parameters have been observed.
• Characterization of carbonate mineralogy resulted in development of a site-specific correction factor for NP that accounts for the presence of carbonates that would not contribute to the actual neutralizing potential of the material. This correction factor is to prevent overestimation of the waste rock NP.
3.1 Waste Rock Geochemical Modeling
A waste rock block model has been developed to provide a basis for the initial planning and the long-range mine plan for the proposed Donlin Gold project. The waste rock block model uses the waste rock management categories defined by SRK (2007, 2011), as summarized in Table 3-3, to define the ARD characteristics of the deposit.
Variables that were incorporated in the block model to aid with the geochemical classification of waste rock at the proposed Donlin Gold project include NP from carbonate minerals (NPCO3), and AP.

Waste Rock Management Plan Donlin Gold Project Waste Rock Characterization
Donlin Gold 3-5 July 2012
AP is calculated from the total sulfur concentration (ST) where:
AP = 31.25 x estimated ST (%)
NP from carbonate minerals (NPCO3) was estimated from:
NPCO3 = 0.76·NP + 4.8
To avoid a bias at low NP values, the calculated NPCO3 should not exceed analytical NP when NP is below 50 lb. (22.7 kg) CaCO3/t. Therefore, the following rules were applied to the calculation of NP:
If NP≤22.7 kg CaCO3/t: NPCO3 = NP
If NP>22.7 kg CaCO3/t: NPCO3 = 0.85·NP + 3.4
Table 3-2 summarizes the site-specific calculation of ABA parameters developed for characterization and block modeling. These variables were estimated for each block to calculate NPCO3/AP. In addition, the block model estimates for arsenic and sulfur values were used to calculate the ratio of arsenic to sulfur (As/S) for each block. The ARD potential as defined by the ratios NPCO3/AP and As/S was then used to preliminarily classify blocks into the waste rock management categories that are subdivided into PAG and NAG groups. The two NAG categories are each split into two sub-categories to allow for identification of arsenic leaching.
Table 3-2 Site-specific Calculation of ABA Parameters
Source Acid Potential (AP)
kg CaCO3/t Neutralization Potential (NP)
kg CaCO3/t
SRK (2006) 31.25 x ST (%) If NP ≤16.3 NP = NP If NP >16.3 NP = 0.94.NP + 0.98
Updated (2011) 31.25 x ST (%) If NP ≤22.7 NP = NP If NP >22.7 NP = 0.85.NP + 3.4

Waste Rock Management Plan Donlin Gold Project Waste Rock Characterization
Donlin Gold 3-6 July 2012
3.2 Development of Waste Rock Classification System
With respect to waste management and classification of material, SRK (2011) concluded the following:
• Kinetic tests have shown that rates of sulfide mineral oxidation are strongly and positively correlated with sulfur content, and arsenic release is strongly associated with arsenic content of the rock. This suggests that bulk rock characteristics can be related to leaching behavior.
• Kinetic test results have demonstrated that NP/AP values below 1.3 define PAG rock, and that NP/AP values above 1.3 define NAG rock. Therefore, segregation of PAG waste rock can be based on a NP/AP value less than 1.3.1
• A relationship between NP/AP and the delay to onset of ARD has been developed using humidity cell results. For rock with elevated NP/AP near 1.3, the delay to onset is estimated to be of the order of a decade or more. For rock with NP/AP less than 1, ARD may be produced in less than a decade or several years.
• Arsenic leaching is a potentially significant concern for almost all waste rock, due to widespread elevated concentrations in the rock and leachability indicated by testwork.
• By combining the PAG criteria, delay to onset timeframes, and arsenic content, seven WRMCs have been defined (SRK 2007), updated to four categories (NAG 1, 2, 3, and 4 are the same for practical purposes), and are summarized in Table 3-3.
• Waste rock mixing or blending has merit, though mainly to combine rock with a very long delay to onset of ARD (i.e., 1<NP/AP<1.3) with NAG rock (NP>1.3).
• Water chemistry modeling indicates that blending would need to be managed to ensure that sufficient alkalinity is available to neutralize acid. The calculated tonnage of Category 5 rock that can be blended with Categories 1 -4 is 81%, provided that active management measures result in intimate contact between Categories 1-4 and 5. The remaining 19% of PAG 5 waste rock mined will be used for construction of the TSF causeway and as backfill into the ACMA pit.
1 The theoretical NP/AP that defines the potential for acid generation is between 1 and 2. The range depends
on the completeness of the acid neutralization reactions by carbonates. Regulators in various jurisdictions have proposed higher screening threshold values in the absence of site-specific information. These thresholds have, for example, ranged at times up to 3 in California and 4 in British Columbia. The higher values reflect uncertainty in the chemical measurements particularly of NP, which can include acid neutralizing components of the rock that are not sufficiently reactive under field conditions. The approach used to address this uncertainty at Donlin Gold has been to (a) calculate a site-specific NP based on mineralogical studies, which is lower than or equal to the laboratory-determined NP values; and (b) use kinetic weathering studies to determine the site-specific NP/AP threshold of 1.3 consistent with the site-specific NP approach.

Waste Rock Management Plan Donlin Gold Project Waste Rock Characterization
Donlin Gold 3-7 July 2012
Table 3-3: Donlin Gold Waste Rock Management Categories (SRK 2011)
SRK 2007
Revised 2011 Waste Rock Management
Category Category
Description NP*/AP Range
and AP
As/S (As in mg/kg and S in %)
NP*/AP Range
and AP
NAG 1 Very unlikely to generate ARD and "low" arsenic leaching
AP<3 kg CaCO3/t or NP*/AP > 2
As/S<196 and As<250
Not Used
NAG 2 Very unlikely to generate ARD and arsenic leaching potentially significant
AP<3 kg CaCO3/t or NP*/AP > 2
As/S>196 or As>250
AP<3 kg CaCO3/t or NP*/AP > 2
NAG 3 Unlikely to generate ARD and "low" arsenic leaching
1.4<NP* /AP≤2 As/S<196 and As<250
Not Used
NAG 4 Unlikely to generate ARD and arsenic leaching potentially significant
1.4 < NP*/AP ≤ 2 As/S>196 or As>250
1.3 < NP*/AP ≤ 2
PAG 5 PAG but with very long delays (several decades) to onset of ARD
1.0 < NP*/AP ≤ 1.4 All 1.0 < NP*/AP ≤ 1.3
PAG 6 PAG in the life of the mine (possibly less than a decade)
0.2 < NP*/AP ≤ 1.0 All 0.2 < NP*/AP ≤ 1.0
PAG 7 PAG but with shorter delays to onset (less than a few years)
NP*/AP ≤ 0.2 All
*Revised site-specific NPCO3 = 0.76·NP + 4.8 (SRK 2011)
In the characterization of waste rock geochemistry, the material is segregated according to a series of detailed chemical characteristics that are diagnostic of metal leaching and acid generation potential. The classification of the waste rock according to operational criteria for waste rock management requires a site-specific criterion or criteria that are sufficiently sensitive to the indicators of metal leaching and acid generation but simple enough for operational waste rock management. The geochemical characterization programs (SRK 2011) completed for the proposed Donlin Gold project have confirmed that NPCO3/AP can be used as the main diagnostic indicator of metal leaching and acid generation potential. Consequently, this parameter has been selected as the site-specific criterion to segregate PAG waste rock. Therefore, the four revised waste rock management categories defined by the Donlin Gold geochemical evaluation can be grouped into the following four material types for the purposes of waste rock management during operations (see Table 3-4):
1. Non-acid generating (NAG 1-4 and overburden [OVB]) 2. Potentially acid generating with a very long onset to ARD (PAG 5) 3. Potentially acid generating with a moderate onset to ARD (PAG 6) 4. Potentially acid generating with a short onset to ARD (PAG 7)

Waste Rock Management Plan Donlin Gold Project Waste Rock Characterization
Donlin Gold 3-8 July 2012
The classification of waste rock in relation to these characterizations is as follows:
1. Materials with a NPCO3/AP value greater than 1.3 are considered non-acid generating, and include NAG 1-4 waste rock and OVB. NAG 2 and NAG 4 waste rock have the potential to leach significant arsenic even though the acid generating potential is low (Table 3-3).
2. For material with a NPCO3/AP value less than 1.3, but greater than 1, the delay to onset is estimated to be on the order of a decade or more and is classified as PAG 5.
3. For material with a NPCO3/AP value less than 1, but greater than the lowest value (0.2), the delay to onset is estimated to be less than a decade and may occur within the life of mine. This material is classified as PAG 6.
4. Material with the lowest NPCO3/AP values (i.e., <0.2) is classified as PAG 7 and is considered the most reactive material with ARD predicted to take place within a few years.
Table 3-4: Donlin Gold Waste Rock Classification System
NPCO3/AP Waste Rock
Classification Description Delay to Onset of ARD
>1.3 NAG 1-4 and OVB Non-acid generating --
1.0 < NPCO3/AP ≤ 1.3 PAG 5 Potentially acid generating Several decades
0.2 < NPCO3/AP ≤ 1.0 PAG 6 Potentially acid generating Less than a decade
≤ 0.2 PAG 7 Potentially acid generating Less than a few years
NPCO3 = NP CO3 = 0.76·NP + 4.8, where NP is determined using the Sobek method (Sobek et al., 1978) AP =Total Sulfur (wt%) x 31.25
3.3 Mine Plan and Waste Rock Distribution
The current proposed Donlin Gold mine plan predicts there would be a total of about 3 billion tons (2.7 billion tonnes) of waste rock. The amount of each type of waste rock to be mined is summarized in Table 3-5 and illustrated in Figure 3-1. A summary of mine production schedule for the life of the mine is provided in Appendix A.
As shown in Figure 3-1, NAG 1-4 and OVB make up almost 92.6% of the total waste rock tonnage. PAG 5 waste rock is estimated to be less than 3% of the total waste rock tonnage that would be generated during the project. Furthermore, the rate at which PAG 5 would be extracted from the pit is fairly consistent throughout the life of mine and never exceeds 5% of the total waste rock mined during any one year. Therefore, the quantity of PAG 5 waste rock is considered to be within the range that could be accommodated by blending with NAG 1-4 rock to create an overall mixture that does not produce ARD. However, for the blended approach described in Section 4.3 below to be successful in mitigating ARD, waste rock must be managed to ensure that PAG 5 and NAG 1-4 waste rock is intimately mixed at a small enough scale. This has been confirmed by water quality predictions based on HCT results that indicate acidity is mitigated by reaction with acid-consuming minerals for well-mixed conditions (SRK 2007).

Waste Rock Management Plan Donlin Gold Project Waste Rock Characterization
Donlin Gold 3-9 July 2012
Table 3-5: Donlin Gold Waste Rock Tonnage Estimates
Waste Rock Classification
Tonnage
Percent of Total Mst Mt
NAG 1-4 and OVB 2,823.153 2,561.121 92.63 PAG 5 87.113 79.028 2.86 PAG 6 135.065 122.529 4.43 PAG 7 2.555 2.318 0.08 Total Waste Rock 3,047.886 2,764.996 100
Figure 3-1: Total Waste Rock Material Distribution
In order to gain a better understanding of the modeled distribution of the various waste rock types, a series of snapshots throughout the life of mine schedule was produced from the block model. End-of-period status maps (section view, along with a selected bench plan view) are provided in Appendix B. In the model views, the pit design for the current year is shown as a black line, NAG 1-4 waste rock in grey, PAG 5 waste rock in orange, and PAG 6 and PAG 7 waste rock in blue. The grid lines are 250 m in plan, with elevation lines every 24 m in the section view.
The series of status maps provided in Appendix B illustrate that the PAG 5 waste rock (in orange) is disseminated throughout the deposit with very few large contiguous zones indicated. For the most part, PAG 5 waste rock, as mined and placed in the WRF, would be naturally mixed with the surrounding NAG waste rock and would in effect, produce a desirable blend to negate the reactivity of the PAG 5 rock. For those periods where PAG 5 is the predominant waste rock material type mined, the material would be dispersed on the WRF to produce a well-mixed blend. This would require operational controls (as described in Section 4.2 below) in order to ensure the PAG 5 rock is not repeatedly placed on the same dump location. Where the PAG 5 rock in the pit is surrounded by more reactive PAG 6 or PAG 7 waste rock, and is too small a zone to be selectively mined, it would be incorporated in the management of the PAG 6 or PAG 7 waste rock.

Waste Rock Management Plan Donlin Gold Project Waste Rock Management
Donlin Gold 4-1 July 2012
4.0 WASTE ROCK MANAGEMENT
4.1 Waste Rock Classification
The proposed Donlin Gold project waste rock classification system would consist of four waste rock material types that are defined by the ratio of NPCO3 to AP according to Table 3-4.
Total sulfur would be measured in the onsite laboratory using a LECO analyzer. AP is then calculated from the total sulfur concentration where:
AP = 31.25 x total sulfur (wt%)
NP would be measured in the onsite laboratory according to the standard Sobek method (Sobek et al., 1978). The rock is digested with boiling hydrochloric acid, and then the base equivalent amount of acid consumed is determined by titrating the acid solution to a pH of 7 and converting the measured quantities to NP expressed as kg CaCO3/t. Once NP is calculated, a correction factor would be applied to account for the presence of carbonates that do not contribute to the actual neutralizing potential of the material as described in Section 3.1. NPCO3 would be estimated from the following equations:
NPCO3 = NP (for NP≤22.7 kg CaCO3/t)
NPCO3 = 0.85·NP + 3.4 (for NP>22.7 kg CaCO3/t)
The ratio NPCO3/AP would then be calculated and used to classify waste rock according to Table 3-4.
4.2 Waste Rock Mining and Segregation
The current mine schedule targets an average mining rate of approximately 422,000 stpd (383,000 tpd) of total material that would be mined by bulk open pit mining methods. Waste rock alone would be extracted from the open pit at an average mining rate of 345,000 stpd (313,000 tpd). This mining rate is subject to change based on operational considerations during the life of the project. Large hydraulic face shovels with a 50 yd3 (38 m3) capacity, along with 400 st (360 t) haul trucks, would be used for primary pit production. Mining would occur on 40 ft (12 m) benches in waste, and 20 ft (6 m) split benches in selected primary ore zones.
The key to the success of this Plan would be the identification of the various material types in the field and, in particular, at the active mining face. This approach would require a material identification system that is built into the ore control system. Sources of information include:
• daily survey control
• maintaining an up-to-date 3-D block model • blasthole sampling and logging to assist in this waste characterization
• possibly face sampling including mapping, visual inspections, and sampling.

Waste Rock Management Plan Donlin Gold Project Waste Rock Management
Donlin Gold 4-2 July 2012
Blasthole cuttings would be collected during blasting operations for analysis at the onsite laboratory. The number of blasthole samples collected would depend on the geologic conditions within the blast area and the blasthole pattern. However, it is anticipated that a sample density of 1 in 12 would be adequate to perform the required waste rock segregation. These samples would be submitted to the onsite laboratory for ABA testing and calculation of NPCO3/AP. Based on the results, the material would be classified as one of the four waste rock material types as described above. The sampling and testing would be completed on the same schedule as ore determination in order to be effectively included in the short-term mine planning process.
The resulting information would be used to assign material types to the areas of the active bench. Each area would be assigned a destination code based on classification of the material. An automated routing and tracking system would be used that integrates the ore control data with a global positioning system (GPS)-enabled loading and hauling fleet to route and track material. Each of the shovels working in ore and waste at the proposed Donlin Gold project would be equipped with GPS positioning to allow real-time updates of the digging face in relation to ore grades and waste rock types.
An electronic map would be developed by the short range planner to differentiate between the ore and waste types. This electronic map would be available to the shovel operator in real time via an on-board computer screen so the type of material loaded into the truck would be known at all times. Furthermore, all the trucks would be equipped with a GPS dispatch system (AMEC 2009). When equipment is loading from a particular area, a code would be assigned to the truck being loaded and the designation would appear on the operator’s screen. The system would record the volume of each waste rock type mined during each shift and its ultimate destination. This mining methodology would ensure that ore and waste rock types are mined and delivered to the correct location.
4.3 Waste Rock Designation and Placement
The waste rock for this project would be routed to one of four destinations including (Figure 4-1):
1. American Creek drainage WRF (east of the pit) 2. isolated cells on WRF 3. ACMA pit backfill 4. TSF construction.
The estimated tonnage of each waste rock type is summarized in Table 4-1 has the methods of waste rock placement described in the following sections for each facility.

WASTE ROCK FACILITY (WRF)2,460 Mst, 2,232 Mt
NORTH OVERBURDENSTOCKPILE
SOUTH OVERBURDENSTOCKPILE
ULTIMATE PIT
Cro
oked
Creek
Crooked
Cre
ek
Omega Gulch
WASTE ROCK FACILITY ANDOVERBURDEN STOCKPILES
FIGURE:
DG: PER0033.mxd, 07/17/12, R07
DONLIN GOLD PROJECT
4-1Natural Gas Pipeline
Streams
Ultimate Pit
Waste Rock Facility
Ore Stockpile
Material Site
Solid Waste
Berm
Building
Facility
Laydown Area
Overburden Stockpile
Pond
Ramp
Potentially Acid Generating Rock (PAG) #6
0.5 mi

Waste Rock Management Plan Donlin Gold Project Waste Rock Management
Donlin Gold 4-4 July 2012
Table 4-1: Waste Rock Tonnage by Facility
Material Type
ACMA Backfill Waste Rock Facility Isolated Cells Tailings Dam
Ktons Ktonnes Ktons Ktonnes Ktons Ktonnes Ktons Ktonnes
NAG 1-4 429,091 389,265 2,252,501 2,043,434 -- -- 95,129 86,300
OVB 8 45 41 46,387 42,082 -- -- -- --
PAG 5 11,833 10,735 70,587 64,035 -- -- 4,694 4,258
PAG 6 11,744 10,654 -- -- 123,320 111,874 -- --
PAG 7 47 43 2,508a 2,275 -- -- -- --
Total 452,761 410,738 2,371,983 2,151,826 123,320 111,874 99,823 90,558
a This tonnage reflects the total PAG 7 waste rock that would be temporarily placed in the low-grade stockpile at the toe of the WRF and relocated to the ACMA pit backfill once space is available.
4.3.1 American Creek Valley WRF
The waste rock types that would be placed on the WRF would consist of NAG 1-4 waste rock and PAG 5 and isolated cells of PAG 6, as described in Section 4.3.2. Waste rock classified as NAG 1-4 has no potential to generate acid and would be placed in WRF without any constraints on placement. This material would be blended with the PAG 5 material. The final cover of each lift of the WRF would consist of NAG 1-4.
Waste rock classified as PAG 5 has the potential to become acid generating over a long period of time (several decades). In order to mitigate this potential, PAG 5 waste rock would be blended with the NAG 1-4 waste rock in the WRF. However, PAG 5 rock would need to be intimately blended with the NAG rock in order for its reactivity to be negated. As such, the vertical dimension (or deposited thickness) of PAG 5 rock can be no more than approximately 3 ft (1 m) when placed in the WRF (SRK 2007). This requires operational controls to ensure the PAG 5 material is not repeatedly placed at the same dump location, but is staggered or spread across the operational dump face.
The advancing dump crest of any lift would be several hundred feet across to facilitate safe haul truck turnaround. The dump crest would be maintained by a dozer in a typical “dump-and-doze” waste rock handling operation. The dozer operator would be instructed to shift position with each incoming load of waste to allow spreading of successive loads across the entire dump face. The effective blending of PAG 5 material with NAG 1-4 material is possible due to the disseminated occurrence of PAG 5 in the deposit, the small overall percentage of PAG 5, and the staggered placement approach.
To further mitigate the potential for PAG 5 to generate acid, the last 80 ft (24 m) of the dump crest advancement of any lift would be limited to only NAG 1-4 waste rock. This would ensure the final regraded slopes of the WRF would consist of NAG 1-4 waste rock with an average thickness of about 30 ft (9 m). Mine engineers would develop a PAG/NAG boundary beyond which only NAG waste rock can be placed. This would ensure no PAG 5 material is placed beyond the PAG/NAG boundary and the regraded final slopes of the WRF would consist entirely of NAG material.
This type of waste rock placement methodology has been successfully applied at other mines that operate at a similar scale with similar equipment. Extra management is required

Waste Rock Management Plan Donlin Gold Project Waste Rock Management
Donlin Gold 4-5 July 2012
at the end of the mine life to ensure no PAG 5 material is dumped on a final face, and there is sufficient NAG material in the mine plan or in prepared stockpiles to cap the top surfaces of the WRF.
Waste rock classified as PAG 7 is highly mineralized material (below the economic cut-off grade) that has the potential to become acid-generating in the shortest timeframe. As a result, PAG 7 would be segregated from the other waste rock material types and placed on the low-grade stockpile area for temporary storage. Once the final limits of the ACMA pit are reached, PAG 7 stored in the low-grade stockpile would be relocated to the bottom of the ACMA pit.
The low-grade stockpile area is located at the toe of the WRF near center of American Creek Valley. During operations, surface water from this area, including stormwater from the PAG 7 waste rock, would report to the Lower Contact Water Dam (CWD) and any seepage that enters groundwater would be intercepted below the Lower CWD for mill make-up water or pumped to the Upper CWD for future mill use.
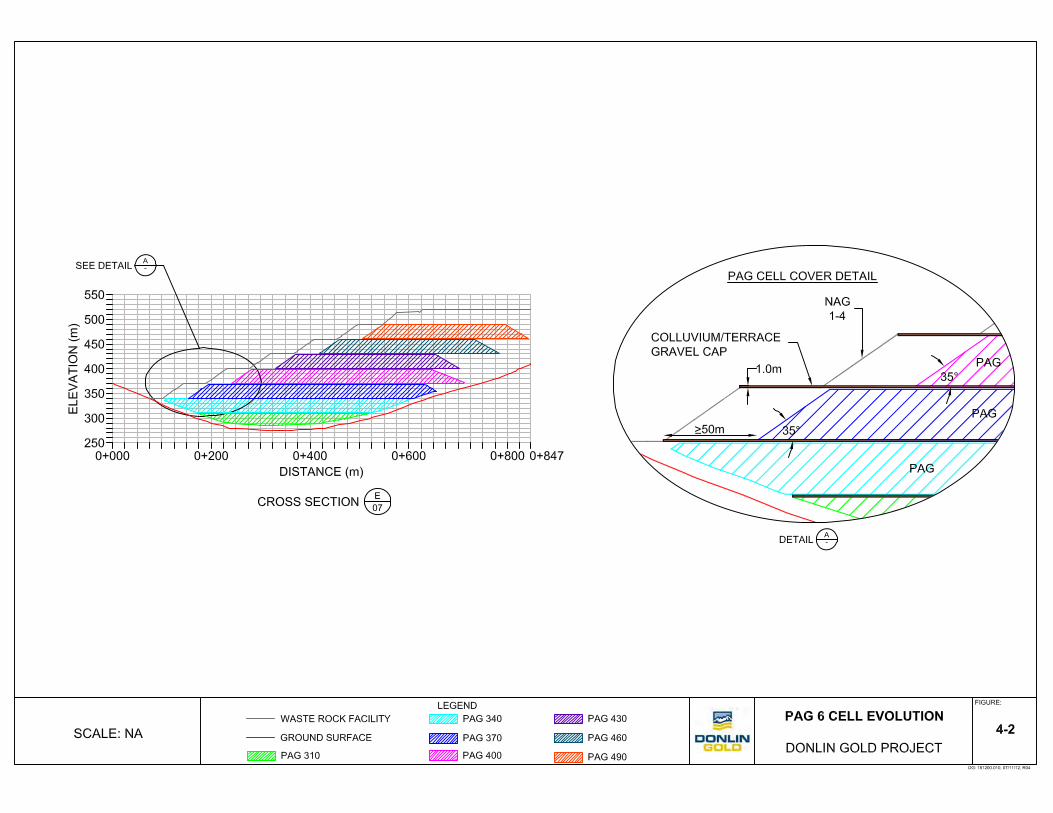
4.3.2 Isolated Cells on WRF
Waste rock classified as PAG 6 has the potential to become acid-generating in a short period of time. To mitigate this potential, PAG 6 would be segregated from the other waste rock types.
Isolating the PAG 6 in this area will result in reduced amounts of water coming into contact with these materials, and will minimize their potential to become acidic. The foundation of NAG rock would be placed beneath the PAG 6 materials in Rob’s Gulch would limit the potential for water running along the drainage to rise and fluctuate within the PAG 6 waste cell. The NAG material will also act as a rock drain to convey the runoff and perennial flows out of this drainage.
The materials in each PAG 6 cells will be placed in 33 ft (10 m) intermediate lifts, until a lift height of 100 ft (30 m) is reached. Each 100 ft (30 m) cell will then be covered with a low permeability “cap” to minimize infiltration of surface water (Figure 4-2). For the permanent isolated cells, an engineered intermediate cap, consisting of 3.3 ft (1 m) thick mixture of terrace gravel or colluvium (in-situ hydraulic conductivity of approximately 1.3 x 10⁻⁶ (4 x 10⁻⁷ m/s), would be placed on top of the PAG 6 material in the waste rock facility as each lift is completed. This would limit the amount of runoff and precipitation entering the PAG cells. NAG 1-4 waste rock would be dumped around the PAG waste rock to isolate the material from the final surface of the WRF and from the surrounding natural ground.
During the early years of operation, PAG 6 would be placed in these permanent, isolated cells in the Rob’s Gulch and Unnamed Gulch sections of the WRF. Once the ACMA pit becomes available for backfilling in Year 22, any new PAG 6 waste rock that is mined would go directly into the ACMA pit as backfill.
Waste Rock Management Plan Donlin Gold Project Waste Rock Management
Donlin Gold 4-7 July 2012
4.3.3 ACMA Pit Backfill
Once the final limits of the pit are reached in Year 22 of the mine life, waste rock would be placed as backfill in the ACMA Pit. At this point, all PAG 6 or PAG 7 mined in the Lewis Pit would be placed in the ACMA pit backfill and no additional waste rock would be placed in the low-grade stockpile or isolated cells. Material classified as PAG 5 and NAG 1-4 would also be placed in the ACMA pit backfill as the material is mined from the Lewis Pit, with the majority of the waste rock consisting of NAG 1-4. The deepest portion of the ACMA pit would be backfilled to approximately 695.5 ft below mean sea level (msl) (212 m below msl) elevation, at which, a pit lake can be maintained at an approximate maximum depth of 1,023.5 ft (312 m). Other portions of the Lewis and ACMA pits would be backfilled to approximately 111.5 ft amsl (34 m amsl) to maintain a depth of approximately 216 ft (66 m). This maximum recommended backfill for the ACMA pit is based on the pit lake study completed by Lorax Environmental (2011) and is necessary to keep the pit lake stratified and PAG backfill anoxic.
4.3.4 Tailings Storage Facility
The TSF would be a fully lined impoundment located in the Anaconda Creek Valley, 2.2 miles (3.5 km) south of the open pit. Waste rock from the pit would be used in the construction of the TSF as rockfill, filter zones, riprap, and underdrain rockfill. NAG 1-4 waste rock would be used for all portions of the TSF that are not within the lined containment. Some PAG 5 waste rock would also be placed in the TSF, but would only be placed in the portions of the TSF within lined containment (e.g., reclaim causeway).

Waste Rock Management Plan Donlin Gold Project Waste Rock Facility Design
Donlin Gold 5-1 July 2012
5.0 WASTE ROCK FACILITY DESIGN
5.1 Waste Rock Facility Construction
The WRF has been designed to maximize reclamation efficiency, utilize the neutralizing capacity of NAG materials, add flexibility to the site water balance, and minimize the cost of closure. The design parameters for the American Creek Valley WRF are summarized in Table 5-1. Slope stability and rock drain designs were completed by AMEC (2009).
Table 5-1: Waste Rock Facility Design Parameters
Waste Rock Facility
Crest Elevation Authorized Tonnage Footprint
ft amsl*
m amsl
Mst Mt
acres ha
American Creek Valley WRF 1,705 520
2,460 2,232
3,020 1,222
*above mean sea level
The American Creek Valley WRF would have a maximum height of 1,150 ft (351 m). It would be constructed by end-dumping material in lifts up to 100 ft (30 m) in height. The toe of each dump lift would be set back 155 ft (47 m) from the crest of the previous lift to achieve the 3.0H:1.0V dump slope angle. This method of construction would result in the most cost-effective configuration for regrading and reclamation of the WRF.
As described above, waste rock types that would be placed on the American Creek Valley WRF would consist of NAG 1-4 and PAG 5 waste rock and isolated cells of PAG 6. Waste rock classified as NAG 1-4 would be blended with the PAG 5 material in the WRF and the last 80 ft (24 m) of the dump crest advancement of any lift would be limited to only NAG 1-4 waste rock. Waste rock classified as PAG 6 would be segregated from the other waste rock types and would be placed in permanent, isolated cells in the Rob’s Gulch and Unnamed Gulch sections. An intermediate cover, consisting of an engineered, compacted cover consisting of a 3.3 ft (1 m) thick mixture of terrace gravels or colluvium would be placed on the isolated cells in the WRFs as each lift is completed. NAG 1-4 waste rock would be dumped around the PAG waste rock to isolate the material from the final surface of the WRF and from the surrounding natural ground.
The WRF would be constructed entirely from the bottom up. During the initial construction of the WRF, the organic materials, loess, and ice-rich overburden would be removed from the footprint of the first and third lift (AMEC 2009). The stripped materials would be replaced with coarse waste rock. This would result in a high degree of stability at the WRF toe and a very low likelihood of instability in the early stages of construction and through the life of the WRF. The materials removed from the foundation would either be placed in temporary overburden stockpiles or mixed with waste rock in the WRF.
The foundation of the WRF would require drainage control. The potential magnitude of flow in the American Creek drainage, as well as discharging springs in the valley bottoms, warrants construction of engineered rock drains in the valley bottom, with connecting secondary rock (finger) drains constructed in the smaller contributing drainages. These upstream water collection and diversion measures would be constructed during the preproduction period, and the first segments of the rock drain would be placed using

Waste Rock Management Plan Donlin Gold Project Waste Rock Facility Design
Donlin Gold 5-2 July 2012
NAG 1-4 rock. Utilizing larger block sizes of the broken rock from blasting in the open pit, the rock drain beneath the WRF would be sized to contain the peak instantaneous flow associated with the 100-year, 24-hour duration rainfall event for the American Creek catchment. A Lower CWD would be constructed in the American Creek valley downstream of the WRF to collect runoff and seepage water from the WRF. The surface and groundwater flow path along American Creek between the Lower CWD and ACMA pit would be toward the ore stockpile and pit dewatering wells. Surface and groundwater from this area would be pumped back to the Lower CWD and would be managed as mine contact water.
5.2 Waste Rock Facility Reclamation
The WRF would be progressively reclaimed during operations by placing a cover designed to minimize infiltration over the WRF 2,347 acres (950 ha). The cover would consist of a minimum 14 inches (0.35 m) of growth medium (peat mineral mix) over a minimum 12 inches (0.3 m) of terrace gravel and/or colluvium. The growth medium cover would be vegetated, and the underlying waste rock would be contoured prior to placement of the cover to provide natural drainage toward the south margin of the WRF. Contouring would also produce a natural drainage pattern of swales. The base of the swales would be allowed to develop naturally and self-armor after cover placement. Ongoing maintenance of these swales (e.g., riprap or cobble and boulder placement) would ensure the cover integrity is not compromised. Progressive reclamation during operations is expected to result in reclamation of the majority of the WRF prior to the end of mining; however, at a minimum, reclamation of haul roads and ramps would be necessary during the closure period. A more detailed description of the site-wide reclamation procedures is contained in the Reclamation and Closure Plan, Donlin Gold Project (SRK 2012a).
Post-closure, all surface and groundwater would be collected and directed (piped) into the lower levels of the pit lake. A majority of the reclaimed WRF would convey surface runoff to a major runoff collection channel that would be constructed along the south margin of the facility. The purpose of the channel is to collect runoff from the WRF cover system and convey it to the ACMA pit lake at closure. The collection channel would be lined to mitigate the potential for channeling of the cover and minimize potential seepage losses during low-flow periods. The channel would be lined with 40 mil linear low-density polyethylene (LLDPE) and would have a base width of 13 ft (4 m), 2H:1V sideslopes, and a depth of 6.6 ft (2 m). The base of the channel would be lined with a lift of sand/pea gravel (1 ft [0.3 m]) and natural cobbles and boulders or riprap (-24 in [600 mm]). A 1 ft (0.3 m) bedding layer would be placed on top of the waste rock before the LLDPE liner is deployed. The lining would extend one-third of the way up the side to allow sideslope and tributary runoff to enter the channel rather than being forced below the lined channel. The channel would have an approximate total length of 2.2 miles (3.5 km).
Modeling of the pit lake geochemistry indicates that water quality is significantly improved when the surface runoff from the WRF and upslope areas is separated from the seepage runoff that infiltrates the cover because this seepage runoff includes the subsurface runoff component (slow runoff) from undisturbed areas upslope. This seepage would come into contact with the waste rock, with subsequent additional metal loading to the pit lake. The seepage flows would, therefore, be isolated by constructing four small, concrete containment structures at the outlet of the rock drains for American Creek and Rob’s Gulch. A gravity-fed pipe would then direct these seepage flows to the bottom of ACMA pit, with surface runoff draining naturally to the surface of the pit lake. This segregation of flow would

Waste Rock Management Plan Donlin Gold Project Waste Rock Facility Design
Donlin Gold 5-3 July 2012
encourage pit lake stratification. The combined flow pipeline would require a maximum capacity of 12 cfs (0.34 m3/s), which equates to a 24-inch (61 cm) diameter pipe. An approximate pipe length of 2.92 miles (4.7 km) would be required to convey the combined seepage flows to the edge of the pit lake. Here, the seepage water would feed into the pipeline used to convey TSF water to the base of the pit.

Waste Rock Management Plan Donlin Gold Project Monitoring and Reporting
Donlin Gold 6-1 July 2012
6.0 MONITORING AND REPORTING
6.1 Operational Monitoring and Reporting
The quantities and destinations of waste rock and ore would be recorded during operations, and these data would be tabulated monthly. Laboratory analyses for total sulfur and NPCO3 and ABA calculations would be maintained on site. This geochemical data would be processed on a monthly basis to calculate the average NPCO3/AP for placed waste rock, and to record final destinations. In order to verify designated waste rock is managed as proposed, surveys of the advancing WRF lifts would be conducted to make sure the 80 ft (24.4 m) set-back of PAG material is maintained. In addition, the final slopes would be inspected for evidence of ARD to determine if PAG material was placed on the final WRF surfaces. Additional NAG 1-4 material would be placed on the surface to thoroughly cover any exposed PAG material.
Visual inspections of the WRF and associated storm water controls would be conducted to evaluate the performance and condition of the facility. Excluding the isolated cells, the toes of the WRF would be checked for seepage, and if seepage is observed, the specific location and flow rate would be recorded, and a sample would be collected for water quality analysis. These inspections would be conducted on a monthly basis and as soon as practicable after significant precipitation events.
Site staff would carry out weekly visual inspections on each area of the WRF that is undergoing active development or concurrent reclamation. The general condition of the WRF would be recorded. Items to be observed would consist of physical stability, presence, or absence of erosion, confirmation that lifts and slopes are within design limits, and status of any reclamation (e.g., revegetation success). Inspection of non-active areas of the facilities would be carried out on a monthly basis. Upon completion of a portion of the facility, inspections would be carried out annually until closure. The results of the inspections would be incorporated into the inspection recording and document storage system developed for the site.
Groundwater and surface water monitoring would be conducted in accordance with the Monitoring Plan, Donlin Gold Project (SRK 2012b).
6.2 Closure and Post-Closure Monitoring and Reporting
Post-closure monitoring would consist of visual inspection of the WRF, including but not limited to covered areas, areas of potential stormwater concentration, storage facility base areas where seepage would have the highest potential to occur, and storm water control facilities. Inspections would be carried out for a period of not less than five years. The frequency of inspections would be at least once annually in the spring and following any storm events exceeding the 25-year, 24-hour storm event. The purpose of the inspections would be to observe and document the following:
• the physical integrity of the soil cover including areas of erosion
• the extent of vegetation establishment and density
• evidence of any staining, discoloration, streaking or moisture conditions indicating significant geochemical reactivity of disposal facility surfaces
• the condition of stormwater control structures
Waste Rock Management Plan Donlin Gold Project Monitoring and Reporting
Donlin Gold 6-2 July 2012
• the location and extent of any ponded stormwater.
Conditions observed that require repair, maintenance, or further evaluation would be documented and scheduled for requisite action as soon as possible. Inspections, repairs, and evaluations would be documented and submitted to the Alaska Department of Environmental Conservation on an annual basis.

Waste Rock Management Plan Donlin Gold Project References
Donlin Gold 7-1 July 2012
7.0 REFERENCES
AMEC Americas Limited, 2009. Donlin Creek Gold Project, Alaska, Feasibility Study Update. October.
Barrick Gold Corporation, 2007. Water Quality Monitoring and Data Management Procedures Manual. Barrick internal manual, November.
BGC Engineering. Inc., 2011. Donlin Creek Gold Project, Feasibility Study Update 2, Waste Rock Facility Design-Final Report, July.
BGC Engineering Inc., 2009. Donlin Creek Gold Project Feasibility Study Update 2 Water Management Plan – Final Report, July.
Decker, J., Bergman, S.C., Blodgett, R.B., Box, S.E., Bundtzen, T.K., Clough, J.G., Coonrad, W.L., Gilbert, W.G., Miller, M.L., Murphy, J.M., Robinson, M.S., and Wallace, W.K., 1994. Chapter 9: Geology of southwestern Alaska, in Plafker, G., and Berg, H.C., eds., The geology of Alaska: The Geology of North America, Geological Society of America, Boulder, Colorado, v. G1, p. 285-310.
Goldfarb, R.J., Ayuso, R., Miller, M.L., Ebert, S.W., Marsh, E.E., Petsel, S.A., Miller, L.D., Bradley, D., Johnson, C. and McClelland, W., 2004. The late Cretaceous Donlin Creek Gold Deposit, Southwestern Alaska: Controls on Epizonal Ore Formation. Economic Geology, 99:643-671.
Lorax Environmental, 2011. Donlin Creek Gold Project Feasibility Study Update II Pit Lake Modeling Assessment, June.
Mine Drainage Assessment Group (MDAG), 2006. DRAFT Donlin Creek Project – Environmental Geochemistry Report for Prefeasibility. Prepared for Placer Dome America.
Sobek A.A., Schuller W.A., Freeman J.R., and Smith R.M., 1978. Field and Laboratory Methods Applicable to Overburden and Minesoils, USEPA Report No. 600/2-78-054, 203 pp.
SRK Consulting (U.S.), Inc., 2012a. Reclamation and Closure Plan, Donlin Gold Project, Alaska.
SRK Consulting (U.S.), Inc., 2012b. Monitoring Plan, Donlin Gold Project, Alaska.
SRK Consulting (U.S.), Inc., 2012c. Project Description, Donlin Gold Project, Alaska.
SRK Consulting (U.S.), Inc., 2011. Metal Leaching and Acid Rock Drainage Assessment for Feasibility Study, Donlin Gold Project, Alaska, Update Report, February.
SRK Consulting (U.S.), Inc., 2007. Waste Rock Metal Leaching and Acid Rock Drainage Assessment for Feasibility Study, Donlin Creek Project, Alaska. September.
SRK Consulting (U.S.), Inc., 2006. Memorandum: Donlin Creek Guidance for Block Modeling of ARD and Metal Leaching Potential – UPDATE DRAFT, September.

Appendix A Summary of Mine Production Schedule
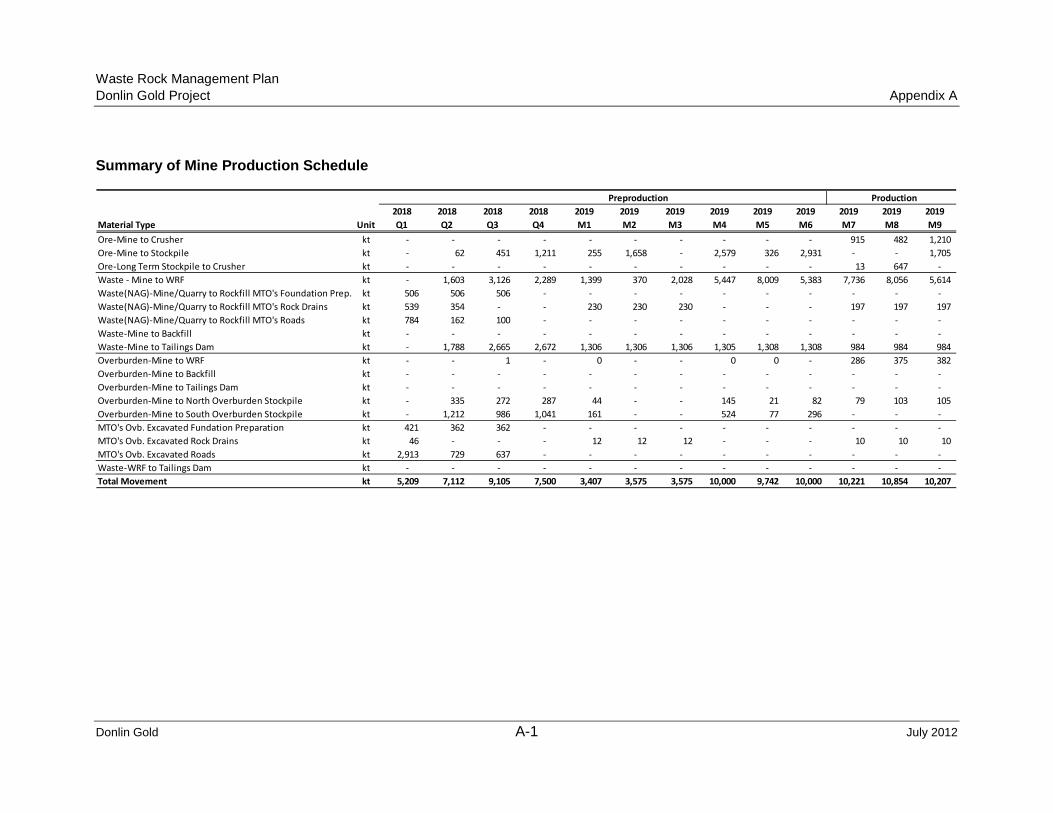
Waste Rock Management Plan Donlin Gold Project Appendix A
Donlin Gold A-1 July 2012
Summary of Mine Production Schedule
Preproduction Production2018 2018 2018 2018 2019 2019 2019 2019 2019 2019 2019 2019 2019
Material Type Unit Q1 Q2 Q3 Q4 M1 M2 M3 M4 M5 M6 M7 M8 M9Ore-Mine to Crusher kt - - - - - - - - - - 915 482 1,210 Ore-Mine to Stockpile kt - 62 451 1,211 255 1,658 - 2,579 326 2,931 - - 1,705 Ore-Long Term Stockpile to Crusher kt - - - - - - - - - - 13 647 - Waste - Mine to WRF kt - 1,603 3,126 2,289 1,399 370 2,028 5,447 8,009 5,383 7,736 8,056 5,614 Waste(NAG)-Mine/Quarry to Rockfill MTO's Foundation Prep. kt 506 506 506 - - - - - - - - - - Waste(NAG)-Mine/Quarry to Rockfill MTO's Rock Drains kt 539 354 - - 230 230 230 - - - 197 197 197 Waste(NAG)-Mine/Quarry to Rockfill MTO's Roads kt 784 162 100 - - - - - - - - - - Waste-Mine to Backfill kt - - - - - - - - - - - - - Waste-Mine to Tailings Dam kt - 1,788 2,665 2,672 1,306 1,306 1,306 1,305 1,308 1,308 984 984 984 Overburden-Mine to WRF kt - - 1 - 0 - - 0 0 - 286 375 382 Overburden-Mine to Backfill kt - - - - - - - - - - - - - Overburden-Mine to Tailings Dam kt - - - - - - - - - - - - - Overburden-Mine to North Overburden Stockpile kt - 335 272 287 44 - - 145 21 82 79 103 105 Overburden-Mine to South Overburden Stockpile kt - 1,212 986 1,041 161 - - 524 77 296 - - - MTO's Ovb. Excavated Fundation Preparation kt 421 362 362 - - - - - - - - - - MTO's Ovb. Excavated Rock Drains kt 46 - - - 12 12 12 - - - 10 10 10 MTO's Ovb. Excavated Roads kt 2,913 729 637 - - - - - - - - - - Waste-WRF to Tailings Dam kt - - - - - - - - - - - - - Total Movement kt 5,209 7,112 9,105 7,500 3,407 3,575 3,575 10,000 9,742 10,000 10,221 10,854 10,207
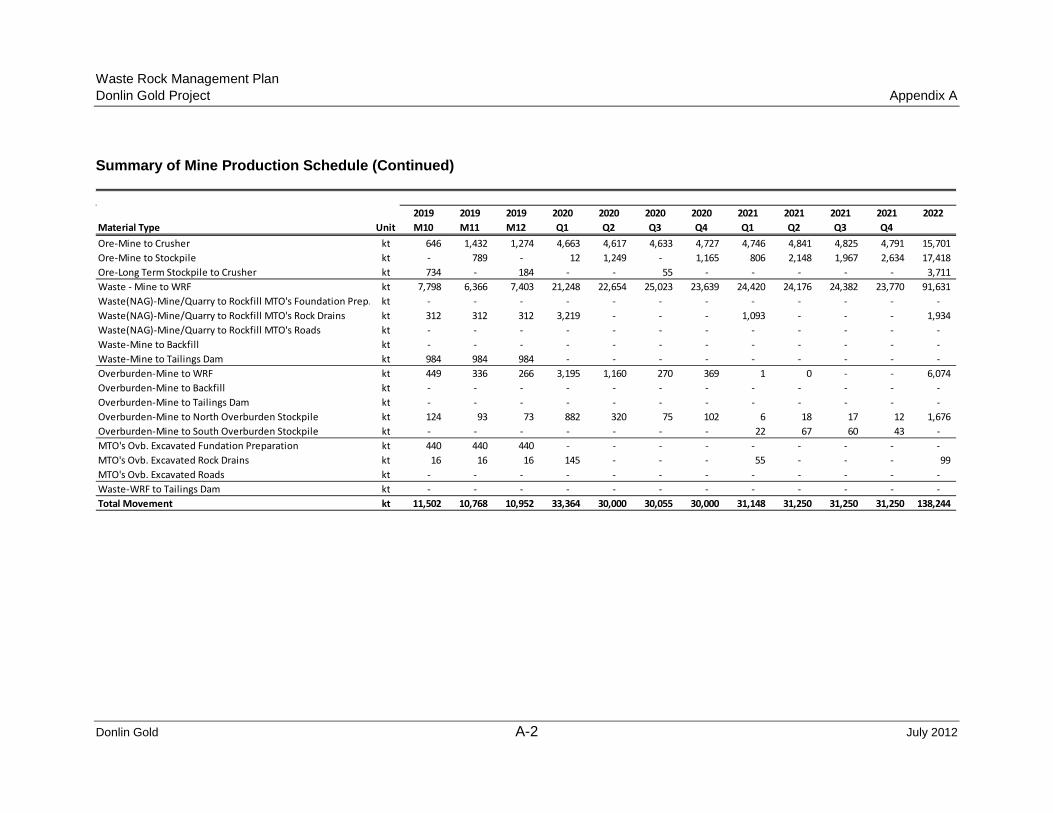
Waste Rock Management Plan Donlin Gold Project Appendix A
Donlin Gold A-2 July 2012
Summary of Mine Production Schedule (Continued)
2019 2019 2019 2020 2020 2020 2020 2021 2021 2021 2021 2022Material Type Unit M10 M11 M12 Q1 Q2 Q3 Q4 Q1 Q2 Q3 Q4Ore-Mine to Crusher kt 646 1,432 1,274 4,663 4,617 4,633 4,727 4,746 4,841 4,825 4,791 15,701 Ore-Mine to Stockpile kt - 789 - 12 1,249 - 1,165 806 2,148 1,967 2,634 17,418 Ore-Long Term Stockpile to Crusher kt 734 - 184 - - 55 - - - - - 3,711 Waste - Mine to WRF kt 7,798 6,366 7,403 21,248 22,654 25,023 23,639 24,420 24,176 24,382 23,770 91,631 Waste(NAG)-Mine/Quarry to Rockfill MTO's Foundation Prep. kt - - - - - - - - - - - - Waste(NAG)-Mine/Quarry to Rockfill MTO's Rock Drains kt 312 312 312 3,219 - - - 1,093 - - - 1,934 Waste(NAG)-Mine/Quarry to Rockfill MTO's Roads kt - - - - - - - - - - - - Waste-Mine to Backfill kt - - - - - - - - - - - - Waste-Mine to Tailings Dam kt 984 984 984 - - - - - - - - - Overburden-Mine to WRF kt 449 336 266 3,195 1,160 270 369 1 0 - - 6,074 Overburden-Mine to Backfill kt - - - - - - - - - - - - Overburden-Mine to Tailings Dam kt - - - - - - - - - - - - Overburden-Mine to North Overburden Stockpile kt 124 93 73 882 320 75 102 6 18 17 12 1,676 Overburden-Mine to South Overburden Stockpile kt - - - - - - - 22 67 60 43 - MTO's Ovb. Excavated Fundation Preparation kt 440 440 440 - - - - - - - - - MTO's Ovb. Excavated Rock Drains kt 16 16 16 145 - - - 55 - - - 99 MTO's Ovb. Excavated Roads kt - - - - - - - - - - - - Waste-WRF to Tailings Dam kt - - - - - - - - - - - - Total Movement kt 11,502 10,768 10,952 33,364 30,000 30,055 30,000 31,148 31,250 31,250 31,250 138,244
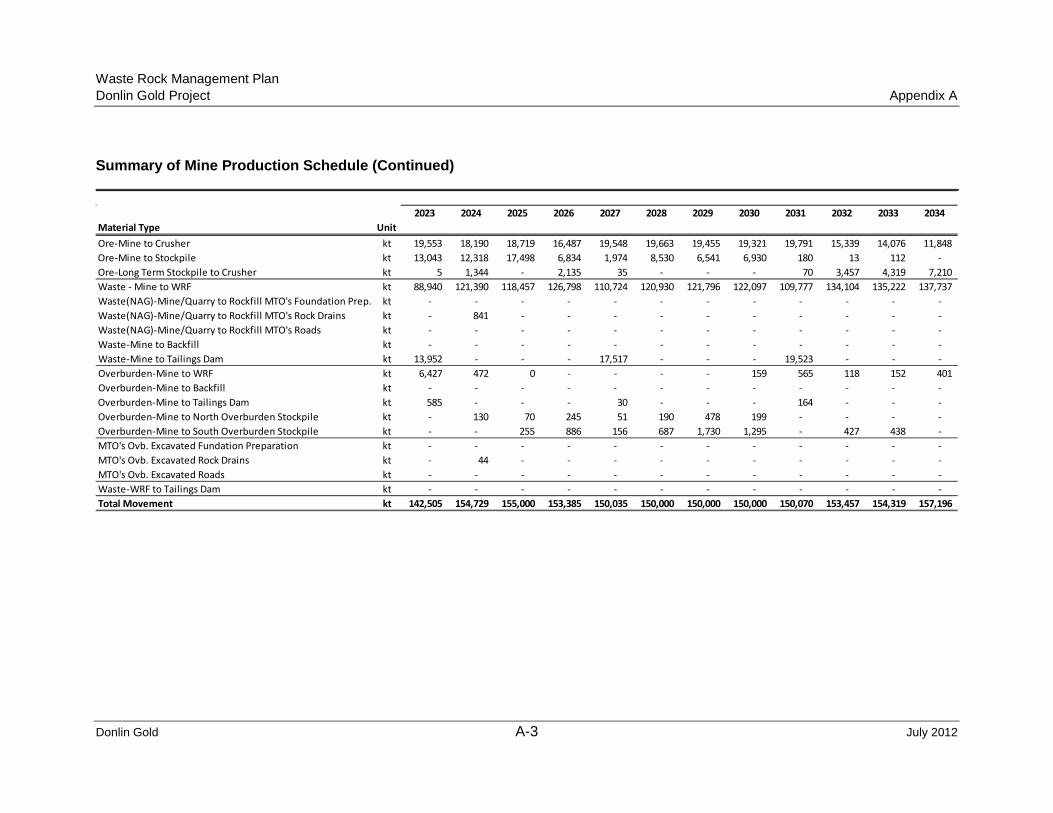
Waste Rock Management Plan Donlin Gold Project Appendix A
Donlin Gold A-3 July 2012
Summary of Mine Production Schedule (Continued)
2023 2024 2025 2026 2027 2028 2029 2030 2031 2032 2033 2034Material Type UnitOre-Mine to Crusher kt 19,553 18,190 18,719 16,487 19,548 19,663 19,455 19,321 19,791 15,339 14,076 11,848 Ore-Mine to Stockpile kt 13,043 12,318 17,498 6,834 1,974 8,530 6,541 6,930 180 13 112 - Ore-Long Term Stockpile to Crusher kt 5 1,344 - 2,135 35 - - - 70 3,457 4,319 7,210 Waste - Mine to WRF kt 88,940 121,390 118,457 126,798 110,724 120,930 121,796 122,097 109,777 134,104 135,222 137,737 Waste(NAG)-Mine/Quarry to Rockfill MTO's Foundation Prep. kt - - - - - - - - - - - - Waste(NAG)-Mine/Quarry to Rockfill MTO's Rock Drains kt - 841 - - - - - - - - - - Waste(NAG)-Mine/Quarry to Rockfill MTO's Roads kt - - - - - - - - - - - - Waste-Mine to Backfill kt - - - - - - - - - - - - Waste-Mine to Tailings Dam kt 13,952 - - - 17,517 - - - 19,523 - - - Overburden-Mine to WRF kt 6,427 472 0 - - - - 159 565 118 152 401 Overburden-Mine to Backfill kt - - - - - - - - - - - - Overburden-Mine to Tailings Dam kt 585 - - - 30 - - - 164 - - - Overburden-Mine to North Overburden Stockpile kt - 130 70 245 51 190 478 199 - - - - Overburden-Mine to South Overburden Stockpile kt - - 255 886 156 687 1,730 1,295 - 427 438 - MTO's Ovb. Excavated Fundation Preparation kt - - - - - - - - - - - - MTO's Ovb. Excavated Rock Drains kt - 44 - - - - - - - - - - MTO's Ovb. Excavated Roads kt - - - - - - - - - - - - Waste-WRF to Tailings Dam kt - - - - - - - - - - - - Total Movement kt 142,505 154,729 155,000 153,385 150,035 150,000 150,000 150,000 150,070 153,457 154,319 157,196

Waste Rock Management Plan Donlin Gold Project Appendix A
Donlin Gold A-4 July 2012
Summary of Mine Production Schedule (Continued)
2035 2036 2037 2038 2039 2040 2041 2042 2043 2044 2045 TotalMaterial Type UnitOre-Mine to Crusher kt 15,059 11,619 14,559 15,469 15,633 11,162 8,725 16,135 4,308 - - 384,162 Ore-Mine to Stockpile kt 4 - - 6 2,774 4,327 - 201 - - - 120,649 Ore-Long Term Stockpile to Crusher kt 4,380 7,880 4,978 4,160 2,983 7,129 10,476 3,057 15,182 19,550 16,956 120,650 Waste - Mine to WRF kt 111,329 120,033 110,146 62,505 4,342 - - 1 2 - - 2,209,901 Waste(NAG)-Mine/Quarry to Rockfill MTO's Foundation Prep. kt - - - - - - - - - - - 1,518 Waste(NAG)-Mine/Quarry to Rockfill MTO's Rock Drains kt - - - - - - - - - - - 10,198 Waste(NAG)-Mine/Quarry to Rockfill MTO's Roads kt - - - - - - - - - - - 1,046 Waste-Mine to Backfill kt 5,000 - - 72,000 127,230 104,011 65,523 40,663 8,676 - - 423,103 Waste-Mine to Tailings Dam kt 17,998 - - - - - - - - - - 89,856 Overburden-Mine to WRF kt 609 1,348 1,294 20 8 - - - - - - 24,734 Overburden-Mine to Backfill kt - - - - 13 - - - - - - 13 Overburden-Mine to Tailings Dam kt - - - - - - - - - - - 779 Overburden-Mine to North Overburden Stockpile kt - - - - - - - - - - - 6,234 Overburden-Mine to South Overburden Stockpile kt - - - - - - - - - - - 10,362 MTO's Ovb. Excavated Fundation Preparation kt - - - - - - - - - - - 2,464 MTO's Ovb. Excavated Rock Drains kt - - - - - - - - - - - 504 MTO's Ovb. Excavated Roads kt - - - - - - - - - - - 4,279 Waste-WRF to Tailings Dam kt - - - - - - - - - - - - Total Movement kt 154,380 140,880 130,978 154,160 152,983 126,629 84,723 60,057 28,168 19,550 16,956 3,410,452

Appendix B Block Model Views

Figure 1: Year 2018 – N6878500, elevation 142 m. Ore is yellow
Figure 2: Year 2019 – N6878500, elevation 136 m. Ore is yellow
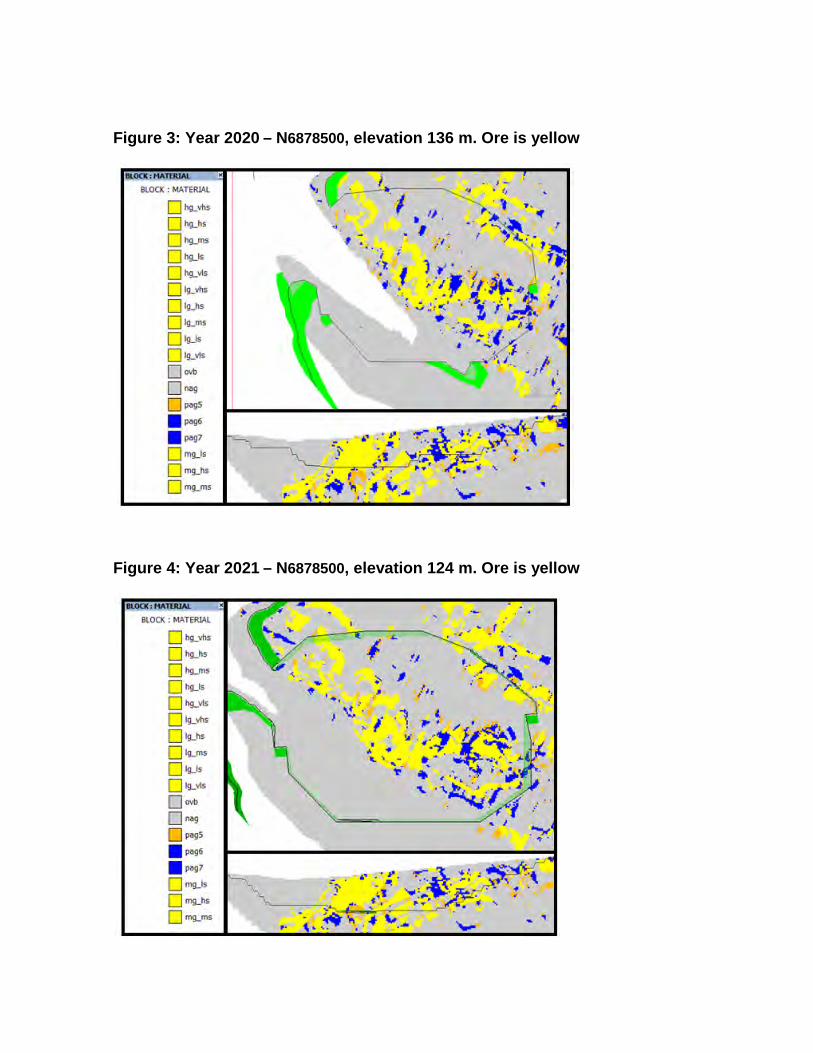
Figure 3: Year 2020 – N6878500, elevation 136 m. Ore is yellow
Figure 4: Year 2021 – N6878500, elevation 124 m. Ore is yellow

Figure 5: Year 2022 – N6878500, elevation 124 m. Ore is yellow
Figure 6: Year 2024 – N6878500, elevation 160 m. Ore is yellow
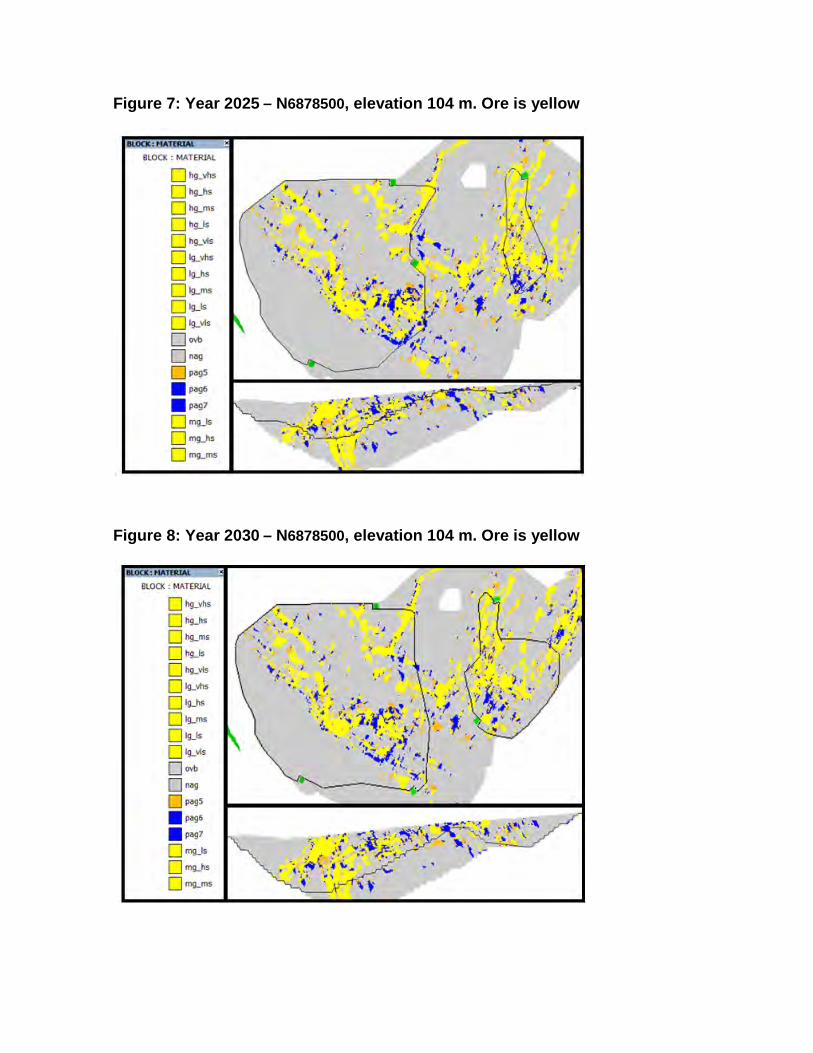
Figure 7: Year 2025 – N6878500, elevation 104 m. Ore is yellow
Figure 8: Year 2030 – N6878500, elevation 104 m. Ore is yellow

Figure 9: Year 2035 – N6878500, elevation 104 m. Ore is yellow
Figure 10: Year 2040 – N6878500, elevation 104 m. Ore is yellow