integrated vector management: méxico’s strategycarpha.org/portals/0/docs/meetings/chikv/s3p4 -...
TRANSCRIPT

Integrated vector management: México’s strategy
Juan I. Arredondo-Jimé[email protected]
Universidad Autónoma de Nuevo LeónSan Nicolás de los Garza, N. L.
MEXICO2 March 2015Disclaimer: Opinions herein presented by speaker are personal and may
not represent the official posture of the Mexican Ministry of Health

dengue
Aedes aegypti
Healthy human
Sick human
Reservoir: human
Ae. albopictus
IDEAL ENVIRONMENT
Dengue´s/Chikungunya’s cycle
VectorsPathogens: Virus
Chikungunya

Chikungunya can only be controlled if, and only if
• Less mosquitoes contact people, by
• Preventing their breeding
• Killing enough of them

Mosquito breeding prevention (source reduction) is achieved by
• Effective health promotion/communication strategy
• Environmental sanitation by municipal authority and intersectoral activities
• Community participation

Killing enough mosquitoes is achieved by
• Application of integrated control measures(larviciding and adulticiding)• where is needed (evidence-based
targetting),• when is needed (opportunity), • the amount needed (coverage), and • for as long as is needed (frequency)

New Regulations
http://www.cenaprece.salud.gob.mx/programas/interior/vectores/descargas/pdf/nom_032_ssa2_2010_norma_petv.pdf

New Regulations
http://www.cenaprece.salud.gob.mx/programas/interior/vectores/descargas/pdf/nom_032_ssa2_2010_norma_petv.pdf

Dengue control
• Reactive
• How we can make it proactive toprevent/maintain low levels oftransmission??
• Early warning: Is it possible?

• Plataforma del SINAVE-DGEhttp://www.rhove.gob.mx/
• Plataforma de Vigilancia Entomológica y Control Integral del Vector.
http://kin.insp.mx/aplicaciones/PlataformaDengue/
Information is linked

Focalized control
P
S
S
T
Susceptible
Inmune
Sub-clínical
Clínical
ST
ÍndexI
Anticipatory measures
¿¿¿Sentinel entomological surveillance??
Focalized control
Epidemiological Surveillance
Ongoing since 2008

La ubicación se hace desde al mapa para no ser influido por el aspecto real y se trata de uniformizar de forma equidistante
Se instalan 4 ovitrampaspor manzana en viviendas ubicadas en cada lado de la manzanaLa abundancia se expresa como el promedio de huevos por manzana
Sentinel entomological surveillance

Sentinel entomological surveillance*
1. Dengue probablecase occurringwithin a 300 mradius with highentomological risk.
2. Dengue probablecase occurringwithin a 300 mradius with mediumhigh to medium lowentomological risk.
3. No dengue casewithin a 300 mradius with high tomedium highentomological risk.
4. No dengue casewithin a 300 mradius with mediumlow to lowentomological risk.
Strata (quartiles) for index of dengue risk:

Sentinel entomological surveillance*
Acapulco Guadalajara
Week 7-9, 2015

Dengue’s risk index
• Datos a la semana 10 de 2012 en Mérida, Yucatán. Fuente: Plataforma Unica de Vigilancia Entomológica,CENAPRECE-INSP
• Approach emphasizes that dengue’s risk varies spatially and temporally.
• Vector control operations target those areas where high entomological risk is found and a dengue probable case spatially coincide

• 216,901 ovitraps placed in 31 states and federal district• 54,226 blocks with 4 ovitraps each
Entomological surveillanceState Number of ovitraps placedAguscalientes 2,151Baja California 665Baja California Sur 3,282Campeche 3,295Chiapas 7,165Chihuahua 950Coahuila 4,423Colima 5,923Distrito Federal 562Durango 1,044Guanajuato 7,889Guerrero 12,437Hidalgo 1,509Jalisco 14,403México 517Michoacán 15,863Morelos 3,870Nayarit 3,024Nuevo León 31,228Oaxaca 6,063Puebla 4,797Querétaro 717Quintana Roo 5,090San Luis Potosí 5,551Sinaloa 4,913Sonora 5,721Tabasco 7,149Tamaulipas 31,601Tlaxcala 53Veracruz 16,252Yucatán 8,478Zacatecas 316
Total 216,901

Entomological surveillance
050100150200250300350400
0102030405060708090
100
1 4 7 10 13 16 19 22 25 28 31 34 37 40 43 46 49 52
%OP %L PHM
050100150200250300350400
0102030405060708090
100
1 4 7 10 13 16 19 22 25 28 31 34 37 40 43 46 49 52
%OP %L PHM
Colima Guerrero
050100150200250300350400
0
20
40
60
80
100
1 4 7 10 13 16 19 22 25 28 31 34 37 40 43 46 49 52
%OP %L PHM
050100150200250300350400
0
20
40
60
80
100
1 4 7 10 13 16 19 22 25 28 31 34 37 40 43 46 49 52
%OP %L PHM
Jalisco Nuevo León

Entomological surveillance
0
100,000
200,000
300,000
400,000
500,000
600,000
700,000
800,000
900,000
1,000,000
ENERO FEBRERO MARZO ABRIL MAYO JUNIO JULIO AGOSTO *
32 Zacatecas31 Yucatán30 Veracruz de Ignacio de la Llave29 Tlaxcala28 Tamaulipas27 Tabasco26 Sonora25 Sinaloa24 San Luis Potosí23 Quintana Roo22 Querétaro21 Puebla20 Oaxaca19 Nuevo León18 Nayarit17 Morelos16 Michoacán de Ocampo15 México14 Jalisco13 Hidalgo12 Guerrero11 Guanajuato10 Durango09 Distrito Federal08 Chihuahua07 Chiapas06 Colima05 Coahuila de Zaragoza04 Campeche03 Baja California Sur02 Baja California01 Aguascalientes
Lect
utra
s po
r mes
* Last week of August not included

Eggs collected in 2014Huevecillos de ovitrampas 2014
CLAVE ENTIDAD JAN FEB MAR APR MAY JUN JUL AUG SEP OCT NOV DEC01 Aguascalientes 136 999 1,061 8,650 31,671 91,205 224,486 178,307 180,521 208,994 48,946 3,48302 Baja California 0 265 0 290 1,363 2,754 3,605 2,084 2,947 7,757 2,221 21103 Baja California Sur 65,279 99,489 99,906 231,150 228,528 294,863 427,762 556,272 560,008 548,402 98,448 51,57304 Campeche 72,001 201,142 169,368 131,901 143,206 88,702 188,770 271,559 231,242 317,368 241,706 119,20405 Coahuila 3,430 10,787 11,019 28,484 30,126 80,322 165,616 223,314 155,271 286,696 140,999 41,81906 Colima 437,918 344,228 406,523 401,023 234,821 452,742 916,294 303,714 302,790 394,443 166,078 126,59807 Chiapas 48,644 118,928 275,279 578,194 800,545 1,165,853 1,502,462 994,572 906,294 1,353,923 889,947 462,59608 Chihuahua 154 76 931 975 3,580 5,685 19,512 10,485 31,647 26,666 10,940 21009 Distrito Federal 20 0 269 689 1,175 1,132 5,605 8,442 7,375 11,239 5,837 40210 Durango 185 1,755 6,218 20,795 38,576 73,161 148,875 212,432 174,428 282,091 50,979 1,52111 Guanajuato 0 0 0 99,895 111,136 228,346 345,709 371,430 340,864 371,927 129,564 24,73112 Guerrero 682,965 774,176 710,194 794,291 935,075 2,316,011 2,326,236 1,068,522 1,420,403 1,862,200 1,296,348 911,58613 Hidalgo 8,701 36,337 61,146 179,382 208,491 341,991 527,610 202,909 190,804 340,133 191,048 16,42414 Jalisco 227,171 298,606 261,062 463,999 645,041 1,086,547 2,075,951 1,204,599 1,195,048 1,664,364 591,937 244,77315 México 206 1,633 1,002 1,841 3,889 15,553 24,597 9,697 13,031 13,305 6,728 2,01316 Michoacán 200,731 441,285 403,615 517,710 571,984 1,284,808 1,918,229 1,312,343 1,244,133 1,486,374 840,754 443,17917 Morelos 0 58,520 122,313 278,714 412,977 653,138 1,251,490 890,701 681,028 875,584 419,147 144,82718 Nayarit 0 0 45,814 164,650 179,875 205,834 520,570 424,333 408,611 454,149 291,167 286,77319 Nuevo León 930 1,147 10,357 256,583 1,097,077 1,988,251 2,941,501 2,074,235 1,913,124 6,317,759 1,364,742 172,43520 Oaxaca 280,651 534,745 588,749 631,830 678,455 1,244,452 1,463,148 639,989 691,151 904,757 676,977 460,19621 Puebla 7,491 28,334 63,614 211,700 308,899 640,342 1,214,862 651,194 548,317 655,582 250,931 100,14422 Querétaro 0 6 844 1,089 138 0 0 0 0 7,356 4,188 28,43923 Quintana Roo 203,123 163,602 162,150 307,512 248,718 423,583 555,662 296,496 349,348 655,801 524,435 406,62424 San Luis Potosí 15,481 22,107 82,750 329,609 267,895 494,935 1,185,829 543,637 489,555 796,156 381,859 220,26825 Sinaloa 0 0 0 342,567 309,803 207,897 753,923 1,210,471 1,229,056 1,467,126 697,753 582,54526 Sonora 32,331 50,866 100,012 266,442 239,237 214,576 355,023 555,927 602,418 600,640 244,184 67,06227 Tabasco 122,159 395,324 483,063 529,529 666,869 972,017 941,147 535,186 632,376 1,045,136 877,285 1,006,74328 Tamaulipas 243,258 125,027 129,353 1,190,356 1,593,172 2,702,436 3,716,050 1,952,427 2,353,975 5,462,723 2,236,456 651,80729 Tlaxcala 0 0 0 32 2,407 512 1,312 1,870 1,020 1,380 1,950 35030 Veracruz 107,044 509,024 609,779 917,400 700,679 1,374,187 2,123,617 1,275,195 1,216,565 1,474,425 1,261,469 892,97231 Yucatán 1,058,536 938,029 768,225 686,891 677,859 1,885,975 2,337,202 1,929,514 1,595,239 2,092,047 1,396,900 1,364,58432 Zacatecas 0 0 717 9,753 16,067 32,086 59,470 51,856 46,544 45,534 21,860 3,449Total 3,818,545 5,156,437 5,575,333 9,583,926 11,389,334 20,569,896 30,242,125 19,963,712 19,715,133 32,032,037 15,363,783 8,839,541
Year Total182,249,802

Any evidence that the system works?

Semana epi 232011

Semana epi 242011

Semana epi 302011

. xtpoisson huevos casos temperatura precipitación nwsector1 nwsector2 nwsector3 nwagua2 nwagua3 nwagua4 kernel22 kernel23, exposure(semepi) irr
Fitting Poisson model:
Iteration 0: log likelihood = -1284321.5Iteration 1: log likelihood = -1284199.8Iteration 2: log likelihood = -1284199.8
Fitting full model:
Iteration 0: log likelihood = -1130603.8Iteration 1: log likelihood = -1117904.1Iteration 2: log likelihood = -1117726.7Iteration 3: log likelihood = -1117722.4Iteration 4: log likelihood = -1117722.4
Random-effects Poisson regression Number of obs = 41157Group variable: id_ovi Number of groups = 807
Random effects u_i ~ Gamma Obs per group: min = 51avg = 51.0max = 51
Wald chi2(11) = 343891.75Log likelihood = -1117722.4 Prob > chi2 = 0.0000
------------------------------------------------------------------------------huevos | IRR Std. Err. z P>|z| [95% Conf. Interval]
-------------+----------------------------------------------------------------Casos | 1.179676 .0185524 10.51 0.000 1.143869 1.216604
Temperatura | 2.631235 .0061294 415.31 0.000 2.619249 2.643276Precipitacion| 1.013657 .0001268 108.46 0.000 1.013409 1.013906
nwsector1 | 1.223325 .0854104 2.89 0.004 1.066873 1.402721nwsector2 | 1.200981 .0795641 2.76 0.006 1.054738 1.367501nwsector3 | 1.147871 .0705205 2.24 0.025 1.01765 1.294754nwagua2 | 1.056217 .1699304 0.34 0.734 .7705607 1.44777nwagua3 | .871753 .1340956 -0.89 0.372 .6448506 1.178495nwagua4 | .7161644 .1177026 -2.03 0.042 .5189394 .9883456
kernel22 | 2.365626 .0078318 260.08 0.000 2.350325 2.381026kernel23 | 4.264975 .0152876 404.65 0.000 4.235117 4.295044
semepi | (exposure)-------------+----------------------------------------------------------------
/lnalpha | -.9595897 .0470931 -1.05189 -.8672889-------------+----------------------------------------------------------------
alpha | .38305 .018039 .3492768 .4200889------------------------------------------------------------------------------Likelihood-ratio test of alpha=0: chibar2(01) = 3.3e+05 Prob>=chibar2 = 0.000
Dengue risk increases
• 2.36 times when density is >23eggs/ovitrap
• 4.26 times when density is >67eggs/ovitrap
Statistics: Poisson regression

Entomological risk and its association with dengue transmission
• Mosquito presence/abundance determines receptivity to localtransmission
• Mosquito population distribution is hetereogenous.• It is advisable to stratify distribution and abundance to establish
those sites where dengue transmission is more likely.
Median egg numbers with 5-week lag is significanty associatedwith dengue transmission (P =1.92e-09 )
Black circles indicate maximum predictive levels => when dengue outbreak begins!
Cross correlation
Marissa Grossman, Gonzalo Vazquez-Prokopec Emory University

Prioritary areasJust cases Cases and mosquito populations (eggs)
76 AGEBs 47 AGEBs

TACTIC 3Larviciding
TACTIC 4Adulticiding: Space treatments
TACTIC 5Adulticiding: Indoor residualspraying
TACTIC 6Active epidemiologicalsurveillance
TACTIC 1Attack to determinants
TACTIC 2Community ParticipationSource reduction “Patio limpio y cuidado del agua almacenada”House screening (LLIS)
Dengue Vector Integrated management
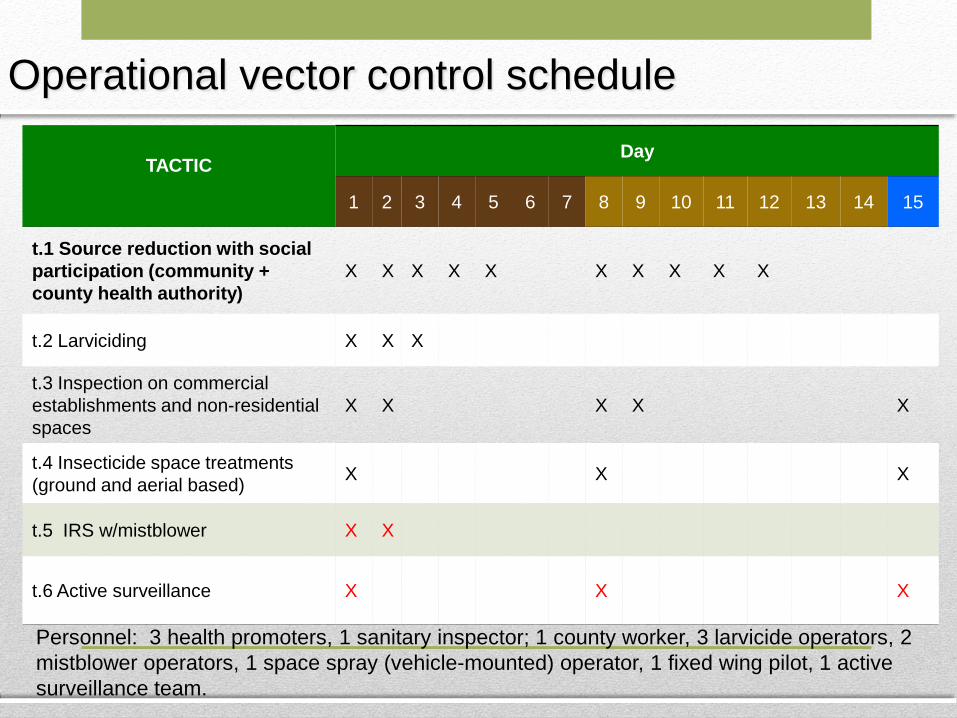
Operational vector control schedule
TACTICDay
1 2 3 4 5 6 7 8 9 10 11 12 13 14 15
t.1 Source reduction with social participation (community + county health authority)
X X X X X X X X X X
t.2 Larviciding X X X
t.3 Inspection on commercialestablishments and non-residentialspaces
X X X X X
t.4 Insecticide space treatments(ground and aerial based) X X X
t.5 IRS w/mistblower X X
t.6 Active surveillance X X X
Personnel: 3 health promoters, 1 sanitary inspector; 1 county worker, 3 larvicide operators, 2 mistblower operators, 1 space spray (vehicle-mounted) operator, 1 fixed wing pilot, 1 active surveillance team.

Strategies according to scenary
ActionScenary type
Lowendemic
High endemic Outbreaks
Early warning
• Environmental, entomologic, virologic and epidemiologic surveillance
+++ +++ +++
• Oportune diagnosis and quality medical attention at all levels
+++ +++ +++
Early response
• Intersectoriality promotion ++ +++ +++
• Health promotion ++ +++ +++
• Vector control in areas where most abundant ++ +++ +++

Large scale operative: During outbreaks
Strengthening of vector control operations
Partnerships withmunicipality
Intersectoral actions

High outbreak riskdue to numerousand widespreadbreeding sites and abundant mosquito populations
Importedcases and firstauthoctonouscases
Explosiveoutbreak with100% susceptible population
Death risk
Media coverage
Social pressure
Political and sanitary
repercusionsIncrease expenses in
medical attentionAbsenteeism
In workplaces and schools
Drop in tourism
and economic
activity
Chikungunya is a matter of national security for Mexico
Chikungunya’s trascendence

Tactics to be incorporated: Physical control
• LLIS (long-lasting insecticide treated screens): large up-scaling in 2015 along with control of target productivebreeding sites
• Dengue vaccine in 2015?

LLIS in houses

LLIS in schools

Chikungunya in Mexico

What do I have to do to protect myself and my family fromgetting Chikungunya whether or not local health servicesundertake control measures?
• Discard and/or manage household containers (sourcereduction)
• Make sure your neighbors do the same!• Use repellent (desirably >40% deet)• Install physical barriers (screens on doors and windows)
(desirably LLIS)• Use household insecticides (any, better more than none!)
The burning question
