integrated transmission plan 2015 - transpower · 3.3. the itp as part of our strategy framework...
TRANSCRIPT
INTEGRATED TRANSMISSION PLAN 2015

Integrated Transmission Plan September 2015 II

FOREWORD
Transpower owns and operates New Zealand’s national grid—the high-voltage network that carries electricity around the country, powering businesses and communities, and supporting a competitive electricity market.
In 2013 we submitted a proposal to the Commerce Commission for the services we would deliver and the funding we would require for the five years from 1 July 2015. Embedded within our proposal was our first Integrated Transmission Plan (ITP). This update is our first stand-alone ITP.
Publishing this 2015 ITP is an important milestone. Bringing our plans together into an accessible set of documents creates a valuable business resource and provides a foundation for streamlining, improving and explaining how we deliver services into the future.
We are in the early stages of transforming our business to drive towards efficiency targets we have set ourselves for the next five years. This ITP captures our current plans and how we operate now—we expect to make significant changes by the time we publish our next update in 2016 and further changes in 2017. Our 2018 ITP will provide the basis for our next five-year regulatory proposal.
The plans within this ITP will play a key role in driving our business forward. The activities within these plans support us in making the right decisions relating to our assets at the right time, so that everything we do aligns with our overall customer service aims. We will be referring to these documents regularly to ensure our work supports the services we aim to deliver into the future.
We manage over $4 billion of transmission assets. To continuously achieve efficiencies in the way we deliver the national grid transmission service, we need to continue to take a long-time view that balances expenditure over time. This ITP explains our goal of driving expenditure down by around 10 per cent over the next five years while continuing to meet our service performance targets and adapting to changing demands of the grid. This is no small challenge.
If you are interested in our business, then we trust you will find the 2015 ITP a useful resource. If you want to track our progress or to engage with us on how we should set our performance targets from 2020 we recommend you look out for our next ITP update in the middle of next year.
Alison Andrew Chief Executive September 2015
Integrated Transmission Plan September 2015 III

TABLE OF CONTENTS FOREWORD .......................................................................................................................................... III 1. INTRODUCTION ........................................................................................................................ 5 1.1. Purpose ....................................................................................................................................... 5 1.2. 2015 context ............................................................................................................................... 6 2. OUR BUSINESS ......................................................................................................................... 8 3. STRATEGY .............................................................................................................................. 10 3.1. Strategy framework ................................................................................................................... 10 3.2. Purpose and strategic themes .................................................................................................. 11 3.3. The ITP as part of our strategy framework ............................................................................... 11 3.4. 2015/16 priorities ...................................................................................................................... 11 4. SERVICES ................................................................................................................................ 13 4.1. Background ............................................................................................................................... 13 4.2. Services framework .................................................................................................................. 13 4.3. Service measures and targets .................................................................................................. 14 5. DEVELOPMENT ....................................................................................................................... 17 5.1. Background ............................................................................................................................... 17 5.2. Development framework ........................................................................................................... 17 5.3. Development outlook ................................................................................................................ 18 6. FORECASTS ............................................................................................................................ 20 6.1. Overview ................................................................................................................................... 20 6.2. Planning systems ...................................................................................................................... 21 7. PLANS ...................................................................................................................................... 23 7.1. Expenditure categories ............................................................................................................. 23 7.2. Base capital expenditure .......................................................................................................... 23 7.3. Operating expenditure .............................................................................................................. 27
ITP SCHEDULES 1. Expenditure overview 2. Base capital expenditure 3. Base capital expenditure—deliverables 4. Operating expenditure 5. Major capital expenditure—approved projects 6. Major capital expenditure—outputs 7. Major capital expenditure—under development 8. Output measures
Integrated Transmission Plan September 2015 IV

INTRODUCTION
1. INTRODUCTION
This chapter explains:
• the purpose of the Integrated Transmission Plan (ITP) • context for the 2015 ITP • the structure of the ITP.
1.1. PURPOSE The ITP documents our plans for our regulated transmission business for the next 10 years. It describes the services we aim to deliver, our network development plans and our asset management plans. Setting out our planning in this way makes it easier for stakeholders to understand and engage with our business, and provides a valuable internal resource. We have also designed the ITP to satisfy regulatory requirements1.
The ITP has three supporting documents, as illustrated below.
Figure 1: ITP and supporting documents
The projects and initiatives described in this ITP present our best view of our asset management and investment intentions. Much of the work included in our plans is still subject to internal governance procedures, including meeting financial approval requirements, and in some cases customer consultation, before it can proceed. We also have processes for reviewing and refining our work plan. These processes can reduce, increase or alter scope and cost.
1 The Transpower Capital Expenditure Input Methodologies Determination (Capex IM) published by the Commerce Commission requires us to prepare an ITP every five years, and to provide updates most years.
•Overview •Expenditure and output schedules
Integrated Transmission Plan
•Services framework •Service measures and targets Services Report
•Forecast demand and generation •Backbone and regional development plans
Transmission Planning Report
•Part 1: Asset management framework •Part 2: Asset class plans
Asset Management Plan
Integrated Transmission Plan September 2015 5

INTRODUCTION
1.2. 2015 CONTEXT Our first ITP was completed in 2013 and embedded within our regulatory proposal for the five-year control period beginning 1 July 2015. This is our second control period, referred to throughout this document as RCP2. We expect our next control period, RCP3, will also run for five years.
The 2015 ITP updates the 2013 edition, and is our first stand-alone ITP. This means we have put a lot of effort into establishing a structure and format that both meets regulatory requirements and provides an informative and accessible document. This is work in progress and we would welcome any input you have on how we can improve our ITP. We will update this ITP again in 2016 and 2017. In 2018 we will publish a new ITP that provides the basis for our RCP3 regulatory proposal.
Our 2013 ITP introduced a new services framework, and set targets to lift performance at our high priority and important points-of-service. We also set ourselves efficiency targets for capital expenditure and operating costs. The Commission accepted our new framework and targets, and set further challenges for our information and communications technology (ICT) costs, and for some of our corporate operating costs.
Figure 2: Main targets and developments for 2013 ITP
The 2013 ITP pioneered several new asset management tools developed to support our forecasts. These included new asset health models to help understand the relative likelihood of asset failure into the future, and a services criticality framework to help understand the relative consequences of failure. We used these tools, together with expert knowledge and other established processes, to develop our plans for grid replacement and refurbishment (R&R) capital expenditure (capex).
We developed a new model for the 2013 ITP to create a seven-year forecast of total grid maintenance expenditure, and were also in the process of commissioning a new asset management information system, Maximo. Maximo holds information on the condition of assets, scheduled maintenance and work orders.
In 2014 we became one of the first New Zealand electricity utilities to achieve certification against the international PAS 55 asset management standard. Achieving certification required development and documentation of our asset management framework and processes. We used this documentation to support our 2013 ITP.
In the year to 30 June 2015, our business has focussed on the following priorities relevant to the 2015 ITP.
• Completing our RCP1 capital programme—as we entered the year we were behind on delivery of the base capex programme we intended to complete during RCP1. Ending the period with uncompleted work would create financial and resourcing pressures in RCP2, so we had a sustained focus throughout the year on capital project delivery. This was very successful and enabled us to end the control period with 97 per cent of RCP1 capital works (by value) completed.
Capex
•Reduce grid replacement and refurbishment by 7.5% •Reduce ICT by 9%
Opex
•Reduce maintenance by 8% by the end of RCP2 •Reduce ICT by 2% •Hold departmental
Services
•Implement new framework •Improve performance for high priority and important sites
Integrated Transmission Plan September 2015 6
INTRODUCTION
• Operating cost control—as we entered the year we had mostly completed a programme of large capital projects and were close to completing the process of establishing settings for RCP2. We set ourselves a target to reduce operating costs below plan and were successful in achieving savings, many of which are able to be sustained into future years.
• Capability—we developed new capabilities to support our 2013 ITP but recognised more substantial re-engineering of our business processes is required to meet our new targets and to position ourselves well for preparing a robust RCP3 plan. During the year we developed a new grid operating model and made progress towards implementation. We began consultation on structural changes on 30 June, and work continues on re-engineering business processes.
• Service providers—we restructured the service provider contracts through which we deliver grid maintenance work and smaller capital projects. The new structure is designed to improve efficiency while providing us with better cost information and improved quality. To support these goals we have improved our works planning processes so that we can release more stable work plans earlier in the year, and are committed to further improvements.
• Transformation—commenced a wider business transformation process encompassing the capability and service provider priorities above, together with a suite of efficiency improvements. This is supported by a multi-year change management and culture change programme.
The 2015 ITP is based on the forecasts used for our 2015/16 business planning round. Our 2015/16 Business Plan focusses on implementing our business transformation process, progressing towards our RCP2 expenditure and service targets, and enhancing our risk management systems. Consistent with its focus, the Business Plan had a five-year forecasting horizon and did not revisit the profile of 2016/17 to 2019/20 grid maintenance expenditure.
Integrated Transmission Plan September 2015 7
OUR BUSINESS
2. OUR BUSINESS
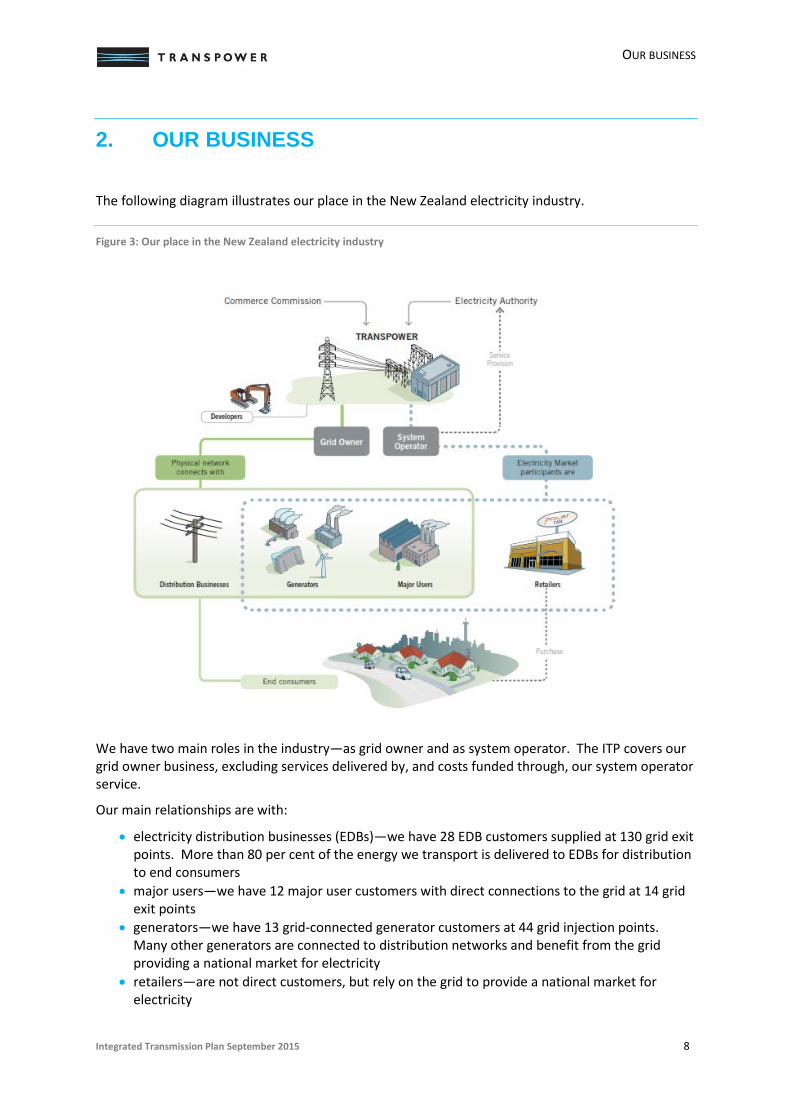
The following diagram illustrates our place in the New Zealand electricity industry.
Figure 3: Our place in the New Zealand electricity industry
We have two main roles in the industry—as grid owner and as system operator. The ITP covers our grid owner business, excluding services delivered by, and costs funded through, our system operator service.
Our main relationships are with:
• electricity distribution businesses (EDBs)—we have 28 EDB customers supplied at 130 grid exit points. More than 80 per cent of the energy we transport is delivered to EDBs for distribution to end consumers
• major users—we have 12 major user customers with direct connections to the grid at 14 grid exit points
• generators—we have 13 grid-connected generator customers at 44 grid injection points. Many other generators are connected to distribution networks and benefit from the grid providing a national market for electricity
• retailers—are not direct customers, but rely on the grid to provide a national market for electricity
Integrated Transmission Plan September 2015 8

OUR BUSINESS
• developers—property developers and other infrastructure providers meet any direct costs of relocating or undergrounding transmission assets to accommodate development
• Commerce Commission—regulates our transmission service revenues, works with us to set service targets and governs incentive arrangements
• Electricity Authority—sets reliability standards, governs our pricing methodology and grid access framework.
In 2015/16, regulated transmission services account for 90 per cent of our revenue. The system operator service and customer-funded grid connections account for a further 4 per cent each. The balance of our business involves non-regulated services, such as our emsTradepoint natural gas market.
At 30 June 2015 we have $4.3 billion of transmission assets, including $754 million of high-voltage direct current (HVDC) assets and $176 million of telecommunications assets.
We have 169 substations across the North and South Islands and 11,238 km (route length) of overhead transmission lines. We have 68 km of underground high-voltage alternating current (HVAC) cables and 114 km of submarine HVDC cables. Our telecommunications assets include 1,355 km of fibre optic cables, 649 servers and 1,400 network routing switches.
We are a state-owned enterprise, with a statutory obligation to operate as a successful business.
Integrated Transmission Plan September 2015 9

STRATEGY
3. STRATEGY
This chapter provides:
• an overview of our strategy framework • our company-wide purpose and themes • information on the ITP as part of our strategy framework • a summary of our 2015/16 priorities.
3.1. STRATEGY FRAMEWORK Our strategy framework is illustrated below.
Figure 4: Our strategy and planning framework
At a high level our business is guided by our purpose and long term strategic themes which encompass all areas of our business, and our activities are underpinned by our values.
We are in the process of updating Transmission Tomorrow, which will examine developments that may alter the market for our services into the future or that may significantly alter how we deliver those services. Transmission Tomorrow helps inform long- to medium-term corporate strategy, which encompasses our company-wide customer strategy, information services strategy and people strategy.
All of these activities help inform long-term planning for our system operator and grid business lines. On an annual basis we bring these planning processes together with our business plan to confirm targets, priorities and budgets. As a state-owned enterprise, we also prepare a Statement of Corporate Intent each year that provides a public account of our plans for the next three years.
Integrated Transmission Plan September 2015 10

STRATEGY
To give effect to our priorities, each division develops a plan that in turn supports individual goal setting.
3.2. PURPOSE AND STRATEGIC THEMES Our purpose statement is “to connect New Zealanders to their power system through safe, smart solutions for today and tomorrow”. This is complemented by seven simple themes.
• Deliver a safe, zero-harm workplace. • Deliver excellent customer service and stakeholder engagement on a commercial platform. • Run an effective electricity market. • Plan an enduring grid that delivers smart solutions, cost-effectively. • Deliver a resilient, cost-effective transmission service for our customers. • Seek continuous business improvement. • Invest in good people.
3.3. THE ITP AS PART OF OUR STRATEGY FRAMEWORK The ITP supporting documents contain important components of our strategy framework.
• The Services Report sets target outputs, which in turn drive most of our expenditure. We developed new service measures for our 2013 ITP and have completed further work since (see Chapter 4).
• The Transmission Planning Report identifies potential grid developments (see Chapter 5). Our approach to pursuing these investments is shaped by our view of the future and our appetite for committing to new investments.
• The Asset Management Plan sets out our overall asset management strategy, and conveys the strategic choices we have made for management of particular asset fleets and asset lifecycle stages.
Our strategy framework was developed after the 2013 ITP and we are still working through its full development and implementation. We are supporting this with the establishment of new strategic and tactical asset management teams within our revised organisational structure.
We will be transitioning to this new structure from early October, so this ITP reflects that our planning processes are in transition. Many of our 2013 ITP strategy and planning documents, including parts of our asset management framework, remain current and are cited in this ITP, but will be updated as we complete our transition and start using our new grid operating model to set our work plans.
3.4. 2015/16 PRIORITIES Each year we identify a small number of business priorities that will help us advance our strategic goals. Our 2015/16 Business Plan identifies the following priorities directly relevant to this ITP.
3.4.1. SAFETY Safety is an enduring strategic issue for Transpower given the high level of intrinsic operational risk associated with operating a complex electricity network expected to deliver 24/7 reliability. This includes high public and workplace safety risks associated with high-voltage electricity and our mixture of heavy industrial and remote work sites.
Integrated Transmission Plan September 2015 11

STRATEGY
We want to lift our focus on the critical risks and to significantly decrease the risk and incidence of both high-consequence and high-frequency events. To do this we need to improve the discipline and rigour of the processes and underpinning safety culture in Transpower, our service providers and contractors.
We are concentrating on:
• systematic identification and management of risks that can result in serious injury or fatality; • improving our approach to works planning. Producing our plans earlier and improving their
stability should create an environment that supports our service providers to operate safely; • weaving safety into our asset management, from design to work practice.
These annual priorities fit with the safety strategies set out in our Asset Management Plan.
3.4.2. TRANSFORMATION As identified earlier in this document, we are implementing a business transformation process to help us achieve our goals. This includes implementing a new grid operating model and supporting structure, re-engineering business processes, pursuing business efficiencies and transforming our culture.
We have designed the high-level grid operating model and have started the process of restructuring. In 2015/16 we will be transitioning to the new structure, progressing detailed design of the operating model, applying the model and pursuing a series of complementary business improvement initiatives.
3.4.3. RISK FRAMEWORK We are aiming to improve the effectiveness of our risk management framework, using bow-tie and semi-quantitative risk assessment techniques to help balance risk mitigation efforts across our business.
Integrated Transmission Plan September 2015 12

SERVICES
4. SERVICES
This chapter:
• provides background on how our services framework has developed • describes our current services framework • sets out our current service measures and targets.
4.1. BACKGROUND During RCP1 we measured the quality of our services based on how many large interruptions (>0.05 system minutes2) and very large interruptions (>1 system minute) we caused each year; the total availability of our HVAC networks; and the energy availability of our inter-island HVDC link. Our targets were set based on sustaining historic performance.
To prepare for RCP2, we reviewed this approach in consultation with our customers and developed a new measurement framework that:
• sets separate measures for frequency and duration of interruptions experienced by each customer;
• classifies points-of-service as high priority, important, standard, N-security or generator and sets targets accordingly;
• sets availability targets for HVAC circuits identified as having the biggest market impact • sets forward-looking targets (not just based on historic performance), including for HVDC
energy availability.
This new framework was supported by our stakeholders and accepted by the Commerce Commission. From 2015/16 we have a financial incentive to meet or exceed our targets.
4.2. SERVICES FRAMEWORK Subsequent to the 2013 ITP we have further developed our services framework. This encompasses our grid and system operator business, and includes activities not regulated by the Commerce Commission.
2 One system minute is equivalent to the loss of total national electricity supply for one minute at peak load.
Integrated Transmission Plan September 2015 13
SERVICES
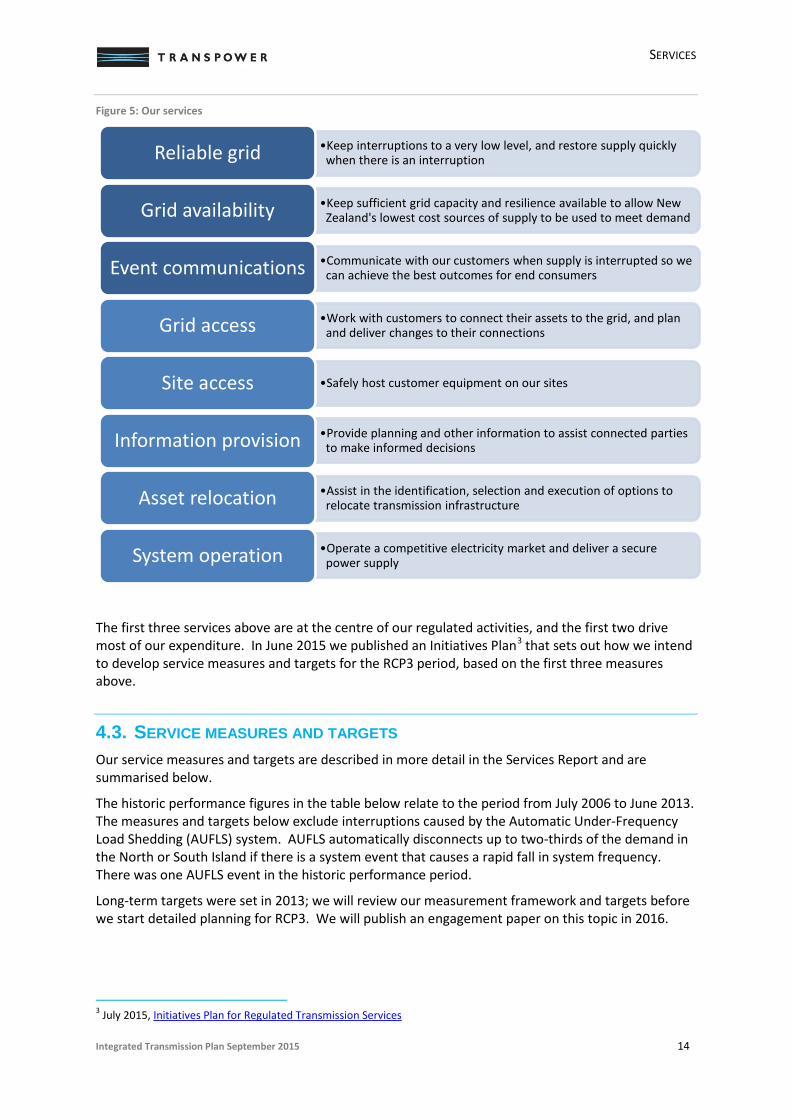
Figure 5: Our services
The first three services above are at the centre of our regulated activities, and the first two drive most of our expenditure. In June 2015 we published an Initiatives Plan3 that sets out how we intend to develop service measures and targets for the RCP3 period, based on the first three measures above.
4.3. SERVICE MEASURES AND TARGETS Our service measures and targets are described in more detail in the Services Report and are summarised below.
The historic performance figures in the table below relate to the period from July 2006 to June 2013. The measures and targets below exclude interruptions caused by the Automatic Under-Frequency Load Shedding (AUFLS) system. AUFLS automatically disconnects up to two-thirds of the demand in the North or South Island if there is a system event that causes a rapid fall in system frequency. There was one AUFLS event in the historic performance period.
Long-term targets were set in 2013; we will review our measurement framework and targets before we start detailed planning for RCP3. We will publish an engagement paper on this topic in 2016.
3 July 2015, Initiatives Plan for Regulated Transmission Services
•Keep interruptions to a very low level, and restore supply quickly when there is an interruption Reliable grid
•Keep sufficient grid capacity and resilience available to allow New Zealand's lowest cost sources of supply to be used to meet demand Grid availability
•Communicate with our customers when supply is interrupted so we can achieve the best outcomes for end consumers Event communications
•Work with customers to connect their assets to the grid, and plan and deliver changes to their connections Grid access
•Safely host customer equipment on our sites Site access
•Provide planning and other information to assist connected parties to make informed decisions Information provision
•Assist in the identification, selection and execution of options to relocate transmission infrastructure Asset relocation
•Operate a competitive electricity market and deliver a secure power supply System operation
Integrated Transmission Plan September 2015 14

SERVICES
Table 1: Summary of service performance measures—number of interruptions
Category Historic
performance (average)
RCP2 target (count)
RCP2 target (frequency)
Long-term target1 (count)
GP1: Number of interruptions High priority 5.1 2 1 in 10 years 2.3
Important 10 9 2 in 10 years 8.6
Standard 27.9 26 3 in 10 years 33–39
Generator 11 11 3 in 10 years 11–20
N-security 67.6 56 Varies by site 63
1 The long-term targets do not imply that we are, at this time, aiming to provide a deteriorating service. We will be reviewing long-term targets in preparation for RCP3 and in the interim we are aiming to hold or improve service at all sites.
Table 2: Summary of service performance measures—duration of interruptions
Category Historic performance RCP2 target Long-term target1
GP2: Average duration of interruptions (minutes) High priority 96.8 70 30 Important 154.6 100 30 Standard 66.4 65 60 Generator 177.3 130 60 N-security 93.0 80 60 GP3: P90 longest durations (minutes) High priority 164.8 120 60 Important 333.8 240 90 Standard 135.6 130 130–240 Generator 436.1 350 240 N-security 215.9 215 215–240
1 The long-term targets do not imply that we are, at this time, aiming to provide a deteriorating service. We will be reviewing long-term targets in preparation for RCP3 and in the interim we are aiming to hold or improve service at all sites.
Table 3: Summary of service performance measures—availability
Category Historic performance RCP2 target Long-term target
HVDC (energy) 97.3 98.5 98.5 Key HVAC Circuits 99.0 99.6 99.6
The locations of points-of-service and the key HVAC circuits are presented in the map below.
Integrated Transmission Plan September 2015 15

SERVICES
Figure 6: Map of points-of-service and critical circuits
Integrated Transmission Plan September 2015 16

DEVELOPMENT
5. DEVELOPMENT
This chapter:
• provides background on recent development activities • summarises our development framework • summarises our current development outlook.
5.1. BACKGROUND In the last 15 years, we have developed and substantially completed a large programme of investments to relieve constraints in the Upper North Island, Upper South Island, HVDC link and the Lower South Island.
Coinciding with the completion of our investment programme, there has been a period of low growth in total system demand since 2008. This has also coincided with completion of several large generation developments, leading to retirement of some large thermal generation units in the North Island, with owners signalling plans for further retirements. The need for grid development investment can be driven as much by changes in the location and timing of generation and demand as by changes in total system demand.
In 2007 we started a programme to replace our end-of-life communications network with a new fibre-based network (TransGO) that we now use for both critical services and standard corporate services. We are currently migrating our critical systems to new managed data centres.
5.2. DEVELOPMENT FRAMEWORK The Transmission Planning Report summarises our work on forecasting the ability of the grid to meet changes in demand and generation. The Report includes a Grid Reliability Report and a Grid Economic Investment Report that identify potential reliability and economic investments respectively.
Reliability investments are driven by the requirement to sustain compliance with the Grid Reliability Standard (GRS) set out in the Electricity Industry Participation Code (Code). For the core grid (defined in the EIPC) we are required to sustain a ‘deterministic’ N-1 security standard. This means we design the core grid so that demand can still be met with any one asset out of service. For the non-core grid we use an economic standard, whereby we weigh the cost of investment against the expected cost of interruptions.
We make economic investments based on assessing the cost of investment against expected electricity market benefits. Recent examples include our investment in the Wairakei Ring (which supports access to low-cost geothermal energy) and our investment in Pole 3 of the HVDC link (which improves sharing of resources between the North and South Islands).
Regional development requires close coordination with EDBs and other connected customers. In some cases, a customer will want more (or earlier) capacity than is required to meet the GRS and will fund investment directly. All new connections are also funded directly, and are contestable4.
4 The customer may contract with another supplier, or build the assets themselves but they must meet the technical and safety requirements for connection to our assets.
Integrated Transmission Plan September 2015 17

DEVELOPMENT
If the value of a development investment exceeds $20 million then it is classified as a major capex project, and requires individual regulatory approval. The approval process for major capex projects involves multiple stages of public consultation designed to test the need date for investment and to support selection of the investment option that provides the greatest benefit over the life of the investment.
Our ICT investments are aligned with grid investments and follow our Information Systems Strategic Plan and enterprise architectural principles. These target maximum benefit at lowest whole-of-life cost through strategies such as consolidation of platforms, and reusable software design patterns. We classify, plan and balance portfolio investment across:
• refresh and capacity expansion—sustaining benefits of existing systems • compliance, risk mitigation and resilience projects—reducing and managing residual risk • efficiency projects—improving operating or capital efficiency.
5.3. DEVELOPMENT OUTLOOK Our Transmission Planning Report forecasts relatively low growth in overall system demand, averaging 1.1% per annum to 2030.
Figure 7: Prudent peak demand forecast from our 2015 Transmission Planning Report (and earlier Annual Planning Reports)
While system demand growth is subdued, we expect some regions to experience considerably stronger demand growth. The development outlook for the grid backbone is summarised below.
Integrated Transmission Plan September 2015 18

DEVELOPMENT
• A key dynamic is the upcoming retirement of thermal generating units in the Upper North Island. This may change the timing for investments to relieve constraints and improve reactive support in the region. There may also be a case for additional investment in the Wairakei Ring if there is further significant development of geothermal generation in the region.
• There are existing constraints and the potential for new constraints between Wellington (Haywards) and Taupo (Whakamaru). This may drive some minor investment aimed at relieving congestion, but is unlikely to warrant investment that would completely eliminate the constraints.
• Capacity into the Upper South Island region is limited by voltage stability constraints that may warrant investment in a new switching station to sectionalise the 220 kV circuits supplying the region.
• We are completing a series of investments in the Lower South Island to improve reliability and capability to export power from the region, but have placed some investments on hold. These investments would become economic if the aluminium smelter at Tiwai were to close or if there was significant investment in new generation within the Lower South Island region.
• We are investigating a range of other issues, mainly in the North Island, that may lead to relatively modest new investments in future.
For ICT infrastructure, our development outlook is summarised below.
• Digital substation—we will shift substation functionality to a digital platform, accessible through Ethernet services.
• Cloud adoption—as we segregate critical systems from enterprise systems we have opportunities to shift to cloud services for non-critical applications, where cost-effective.
• Workforce automation—we will automate asset information collection and access to support improved situational awareness and safety processes.
• Cyber security— we will further enhance protection of critical grid security infrastructure from hostile cyber environments.
• TransGO Network— we will upgrade and expand our core Multi-Protocol Label Switching (MPLS) network to substations to provide a high speed optical transport network (OTN).
Integrated Transmission Plan September 2015 19

FORECASTS
6. FORECASTS
This chapter provides:
• an overview of forecast sources and key systems • information on the role of each key system.
6.1. OVERVIEW The following diagram summarises forecast sources and our main planning systems.
Figure 8: Forecasting sources and main planning systems
Our asset management planning processes are the main driver for identifying, prioritising and scheduling work. These processes are described in more detail in our Asset Management Plan.
6.1.1. CAPITAL EXPENDITURE For capital projects we maintain systems-based forecasts of:
• expenditure—value and timing of costs, including the accumulation of project financing costs (interest during construction)
• commissioning—value and timing of commissioning events (ie, when assets will be brought into service)
• deliverables—types of asset created, replaced or refurbished.
Projects with approved delivery business cases are overseen by project managers, programme managers and a project management office who actively manage forecasts of the expected timing and value of expenditure and commissioning.
Integrated Transmission Plan September 2015 20
FORECASTS
The approach to forecasting planned work (ie, work that does not yet have an approved delivery business case) depends on:
• whether it is volumetric in nature (eg tower painting; we plan to paint or repaint more than 2,500 towers in RCP2)
• how far the work is through our investigation and approvals processes.
We forecast planned volumetric work using standardised cost estimation building blocks and modelled interest during construction (with forecast interest rates). For non-volumetric work we place progressively less reliance on standardised cost estimates as the work advances through our investigation and approval process.
6.1.2. OPERATING EXPENDITURE We set an operating budget at the beginning of each year, based on a process of build-up and challenge. At the same time, we develop a business plan with a five- to 10-year horizon. Our 2015/16 Business Plan had a five year horizon, reflecting that we are at the beginning of a new control period and have a business transformation under way.
The techniques used to forecast costs vary by cost centre, but all forecasts are brought together into a consolidated forecast and subjected to challenge rounds at an operating division level and at a company-wide level.
6.2. PLANNING SYSTEMS In accordance with our enterprise architectural principles, we have planning systems that are designed of be ‘fit for purpose’ rather than ‘best in class’. We select systems that cater for our most important requirements, rather than the extended functionality that could be provided by a single enterprise solution. Our systems are designed to provide ease of support, interoperation and integration at minimal cost and risk. The main systems supporting our planning processes are described below.
6.2.1. PEOPLESOFT (FMIS) We use an Oracle PeopleSoft financial management information system (FMIS) as our core system for managing financial information, including our general ledger and fixed asset register. We use FMIS to hold and report on budgeting and project information.
We have recently upgraded FMIS to hold information on:
• planned capital works—previously we managed planned works in a separate asset management database, with FMIS only holding information on approved projects
• deliverables—we have defined more than 150 common asset types to allow easier analysis and reporting of planned volumes of assets to be built, replaced or refurbished. We have not used this new functionality for the 2015 ITP as we are still in the implementation phase.
6.2.2. TM1 We use an IBM Cognos TM1 system to prepare the forecasts presented in the ITP.
TM1 sources data from FMIS and other systems, and can hold scenarios that capture the state of our plans at a point in time. This allows comparison between plans, such as between our 2013 and 2015 ITPs.
Integrated Transmission Plan September 2015 21

FORECASTS
We use TM1 modelling capability to convert expenditure and commissioning date information held in FMIS into forecast commissioned values. We also model cost escalation in TM1, including converting project information held in nominal terms in FMIS into real terms.
For the 2013 ITP we used TM1 to model the impact of real price effects (changes in our input prices relative to economy-wide inflation). We have not updated real price effects forecasts for the 2015 ITP.
6.2.3. MAXIMO We use IBM Maximo Asset Management to hold information about our assets, their condition and maintenance schedules. We also use Maximo to manage work orders that authorise our service providers to carry out maintenance.
We commissioned our Maximo system in 2013. It provides a rich source of information that we use to support grid maintenance forecasts, and our broader asset management activities.
6.2.4. PROJECT SERVER (TIPU) We use Tipu, based on Microsoft Office Project Server, to manage active projects, hold project information, and support project reporting.
6.2.5. TEES We use the Transpower Enterprise Estimation System (TEES), based on software supplied by U.S. Cost, to produce volumetric and customised cost estimates.
We develop volumetric estimates for smaller, high-volume projects that are reasonably routine and uniform. We use feedback of historic cost out-turns for these types of projects to derive average unit costs for future works. We combine unit cost estimates to generate standardised ‘building block’ cost estimates for volumetric work programmes. Building block estimates are automatically fed through to FMIS and TM1.
For large single projects (>$1 million) that require individual, tailored investigation we use TEES to develop customised estimates. This involves desktop review of site information to determine an estimated scope of work. High-level estimates are supported by more targeted investigation as a project progresses towards approval and delivery.
Integrated Transmission Plan September 2015 22

PLANS
7. PLANS
This chapter provides an overview of our 2015 ITP expenditure forecast.
7.1. EXPENDITURE CATEGORIES This chapter presents expenditure using the categories illustrated below. Further detail on the make-up of each category is provided within the chapter.
Figure 9: Expenditure categories
The schedules attached to the ITP present full details of expenditure, and the Asset Management Plan provides information on our work plans, including information on major capex projects. All forecast information in this ITP was prepared as part of our 2015/16 business planning round, which was completed in June 2015. Capital expenditure forecasts were extracted from our systems in April 2015.
7.2. BASE CAPITAL EXPENDITURE Base capex refers to all capital incurred in providing regulated transmission services, excluding major capital projects.
Major projects are E&D projects with an expected value of more than $20 million. For the purposes of this ITP we also treat several large reconductoring projects as major capex, because they are large relative to our underlying level of capital expenditure and have high cost uncertainty, especially relating to associated access and tower strengthening work.
The chart below presents total base capex. The chart presents the value of assets we expect to commission within a year, rather than the amount we expect to spend in a year. Values are stated in 2014/15 prices.
Integrated Transmission Plan September 2015 23

PLANS
Figure 10: Base capital expenditure
Our 2013 ITP included a top-down adjustment of 7.5 per cent to reflect target savings for RCP2. Our 2015 ITP includes this adjustment, plus a further stretch target set by the Commerce Commission for ICT expenditure.
The chart above also presents the underlying expenditure profile that supports our 2015 ITP; our best view of the expected cost of our capital programme. The difference between the target profile and the underlying profile reflects the work we have ahead of us to reduce costs to meet our targets.
For reference, we also present the base capex allowance set by the Commerce Commission for the RCP2 period5. Each of the category forecast charts below also include an allowance line for reference. This refers to the proportion of the allowance that was set based on forecast expenditure in each category6.
7.2.1. GRID REFURBISHMENT AND REPLACEMENT (GRID R&R) More than 70 per cent of our forecast base capex for RCP2 relates to replacing existing grid assets, or refurbishing them to extend their useful life. Our Asset Management Plan sets out how we identify, prioritise and schedule grid R&R work.
5 The allowance is updated for the difference between forecast and actual movement to date in the consumer price index (CPI).
6 The Commerce Commission sets a total allowance only (i.e. there are no category allowances).
0
50
100
150
200
250
300
15/16 16/17 17/18 18/19 19/20 20/21 21/22 22/23 23/24 24/25
$ m Base capital expenditure
(Commissioned value, 14/15 prices)
2015 ITP 2015 ITP (underlying) 2013 ITP RCP2 Allowance
Integrated Transmission Plan September 2015 24
PLANS
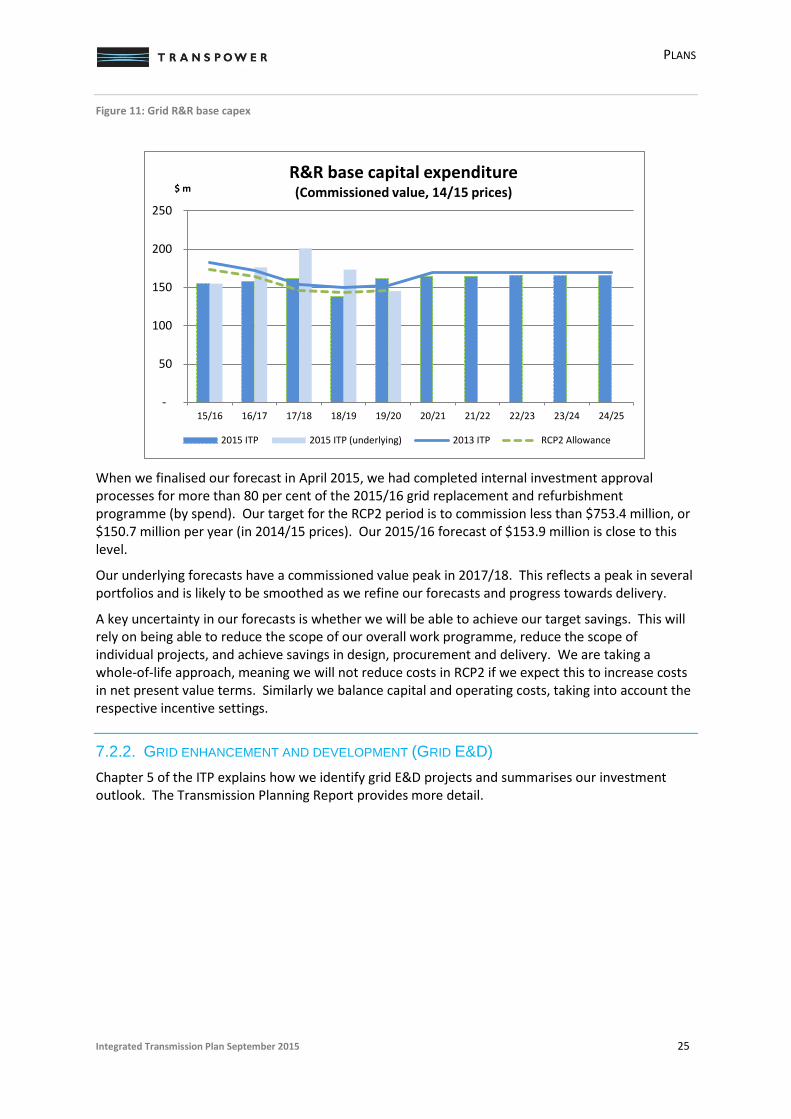
Figure 11: Grid R&R base capex
When we finalised our forecast in April 2015, we had completed internal investment approval processes for more than 80 per cent of the 2015/16 grid replacement and refurbishment programme (by spend). Our target for the RCP2 period is to commission less than $753.4 million, or $150.7 million per year (in 2014/15 prices). Our 2015/16 forecast of $153.9 million is close to this level.
Our underlying forecasts have a commissioned value peak in 2017/18. This reflects a peak in several portfolios and is likely to be smoothed as we refine our forecasts and progress towards delivery.
A key uncertainty in our forecasts is whether we will be able to achieve our target savings. This will rely on being able to reduce the scope of our overall work programme, reduce the scope of individual projects, and achieve savings in design, procurement and delivery. We are taking a whole-of-life approach, meaning we will not reduce costs in RCP2 if we expect this to increase costs in net present value terms. Similarly we balance capital and operating costs, taking into account the respective incentive settings.
7.2.2. GRID ENHANCEMENT AND DEVELOPMENT (GRID E&D) Chapter 5 of the ITP explains how we identify grid E&D projects and summarises our investment outlook. The Transmission Planning Report provides more detail.
-
50
100
150
200
250
15/16 16/17 17/18 18/19 19/20 20/21 21/22 22/23 23/24 24/25
$ m R&R base capital expenditure (Commissioned value, 14/15 prices)
2015 ITP 2015 ITP (underlying) 2013 ITP RCP2 Allowance
Integrated Transmission Plan September 2015 25

PLANS
Figure 12: Grid E&D base capex
During the RCP2 evaluation process we reduced our forecast for the RCP2 period from $124 million to $95 million (2012/13 prices), based on project-by-project evaluation. Subsequent to that process we continue to monitor investment need, review options and refine cost estimates.
7.2.3. INFORMATION AND COMMUNICATION TECHNOLOGY (ICT) ICT is our second largest investment category for the RCP2 period. This reflects both the extent of our ICT infrastructure and the comparatively short renewal cycles of ICT assets.
Figure 13: ICT base capex
0
10
20
30
40
50
60
15/16 16/17 17/18 18/19 19/20 20/21 21/22 22/23 23/24 24/25
$ m E&D base capital expenditure (Commissioned value, 14/15 prices)
2015 ITP 2015 ITP (underlying) 2013 ITP RCP2 Allowance
0
10
20
30
40
50
60
70
15/16 16/17 17/18 18/19 19/20 20/21 21/22 22/23 23/24 24/25
$ m ICT base capital expenditure (Commissioned value, 14/15 prices)
2015 ITP 2015 ITP (underlying) 2013 ITP RCP2 Allowance
Integrated Transmission Plan September 2015 26

PLANS
The 2013 ITP included commissioning a $15 million transmission pricing system towards the end of the RCP2 period. This was removed from the RCP2 allowance7 and we have removed this project from our current forecasts. The 2015 ITP includes a peak in 2020/21 relating to commissioning a $20 million upgrade of our SCADA (supervisory control and data acquisition) system. The first three years of RCP3 also include a more than $50 million renewal of our TransGO communications network.
7.2.4. BUSINESS SUPPORT Our business support category covers the balance of our capital expenditure, including items such as office buildings, office furniture and vehicles.
Figure 14: Business support capex
The main change since the 2013 ITP is deferral into 2017/18 of commissioning assets in our relocated Wellington head office. These include networking, office fit-out and office furniture assets.
7.3. OPERATING EXPENDITURE The ITP includes operating expenditure incurred in providing regulated transmission services, excluding pass-through costs and recoverable costs8 and system operator costs9.
7 The allowance was adjusted on the basis that this can be revisited when we have a clearer understanding of the timing and scope of any changes to our pricing systems. Changes are driven by a regulatory process that is outside our control.
8 Pass-through costs include Electricity Authority and Commerce Commission levies, and local government rates. Recoverable costs include instantaneous reserves availability charges and transmission alternatives costs (eg, using demand response to defer a major project).
9 We allocate costs to our system operator business where we can identify the costs as ‘avoidable’—ie, we would not incur the costs if we did not provide system operator services. This allocation methodology means that common costs are included in the ITP.
0
5
10
15
20
25
15/16 16/17 17/18 18/19 19/20 20/21 21/22 22/23 23/24 24/25
$ m Business support base capital expenditure
(Commissioned value, 14/15 prices)
2015 ITP 2015 ITP (underlying) 2013 ITP RCP2 Allowance
Integrated Transmission Plan September 2015 27

PLANS
Figure 15: Total opex (excluding pass-through costs and recoverable costs)
We are planning to hold operating costs below our allowance in 2015/16, and across the RCP2 period.
7.3.1. GRID MAINTENANCE The grid maintenance category covers direct maintenance expenditure, excluding Transpower staff costs.
Figure 16: Grid maintenance opex
The key uncertainty is whether we can achieve our targeted year-on-year savings in maintenance costs. This depends on the effectiveness of new contractual arrangements we have negotiated with our service providers, and on changes to the scope and cost of work as we refine our RCP2 programme.
0
50
100
150
200
250
300
350
15/16 16/17 17/18 18/19 19/20 20/21 21/22 22/23 23/24 24/25
$ m Operating expenditure
(14/15 prices)
2015 ITP 2013 ITP RCP2 Allowance
0
20
40
60
80
100
120
15/16 16/17 17/18 18/19 19/20 20/21 21/22 22/23 23/24 24/25
$ m Grid maintenance operating expenditure
(14/15 prices)
2015 ITP 2013 ITP RCP2 Allowance
Integrated Transmission Plan September 2015 28

PLANS
7.3.2. ICT ICT operating expenditure includes telecommunications and equipment leases, outsourced support and maintenance fees, software licences, and other non-corporate ICT costs.
Figure 17: ICT opex
We have been able to reduce our ICT operating costs. We have achieved a $3 million per annum reduction in lease costs through contract renegotiation and rationalisation. We have also been able to realise lower data centre costs than anticipated.
Key uncertainties that will affect future operating costs are:
• migration of data to cloud services; this could lead to increased subscription-type costs, but reduced capital costs
• renegotiation of fibre leases.
The 2015 ITP includes a step-up in ICT opex over the first three years of RCP3 to reflect phased migration to cloud services.
7.3.3. CORPORATE Corporate operating expenditure includes Transpower staff, contractor and consultant costs, engineering investigation costs, insurance, travel, accommodation, ancillary services and development of demand response capability.
0
10
20
30
40
50
60
15/16 16/17 17/18 18/19 19/20 20/21 21/22 22/23 23/24 24/25
$ m ICT operating expenditure
(14/15 prices)
2015 ITP 2013 ITP RCP2 Allowance
Integrated Transmission Plan September 2015 29
PLANS
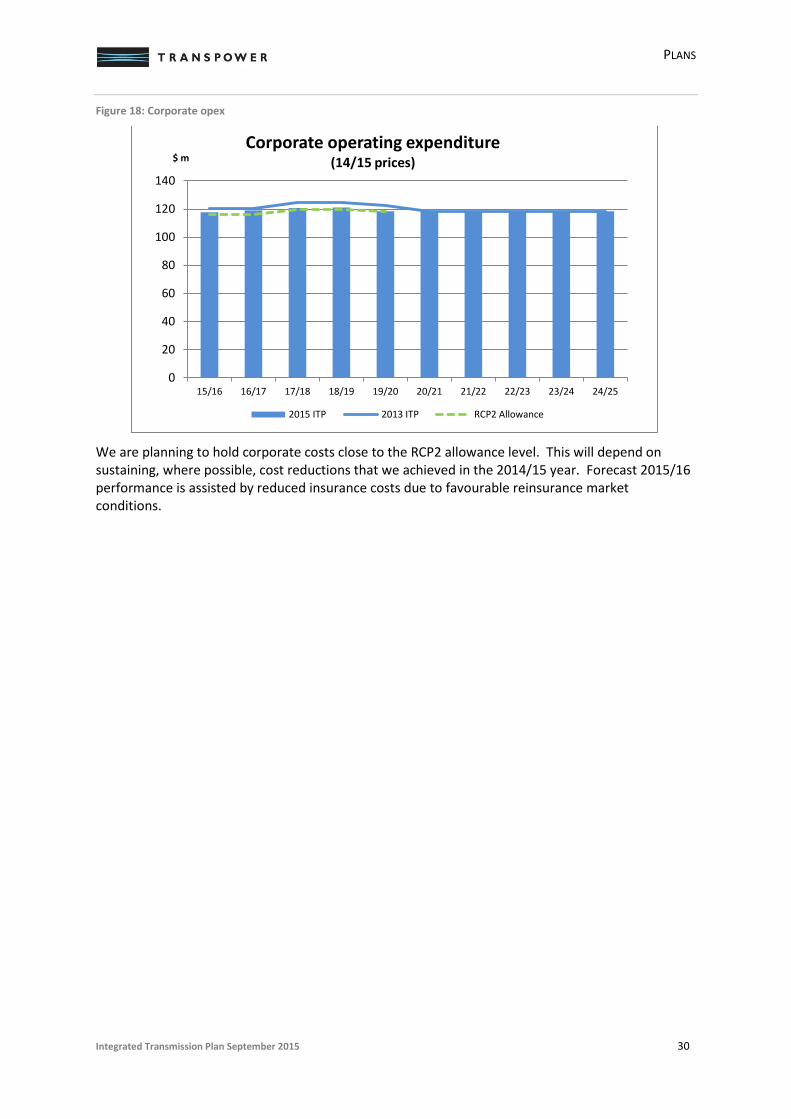
Figure 18: Corporate opex
We are planning to hold corporate costs close to the RCP2 allowance level. This will depend on sustaining, where possible, cost reductions that we achieved in the 2014/15 year. Forecast 2015/16 performance is assisted by reduced insurance costs due to favourable reinsurance market conditions.
0
20
40
60
80
100
120
140
15/16 16/17 17/18 18/19 19/20 20/21 21/22 22/23 23/24 24/25
$ m Corporate operating expenditure
(14/15 prices)
2015 ITP 2013 ITP RCP2 Allowance
Integrated Transmission Plan September 2015 30